
Modeling of the Influence of Input AM Parameters on Dimensional Error and Form Errors in PLA Parts Printed with FFF Technology


Abstract
:
1. Introduction
2. Materials and Methods
2.1. Printing Process
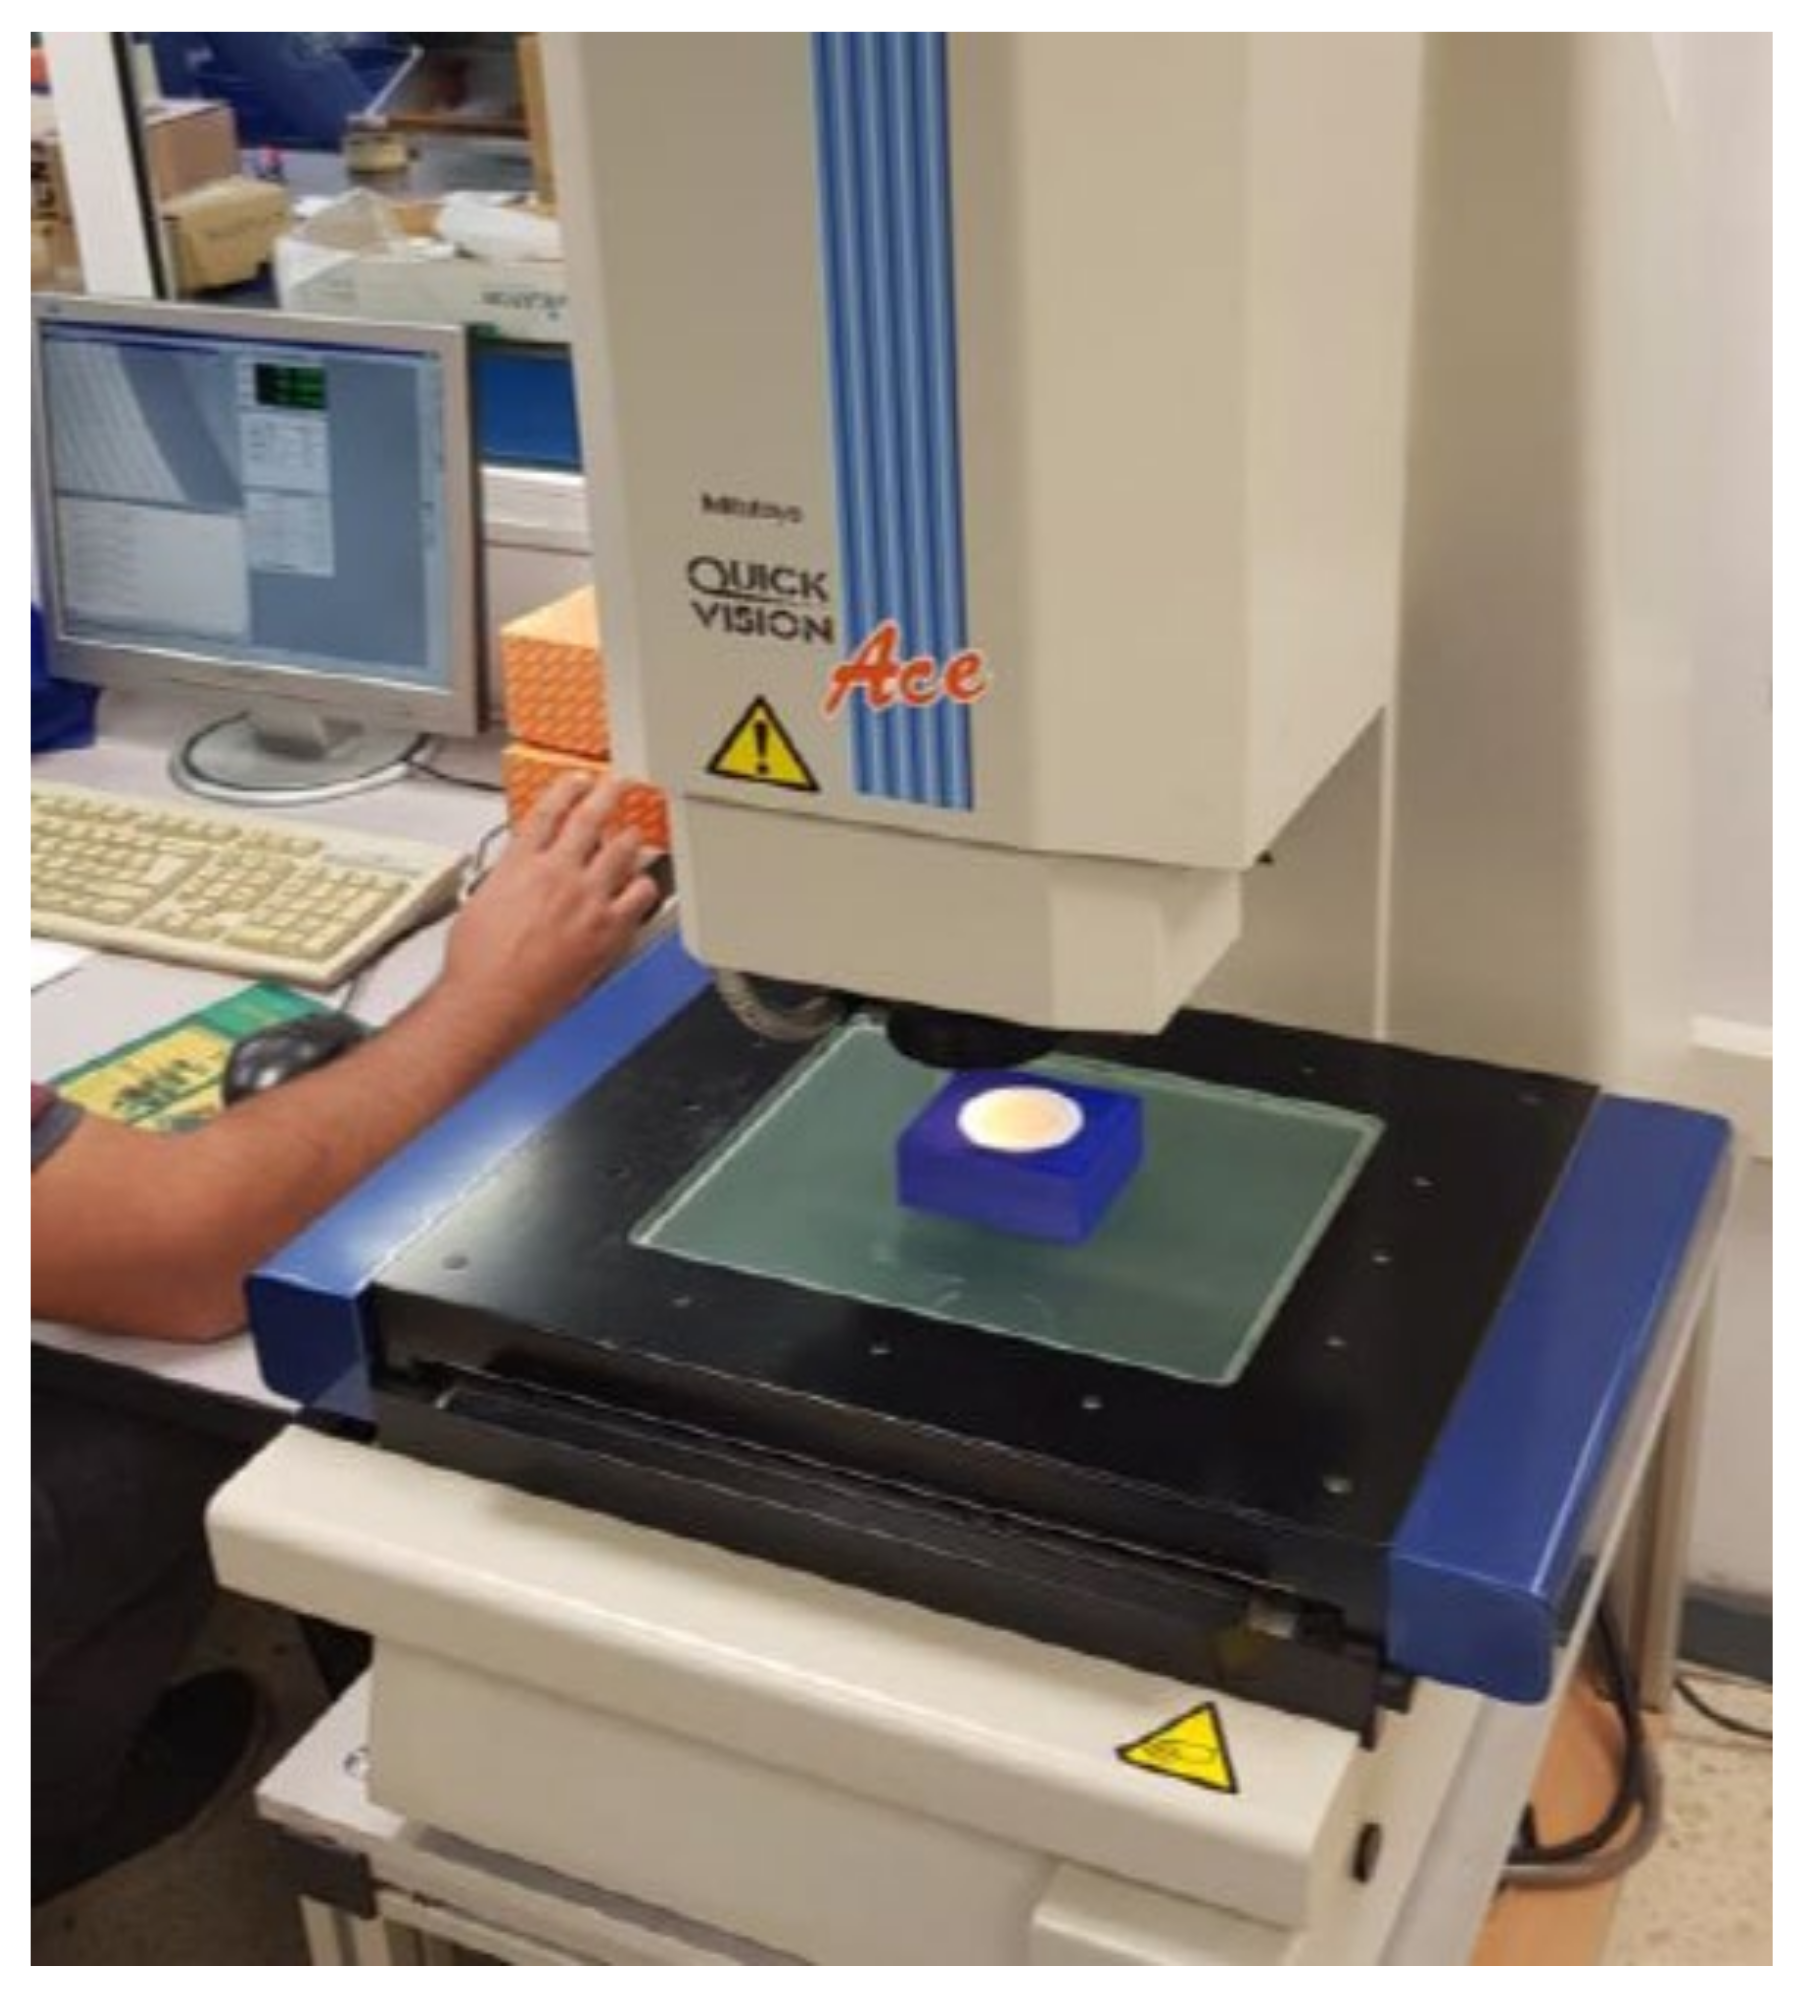
2.2. Determination of the Dimensional Error
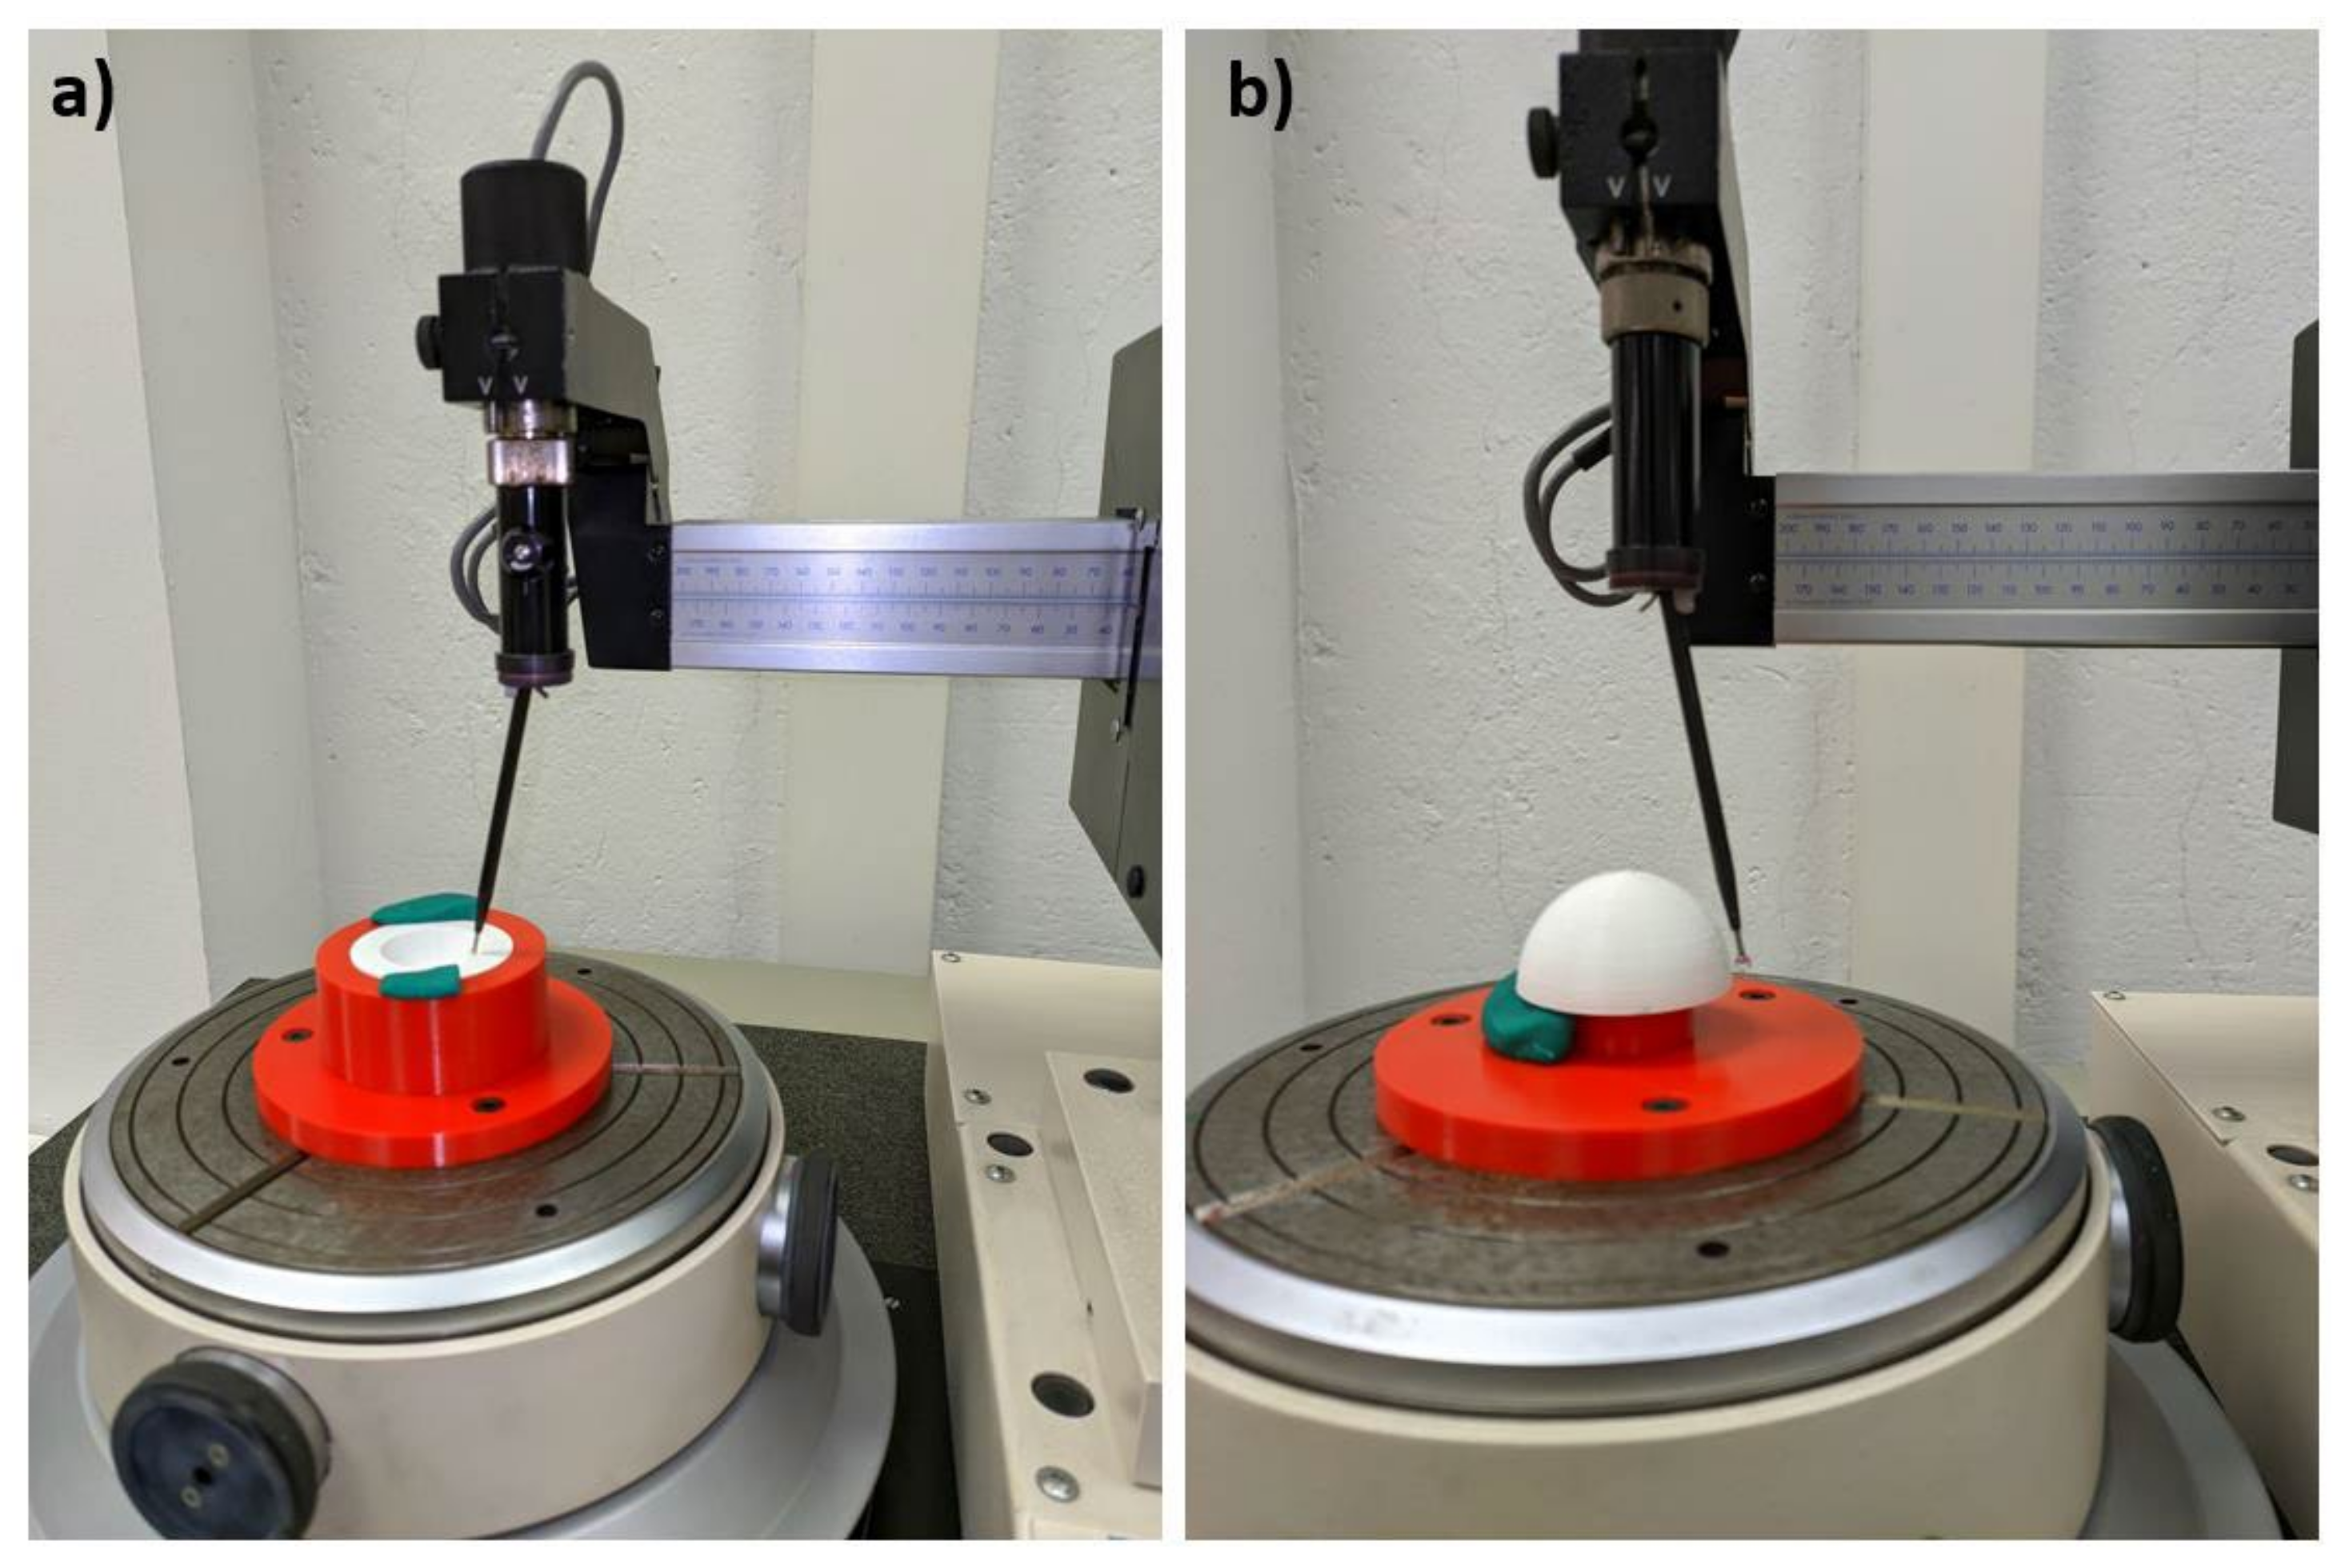
2.3. Determinación of Roundness
2.4. Determination of the Concentricity
2.5. ANFIS Modellin
3. Results and Discussion
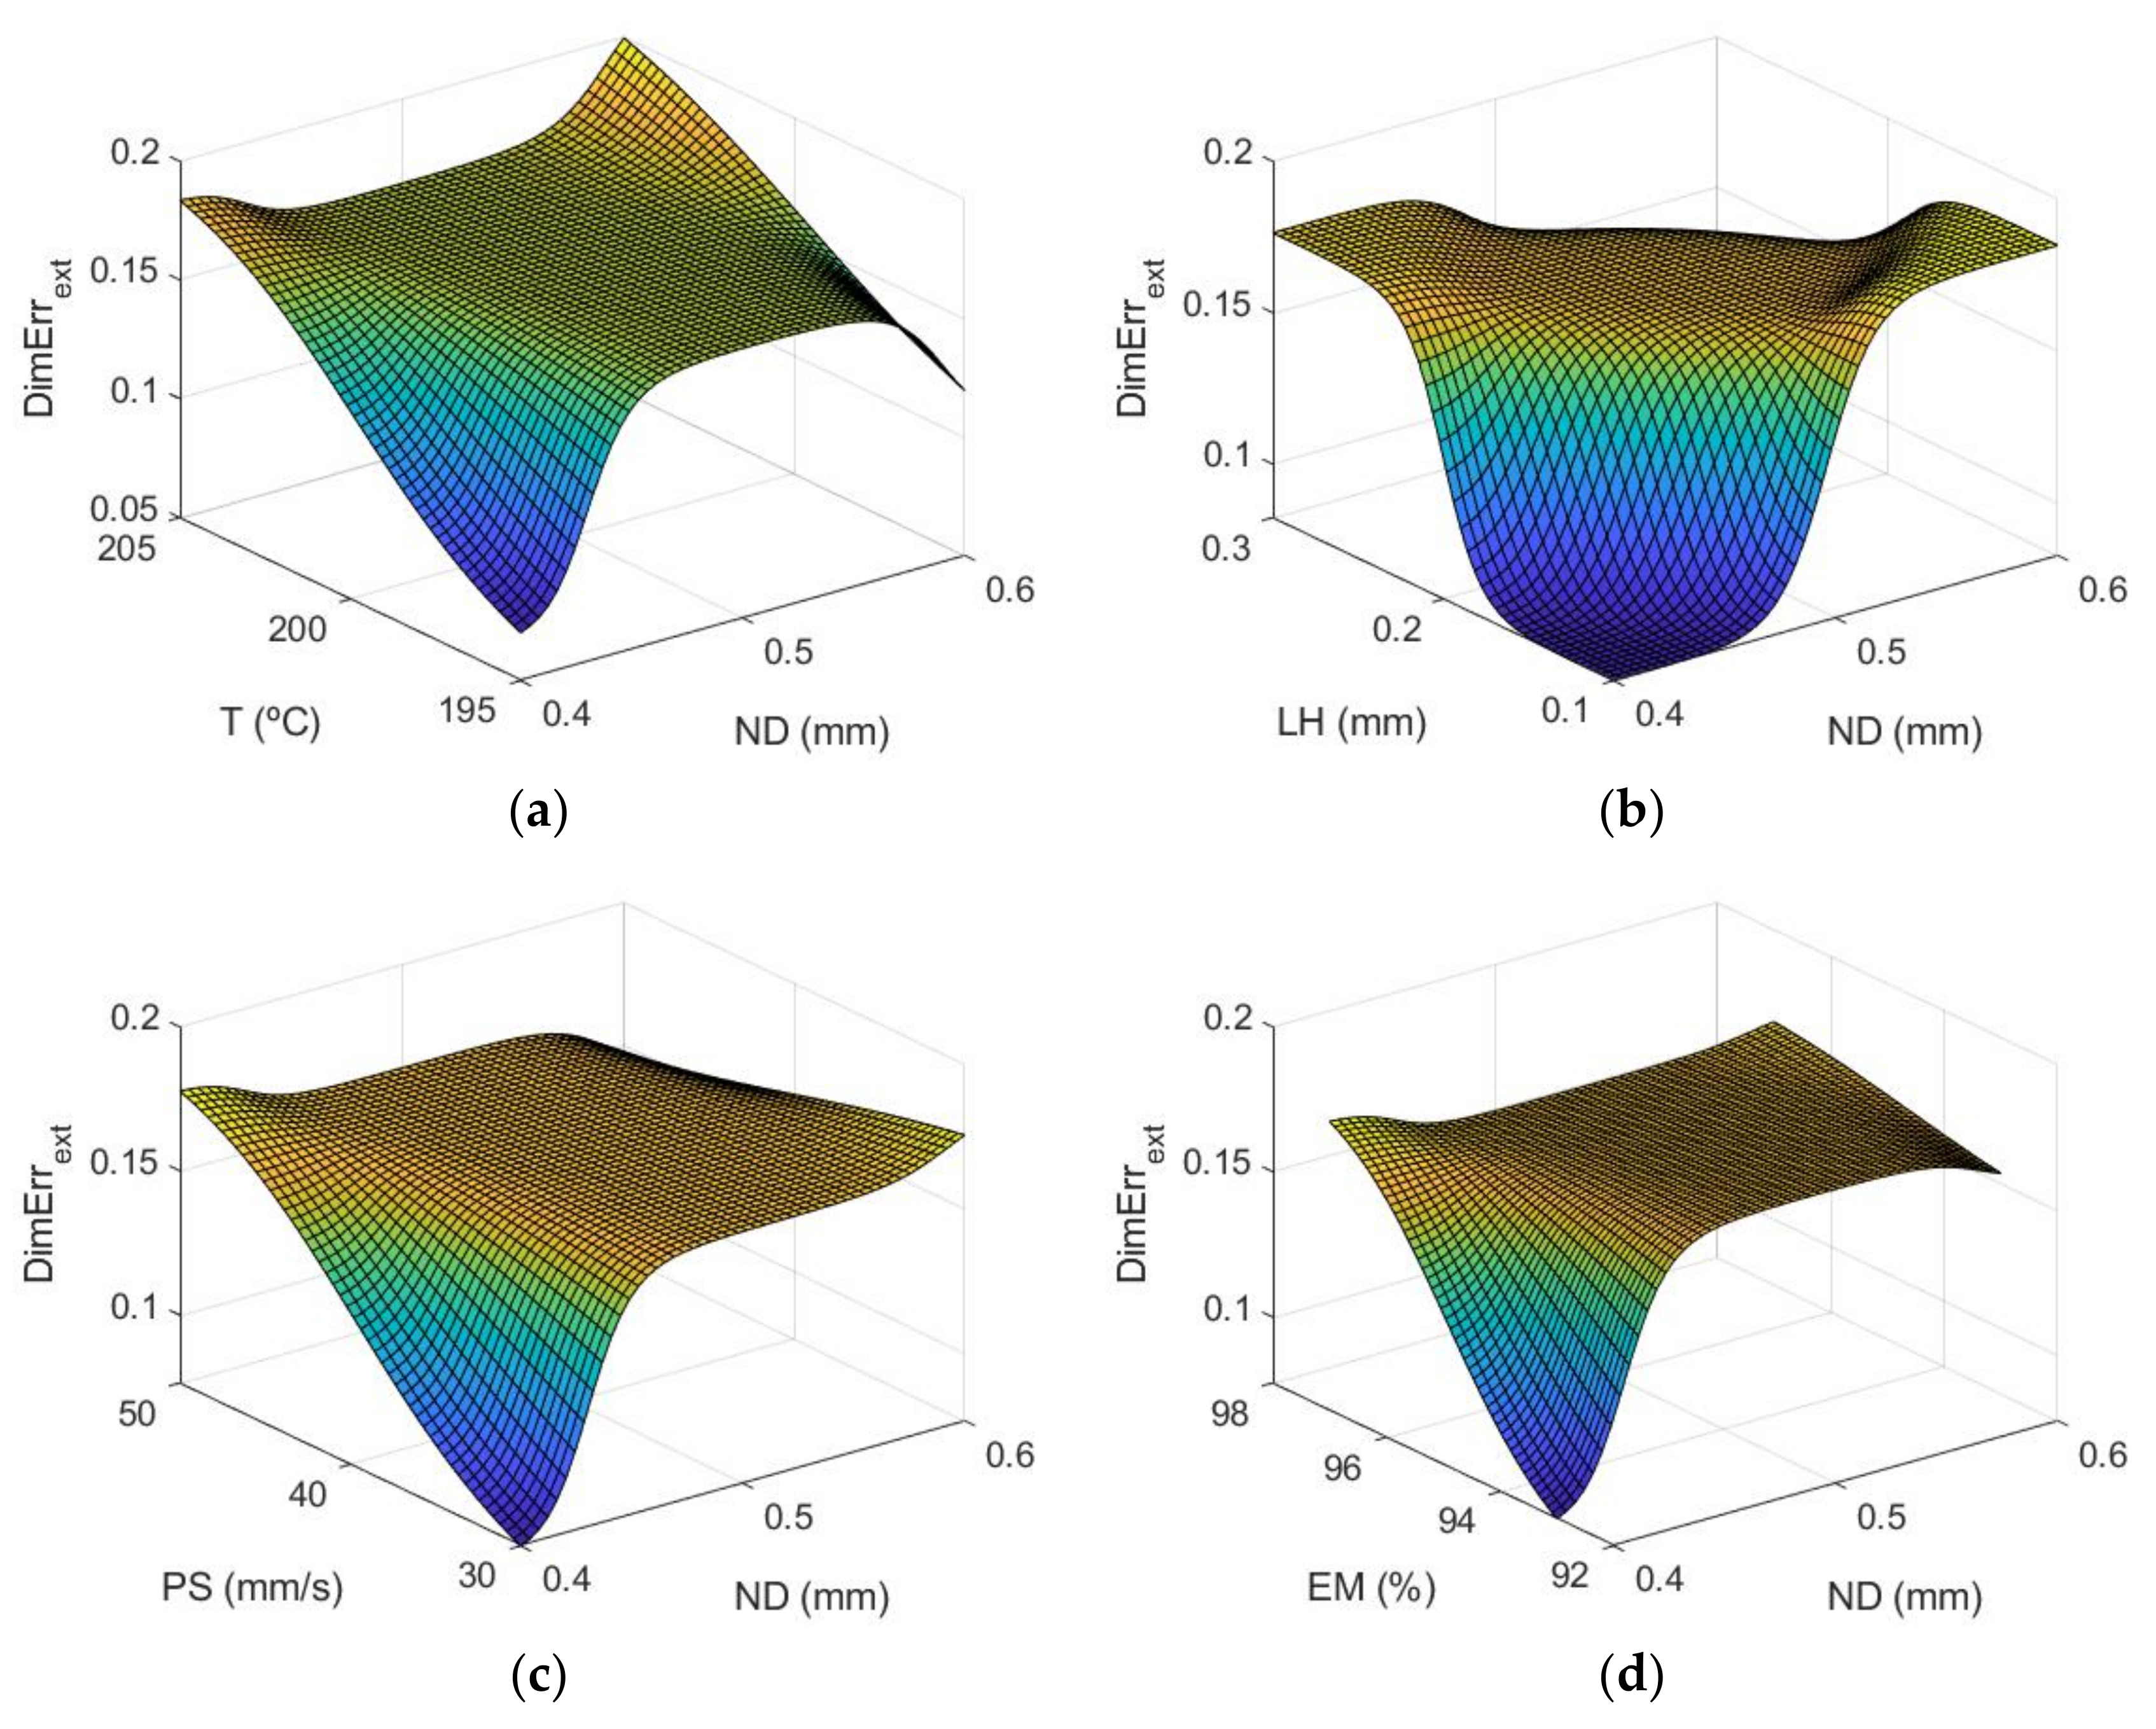
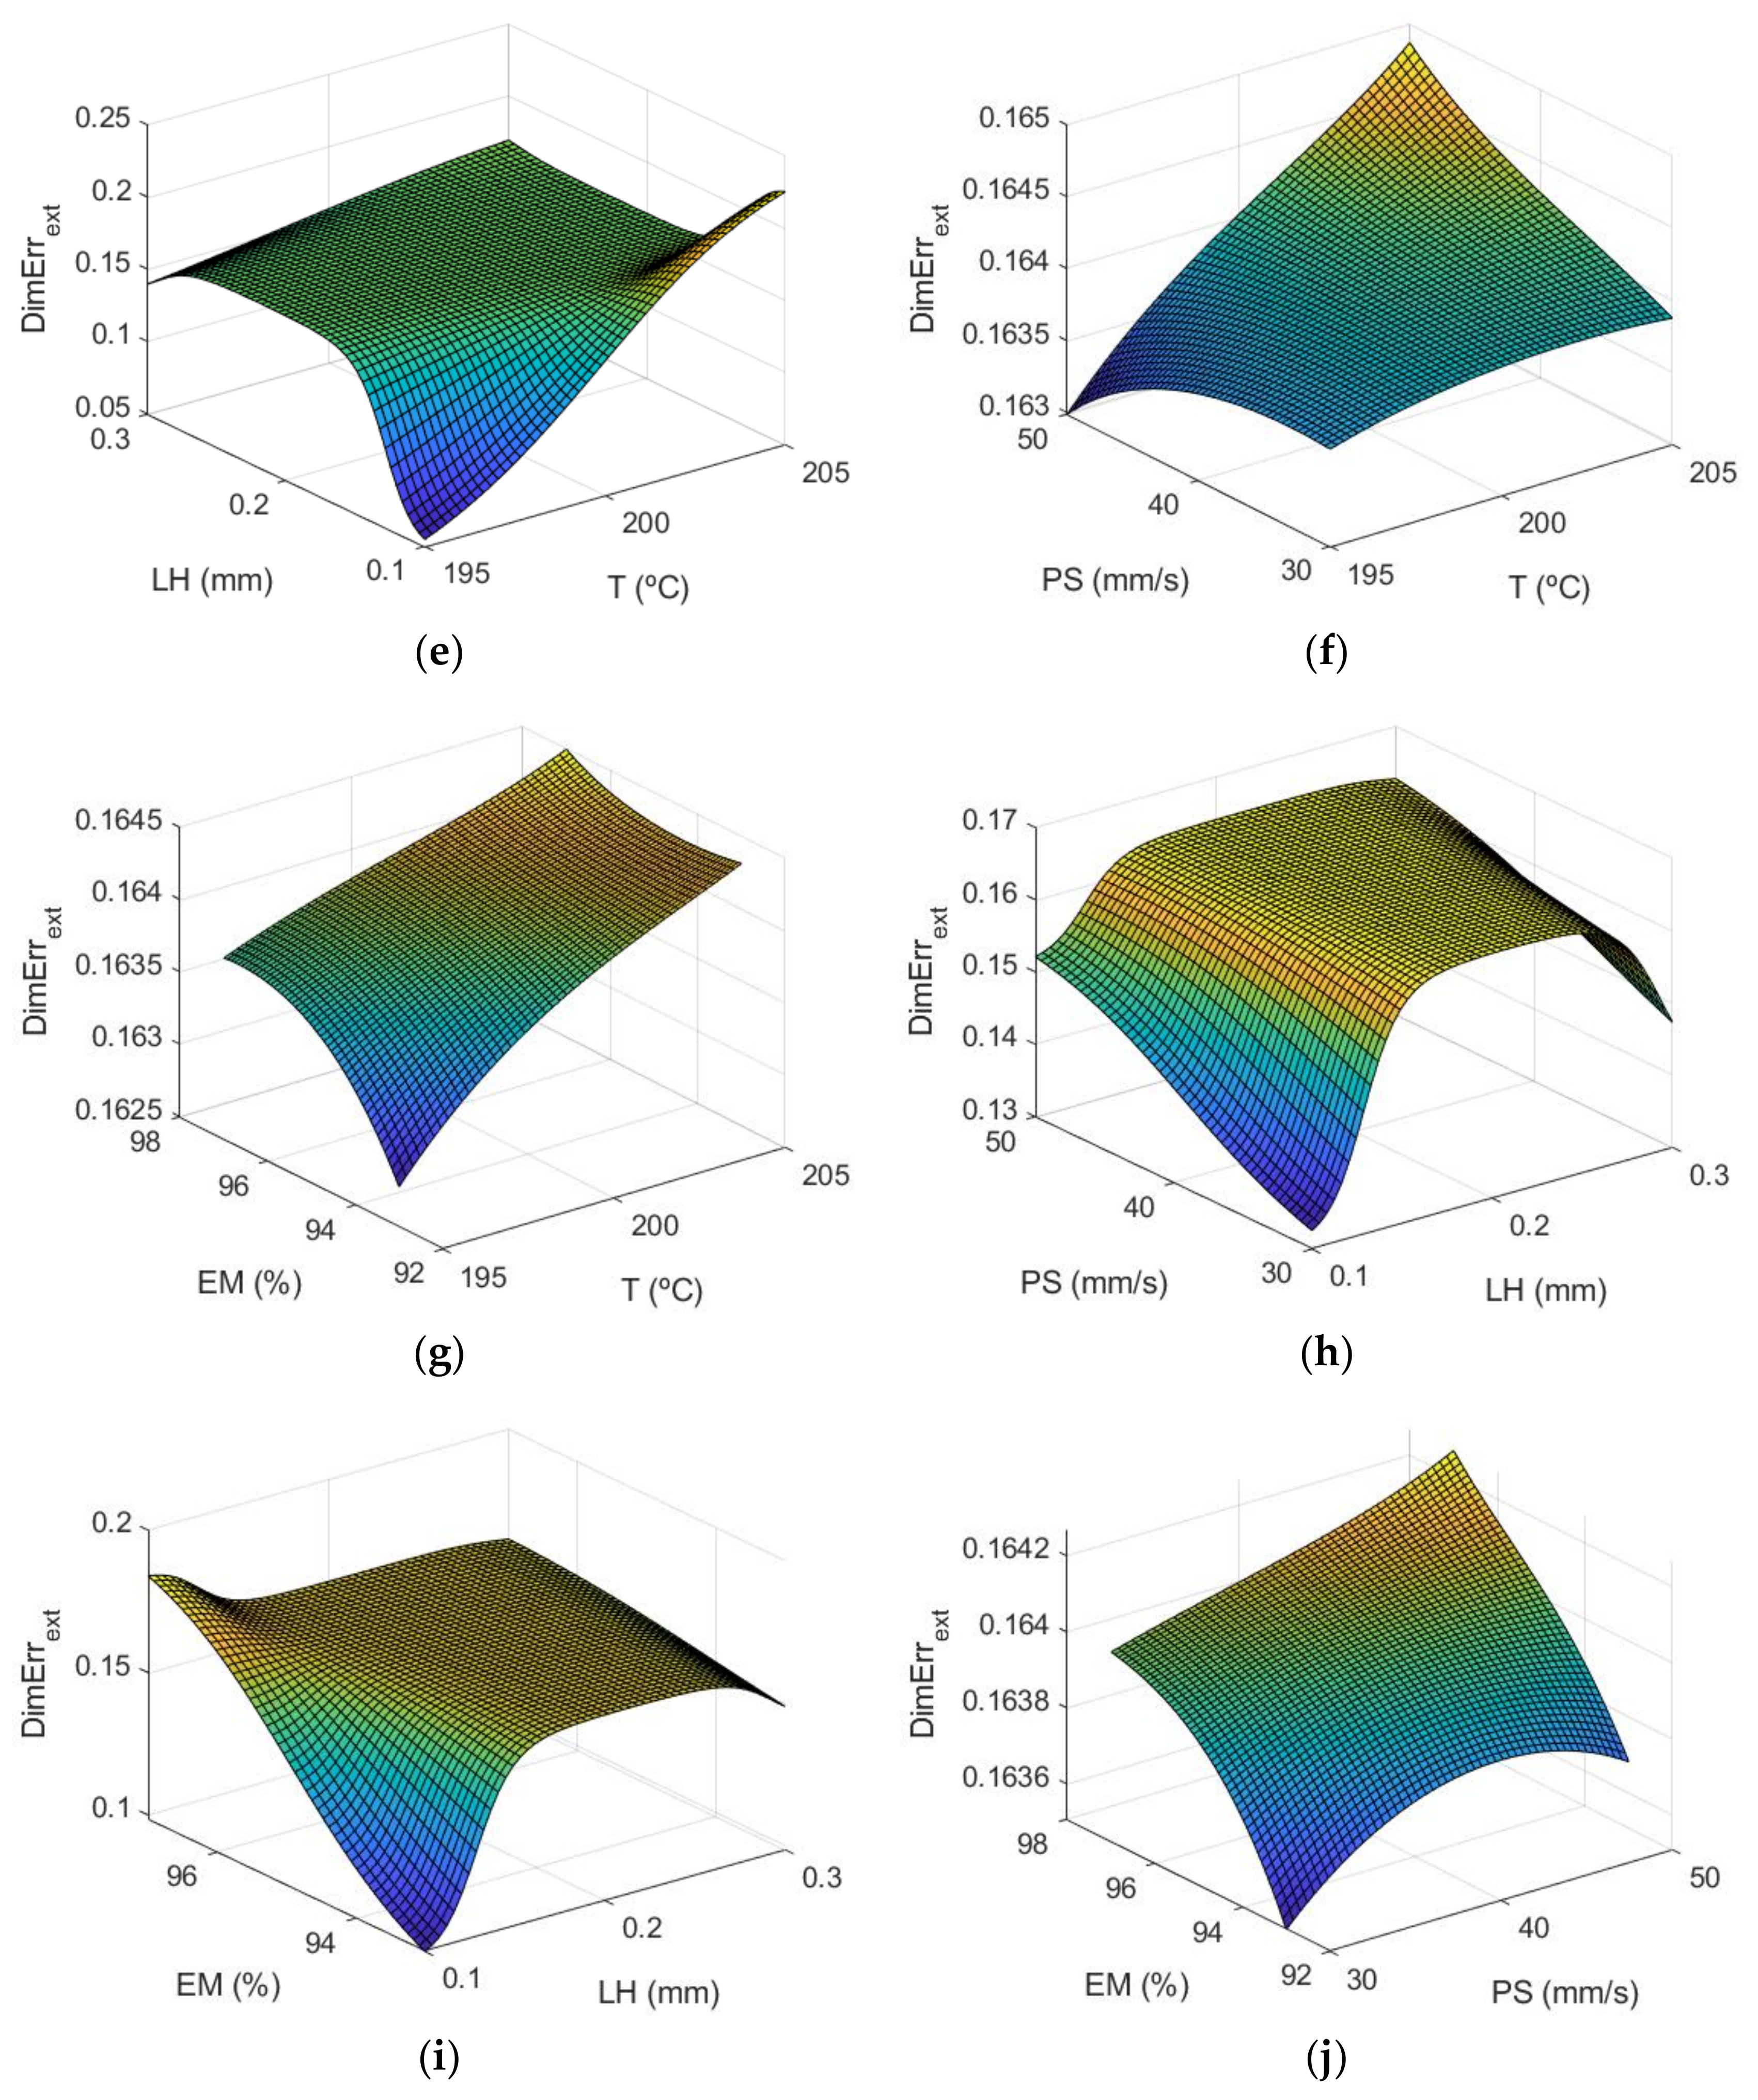
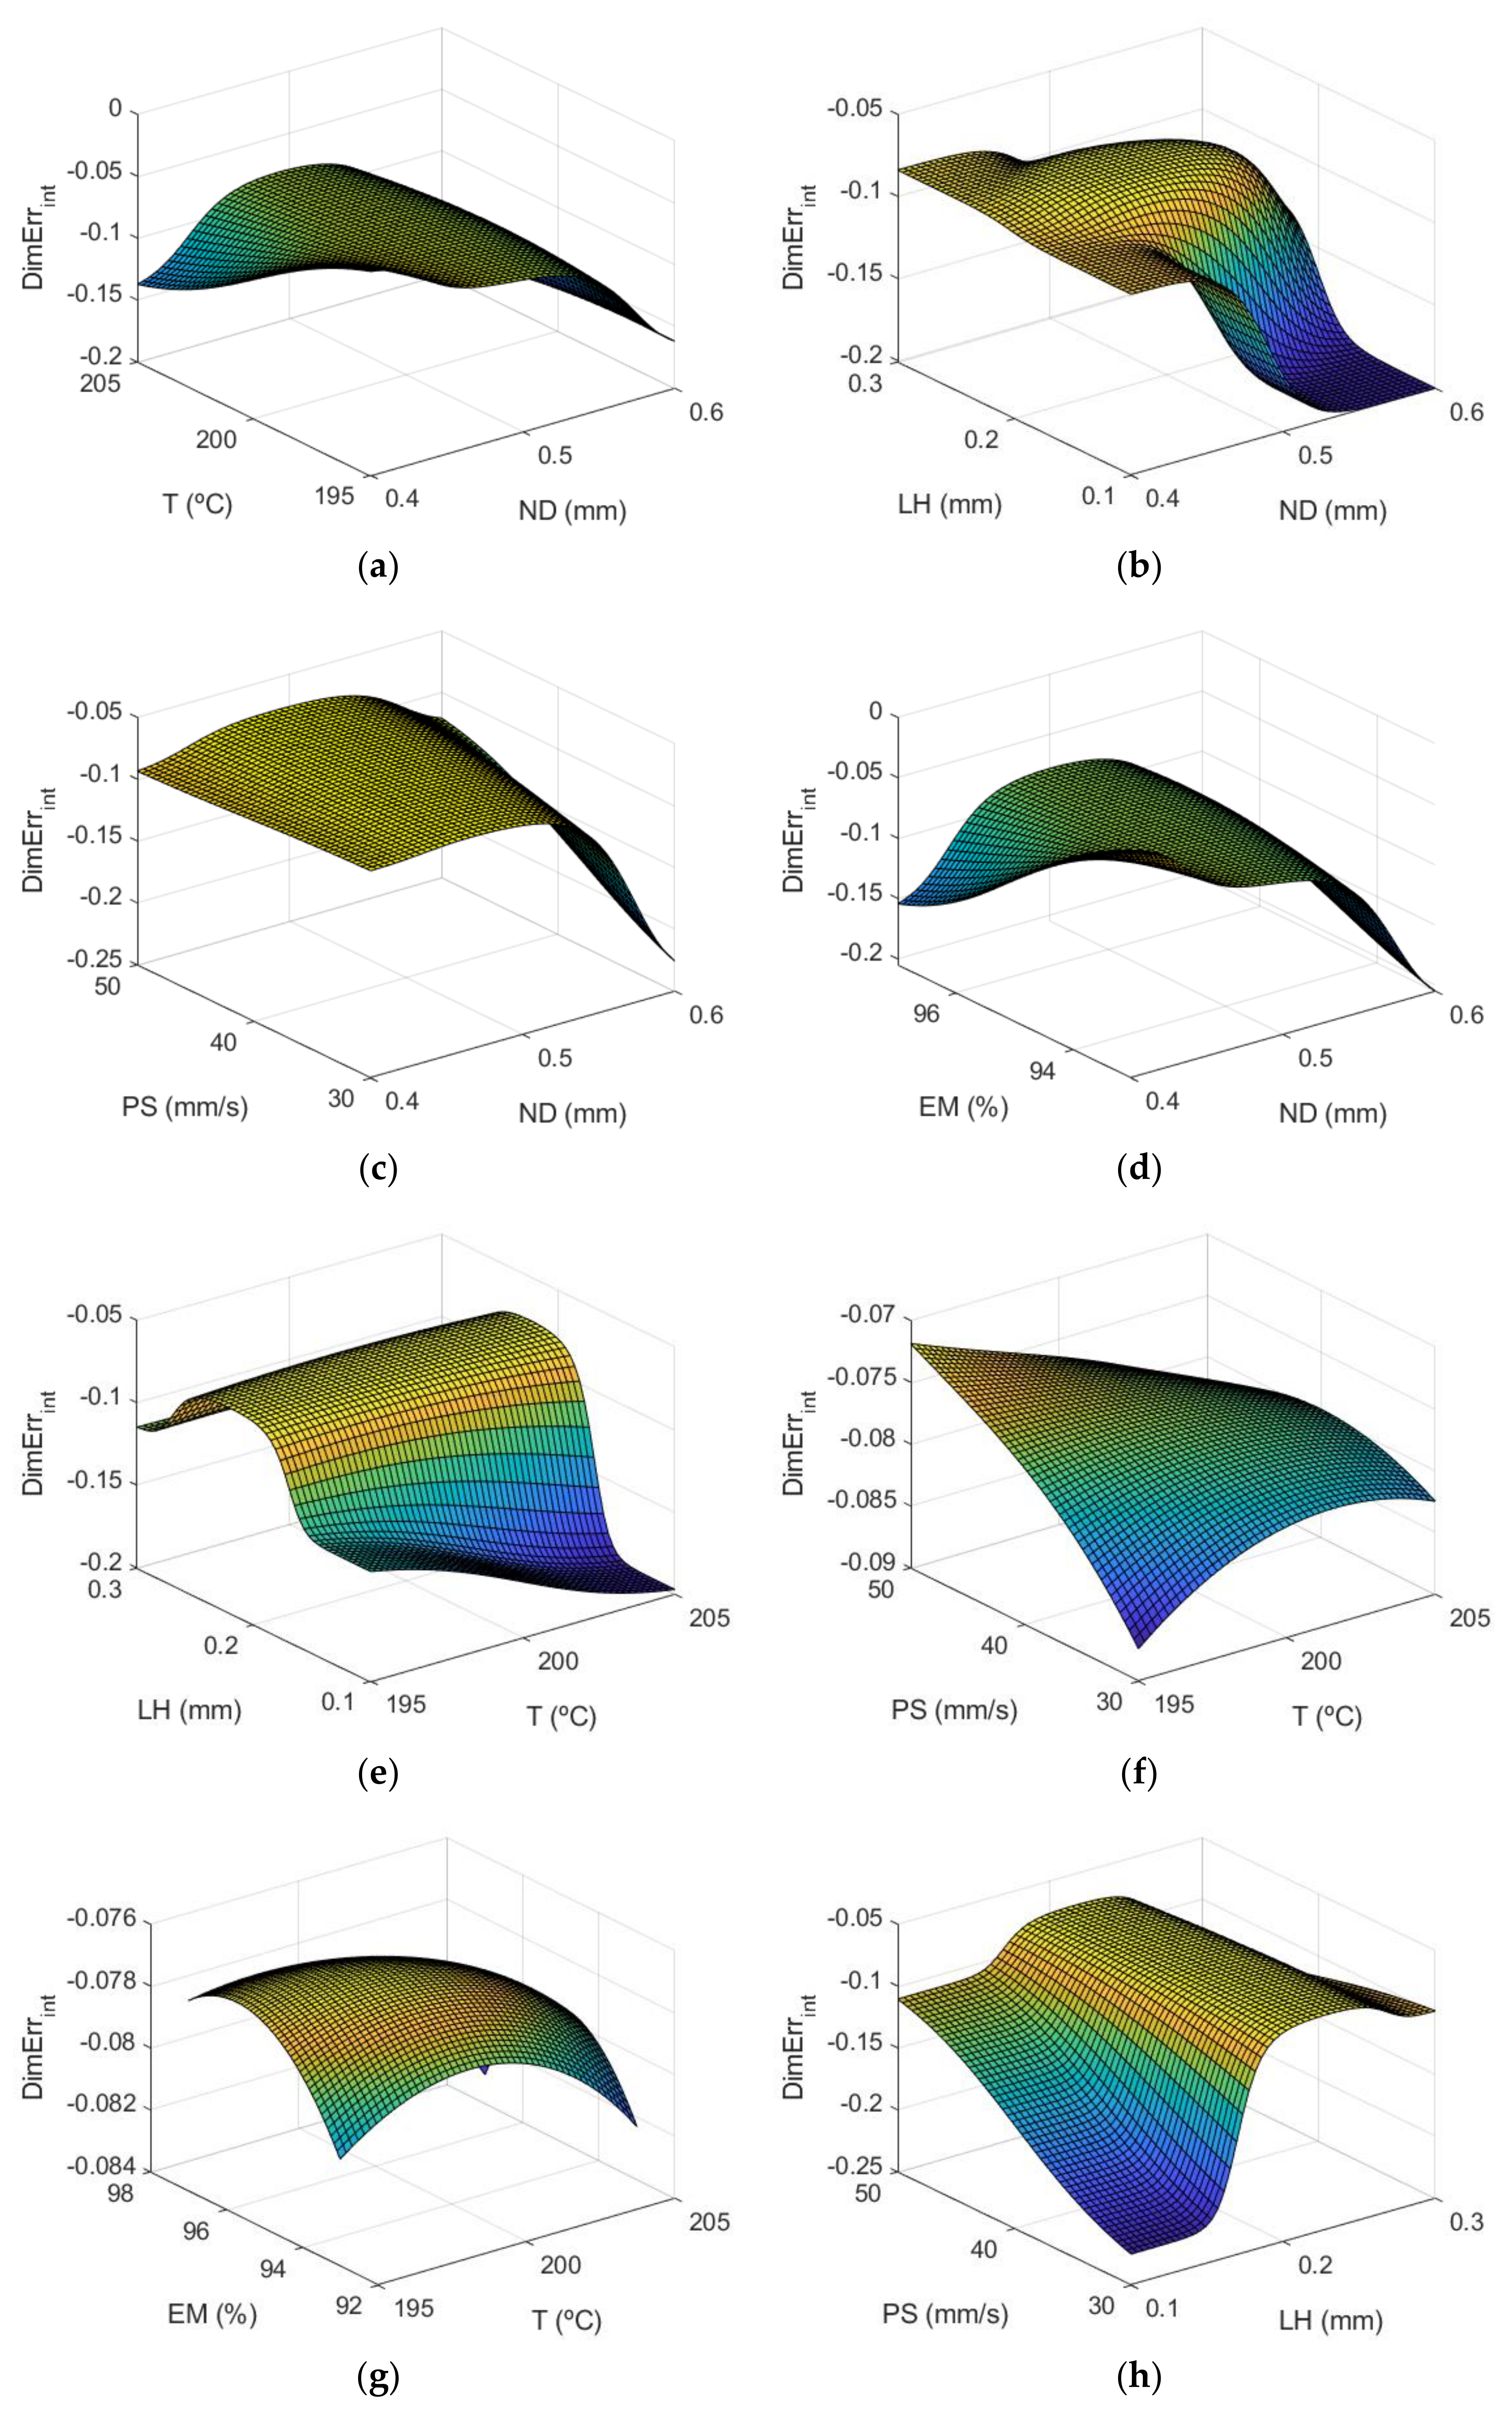
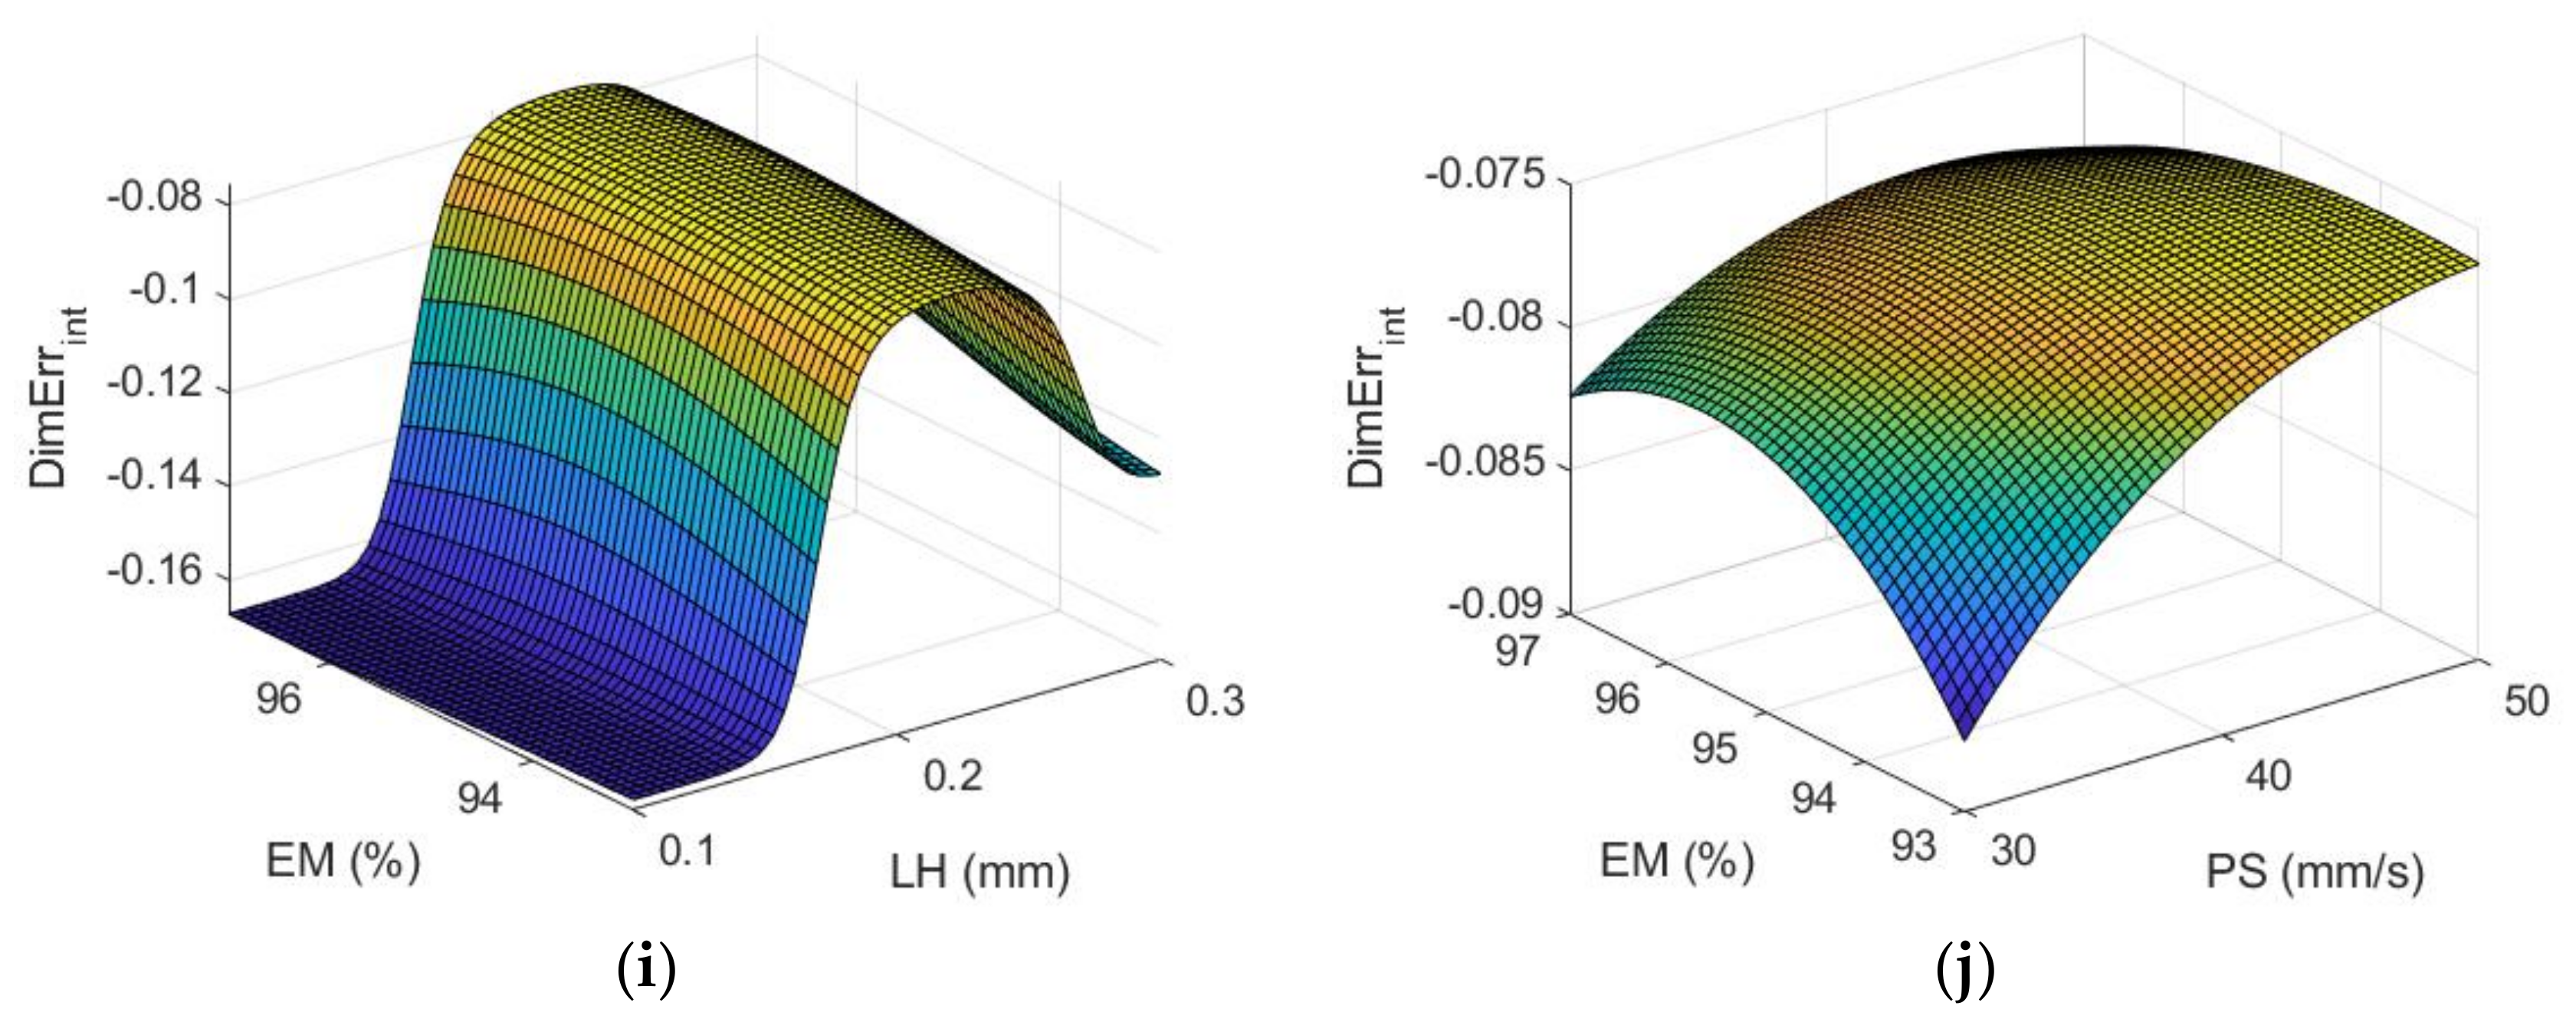
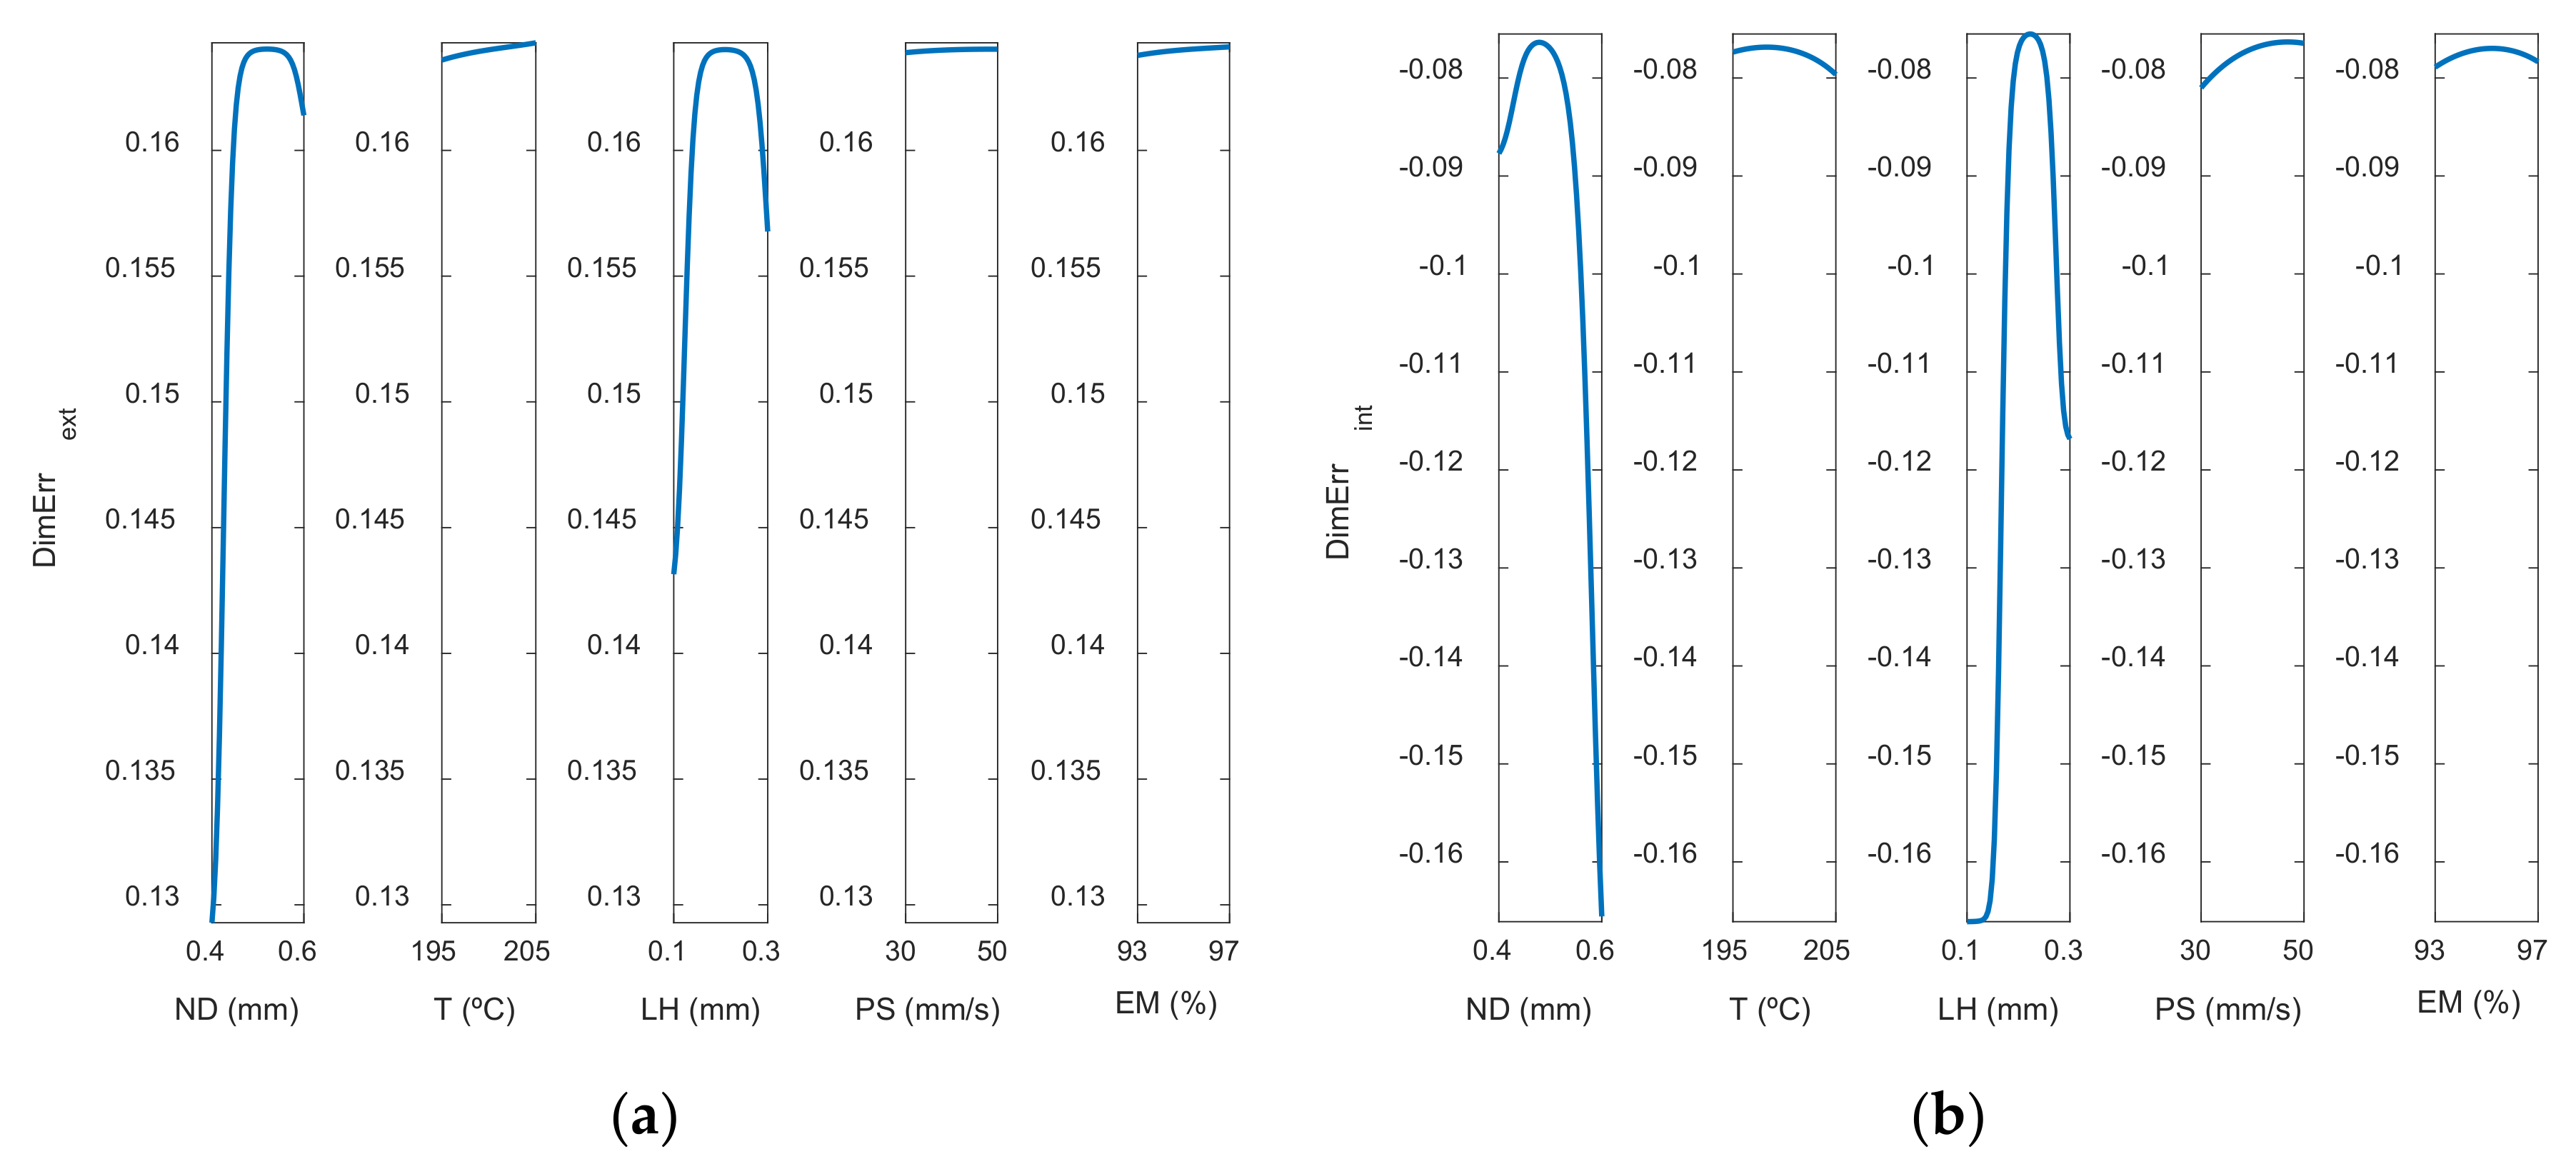
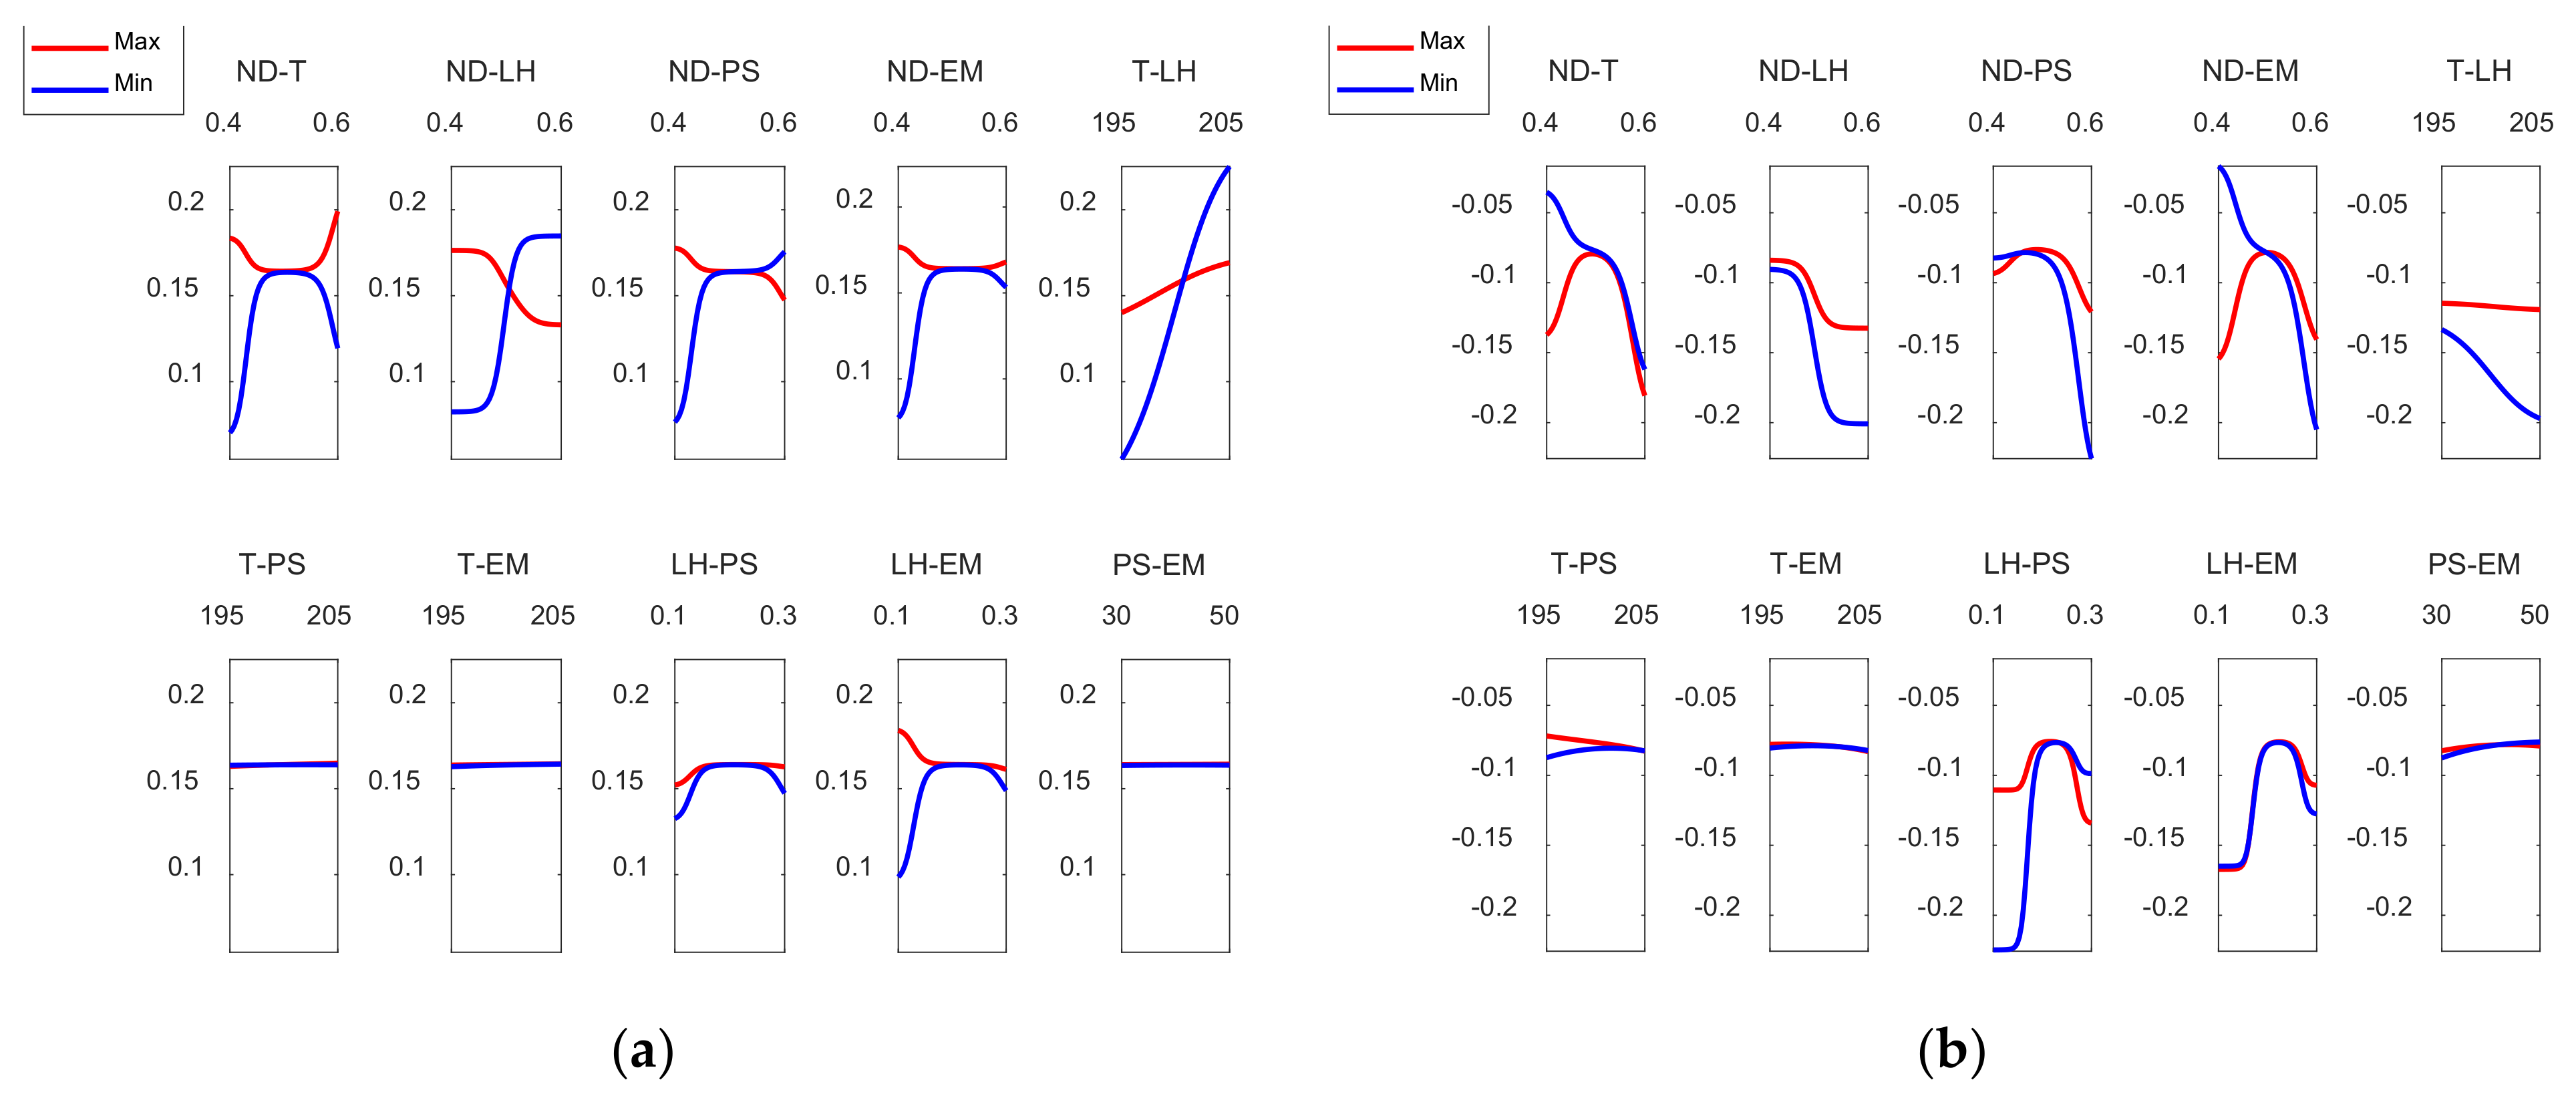
3.1. Models for Dimensional Error
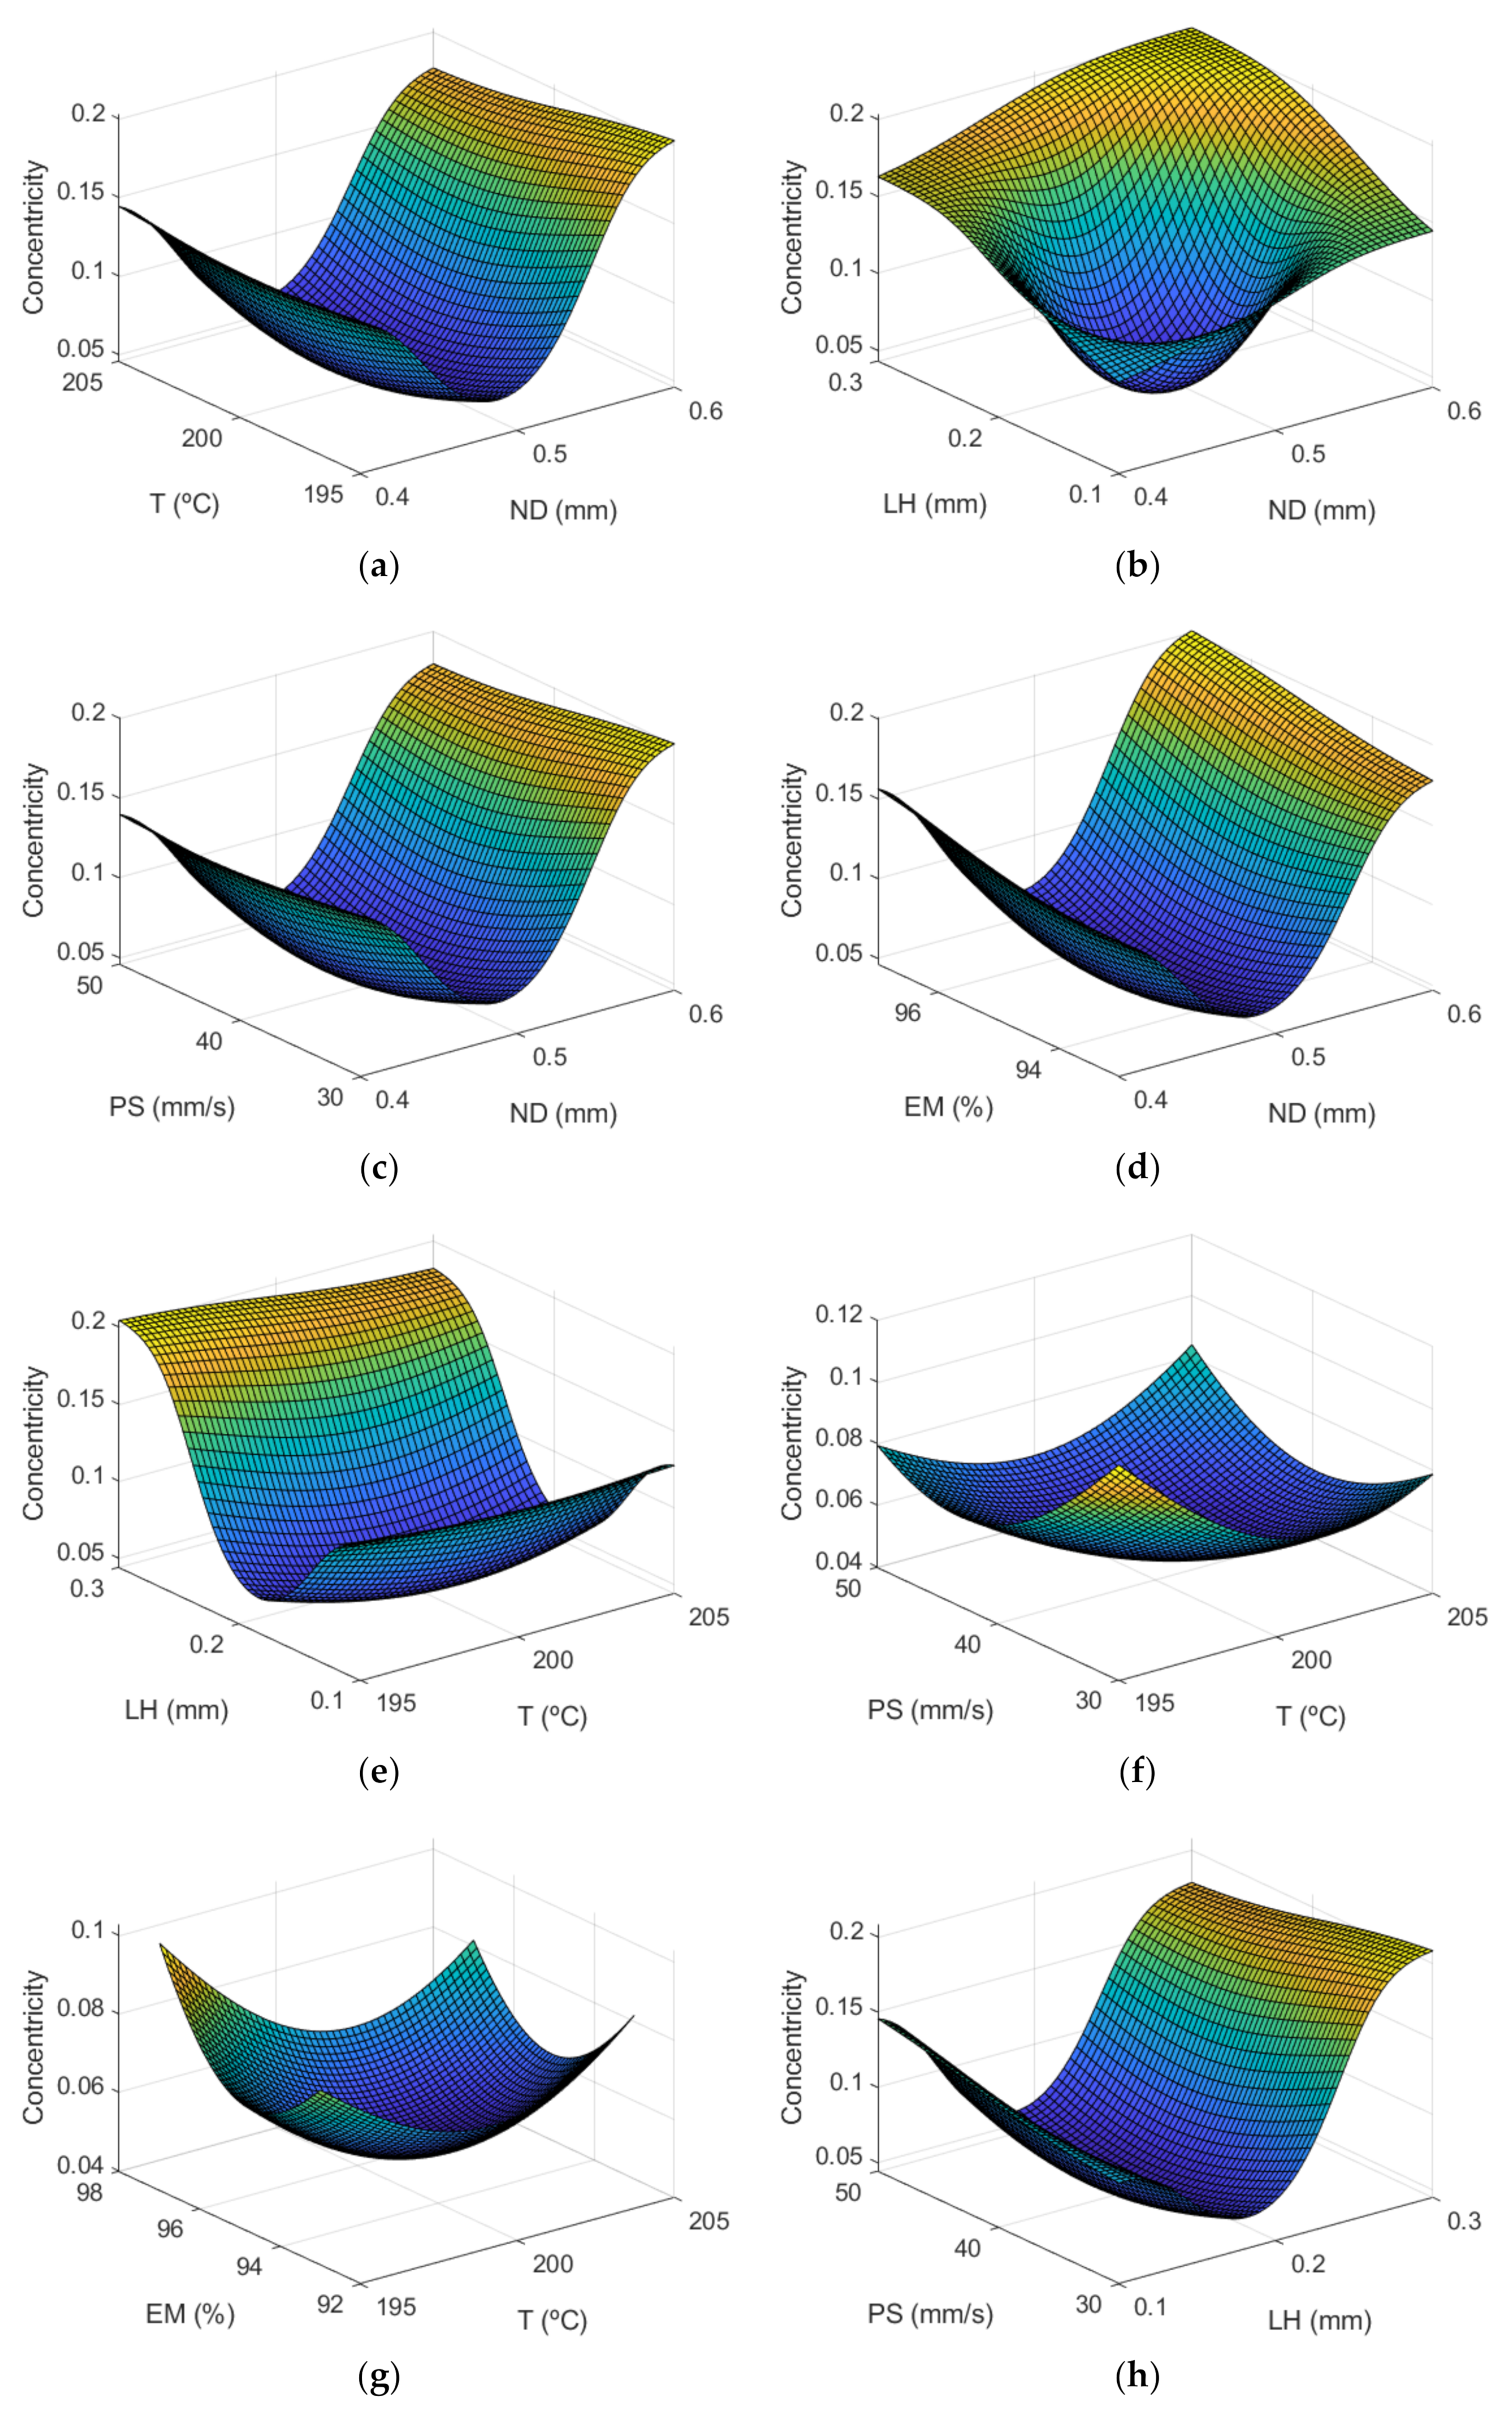
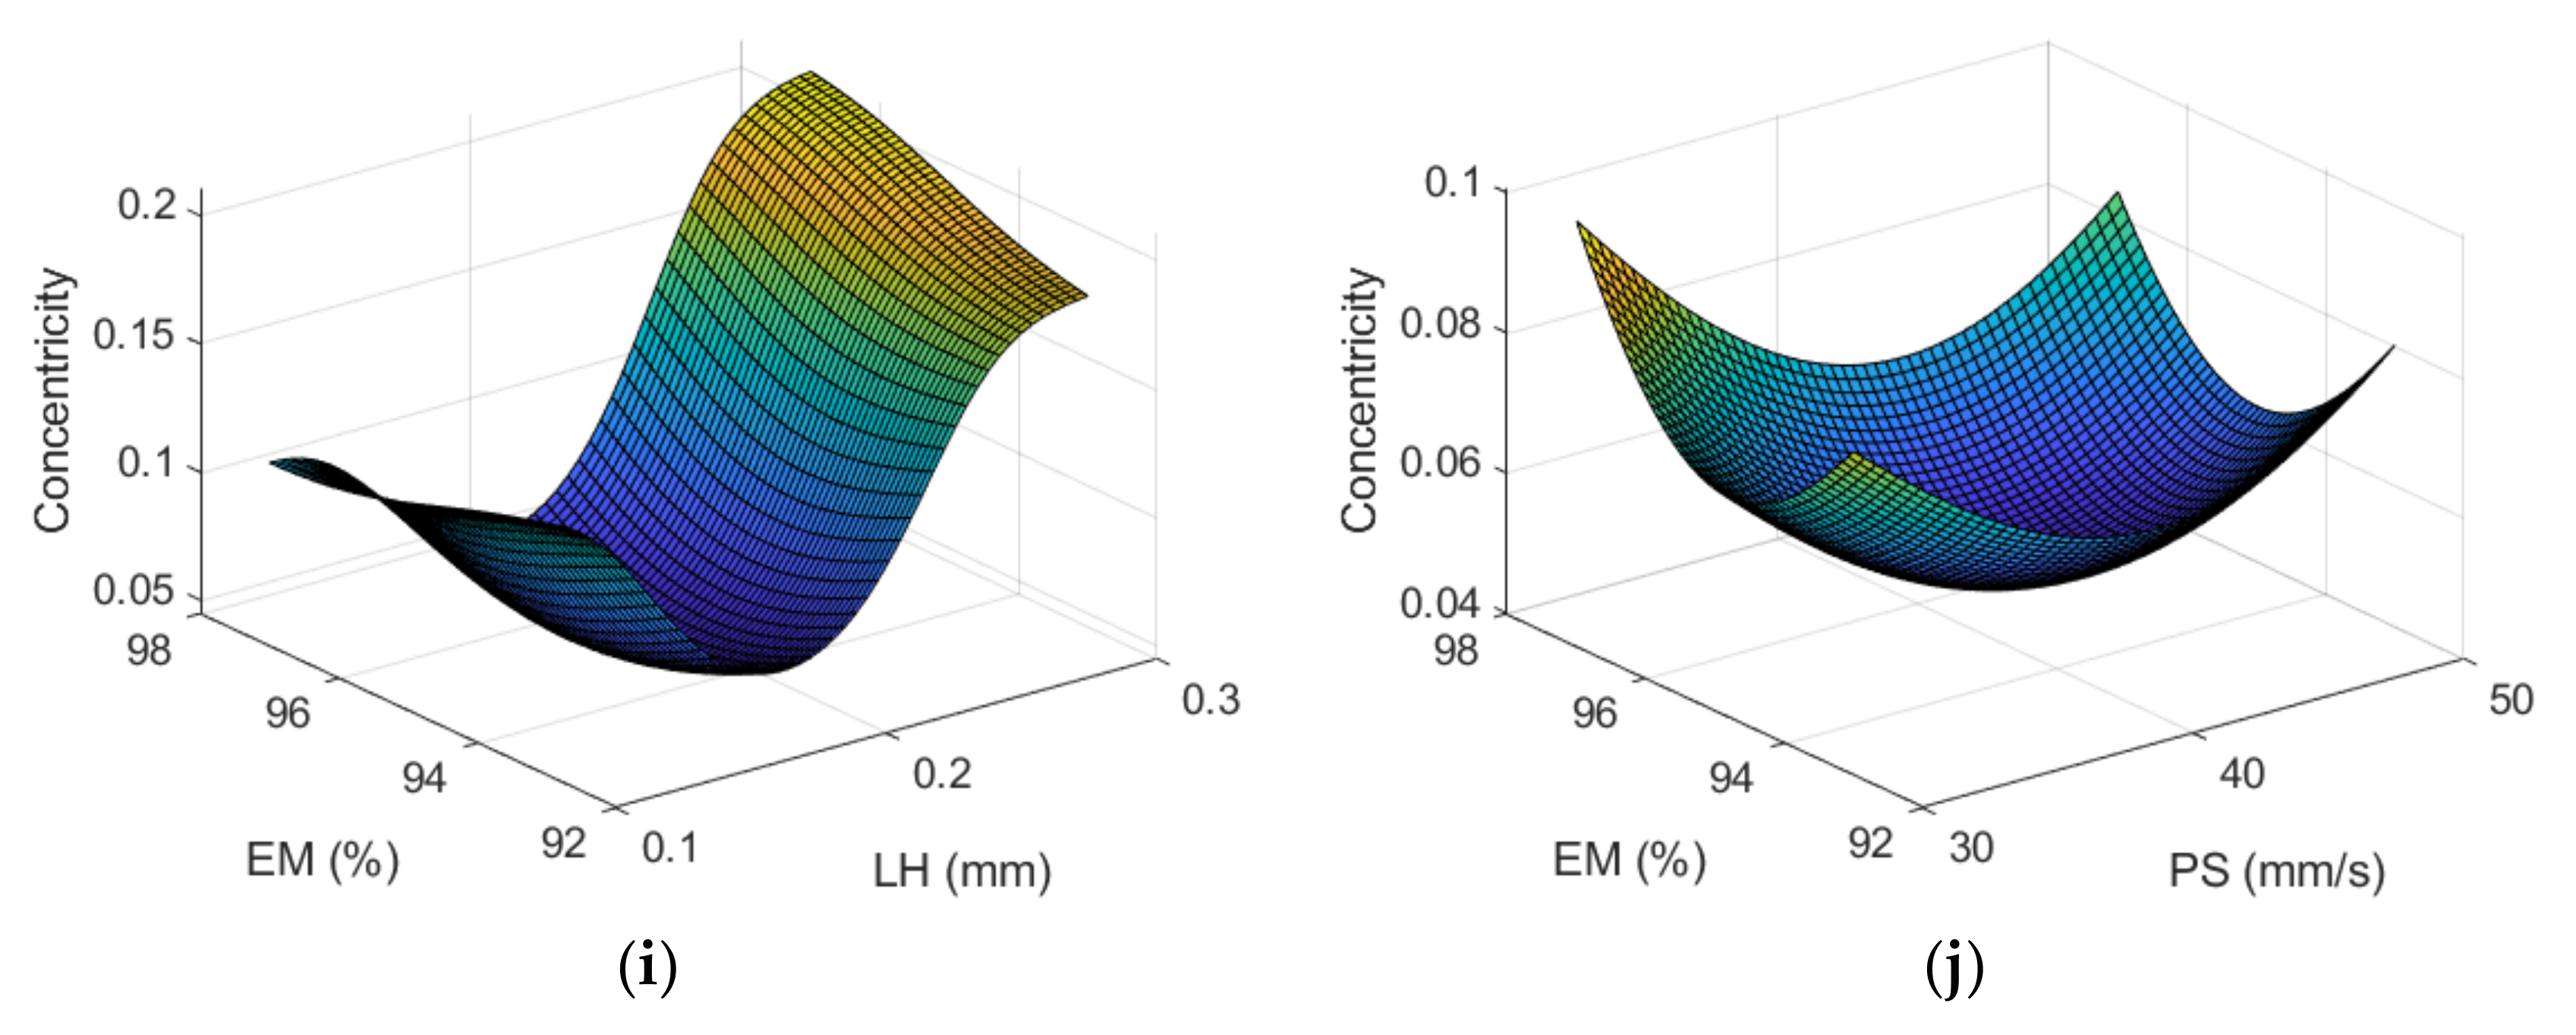
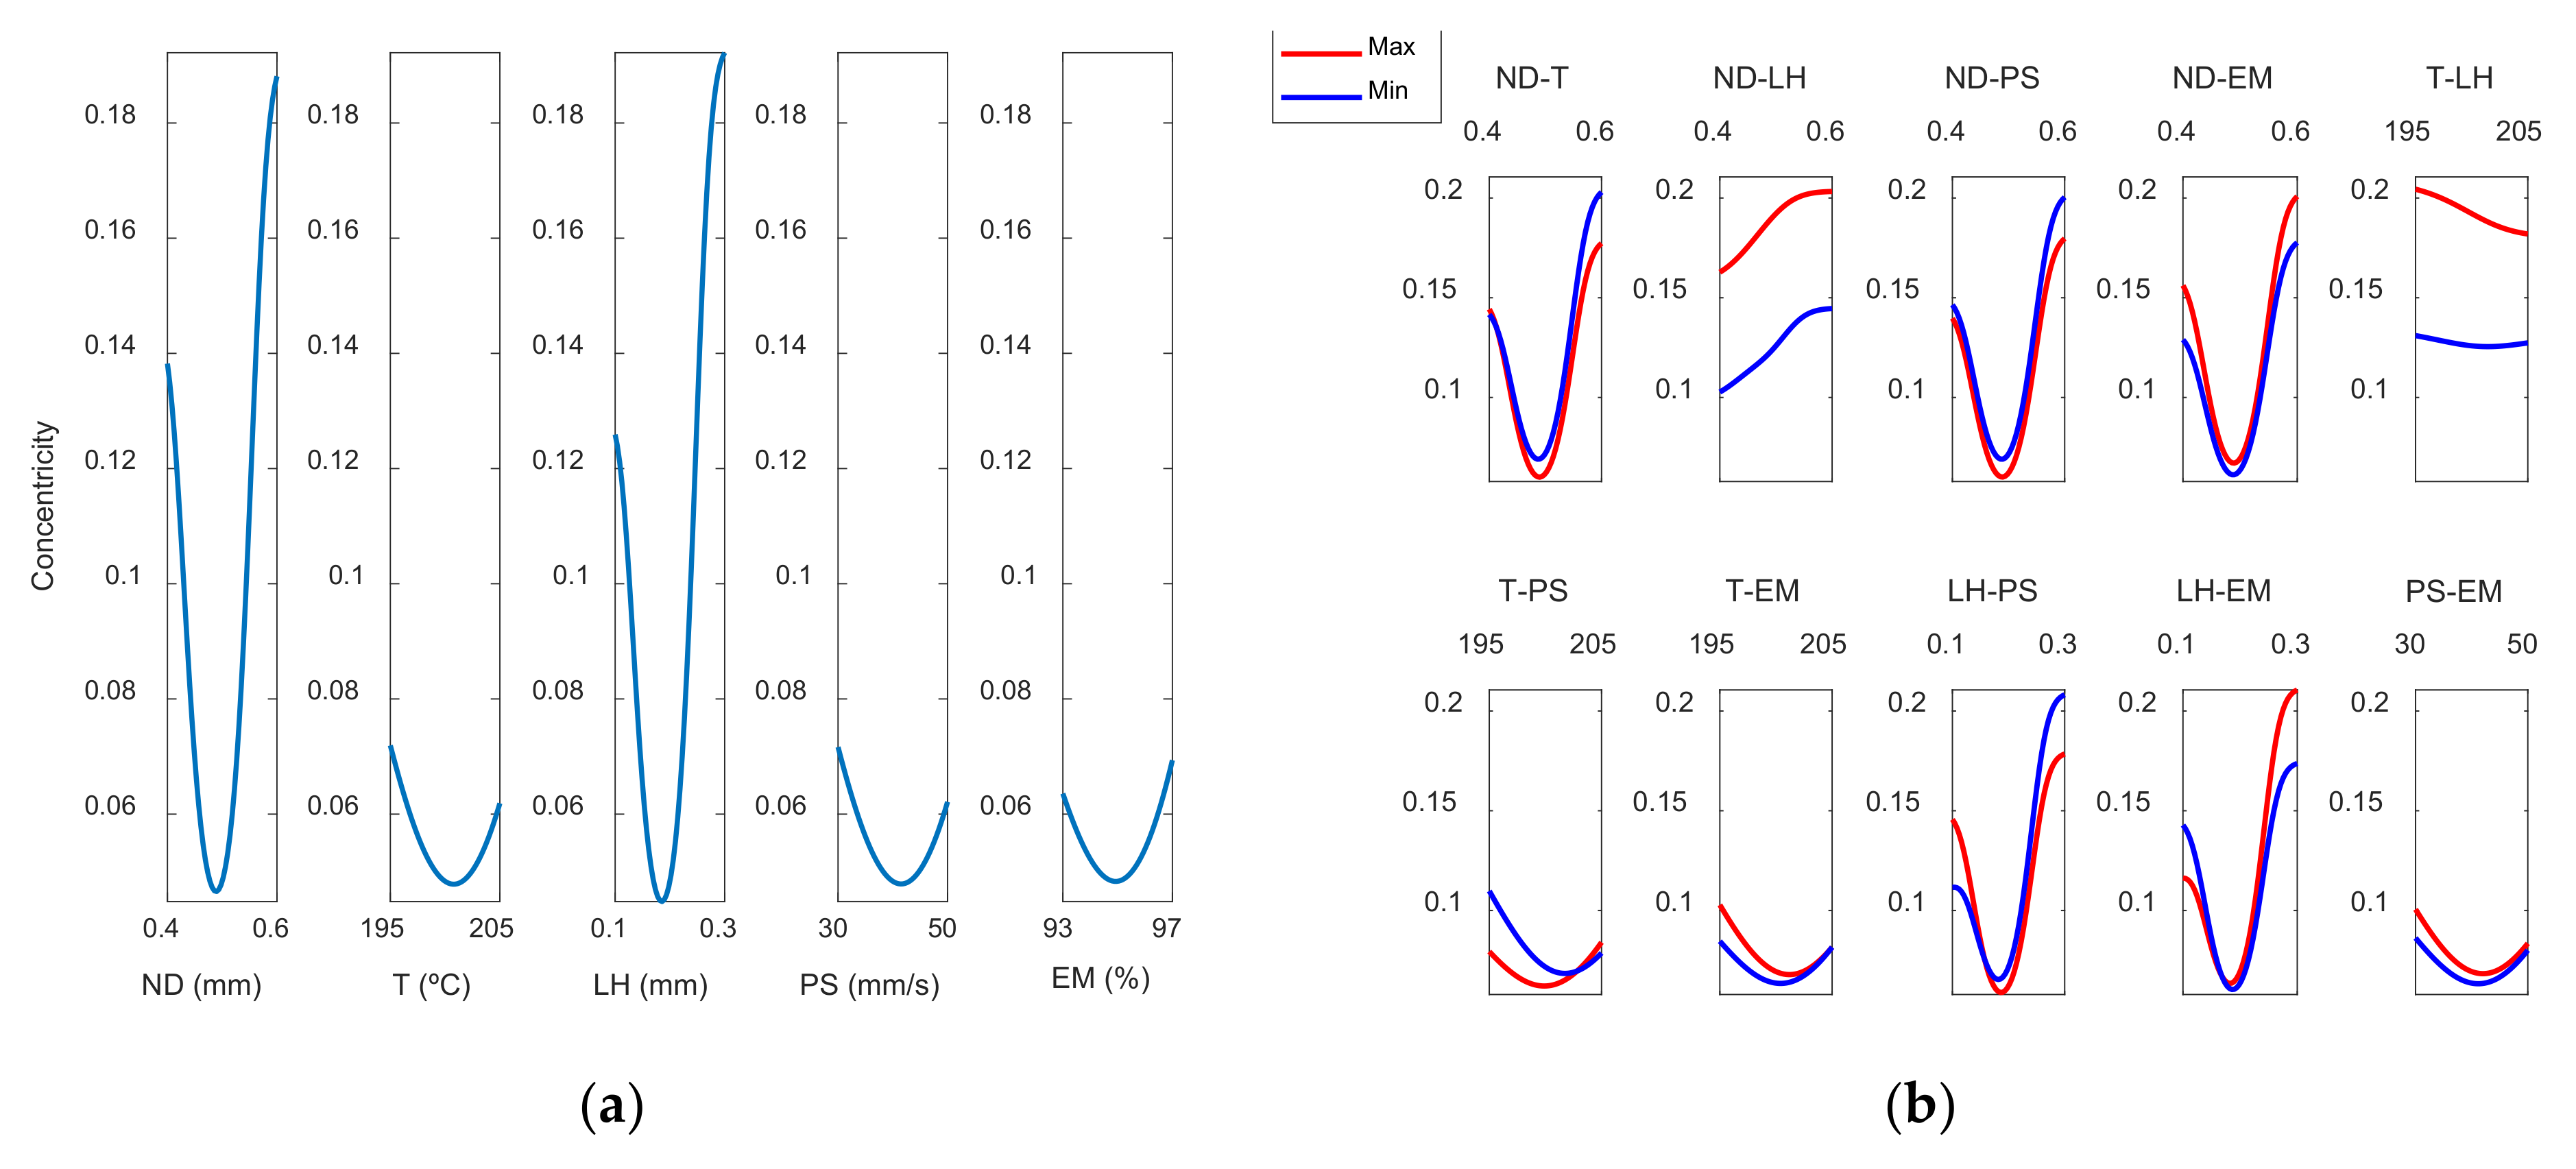
3.2. Models for Concentricity
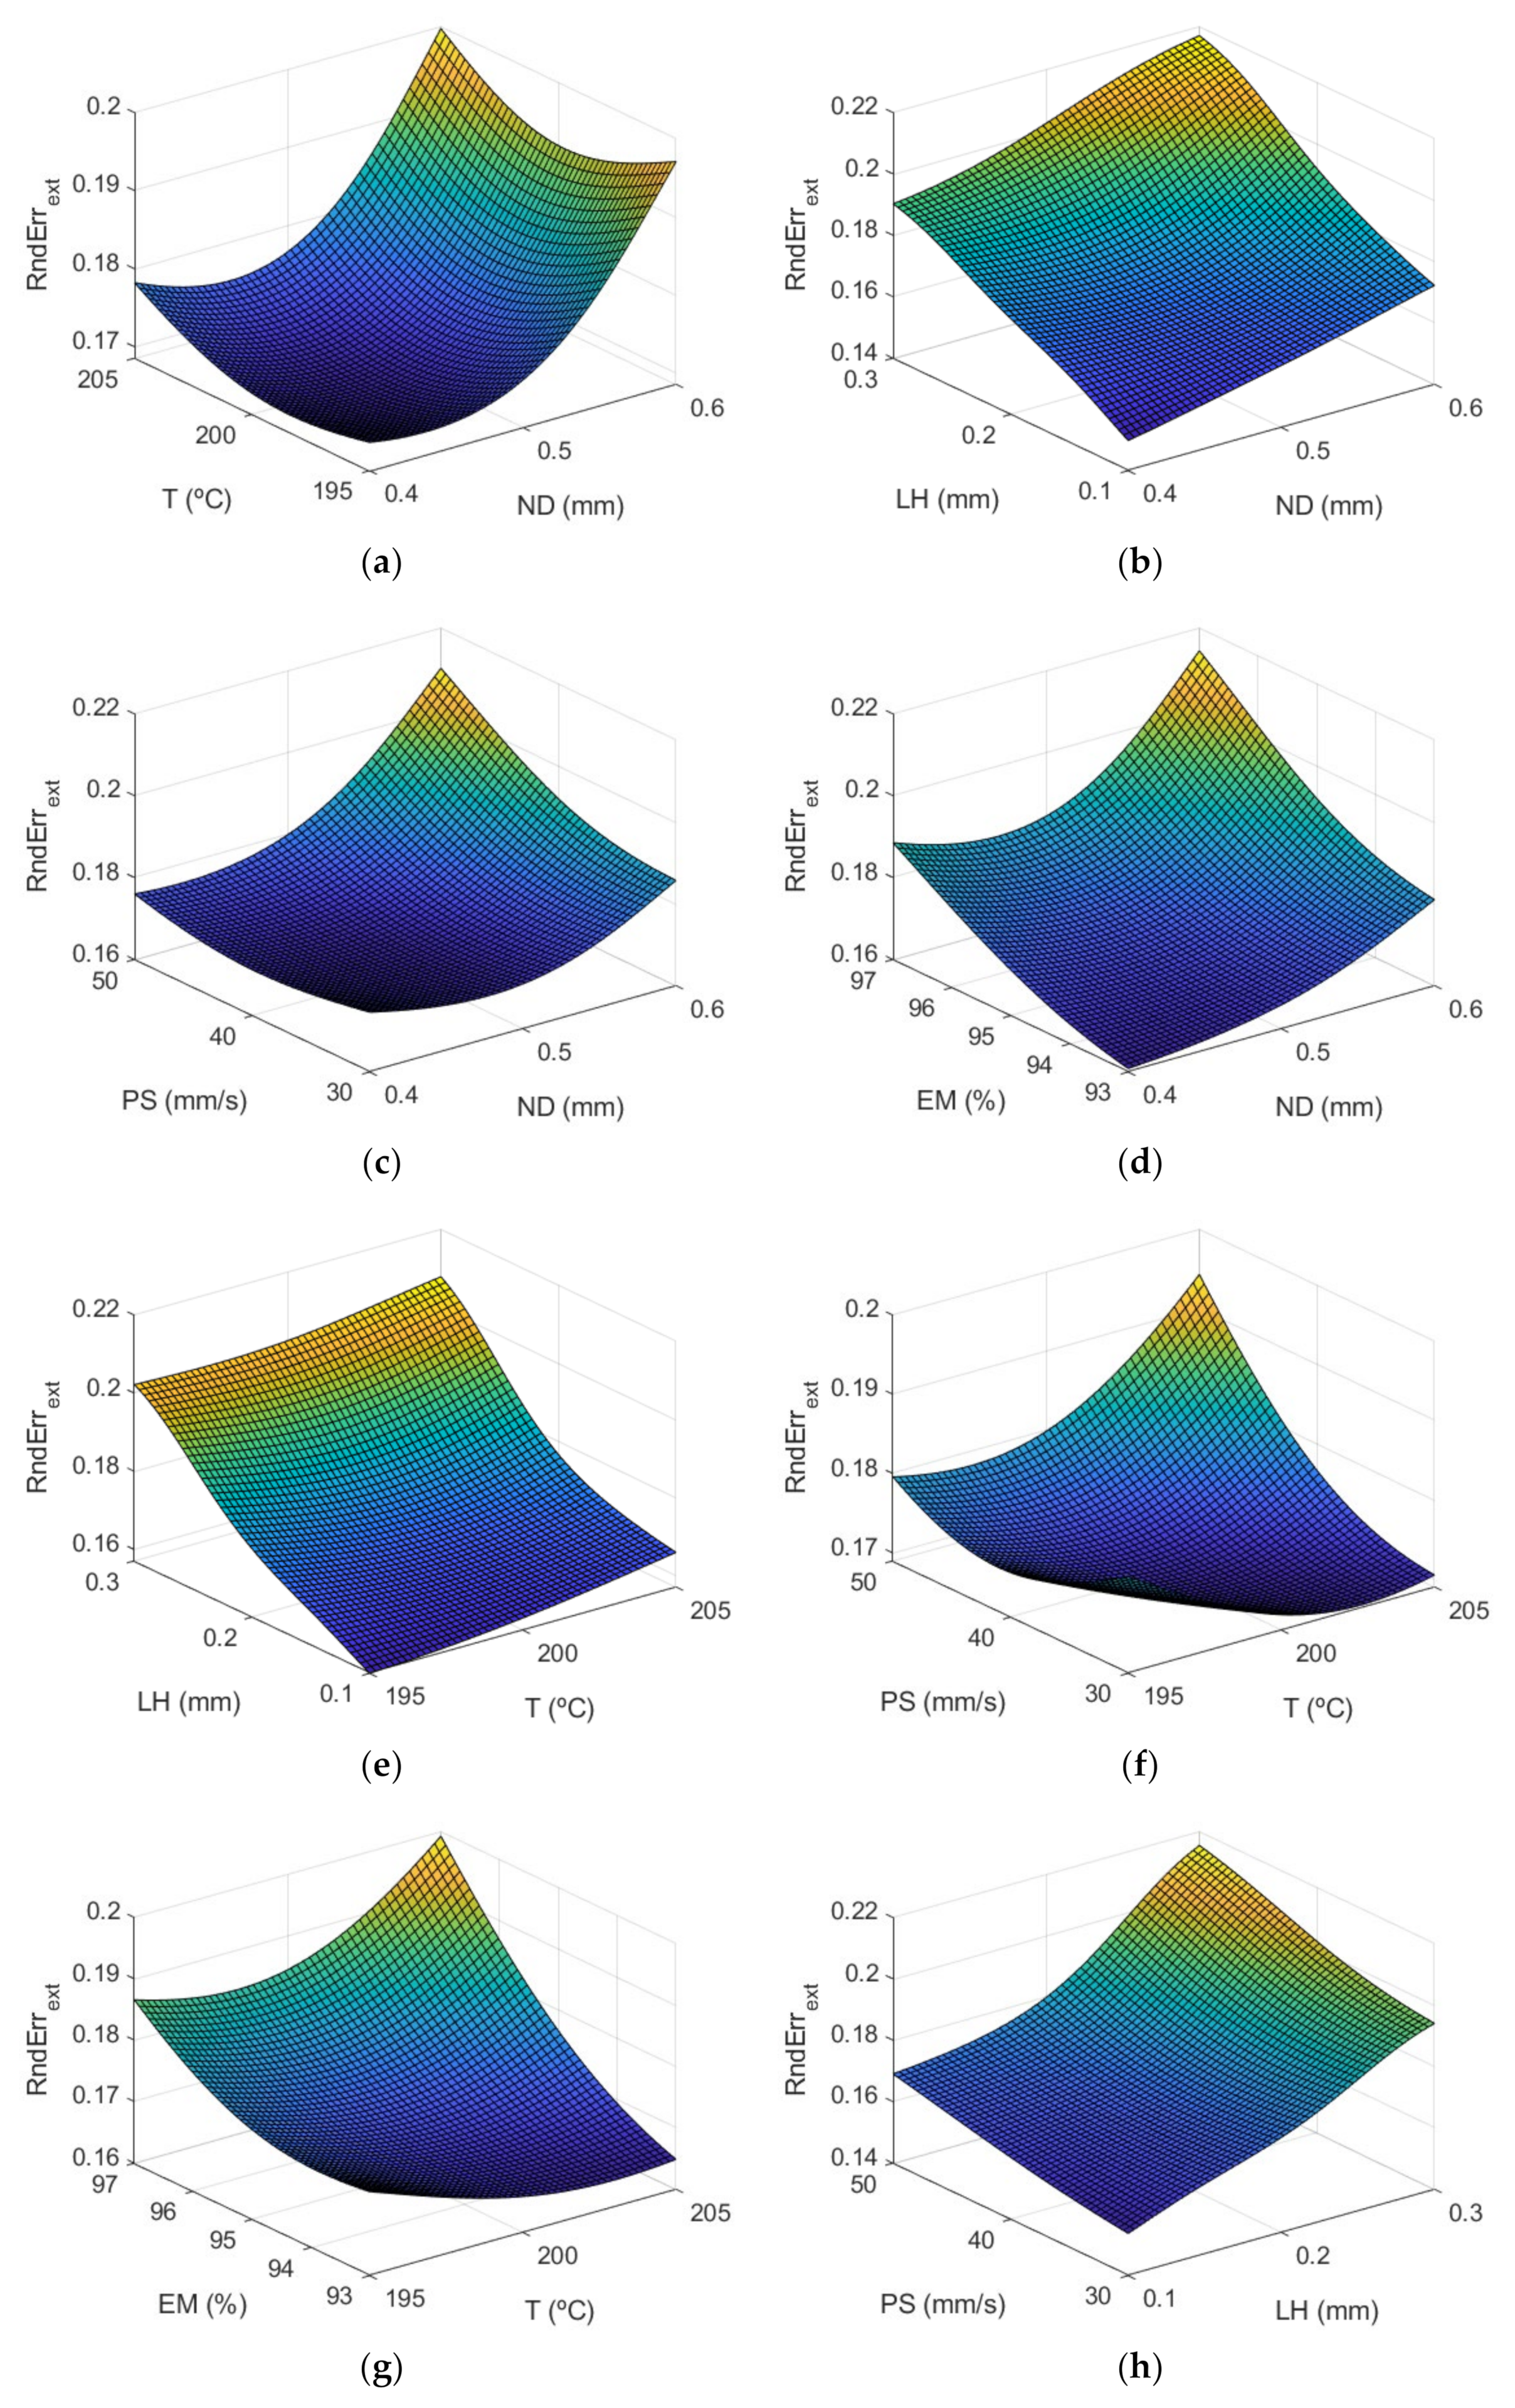
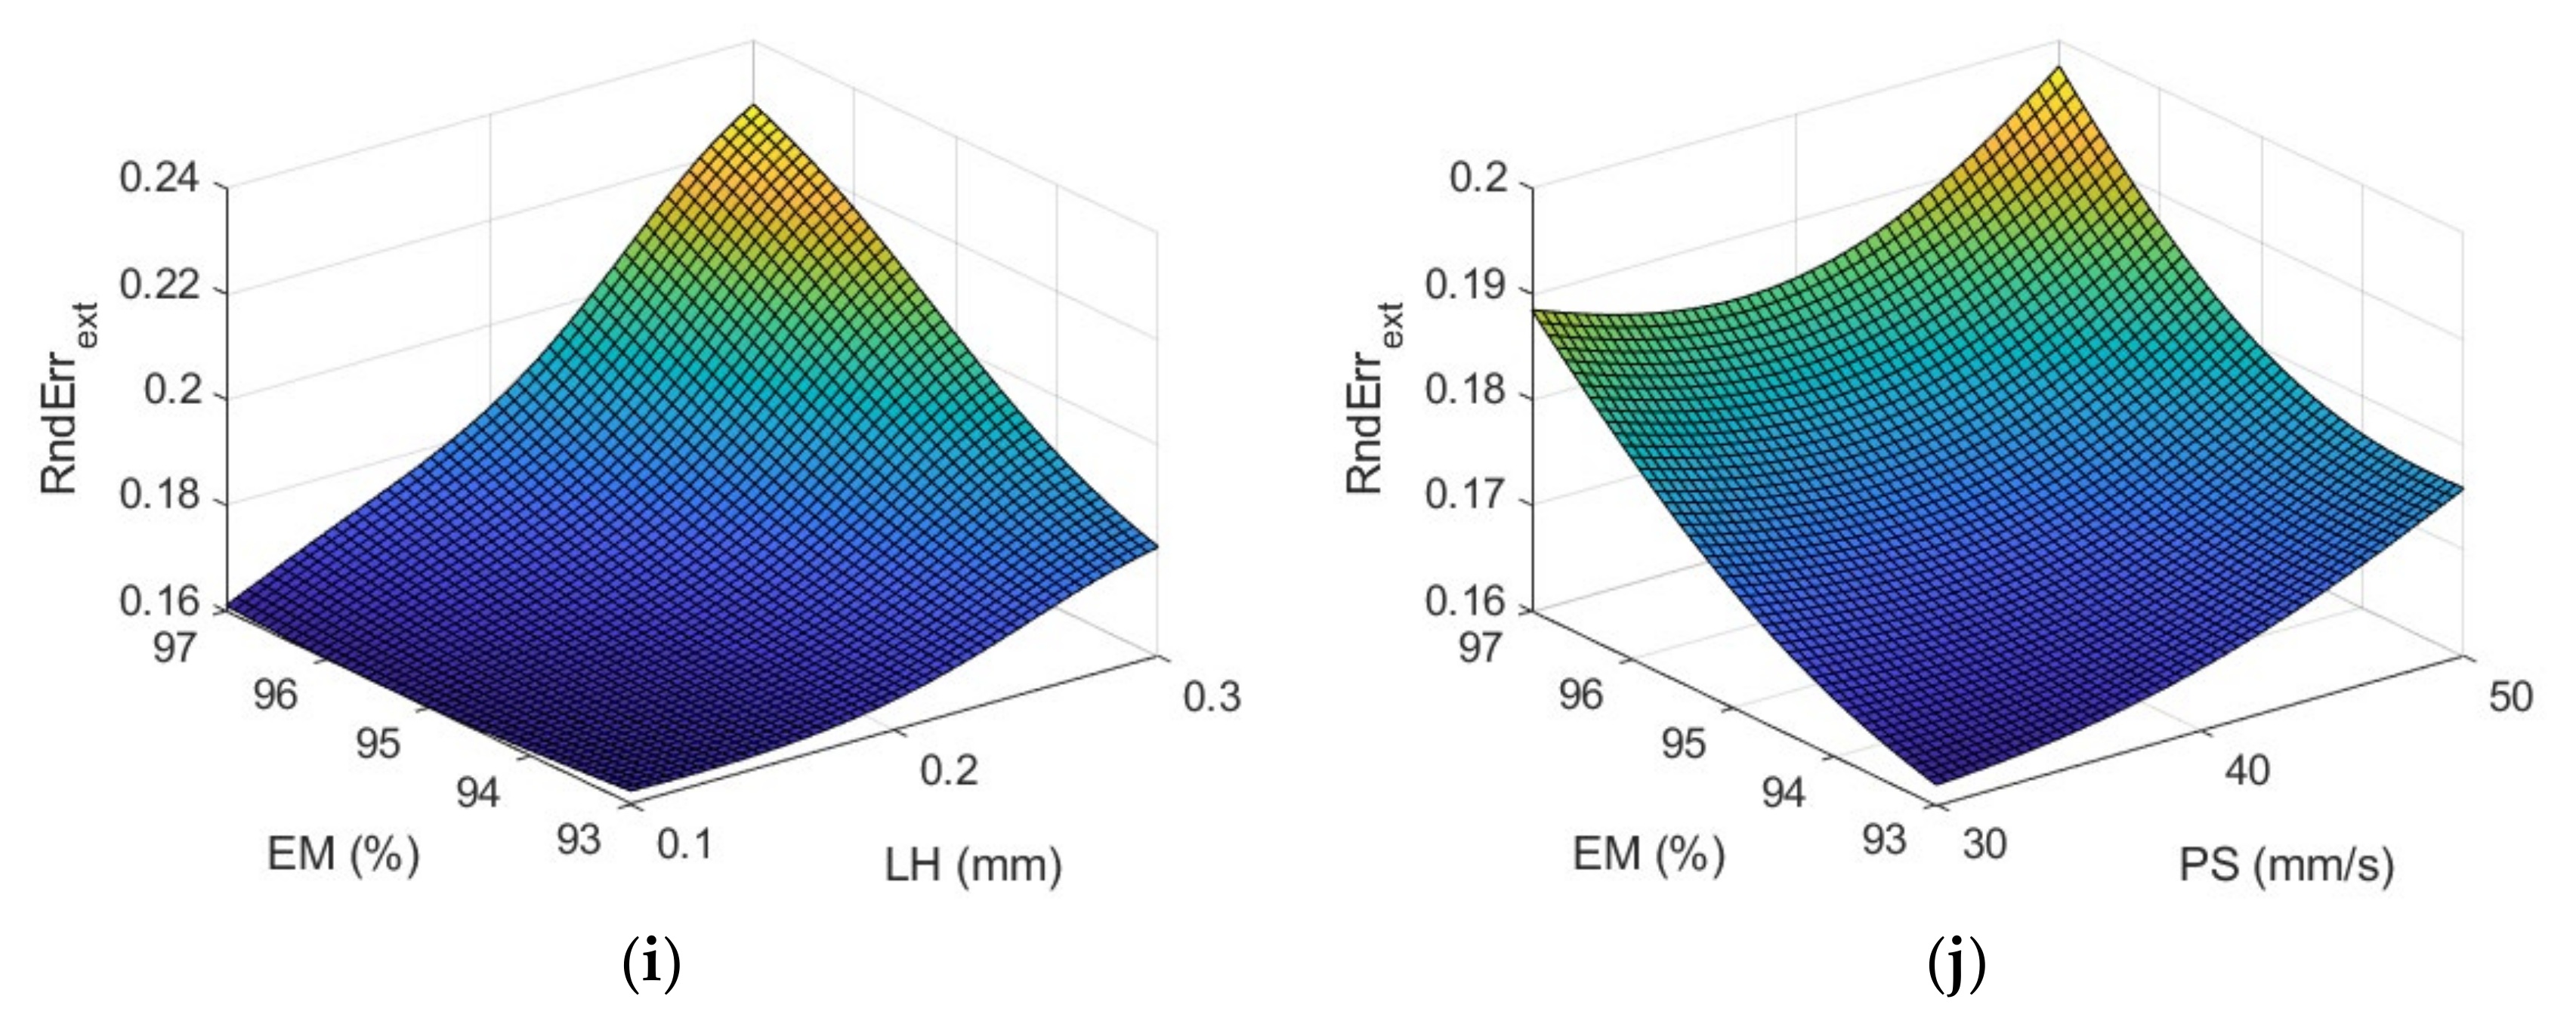
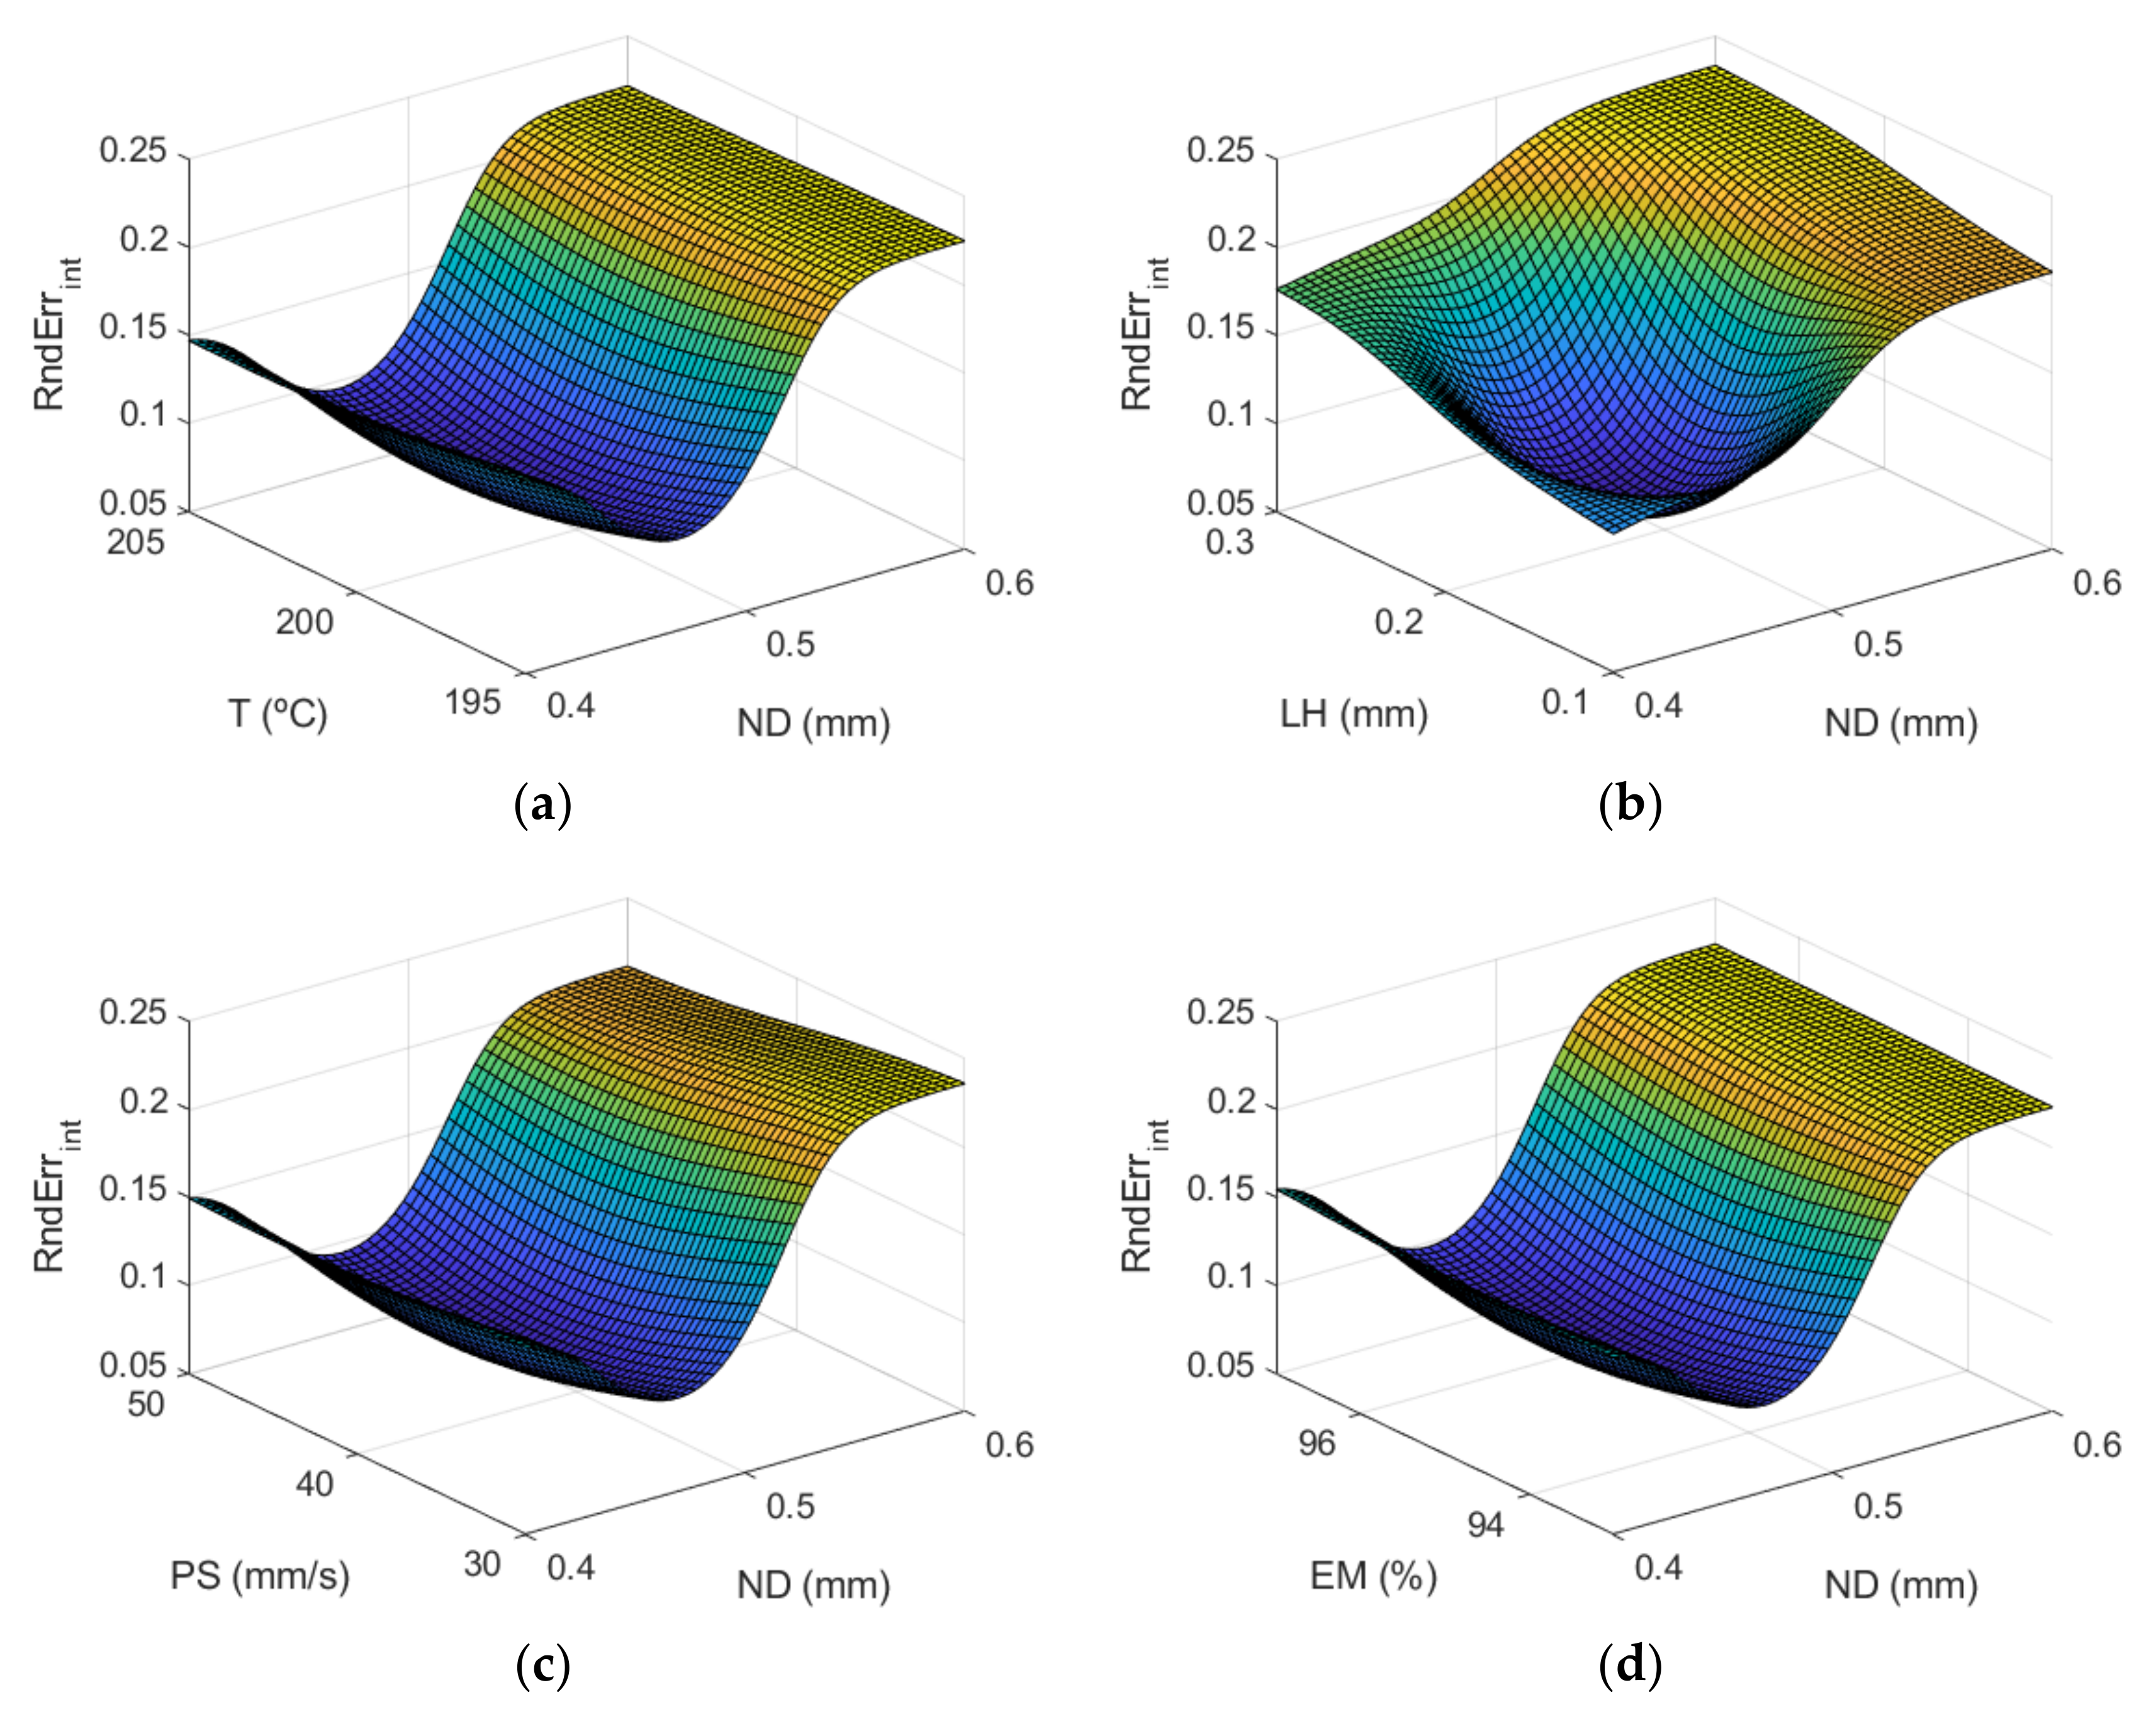
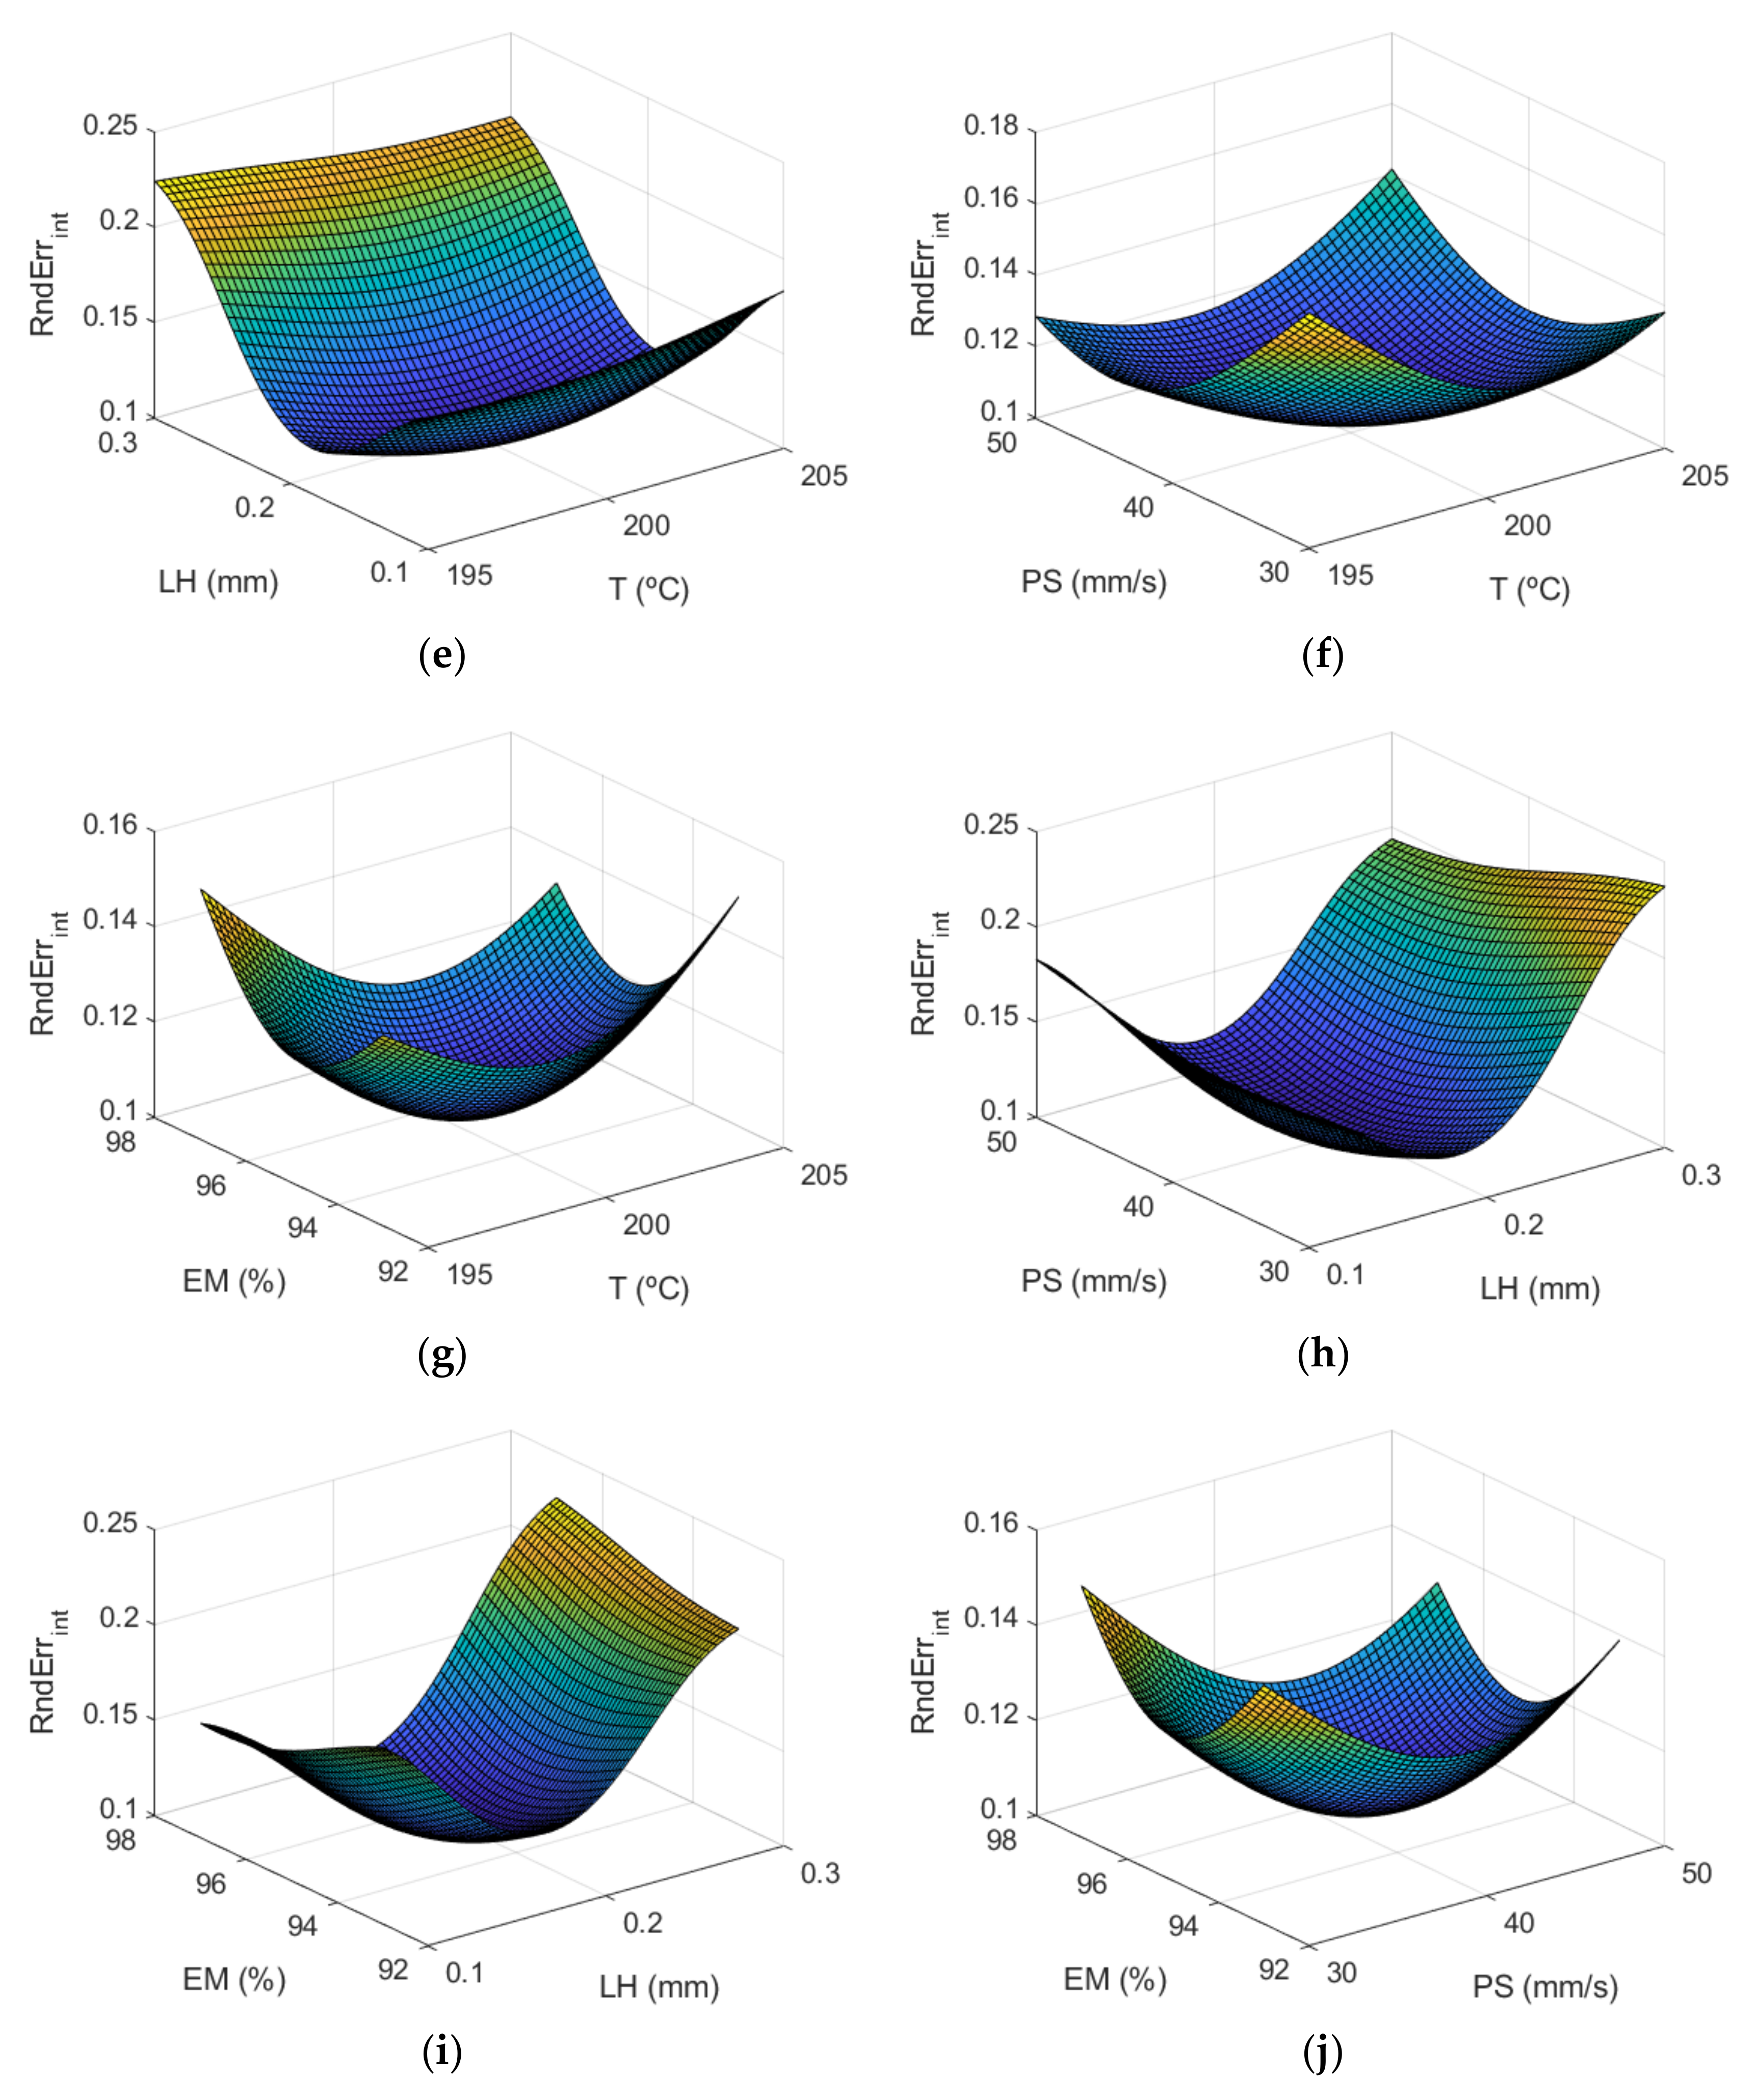
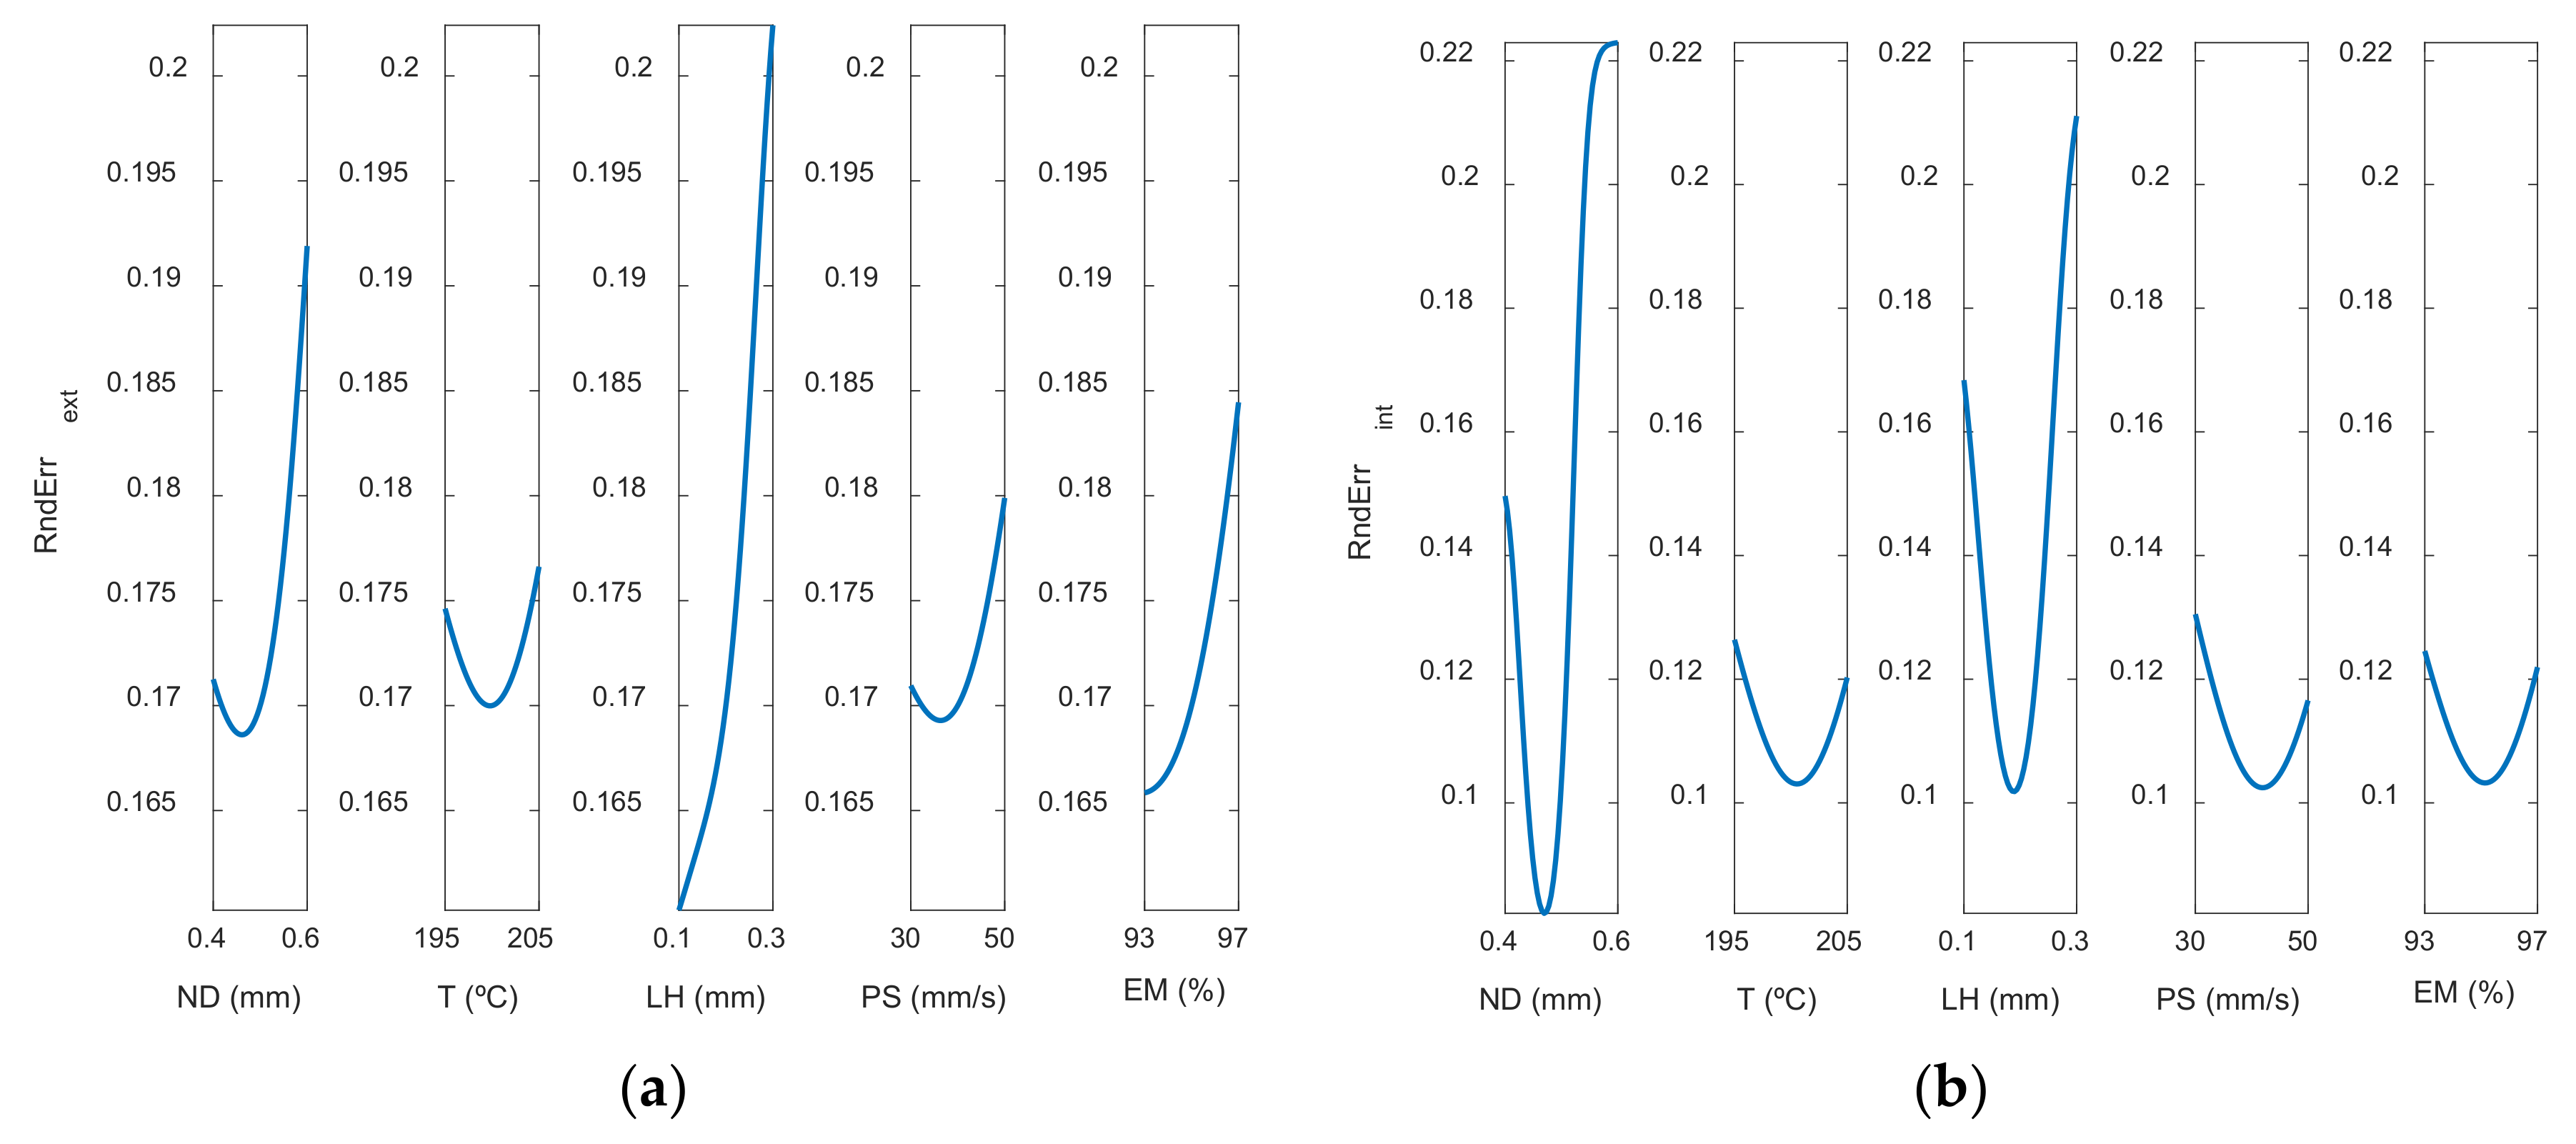
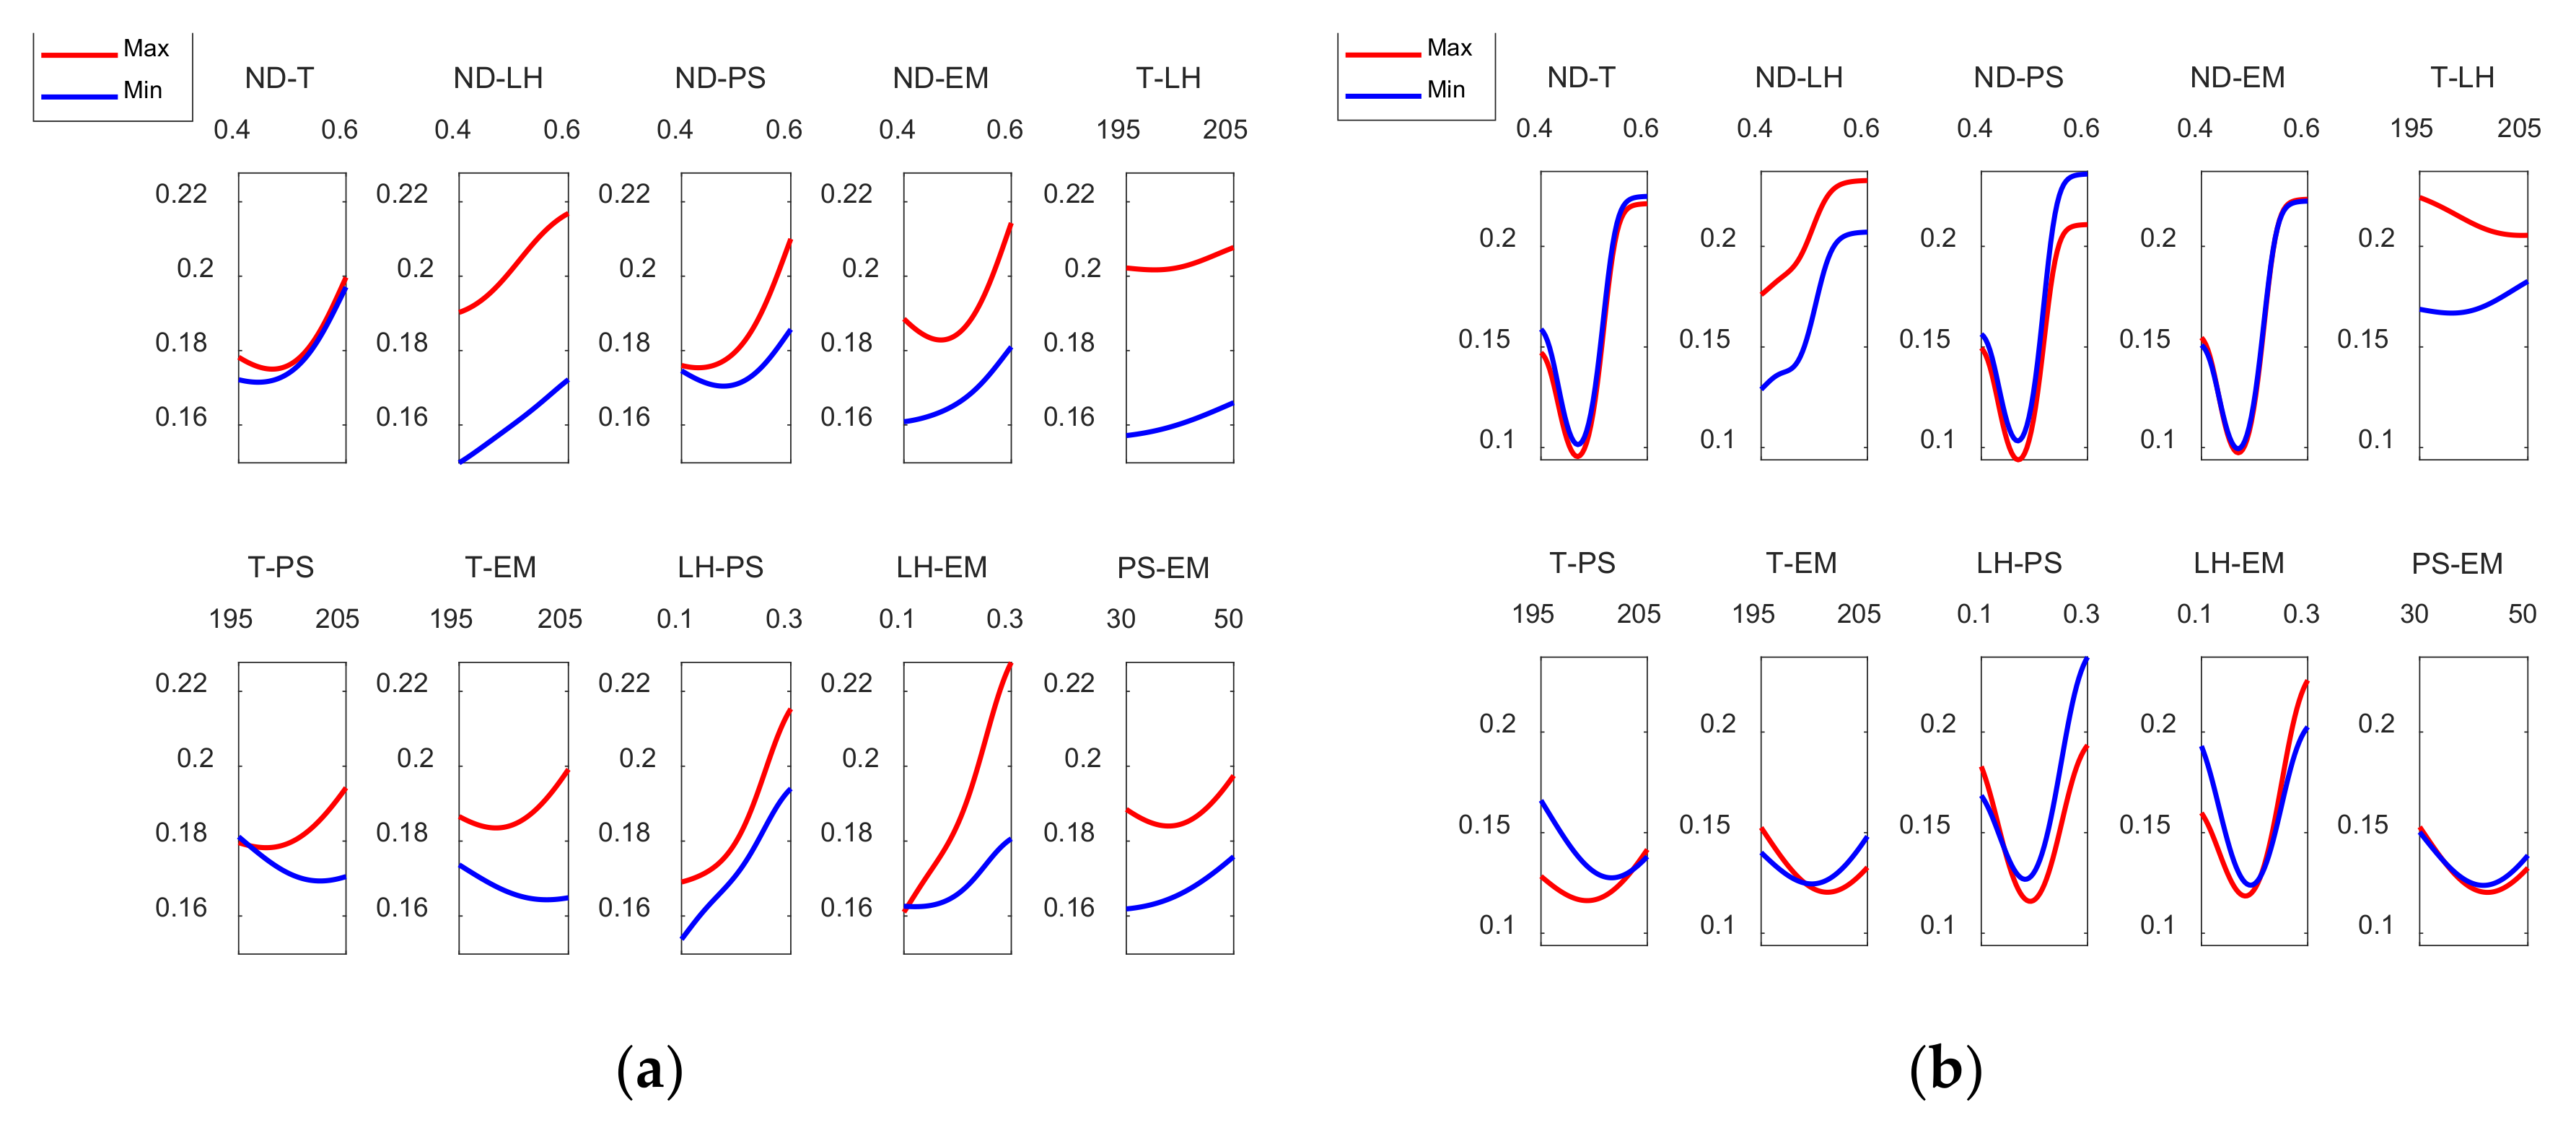
3.3. Models for Roundness Errors
3.4. Multiobjetive Optimization
4. Conclusions
Author Contributions
Funding
Institutional Review Board Statement
Informed Consent Statement
Data Availability Statement
Acknowledgments
Conflicts of Interest
References
- Garg, A.; Bhattacharya, A.; Batish, A. On Surface Finish and Dimensional Accuracy of FDM Parts after Cold Vapor Treatment. Mater. Manuf. Process. 2016, 31, 522–529. [Google Scholar] [CrossRef]
- Peng, T.; Yan, F. Dual-objective Analysis for Desktop FDM Printers: Energy Consumption and Surface Roughness. Procedia CIRP 2018, 69, 106–111. [Google Scholar] [CrossRef]
- Buj-Corral, I.; Tejo-Otero, A.; Fenollosa-Artés, F. Development of AM Technologies for Metals in the Sector of Medical Implants. Metals 2020, 10, 686. [Google Scholar] [CrossRef]
- Chua, C.K.; Leong, K.F. 3D Printing and Additive Manufacturing: Principles and Applications: The 5th Edition of Rapid Prototyping: Principles and Applications; World Scientific Publishing Co: Singapore, 2016; pp. 1–456. ISBN 9789813149274. [Google Scholar]
- Rahman, H.; John, T.; Sivadasan, M.; Singh, N. Investigation on the Scale Factor applicable to ABS based FDM Additive Manufacturing. Mater. Today Proc. 2018, 5, 1640–1648. [Google Scholar] [CrossRef]
- Ceretti, E.; Ginestra, P.; Neto, P.; Fiorentino, A.; da Silva, J.V.L. Multi-layered Scaffolds Production via Fused Deposition Modeling (FDM) Using an Open Source 3D Printer: Process Parameters Optimization for Dimensional Accuracy and Design Reproducibility. Procedia CIRP 2017, 65, 13–18. [Google Scholar] [CrossRef]
- Nancharaiah, T.; Raju, D.R.; Raju, V.R. An experimental investigation on surface quality and dimensional accuracy of FDM components. Int. J. Emerg. Technol. 2010, 1, 106–111. [Google Scholar]
- Pennington, R.C.; Hoekstra, N.L.; Newcomer, J.L. Significant factors in the dimensional accuracy of fused deposition modelling. Proc. Inst. Mech. Eng. Part E J. Process. Mech. Eng. 2005, 219, 89–92. [Google Scholar] [CrossRef]
- Akbaş, O.E.; Hıra, O.; Hervan, S.Z.; Samankan, S.; Altınkaynak, A. Dimensional accuracy of FDM-printed polymer parts. Rapid Prototyp. J. 2019, 26, 288–298. [Google Scholar] [CrossRef]
- Maurya, N.K.; Rastogi, V.; Singh, P. Fabrication of prototype connecting rod of PLA plastic material using FDM prototype technology. Indian J. Eng. Mater. Sci. 2020, 27, 333–343. [Google Scholar]
- Knoop, F.; Schoeppner, V. Geometrical accuracy of holes and cylinders manufactured with fused deposition modeling. In Proceedings of the 2017 International Solid Freeform Fabrication Symposium, Austin, TX, USA, 7–9 August 2017; pp. 2757–2776. [Google Scholar]
- Saqib, S.; Urbanic, J. An Experimental Study to Determine Geometric and Dimensional Accuracy Impact Factors for Fused Deposition Modelled Parts. In Enabling Manufacturing Competitiveness and Economic Sustainability; Springer: Berlin/Heidelberg, Germany, 2012. [Google Scholar] [CrossRef]
- Ollison, T.; Berisso, K. Three-dimensional printing build variables that impact cylindricity. J. Ind. Technol. 2010, 26, 1–10. [Google Scholar]
- Paul, R.; Anand, S. Optimization of layered manufacturing process for reducing form errors with minimal support structures. J. Manuf. Syst. 2015, 36, 231–243. [Google Scholar] [CrossRef]
- Spindola-Filho, J.; Piratelli-Filho, A.; Arencibia, R. Application of Reference Part and Design of Experiments for Metrological Evaluation of AM Manufacturing Machine with FDM Technology. In Proceedings of the CAD’20, Barcelona, Spain, 6–8 July 2020; pp. 61–65. [Google Scholar]
- Boejang, H.; Ramli, F.R.; Alkahari, M.R.; Juzaila, M.; Latif, A. Performance Assessment of Rapid Prototyping Technologies. In Proceedings of the International Conference on Mechanical and Manufacturing Engineering 2008, Johor Baharu, Malaysia, 1–8 May 2008. [Google Scholar]
- Abdelrhman, A.M. Assessment of Geometrical Dimension and Tolerance of FDM Part. Ph.D. Thesis, Universiti Tecnologi Malaysia, Johor Bahru, Malaysia, 2008. [Google Scholar]
- Deswal, S.; Narang, R.; Chhabra, D. Modeling and parametric optimization of FDM 3D printing process using hybrid techniques for enhancing dimensional preciseness. Int. J. Interact. Des. Manuf. 2019, 13, 1197–1214. [Google Scholar] [CrossRef]
- Noriega, A.; Blanco, D.; Alvarez, B.J.; Garcia, A. Dimensional accuracy improvement of FDM square cross-section parts using artificial neural networks and an optimization algorithm. Int. J. Adv. Manuf. Technol. 2013, 69, 2301–2313. [Google Scholar] [CrossRef]
- Padhi, S.K.; Sahu, R.K.; Mahapatra, S.S.; Das, H.C.; Sood, A.K.; Patro, B.; Mondal, A.K. Optimization of fused deposition modeling process parameters using a fuzzy inference system coupled with Taguchi philosophy. Adv. Manuf. 2017, 5, 231–242. [Google Scholar] [CrossRef]
- Peng, A.; Xiao, X.; Yue, R. Process parameter optimization for fused deposition modeling using response surface methodology combined with fuzzy inference system. Int. J. Adv. Manuf. Technol. 2014, 73, 87–100. [Google Scholar] [CrossRef]
- Nasiri, S.; Khosravani, M.R. Machine learning in predicting mechanical behavior of additively manufactured parts. J. Mater. Res. Technol. 2021, 14, 1137–1153. [Google Scholar] [CrossRef]
- Trivedi, A.; Gurrala, P.K. Fuzzy logic based expert system for prediction of tensile strength in Fused Filament Fabrication (FFF) process. Mater. Today Proc. 2021, 44, 1344–1349. [Google Scholar] [CrossRef]
- Rajpurohit, S.R.; Dave, H.K. Prediction and Optimization of Tensile Strength in FDM Based 3D Printing Using ANFIS. In Optimization of Manufacturing Processes; Gupta, K., Gupta, M., Eds.; Springer Series in Advanced Manufacturing; Springer Nature: Cham, Switzerland, 2020; pp. 111–128. [Google Scholar]
- Sai, T.; Pathak, V.K.; Srivastava, A.K. Modeling and optimization of fused deposition modeling (FDM) process through printing PLA implants using adaptive neuro-fuzzy inference system (ANFIS) model and whale optimization algorithm. J. Braz. Soc. Mech. Sci. Eng. 2020, 42, 1–19. [Google Scholar] [CrossRef]
- Xia, C.; Pan, Z.; Polden, J.; Li, H.; Xu, Y.; Chen, S. Modelling and prediction of surface roughness in wire arc additive manufacturing using machine learning. J. Intell. Manuf. 2021, 1–16. [Google Scholar] [CrossRef]
- Sahu, R.K.; Mahapatra, S.; Sood, A.K. A Study on Dimensional Accuracy of Fused Deposition Modeling (FDM) Processed Parts using Fuzzy Logic. J. Manuf. Sci. Prod. 2013, 13, 183–197. [Google Scholar] [CrossRef]
- Saleh, B.; Maher, I.; Abdelrhman, Y.; Heshmat, M.; Abdelaal, O. Adaptive Neuro-Fuzzy Inference System for Modelling the Effect of Slurry Impacts on PLA Material Processed by FDM. Polymers 2020, 13, 118. [Google Scholar] [CrossRef]
- Mensah, R.A.; Xiao, J.; Das, O.; Jiang, L.; Xu, Q.; Alhassan, M.O. Application of Adaptive Neuro-Fuzzy Inference System in Flammability Parameter Prediction. Polymers 2020, 12, 122. [Google Scholar] [CrossRef] [PubMed] [Green Version]
- Buj-Corral, I.; Sánchez-Casas, X.; Luis-Pérez, C. Analysis of AM Parameters on Surface Roughness Obtained in PLA Parts Printed with FFF Technology. Polymers 2021, 13, 2384. [Google Scholar] [CrossRef] [PubMed]
- Pérez, C.L. On the Application of a Design of Experiments along with an ANFIS and a Desirability Function to Model Response Variables. Symmetry 2021, 13, 897. [Google Scholar] [CrossRef]
- Meftah, M.; Ebrahimpour, P.B.; He, C.; Ranawat, A.S.; Ranawat, C.S. Preliminary Clinical and Radiographic Results of Large Ceramic Heads on Highly Cross-Linked Polyethylene. Orthopedics 2011, 34, e133–e137. [Google Scholar] [CrossRef] [PubMed]
- International Organization for Standardization. Geometrical Product Specifications (GPS)—Geometrical Tolerancing—Tolerances of Form, Orientation, Location and Run-Out; ISO 1101:2017; International Organization for Standardization: Geneva, Switzerland, 2017. [Google Scholar]
- The MathWorks Inc. Fuzzy Logic ToolboxTMUser’s Guide© Copyright 1995–2020 by The MathWorks; Math Works Inc.: Natick, MA, USA, 2020.
- Pérez, C.J.L. A Proposal of an Adaptive Neuro-Fuzzy Inference System for Modeling Experimental Data in Manufacturing Engineering. Mathematics 2020, 8, 1390. [Google Scholar] [CrossRef]
- Burrascano, P.; Callegari, S.; Montisci, A.; Ricci, M.; Versaci, M. Chapter 6: Standard Soft Computing Techniques for Characterization of Defects in Nondestructive Evaluation. In Ultrasonic Nondestructive Evaluation Systems, Industrial Application Issues; Burrascano, P., Callegari, S., Montisci, A., Ricci, M., Versaci, M., Eds.; Springer International Publishing: Cham, Switzerland, 2015; pp. 175–199. [Google Scholar]
- Buj-Corral, I.; Bagheri, A.; Sivatte-Adroer, M. Effect of Printing Parameters on Dimensional Error, Surface Roughness and Porosity of FFF Printed Parts with Grid Structure. Polymers 2021, 13, 1213. [Google Scholar] [CrossRef]
- Equbal, A.; Sood, A.K.; Ansari, A.R.; Equbal, M.A. Optimization of process parameters of FDM part for minimiizing its dimensional inaccuracy. Int. J. Mech. Prod. Eng. Res. Dev. 2017, 7, 57–66. [Google Scholar]
- Maurya, N.K.; Rastogi, V.; Singh, P. Comparative Study and Measurement of Form Errors for the Component Printed by FDM and PolyJet Process. J. Homepage Httpiieta Orgjournalsi2m 2019, 18, 353–359. [Google Scholar] [CrossRef]
- Sajan, N.; John, T.; Sivadasan, M.; Singh, N. An investigation on circularity error of components processed on Fused Deposition Modeling (FDM). Mater. Today Proc. 2018, 5, 1327–1334. [Google Scholar] [CrossRef]
- Rupal, B.S.; Ramadass, K.; Qureshi, A.J. Investigating the effect of motor micro-stepping on the geometric tolerances of Fused Filament Fabrication printed parts. Procedia CIRP 2020, 92, 9–14. [Google Scholar] [CrossRef]


| Outputs (Int/Ext) | ||
|---|---|---|
| Dimensional error | Roundness | Concentricity |
| (Dim Err, mm) | (Rnd, mm) | (Con, mm) |
| External | Internal | Concentricity | ||||||||
|---|---|---|---|---|---|---|---|---|---|---|
| Exp | ND | T | LH | PS | EM | Dim Err | Rnd | Dim Err | Rnd | Con |
| (mm) | (mm) | (mm) | (mm) | (mm) | ||||||
| 1 | 0.4 | 195 | 0.1 | 30 | 97 | 0.084 | 0.137 | −0.161 | 0.086 | 0.098 |
| 2 | 0.6 | 195 | 0.1 | 30 | 93 | 0.135 | 0.153 | −0.384 | 0.201 | 0.125 |
| 3 | 0.4 | 205 | 0.1 | 30 | 93 | −0.018 | 0.143 | −0.090 | 0.089 | 0.093 |
| 4 | 0.6 | 205 | 0.1 | 30 | 97 | 0.243 | 0.137 | −0.229 | 0.165 | 0.051 |
| 5 | 0.4 | 195 | 0.3 | 30 | 93 | 0.153 | 0.153 | −0.112 | 0.190 | 0.120 |
| 6 | 0.6 | 195 | 0.3 | 30 | 97 | 0.198 | 0.229 | −0.137 | 0.297 | 0.272 |
| 7 | 0.4 | 205 | 0.3 | 30 | 97 | 0.044 | 0.222 | 0.156 | 0.162 | 0.176 |
| 8 | 0.6 | 205 | 0.3 | 30 | 93 | 0.146 | 0.164 | −0.178 | 0.235 | 0.182 |
| 9 | 0.4 | 195 | 0.1 | 50 | 93 | −0.210 | 0.141 | 0.217 | 0.137 | 0.083 |
| 10 | 0.6 | 195 | 0.1 | 50 | 97 | 0.057 | 0.149 | −0.057 | 0.167 | 0.127 |
| 11 | 0.4 | 205 | 0.1 | 50 | 97 | 0.361 | 0.147 | −0.26 | 0.129 | 0.100 |
| 12 | 0.6 | 205 | 0.1 | 50 | 93 | 0.290 | 0.209 | −0.184 | 0.270 | 0.202 |
| 13 | 0.4 | 195 | 0.3 | 50 | 97 | 0.188 | 0.195 | −0.187 | 0.163 | 0.158 |
| 14 | 0.6 | 195 | 0.3 | 50 | 93 | −0.025 | 0.206 | −0.053 | 0.194 | 0.175 |
| 15 | 0.4 | 205 | 0.3 | 50 | 93 | 0.314 | 0.161 | −0.200 | 0.129 | 0.140 |
| 16 | 0.6 | 205 | 0.3 | 50 | 97 | 0.190 | 0.262 | −0.153 | 0.214 | 0.190 |
| 17-1 | 0.5 | 200 | 0.2 | 40 | 95 | 0.145 | 0.180 | −0.074 | 0.110 | 0.053 |
| 17-2 | 0.5 | 200 | 0.2 | 40 | 95 | 0.234 | 0.175 | −0.042 | 0.101 | 0.066 |
| 17-3 | 0.5 | 200 | 0.2 | 40 | 95 | 0.113 | 0.155 | −0.115 | 0.099 | 0.026 |
| Desirability Value | ND | T | LH | PS | EM | Ra (µm) | Roundness (mm) | Dimensional Error (mm) |
|---|---|---|---|---|---|---|---|---|
| 0.9780 | 0.4000 | 205.0000 | 0.1000 | 31.0526 | 93.6316 | 8.3972 | 0.1460 | −0.0054 |
| Desirability Value | ND | T | LH | PS | EM | Ra (µm) | Roundness (mm) | Dimensional Error (mm) |
|---|---|---|---|---|---|---|---|---|
| 0.9764 | 0.4000 | 195.5882 | 0.1000 | 39.4118 | 94.8824 | 10.4376 | 0.1267 | −0.0010 |
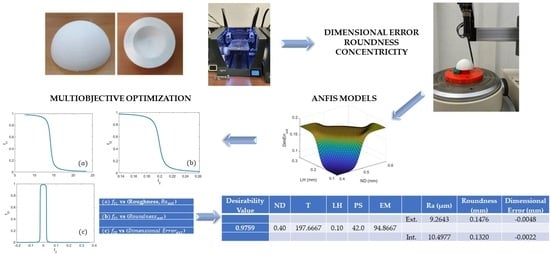
| Desirability Value | ND | T | LH | PS | EM | Ra (µm) | Roundness (mm) | Dimensional Error (mm) | |
|---|---|---|---|---|---|---|---|---|---|
| Ext. | 9.2643 | 0.1476 | −0.0048 | ||||||
| 0.9759 | 0.4000 | 197.6667 | 0.1000 | 42.0000 | 94.8667 | ||||
| Int. | 10.4977 | 0.1320 | −0.0022 |
Publisher’s Note: MDPI stays neutral with regard to jurisdictional claims in published maps and institutional affiliations. |
© 2021 by the authors. Licensee MDPI, Basel, Switzerland. This article is an open access article distributed under the terms and conditions of the Creative Commons Attribution (CC BY) license (https://creativecommons.org/licenses/by/4.0/).
Share and Cite
Luis-Pérez, C.J.; Buj-Corral, I.; Sánchez-Casas, X. Modeling of the Influence of Input AM Parameters on Dimensional Error and Form Errors in PLA Parts Printed with FFF Technology. Polymers 2021, 13, 4152. https://doi.org/10.3390/polym13234152
Luis-Pérez CJ, Buj-Corral I, Sánchez-Casas X. Modeling of the Influence of Input AM Parameters on Dimensional Error and Form Errors in PLA Parts Printed with FFF Technology. Polymers. 2021; 13(23):4152. https://doi.org/10.3390/polym13234152
Chicago/Turabian StyleLuis-Pérez, Carmelo J., Irene Buj-Corral, and Xavier Sánchez-Casas. 2021. "Modeling of the Influence of Input AM Parameters on Dimensional Error and Form Errors in PLA Parts Printed with FFF Technology" Polymers 13, no. 23: 4152. https://doi.org/10.3390/polym13234152