
A Wet-Spinning Process for Producing Carbon Nanotube/Polyvinylidene Fluoride Fibers Having Highly Consistent Electrical and Mechanical Properties


Abstract
:1. Introduction
2. Experimental
2.1. Manufacture of CNT/PVDF Fibers Using Wet Spinning
2.1.1. Materials
2.1.2. Wet-Spinning Process
- (1)
- Preparation of the dope solution. CNT, PVDF, and DMAc were dispersed in the molten state. Figure 1a shows the procedure for preparing the dope solution. Briefly, PVDF powder was added to a solution of DMAc in a 1:3 ratio, and the PVDF/DMAc solution was stirred for 30 min using a centrifugal stirrer. Subsequently, the PVDF/DMAc solution was added to a previously made DMAc/CNT (3 wt%) solution in a 1:4 ratio and stirred for 30 min or more using a centrifugal stirrer, thus yielding the dope solution. The composition of the final dope solution was MWNT:PVDF:DMAc = 0.6:20:79.4.
- (2)
- Preparation of the coagulation bath. Figure 1b shows the procedure for discharging the dope solution at a spinning speed of 0.75 cc/min using a 0.05-cc gear pump and a monohole nozzle having an internal diameter of 0.66 mm. The dope solution was discharged into the coagulation bath containing aqueous DMAc, and the DMAc in the dope solution was removed into the water as a result of osmotic pressure. Thus, the dope solution solidified and crystallized to yield the fiber structure.
- (3)
- Preparation of washing and drawing baths. Figure 1c shows the stretching of the fibers and the removal of the DMAc remaining in the dope solution, which is used to improve the orientation of the CNTs and the mechanical properties of the fibers. The bath contained water at the same temperature as the coagulation bath, and a roller was submerged in water to transfer the fibers. Then, the fibers were stretched by controlling the rotational speed of the roller.
- (4)
- Drying and winding. Figure 1d shows the drying of the interior and exterior of the fiber using a heating roller. In this process, the fiber is heat-set by evaporating the moisture remaining in the fiber, which improves the density of the internal structure and prevents contraction. The final process is to wind the CNT/PVDF fiber spinning to a total length of 150 m using a roller.
2.2. Initial Process Parameters
2.3. Performance Evaluation of Wet-Spinning CNT/PVDF Fibers
3. Results and Discussion
3.1. Performance Evaluation
3.2. Process Stabilization to Ensure the Reliability and Continuity of CNT/PVDF Fibers
3.3. Evaluation of Performance-Stabilized Fibers
4. Conclusions
Author Contributions
Funding
Institutional Review Board Statement
Informed Consent Statement
Data Availability Statement
Conflicts of Interest
References
- Alexopoulos, N.D.; Bartholome, C.; Poulin, P.; Marioli-Riga, Z. Damage detection of glass fiber reinforced composites using embedded PVA–carbon nanotube (CNT) fibers. Compos. Sci. Technol. 2010, 70, 1733–1741. [Google Scholar] [CrossRef] [Green Version]
- Mikhalchan, A.; Tay, T.E.; Banas, A.M.; Banas, K.; Breese, M.B.; Borkowska, A.M.; Nowakowski, M.; Kwiatek, W.M.; Paluszkiewicz, C. Development of continuous CNT fibre-reinforced PMMA filaments for additive manufacturing: A case study by AFM-IR nanoscale imaging. Mater. Lett. 2020, 262, 127182. [Google Scholar] [CrossRef]
- Nam, I.W.; Park, S.; Lee, H.K.; Zheng, L. Mechanical properties and piezoresistive sensing capabilities of FRP composites incorporating CNT fibers. Compos. Struct. 2017, 178, 1–8. [Google Scholar] [CrossRef]
- Mikhalchan, A.; Vilatela, J.J. A perspective on high-performance CNT fibres for structural composites. Carbon 2019, 150, 191–215. [Google Scholar] [CrossRef]
- Yang, Y.; Qiao, S.; Zheng, M.; Zhou, J.; Quan, X. Enhanced permeability, contaminants removal and antifouling ability of CNTs-based hollow fiber membranes under electrochemical assistance. J. Membr. Sci. 2019, 582, 335–341. [Google Scholar] [CrossRef]
- Behabtu, N.; Green, M.J.; Pasquali, M. Carbon nanotube-based neat fibers. Nano Today 2008, 3, 24–34. [Google Scholar] [CrossRef]
- Choo, H.; Jung, Y.; Jeong, Y.; Kim, H.C.; Ku, B.C. Fabrication and applications of carbon nanotube fibers. Carbon Lett. 2012, 13, 191–204. [Google Scholar] [CrossRef] [Green Version]
- Miao, M.; McDonnell, J.; Vuckovic, L.; Hawkins, S.C. Poisson’s ratio and porosity of carbon nanotube dry-spun yarns. Carbon 2010, 48, 2802–2811. [Google Scholar] [CrossRef]
- Alvarez, N.T.; Ochmann, T.; Kienzle, N.; Ruff, B.; Haase, M.R.; Hopkins, T.; Pixley, S.; Mast, D.; Schulz, M.J.; Shanov, V. Polymer coating of carbon nanotube fibers for electric microcables. Nanomaterials 2014, 4, 879–893. [Google Scholar] [CrossRef] [PubMed]
- Yu, Y.; Zhang, L.; Yildiz, O.; Deng, H.; Zhao, C.; Bradford, P.D.; Li, J.; Zhu, Y. Investigation of microcombing parameters in enhancing the properties of carbon nanotube yarns. Mater. Des. 2017, 134, 181–187. [Google Scholar] [CrossRef]
- Xue, P.; Park, K.H.; Tao, X.M.; Chen, W.; Cheng, X.Y. Electrically conductive yarns based on PVA/carbon nanotubes. Compos. Struct. 2007, 78, 271–277. [Google Scholar] [CrossRef]
- Su, J.; Wang, Q.; Su, R.; Wang, K.; Zhang, Q.; Fu, Q. Enhanced compatibilization and orientation of polyvinyl alcohol/gelatin composite fibers using carbon nanotubes. J. Appl. Polym. Sci. 2008, 107, 4070–4075. [Google Scholar] [CrossRef]
- Ma, R.; Kang, B.; Cho, S.; Choi, M.; Baik, S. Extraordinarily high conductivity of stretchable fibers of polyurethane and silver nanoflowers. ACS Nano 2015, 9, 10876–10886. [Google Scholar] [CrossRef] [PubMed]
- Mirbaha, H.; Nourpanah, P.; Scardi, P.; D’incau, M.; Greco, G.; Valentini, L.; Bon, S.B.; Arbab, S.; Pugno, N. The impact of shear and elongational forces on structural formation of polyacrylonitrile/carbon nanotubes composite fibers during wet spinning process. Materials 2019, 12, 2797. [Google Scholar] [CrossRef] [PubMed] [Green Version]
- Bell, J.P.; Dumbleton, J.H. Changes in the structure of wet-spun acrylic fibers during processing. Text. Res. J. 1971, 41, 196–203. [Google Scholar] [CrossRef]
- Mai, F.; Pan, D.; Gao, X.; Yao, M.; Deng, H.; Wang, K.; Chen, F.; Fu, Q. Extension-induced mechanical reinforcement in melt-spun fibers of polyamide 66/multiwalled carbon nanotube composites. Polym. Int. 2011, 60, 1646–1654. [Google Scholar] [CrossRef]
- Kim, H.C.; Kim, D.; Lee, J.Y.; Zhai, L.; Kim, J. Effect of wet spinning and stretching to enhance mechanical properties of cellulose nanofiber filament. Int. J. Precis. Eng. Manuf.-Green Technol. 2019, 6, 567–575. [Google Scholar] [CrossRef] [Green Version]
- ASTM Standard D 3379. Standard test method for tensile strength and Young’s modulus for high modulus single–Filament materials. In Annual Book of ASTM Standards; ASTM: West Conshohocken, PA, USA, 2002; p. 8. [Google Scholar]
- Guo, X.; Zhang, K.; Cheng, J.; He, H.; He, L.; Xu, J. TEM study on the inhomogeneity of oxygen diffusion distances in single polyacrylonitrile-based carbon fibers. Appl. Surf. Sci. 2019, 75, 571–576. [Google Scholar] [CrossRef]
- Image J Version 1.53f; Java Image Processing Program; University of Wisconsin: Madison, WI, USA, 2020.
- Lu, M.; Gulgunje, P.V.; Arias-Monje, P.J.; Luo, J.; Ramachandran, J.; Sahoo, Y.; Agarwl, S.; Kumar, S. Structure, properties, and applications of polyacrylonitrile/carbon nanotube (CNT) fibers at low CNT loading. Polym. Eng. Sci. 2020, 60, 2143–2151. [Google Scholar] [CrossRef]
- Lu, Z.; Foroughi, J.; Wang, C.; Long, H.; Wallace, G.G. Superelastic hybrid CNT/graphene fibers for wearable energy storage. Adv. Energy Mater. 2018, 8, 1702047. [Google Scholar] [CrossRef]
- International Electrotechnical Commission Standard. IEC 60093. Methods of Test for Volume Resistivity and Surface Resistivity of Solid Electrical Insulating Materials; International Electrotechnical Commission (IEC): London, UK, 1980. [Google Scholar]


| Case | Bath Concentration x1, (%) | Bath Temperature x2, (°C) | Drying Temperature x3, (°C) | Elongation x4, (%) |
|---|---|---|---|---|
| 1 | 40 | 60 | 120 | 200 |
| 2 | 60 | 60 | 120 | 200 |
| 3 | 40 | 40 | 100 | 200 |
| 4 | 40 | 60 | 100 | 200 |
| 5 | 40 | 40 | 100 | 400 |
| 6 | 40 | 40 | 120 | 400 |
| 7 | 50 | 50 | 110 | 100 |
| 8 | 50 | 50 | 110 | 300 |
| Position (m) | Area (mm2) | |||||||
|---|---|---|---|---|---|---|---|---|
| Case 1 | Case 2 | Case 3 | Case 4 | Case 5 | Case 6 | Case 7 | Case 8 | |
| 30 | 0.063 | 0.069 | 0.052 | 0.061 | 0.029 | 0.024 | 0.098 | 0.051 |
| 60 | 0.062 | 0.071 | 0.053 | 0.067 | 0.030 | 0.025 | 0.100 | 0.050 |
| 90 | 0.061 | 0.066 | 0.053 | 0.060 | 0.029 | 0.028 | 0.100 | 0.046 |
| Total Average (mm2) | 0.062 | 0.069 | 0.052 | 0.063 | 0.030 | 0.026 | 0.099 | 0.049 |
| Std. dev (mm2) | 0.001 | 0.003 | 0.001 | 0.004 | 0.000 | 0.002 | 0.001 | 0.003 |
| COV | 0.014 | 0.037 | 0.013 | 0.058 | 0.012 | 0.074 | 0.011 | 0.054 |
| No. | Tensile Strength (MPa) | No. | Tensile Strength (MPa) | No. | Tensile Strength (MPa) |
|---|---|---|---|---|---|
| 1 | 33.20 | 31 | 36.52 | 61 | 40.92 |
| 2 | 31.85 | 32 | 33.74 | 62 | 43.83 |
| 3 | 28.43 | 33 | 37.19 | 63 | 30.89 |
| 4 | 39.04 | 34 | 40.23 | 64 | 35.14 |
| 5 | 30.68 | 35 | 40.67 | 65 | 30.90 |
| 30 | 40.44 | 60 | 31.79 | 90 | 35.91 |
| Max | 43.41 | Max | 43.83 | Max | 43.83 |
| Min | 27.69 | Min | 29.86 | Min | 27.69 |
| Average | 36.19 | Average | 35.76 | Average | 35.60 |
| Std. dev | 4.78 | Std. dev | 3.90 | Std. dev | 4.89 |
| COV | 0.13 | COV | 0.11 | COV | 0.14 |
| Total max(No.1~No.90) (MPa) | 44.83 | ||||
| Total min(No.1~No.90) (MPa) | 27.69 | ||||
| Total average(No.1~No.90) (MPa) | 35.85 | ||||
| Total std. dev(No.1~No.90) (MPa) | 4.50 | ||||
| Total COV(No.1~No.90) | 0.13 | ||||
| No. | Tensile Strength (MPa) | No. | Tensile Strength (MPa) | No. | Tensile Strength (MPa) |
|---|---|---|---|---|---|
| 1 | 13.10 | 31 | 13.10 | 61 | 18.79 |
| 2 | 15.34 | 32 | 19.33 | 62 | 18.64 |
| 3 | 13.89 | 33 | 12.37 | 63 | 12.29 |
| 4 | 16.20 | 34 | 20.53 | 64 | 13.64 |
| 5 | 18.92 | 35 | 20.17 | 65 | 12.99 |
| 30 | 19.50 | 60 | 13.99 | 90 | 18.54 |
| Max | 21.09 | Max | 20.88 | Max | 20.88 |
| Min | 10.08 | Min | 9.65 | Min | 11.16 |
| Average | 15.87 | Average | 16.23 | Average | 15.88 |
| Std. dev | 3.00 | Std. dev | 3.13 | Std. dev | 3.32 |
| COV | 0.19 | COV | 0.19 | COV | 0.21 |
| Total max(No.1~No.90) (MPa) | 21.09 | ||||
| Total min(No.1~No.90) (MPa) | 9.65 | ||||
| Total average(No.1~No.90) (MPa) | 15.99 | ||||
| Total std. dev(No.1~No.90) (MPa) | 3.12 | ||||
| Total COV(No.1~No.90) | 0.20 | ||||
| Case | Tensile Strength | ||||
|---|---|---|---|---|---|
| Max (MPa) | Min (MPa) | Average (MPa) | Std. Dev (MPa) | COV | |
| 1 | 43.83 | 27.69 | 35.85 | 4.50 | 0.13 |
| 2 | 21.09 | 9.65 | 15.99 | 3.12 | 0.20 |
| 3 | 20.08 | 15.93 | 17.94 | 1.05 | 0.06 |
| 4 | 41.64 | 26.92 | 34.16 | 4.18 | 0.12 |
| 5 | 18.28 | 12.65 | 15.33 | 1.62 | 0.11 |
| 6 | 30.10 | 22.06 | 26.48 | 2.21 | 0.08 |
| 7 | 17.33 | 14.30 | 15.88 | 0.78 | 0.05 |
| 8 | 31.06 | 19.06 | 25.02 | 3.66 | 0.15 |
| No. | Electrical Conductivity (S/cm) | No. | Electrical Conductivity (S/cm) | No. | Electrical Conductivity (S/cm) |
|---|---|---|---|---|---|
| 1 | 2.47 × 10⁻⁵ | 31 | 2.39 × 10⁻⁵ | 61 | 2.44 × 10⁻⁵ |
| 2 | 3.01 × 10⁻⁵ | 32 | 2.97 × 10⁻⁵ | 62 | 2.37 × 10⁻⁵ |
| 3 | 2.81 × 10⁻⁵ | 33 | 2.59 × 10⁻⁵ | 63 | 2.69 × 10⁻⁵ |
| 4 | 2.77 × 10⁻⁵ | 34 | 2.28 × 10⁻⁵ | 64 | 2.68 × 10⁻⁵ |
| 5 | 2.79 × 10⁻⁵ | 35 | 2.35 × 10⁻⁵ | 65 | 2.91 × 10⁻⁵ |
| 30 | 2.85 × 10⁻⁵ | 60 | 2.77 × 10⁻⁵ | 90 | 2.39 × 10⁻⁵ |
| Max | 3.01 × 10⁻⁵ | Max | 2.98 × 10⁻⁵ | Max | 2.98 × 10⁻⁵ |
| Min | 2.30 × 10⁻⁵ | Min | 2.28 × 10⁻⁵ | Min | 2.27 × 10⁻⁵ |
| Average | 2.59 × 10⁻⁵ | Average | 2.64 × 10⁻⁵ | Average | 2.62 × 10⁻⁵ |
| Std. dev | 2.13 × 10⁻⁶ | Std. dev | 2.09 × 10⁻⁶ | Std. dev | 1.94 × 10⁻⁶ |
| COV | 8.23 × 10⁻² | COV | 7.92 × 10⁻² | COV | 7.41 × 10⁻² |
| Total max(No.1~No.90) (S/cm) | 3.01 × 10⁻⁵ | ||||
| Total min(No.1~No.90) (S/cm) | 2.27 × 10⁻⁵ | ||||
| Total average(No.1~No.90) (S/cm) | 2.62 × 10⁻⁵ | ||||
| Total std. dev(No.1~No.90) (S/cm) | 2.04 × 10⁻⁶ | ||||
| Total COV(No.1~No.90) | 7.80 × 10⁻² | ||||
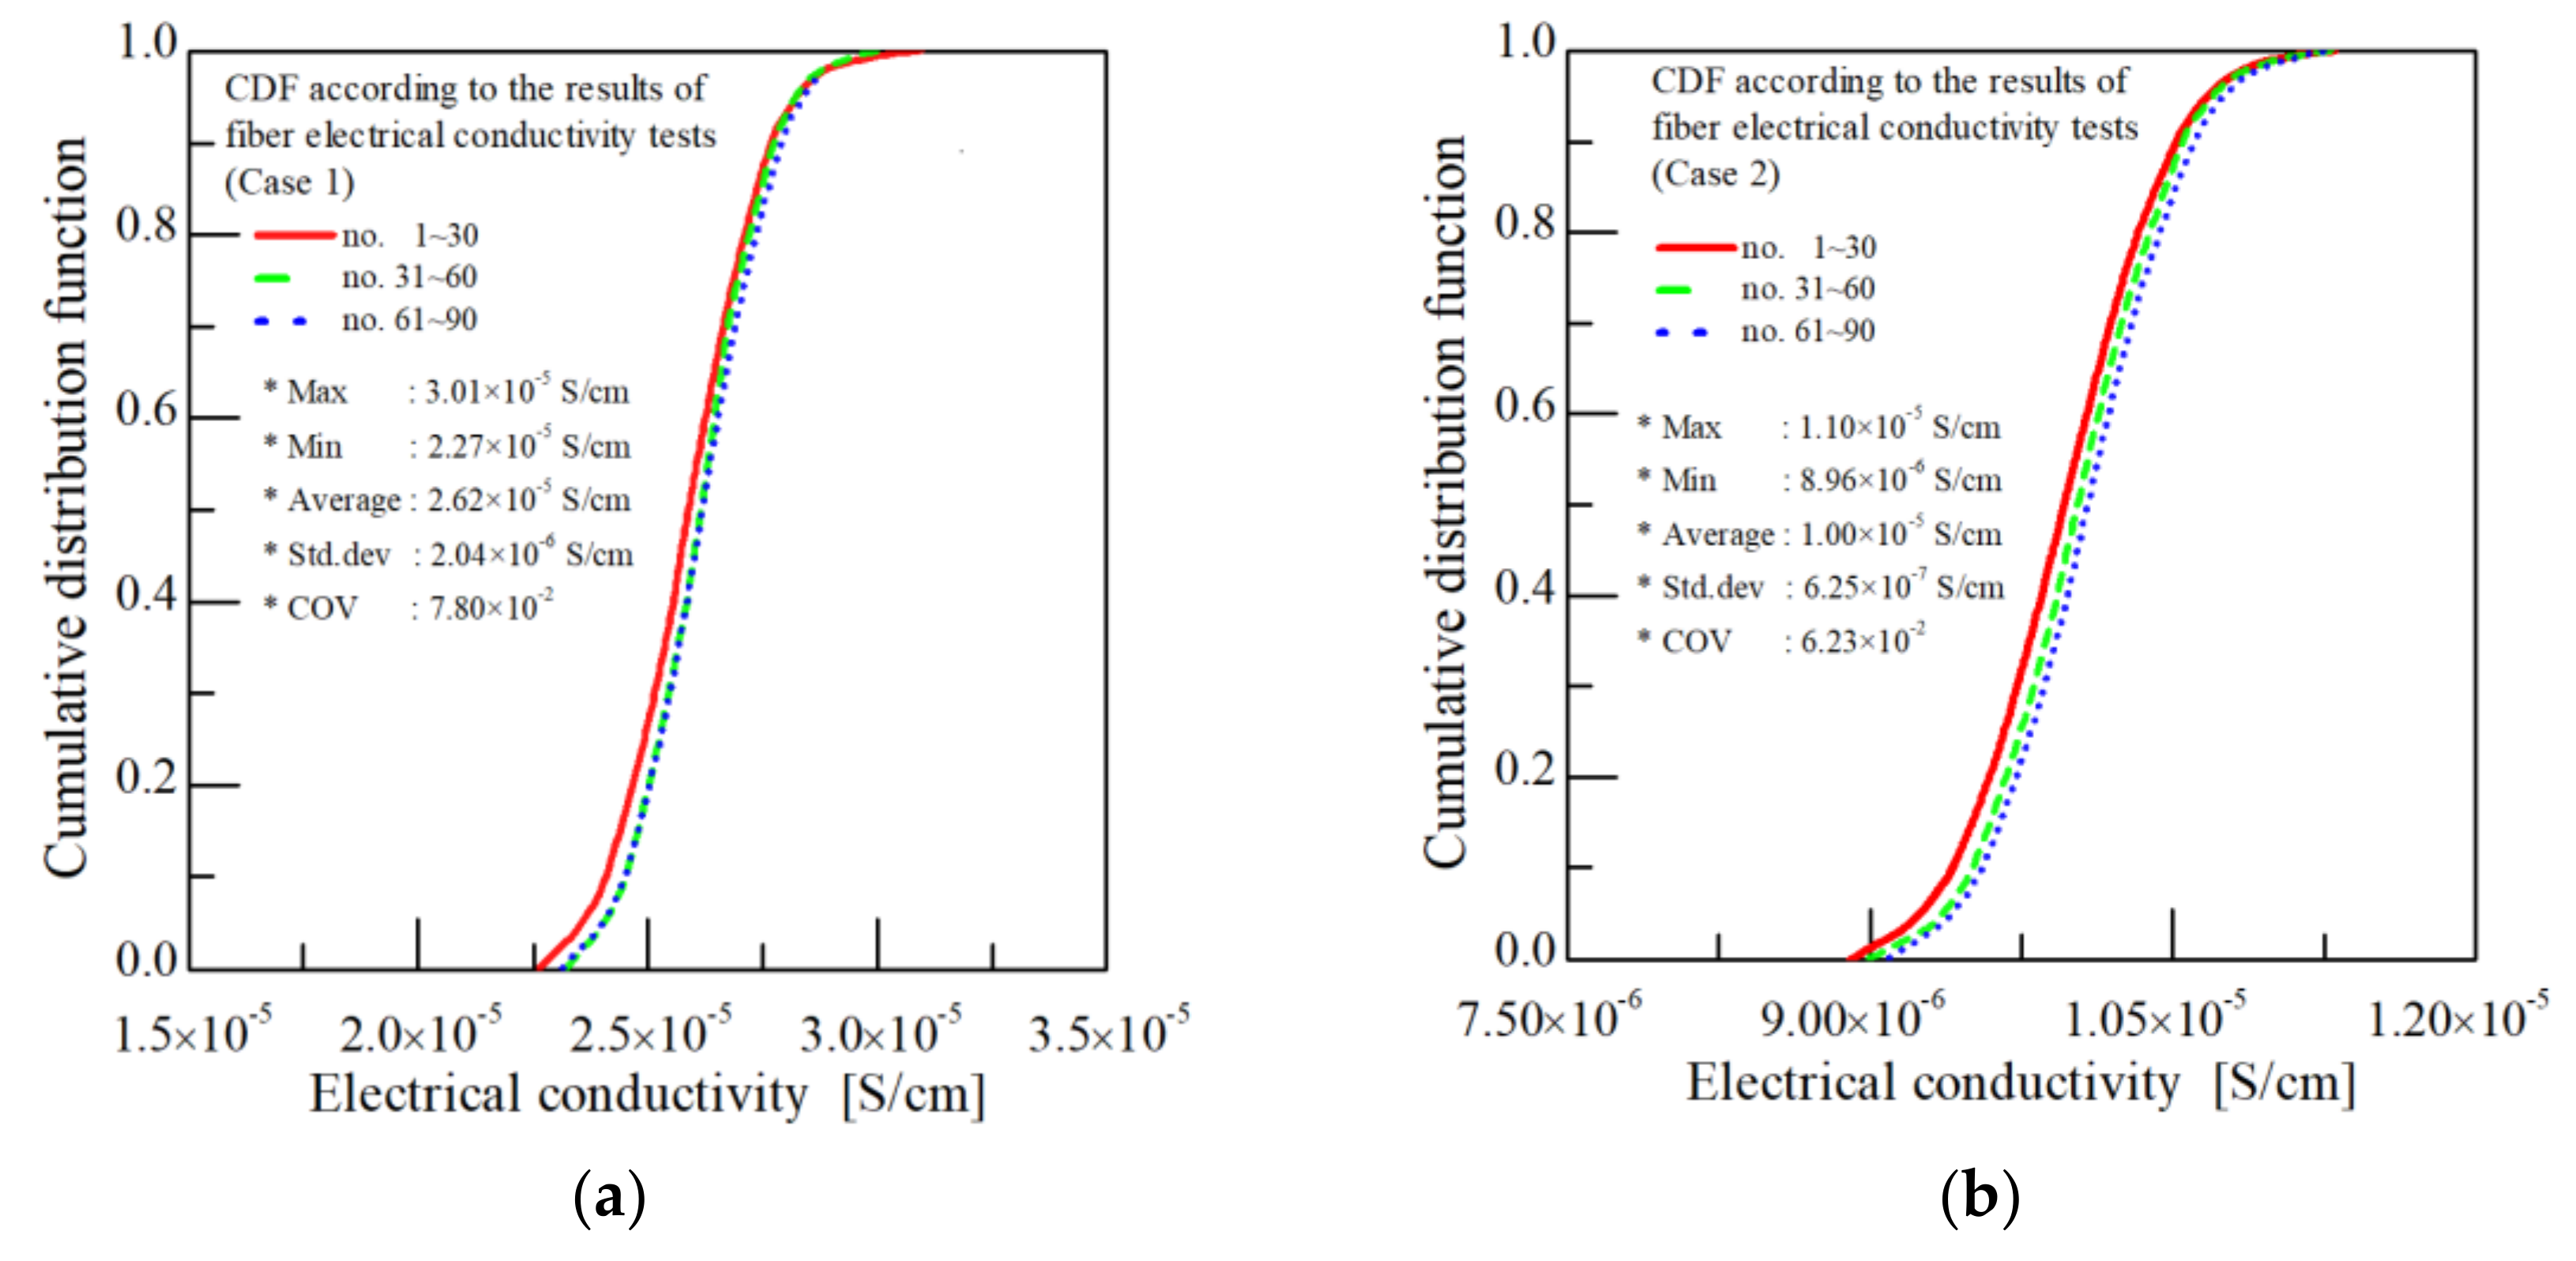
| No. | Electrical Conductivity (S/cm) | No. | Electrical Conductivity (S/cm) | No. | Electrical Conductivity (S/cm) |
|---|---|---|---|---|---|
| 1 | 1.05 × 10⁻⁵ | 31 | 9.71 × 10⁻⁶ | 61 | 1.08 × 10⁻⁵ |
| 2 | 8.96 × 10⁻⁶ | 32 | 1.01 × 10⁻⁵ | 62 | 9.80 × 10⁻⁶ |
| 3 | 9.49 × 10⁻⁶ | 33 | 1.06 × 10⁻⁵ | 63 | 9.44 × 10⁻⁶ |
| 4 | 1.08 × 10⁻⁶ | 34 | 1.03 × 10⁻⁵ | 64 | 9.72 × 10⁻⁶ |
| 5 | 1.01 × 10⁻⁶ | 35 | 9.67 × 10⁻⁶ | 65 | 1.01 × 10⁻⁵ |
| 30 | 1.09 × 10⁻⁵ | 60 | 9.67 × 10⁻⁶ | 90 | 1.05 × 10⁻⁵ |
| Max | 1.10 × 10⁻⁵ | Max | 1.10 × 10⁻⁵ | Max | 1.09 × 10⁻⁵ |
| Min | 8.96 × 10⁻⁶ | Min | 8.97 × 10⁻⁶ | Min | 9.01 × 10⁻⁶ |
| Average | 1.00 × 10⁻⁵ | Average | 9.95 × 10⁻⁶ | Average | 1.00 × 10⁻⁵ |
| Std. dev | 7.06 × 10⁻⁷ | Std. dev | 6.21 × 10⁻⁷ | Std. dev | 5.58 × 10⁻⁷ |
| COV | 7.03 × 10⁻² | COV | 6.23 × 10⁻² | COV | 5.55 × 10⁻² |
| Total max(No.1~No.90) (S/cm) | 1.10 × 10⁻⁵ | ||||
| Total min(No.1~No.90) (S/cm) | 8.96 × 10⁻⁶ | ||||
| Total average(No.1~No.90) (S/cm) | 1.00 × 10⁻⁵ | ||||
| Total std. dev(No.1~No.90) (S/cm) | 6.25 × 10⁻⁷ | ||||
| Total COV(No.1~No.90) | 6.24 × 10⁻² | ||||
| Case | Electrical Conductivity | ||||
|---|---|---|---|---|---|
| Max (S/cm) | Min (S/cm) | Average (S/cm) | Std. dev (S/cm) | COV | |
| 1 | 3.01 × 10⁻⁵ | 2.27 × 10⁻⁵ | 2.62 × 10⁻⁵ | 2.04 × 10⁻⁶ | 7.80 × 10⁻² |
| 2 | 1.10 × 10⁻⁵ | 8.96 × 10⁻⁶ | 1.00 × 10⁻⁵ | 6.25 × 10⁻⁷ | 6.24 × 10⁻² |
| 3 | 1.09 × 10⁻⁵ | 8.53 × 10⁻⁶ | 9.64 × 10⁻⁶ | 6.50 × 10⁻⁷ | 6.74 × 10⁻² |
| 4 | 1.74 × 10⁻⁵ | 1.30 × 10⁻⁵ | 1.51 × 10⁻⁵ | 1.15 × 10⁻⁶ | 7.61 × 10⁻² |
| 5 | 1.56 × 10⁻⁵ | 1.10 × 10⁻⁵ | 1.31 × 10⁻⁵ | 1.33 × 10⁻⁶ | 1.02 × 10⁻¹ |
| 6 | 3.66 × 10⁻⁵ | 2.51 × 10⁻⁵ | 3.04 × 10⁻⁵ | 3.33 × 10⁻⁶ | 1.10 × 10⁻¹ |
| 7 | 4.36 × 10⁻⁵ | 3.43 × 10⁻⁵ | 3.91 × 10⁻⁵ | 2.90 × 10⁻⁶ | 7.41 × 10⁻² |
| 8 | 1.26 × 10⁻⁵ | 9.72 × 10⁻⁶ | 1.11 × 10⁻⁵ | 9.03 × 10⁻⁷ | 8.11 × 10⁻² |
Publisher’s Note: MDPI stays neutral with regard to jurisdictional claims in published maps and institutional affiliations. |
© 2021 by the authors. Licensee MDPI, Basel, Switzerland. This article is an open access article distributed under the terms and conditions of the Creative Commons Attribution (CC BY) license (https://creativecommons.org/licenses/by/4.0/).
Share and Cite
Kang, K.-W.; Choi, C.-W.; Jin, J.-W. A Wet-Spinning Process for Producing Carbon Nanotube/Polyvinylidene Fluoride Fibers Having Highly Consistent Electrical and Mechanical Properties. Polymers 2021, 13, 4048. https://doi.org/10.3390/polym13224048
Kang K-W, Choi C-W, Jin J-W. A Wet-Spinning Process for Producing Carbon Nanotube/Polyvinylidene Fluoride Fibers Having Highly Consistent Electrical and Mechanical Properties. Polymers. 2021; 13(22):4048. https://doi.org/10.3390/polym13224048
Chicago/Turabian StyleKang, Ki-Weon, Chan-Woong Choi, and Ji-Won Jin. 2021. "A Wet-Spinning Process for Producing Carbon Nanotube/Polyvinylidene Fluoride Fibers Having Highly Consistent Electrical and Mechanical Properties" Polymers 13, no. 22: 4048. https://doi.org/10.3390/polym13224048