
Kinetics of the Thermal Degradation of Poly(lactic acid) and Polyamide Bioblends


Abstract
:1. Introduction
2. Theoretical Background
3. Materials and Methods
3.1. Materials
3.2. Reactive Extrusion and Bioblend Preparation
3.3. Thermal Characterization
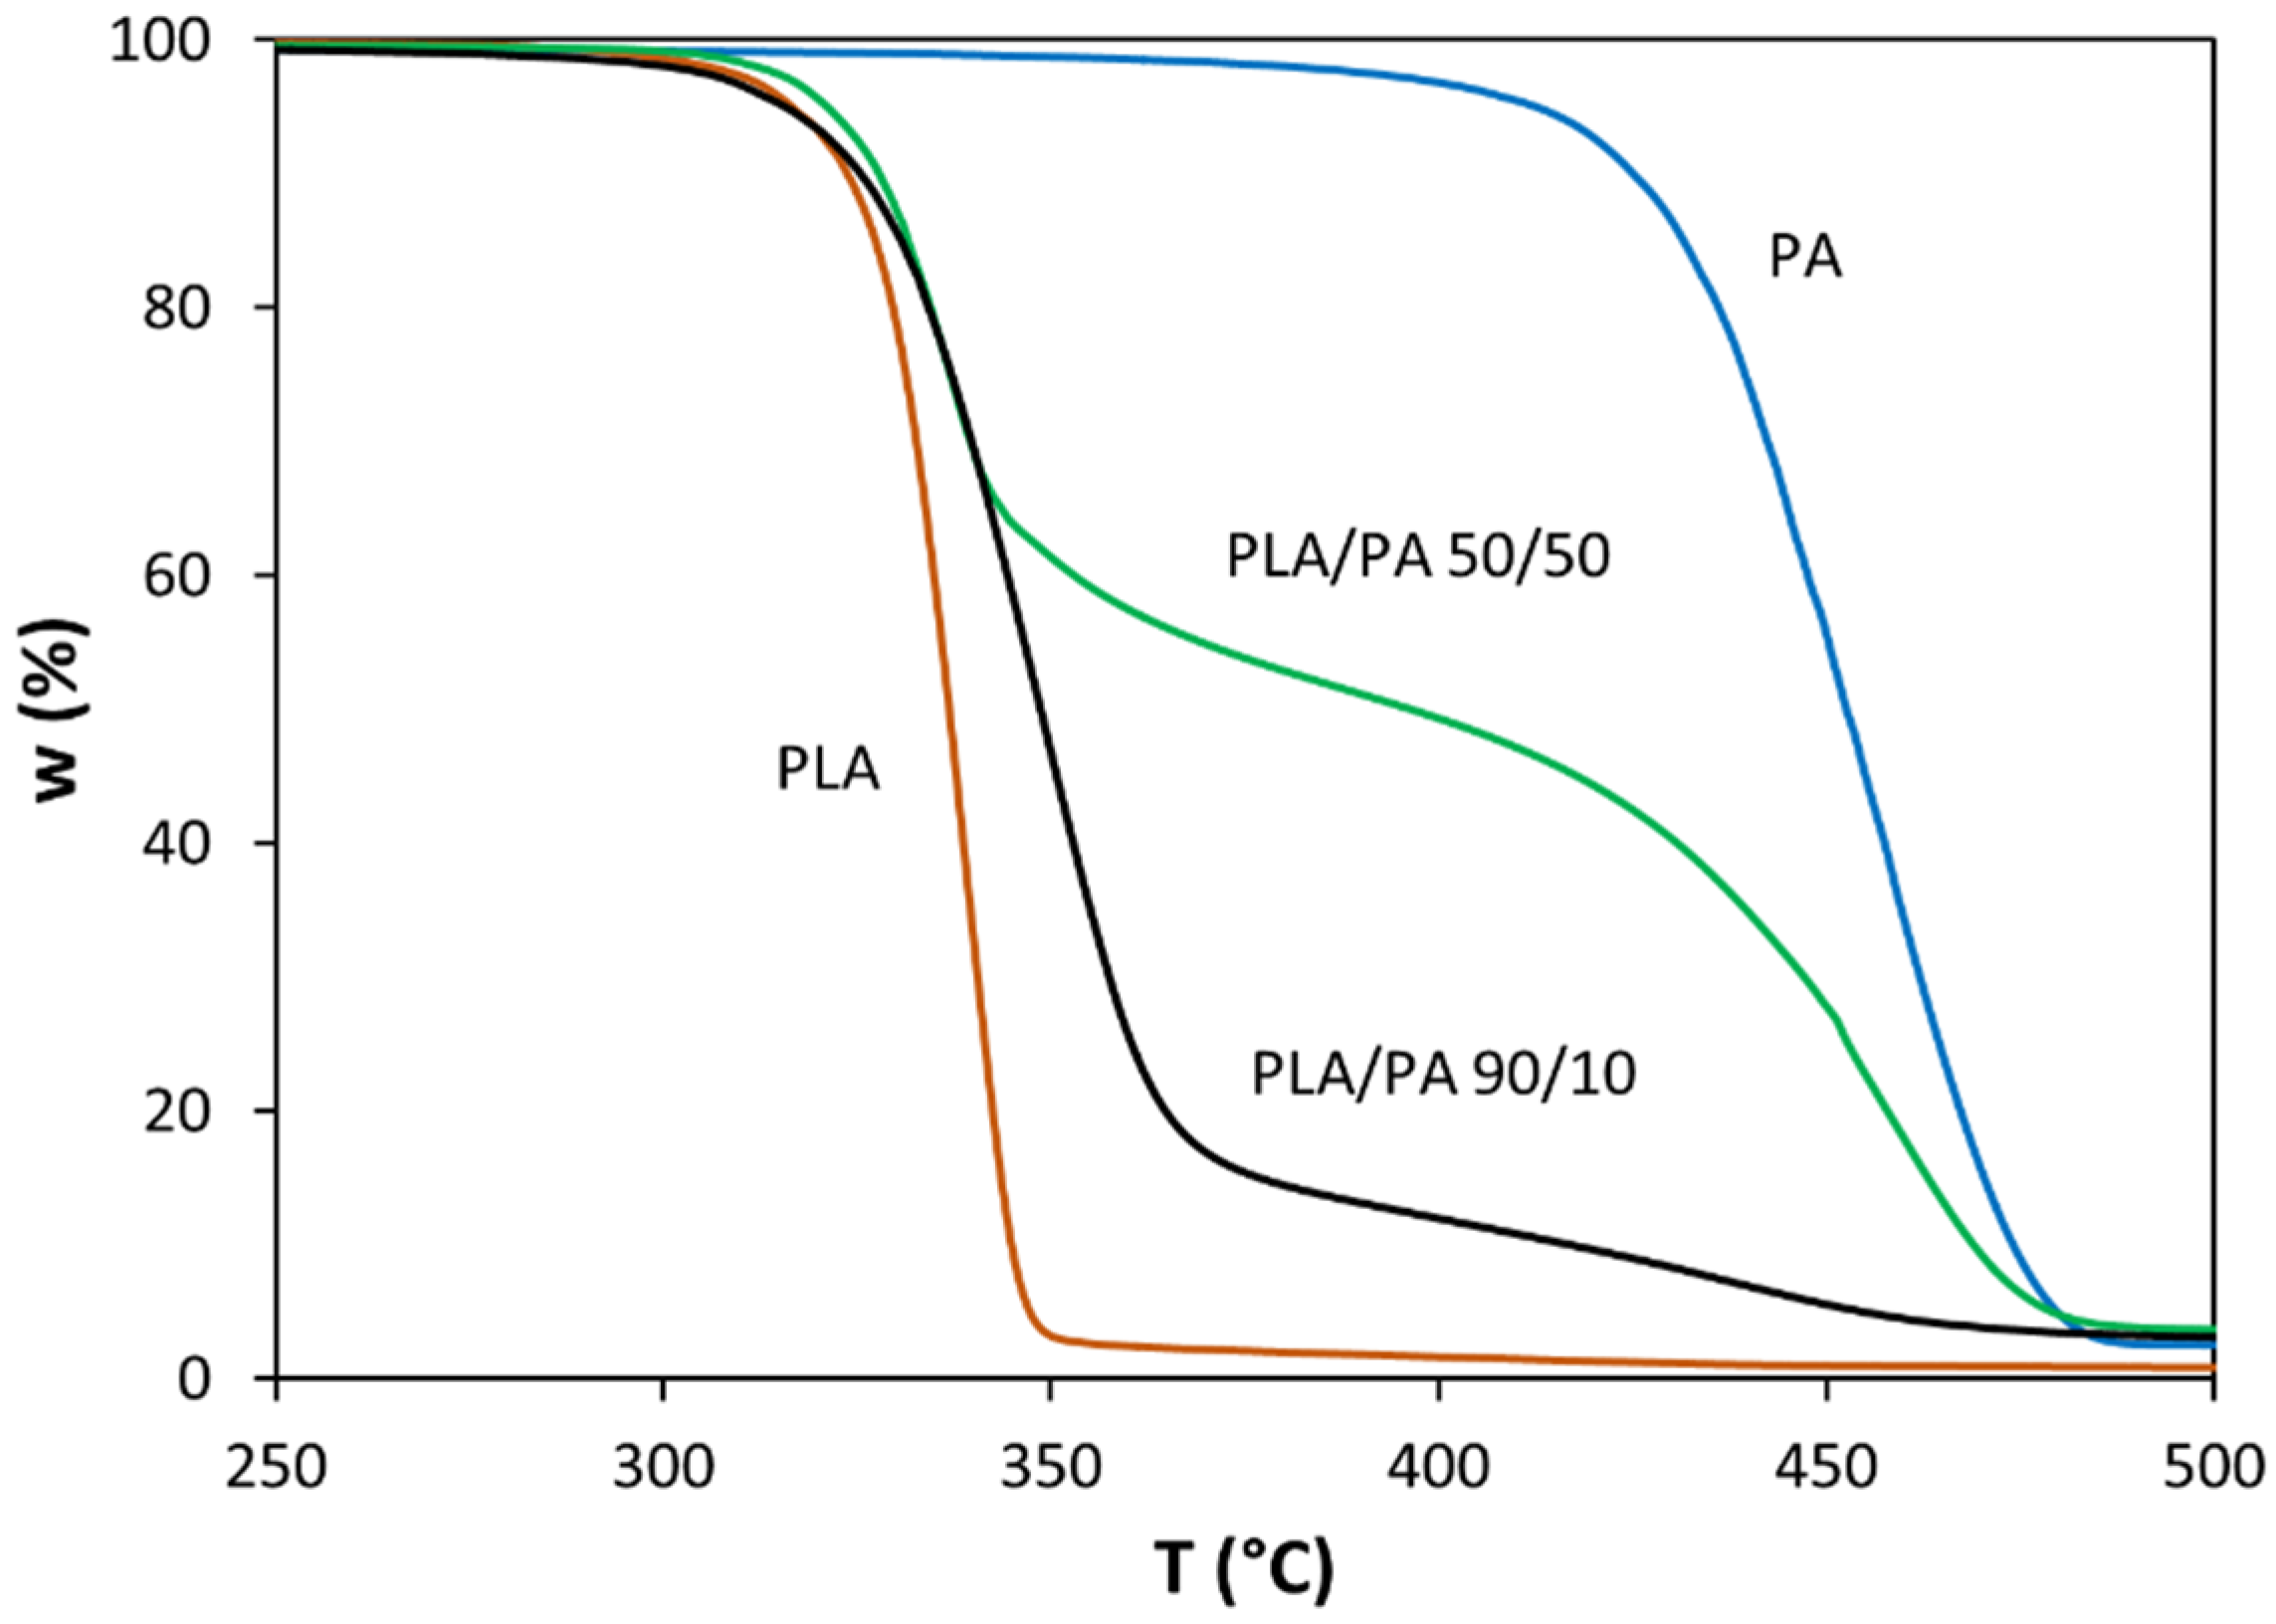
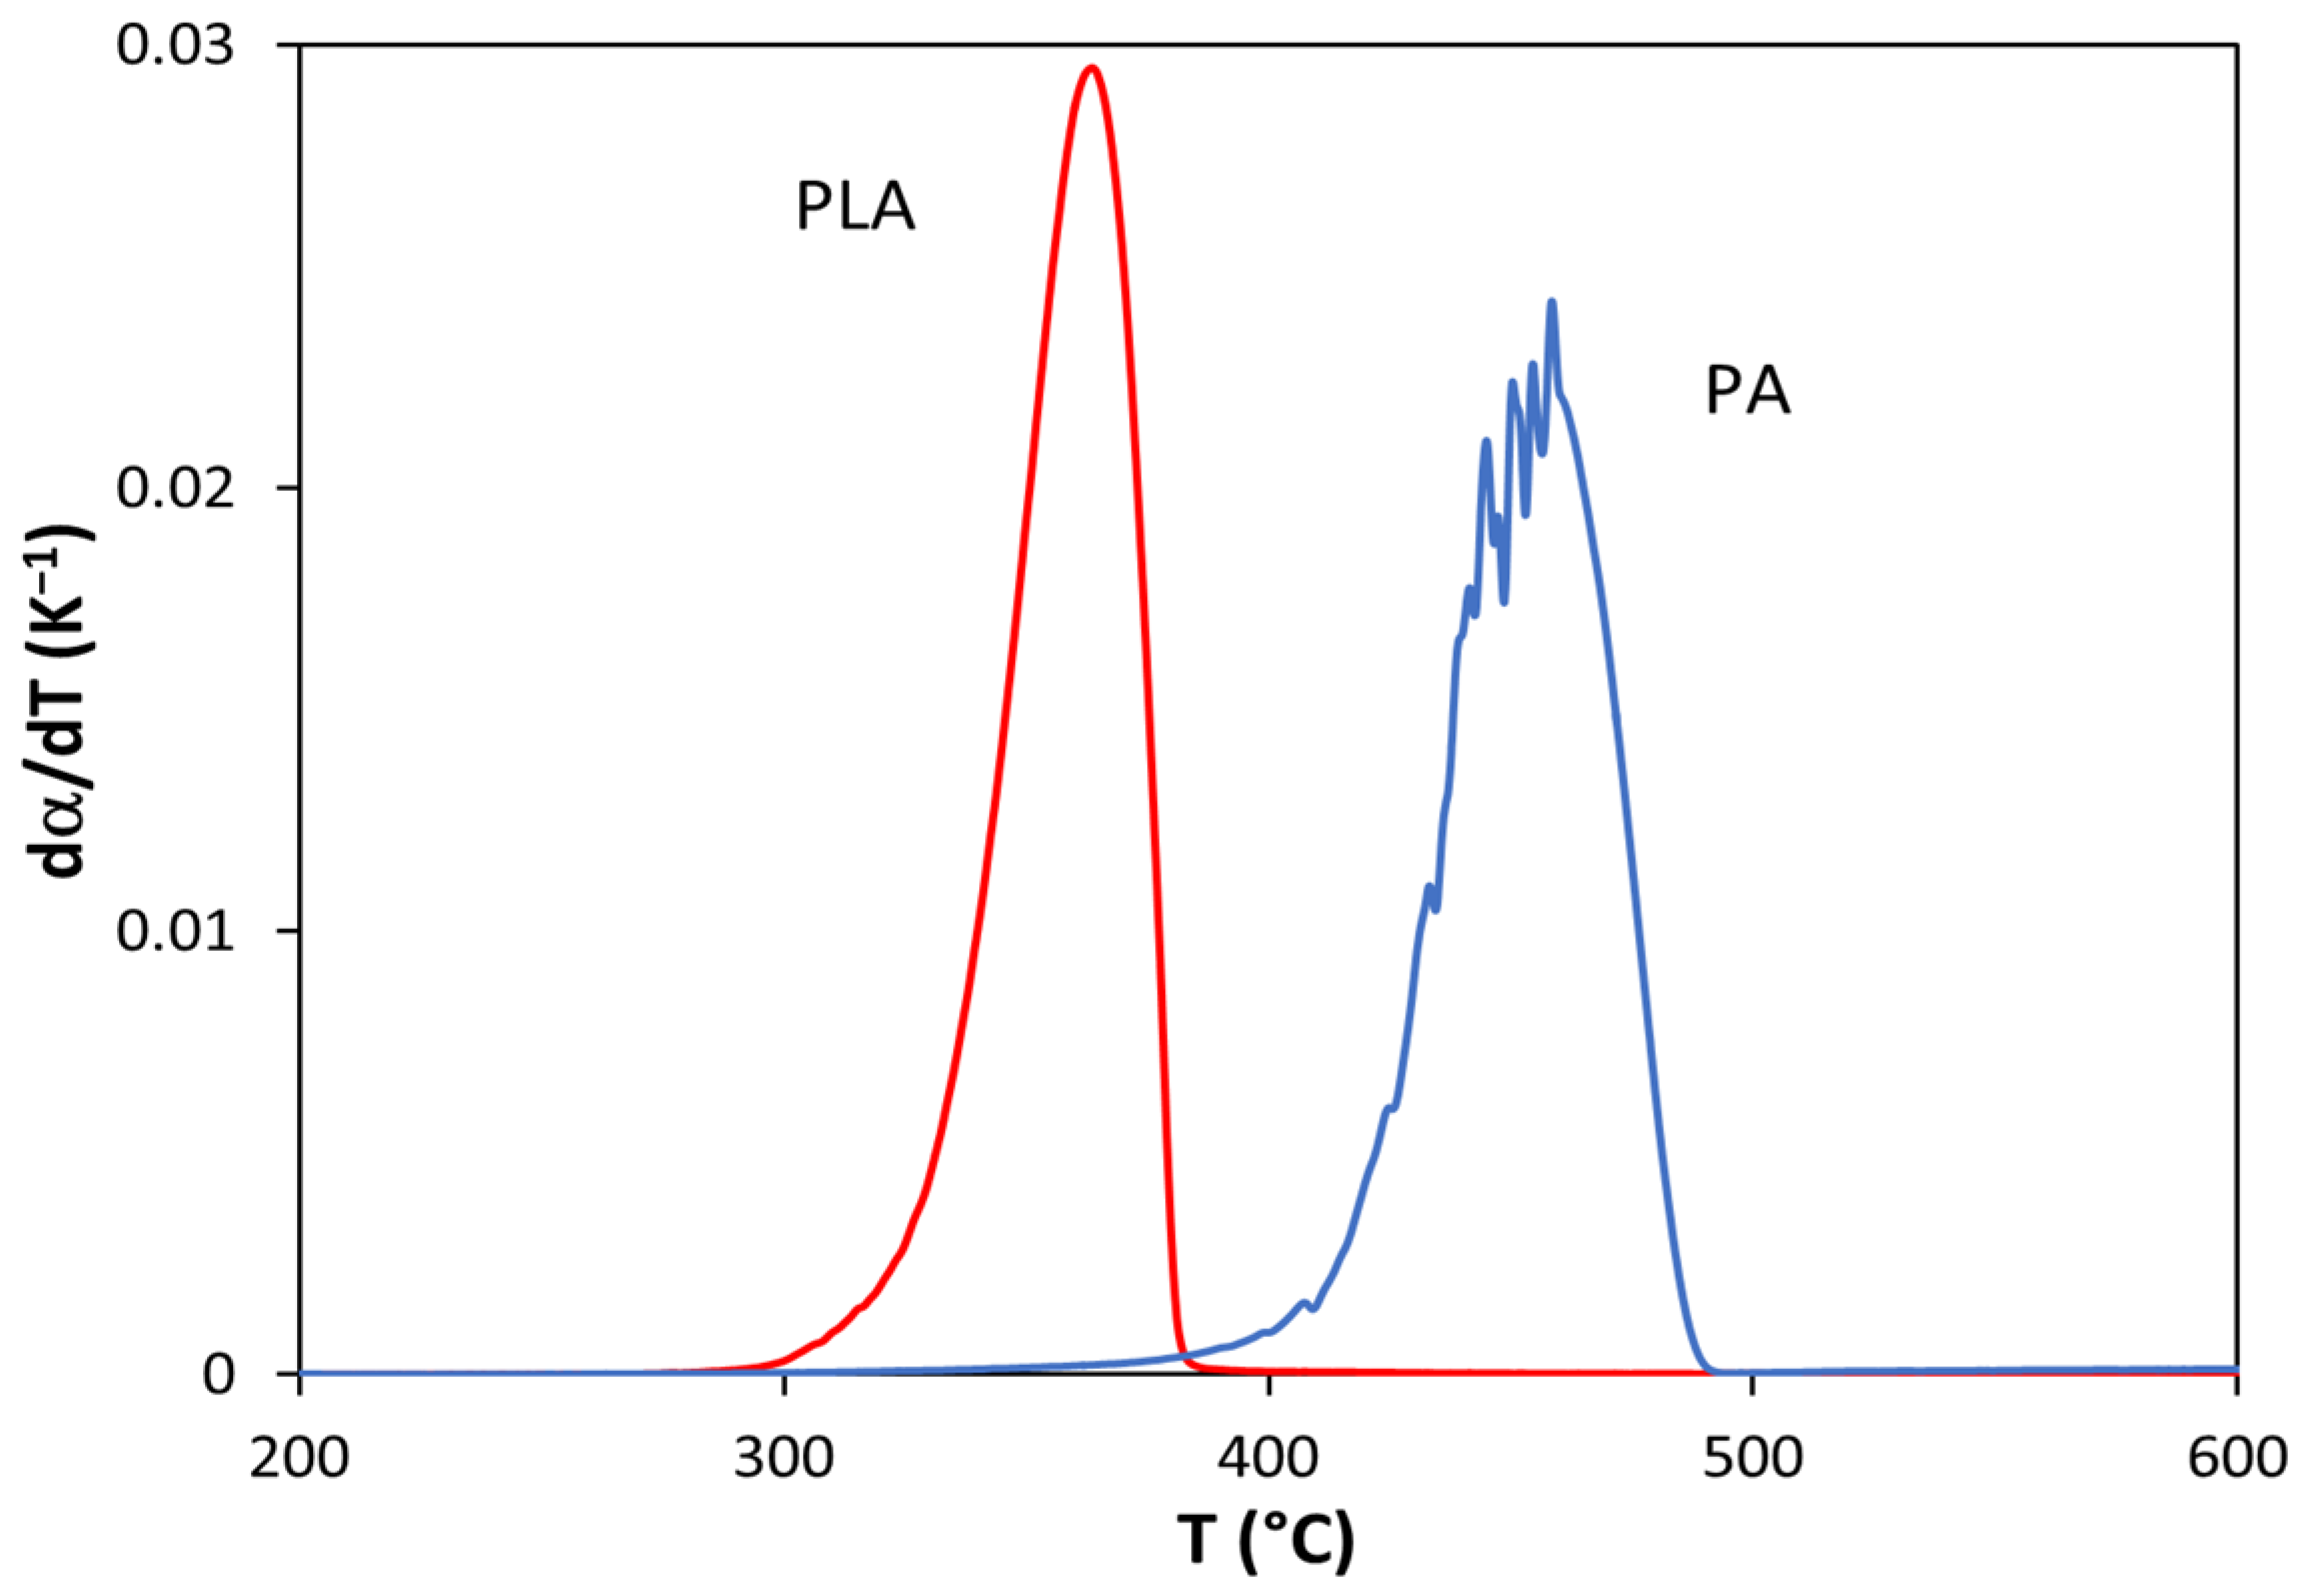
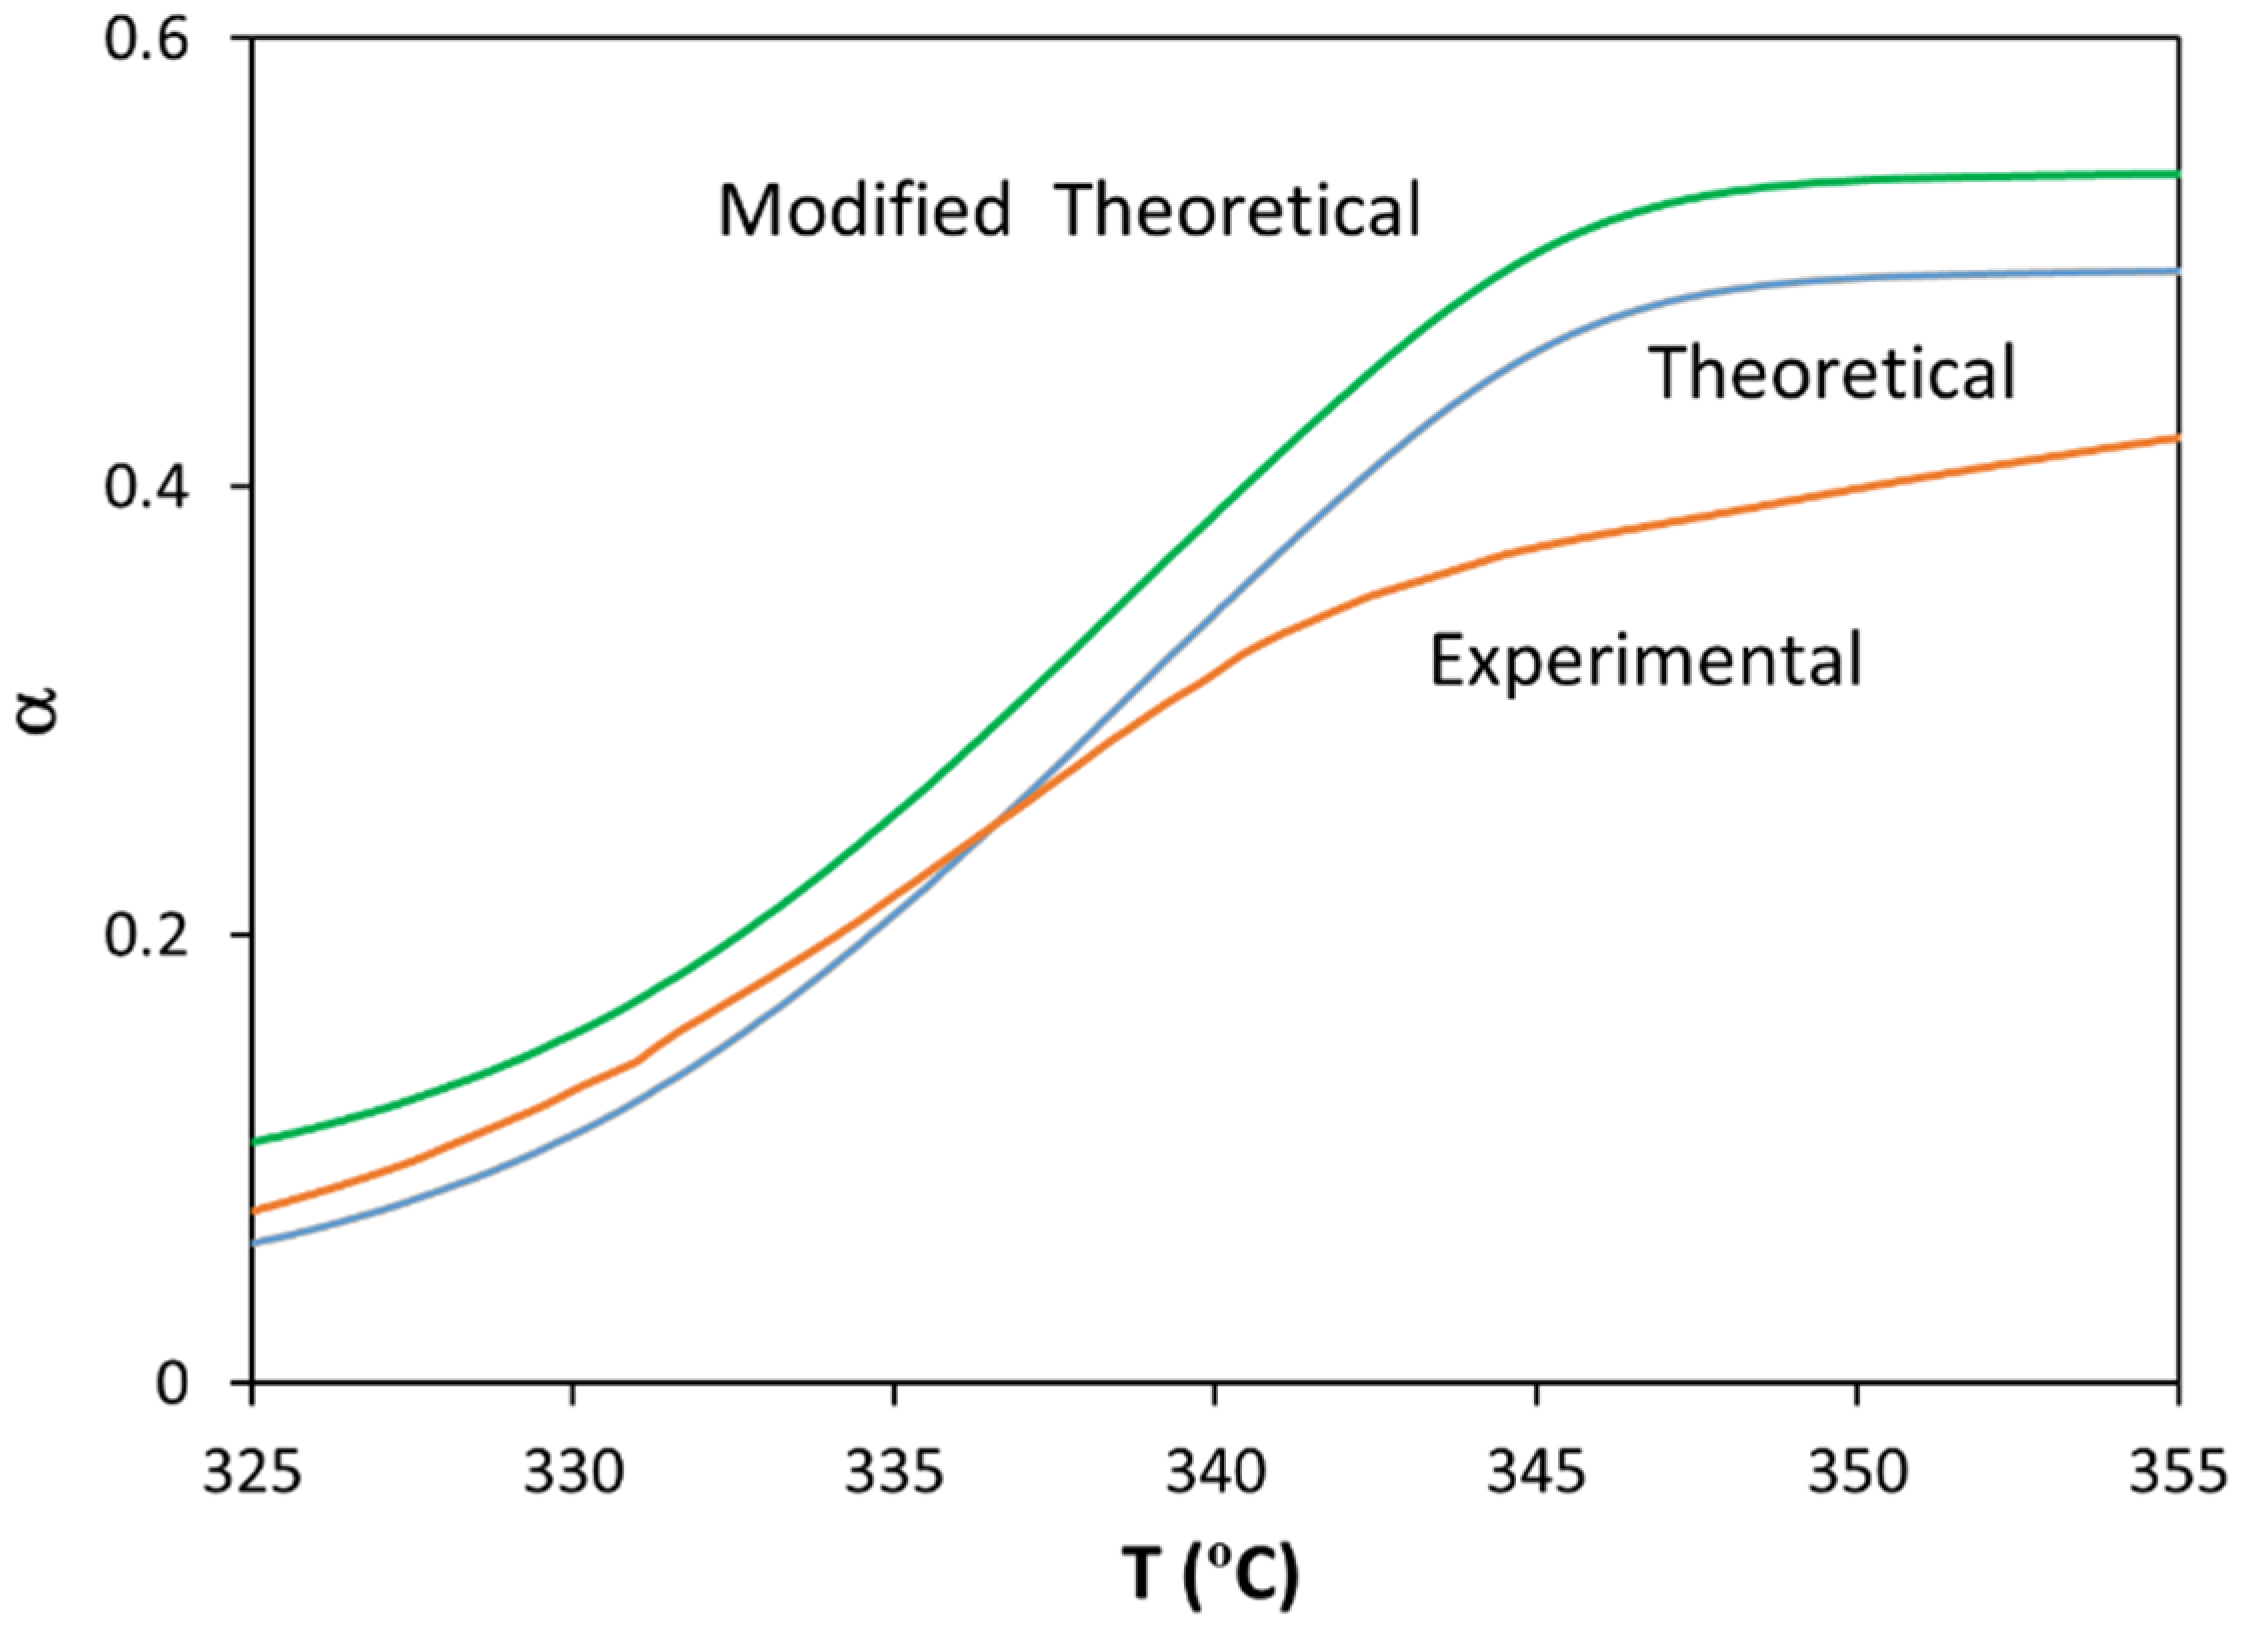
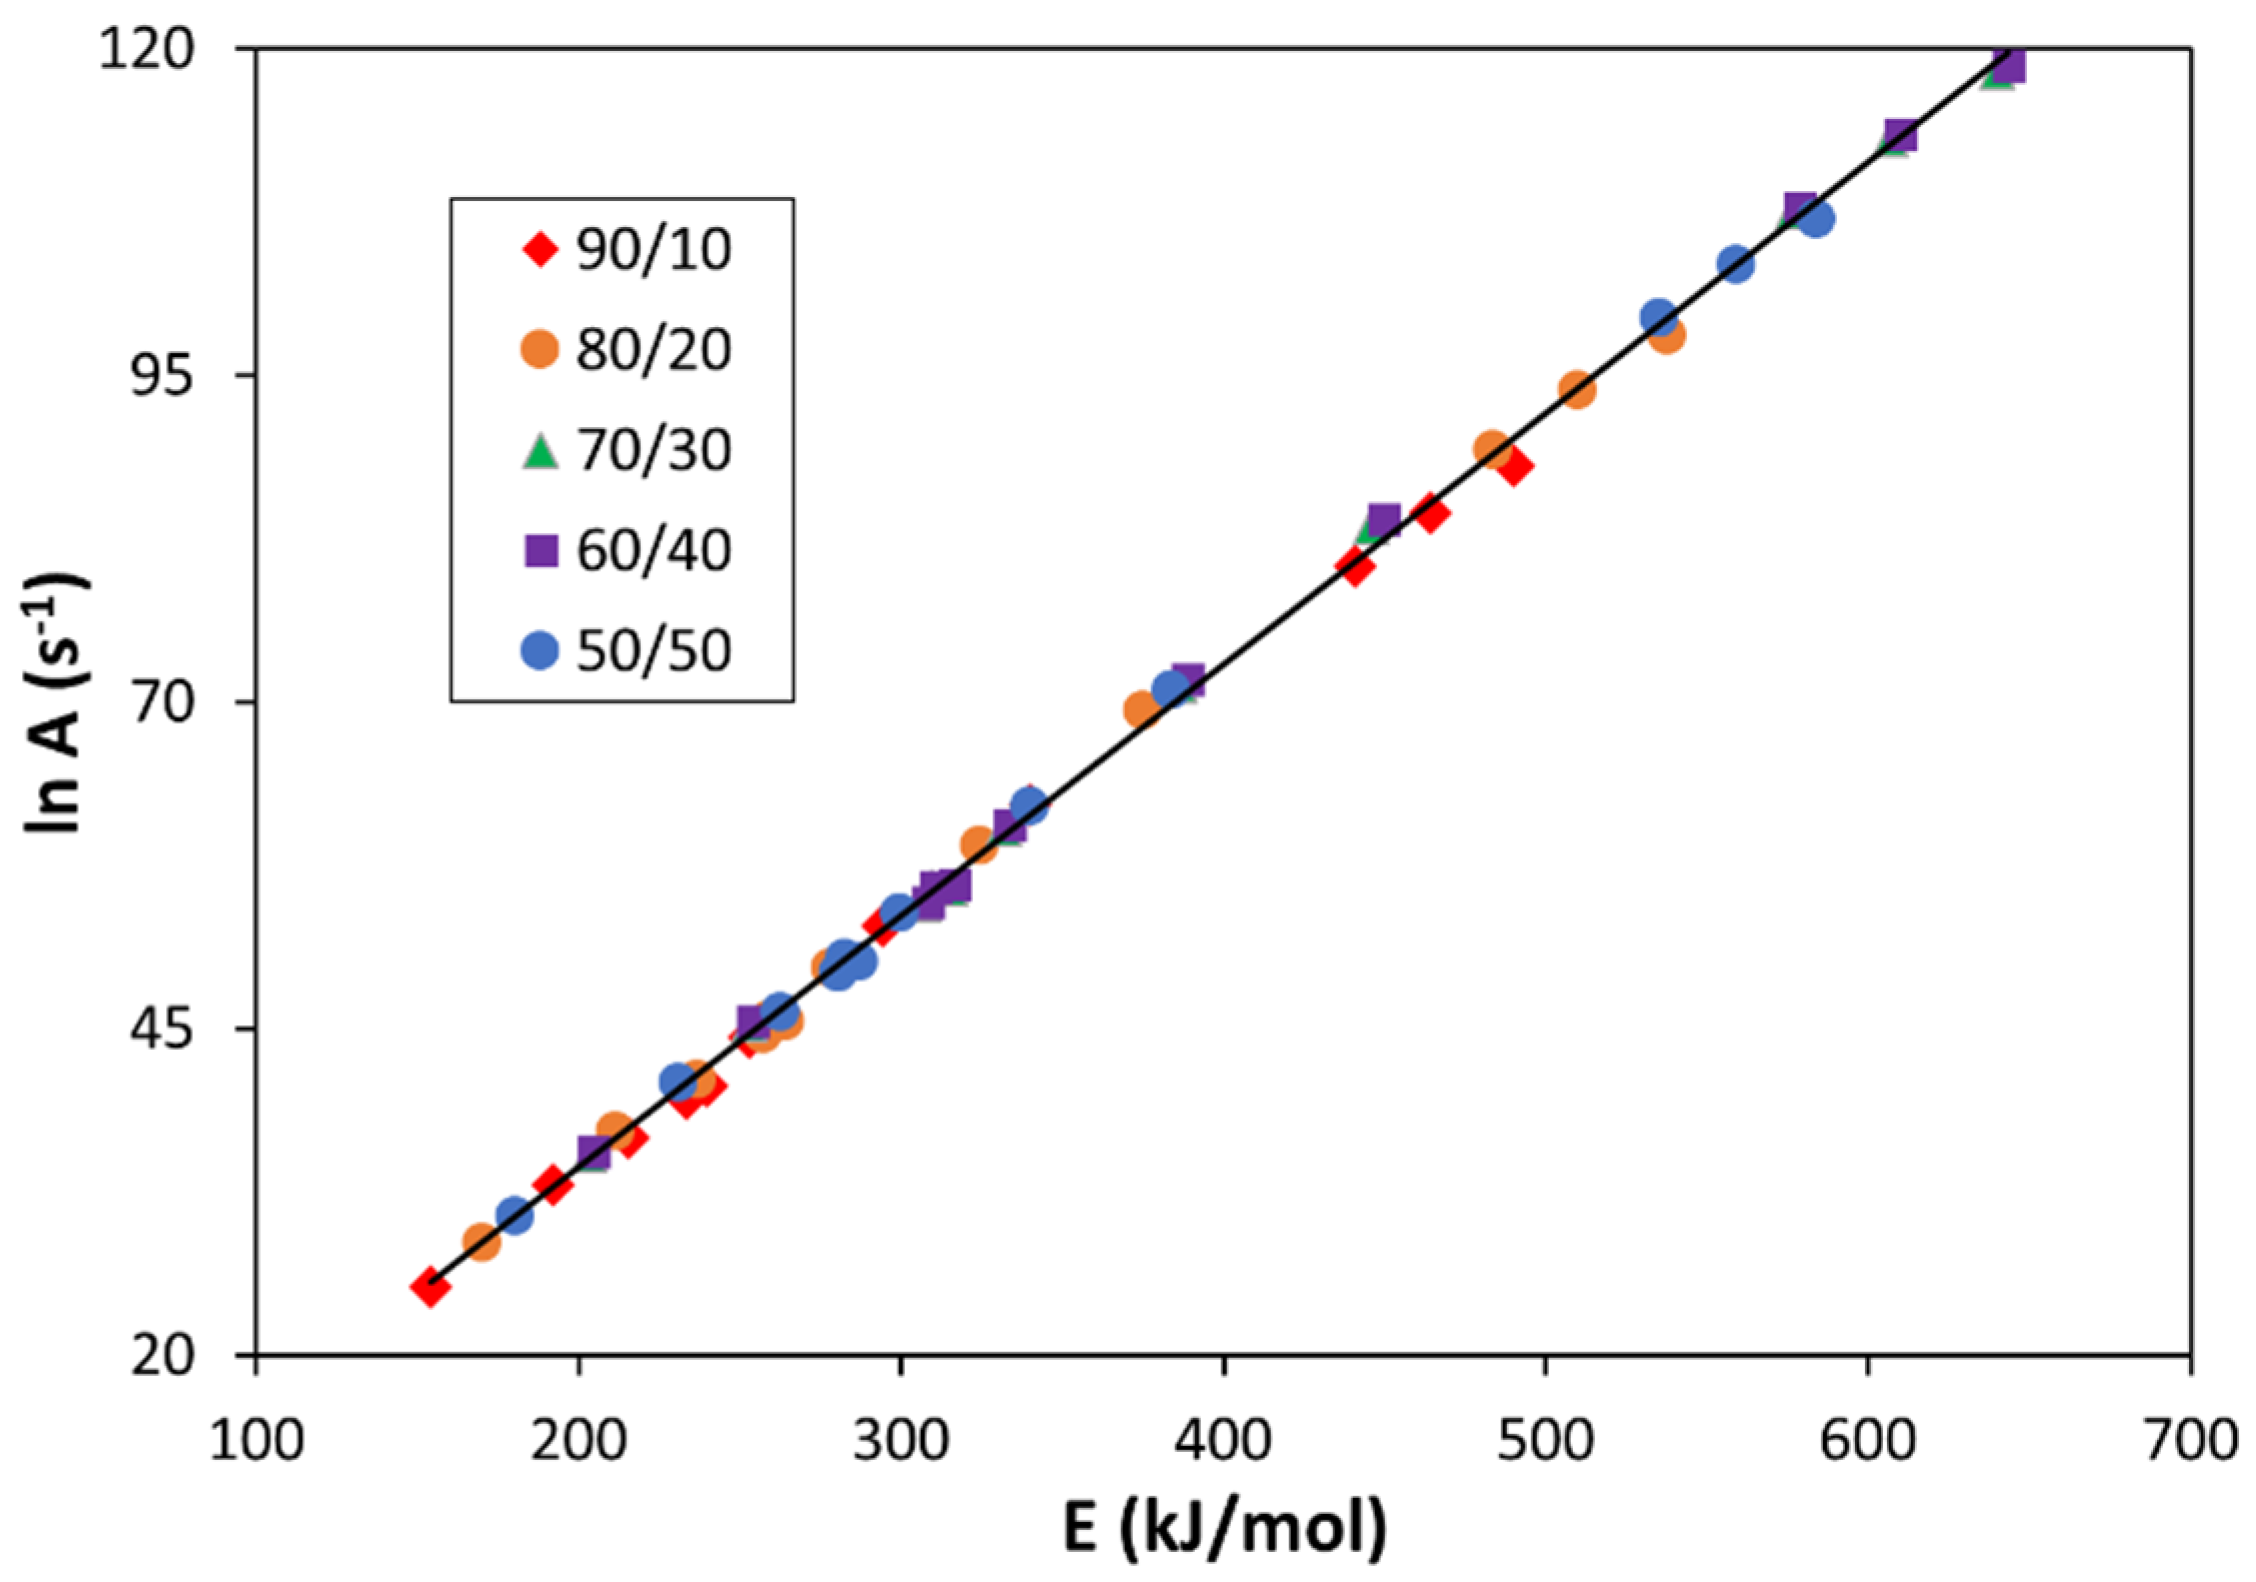
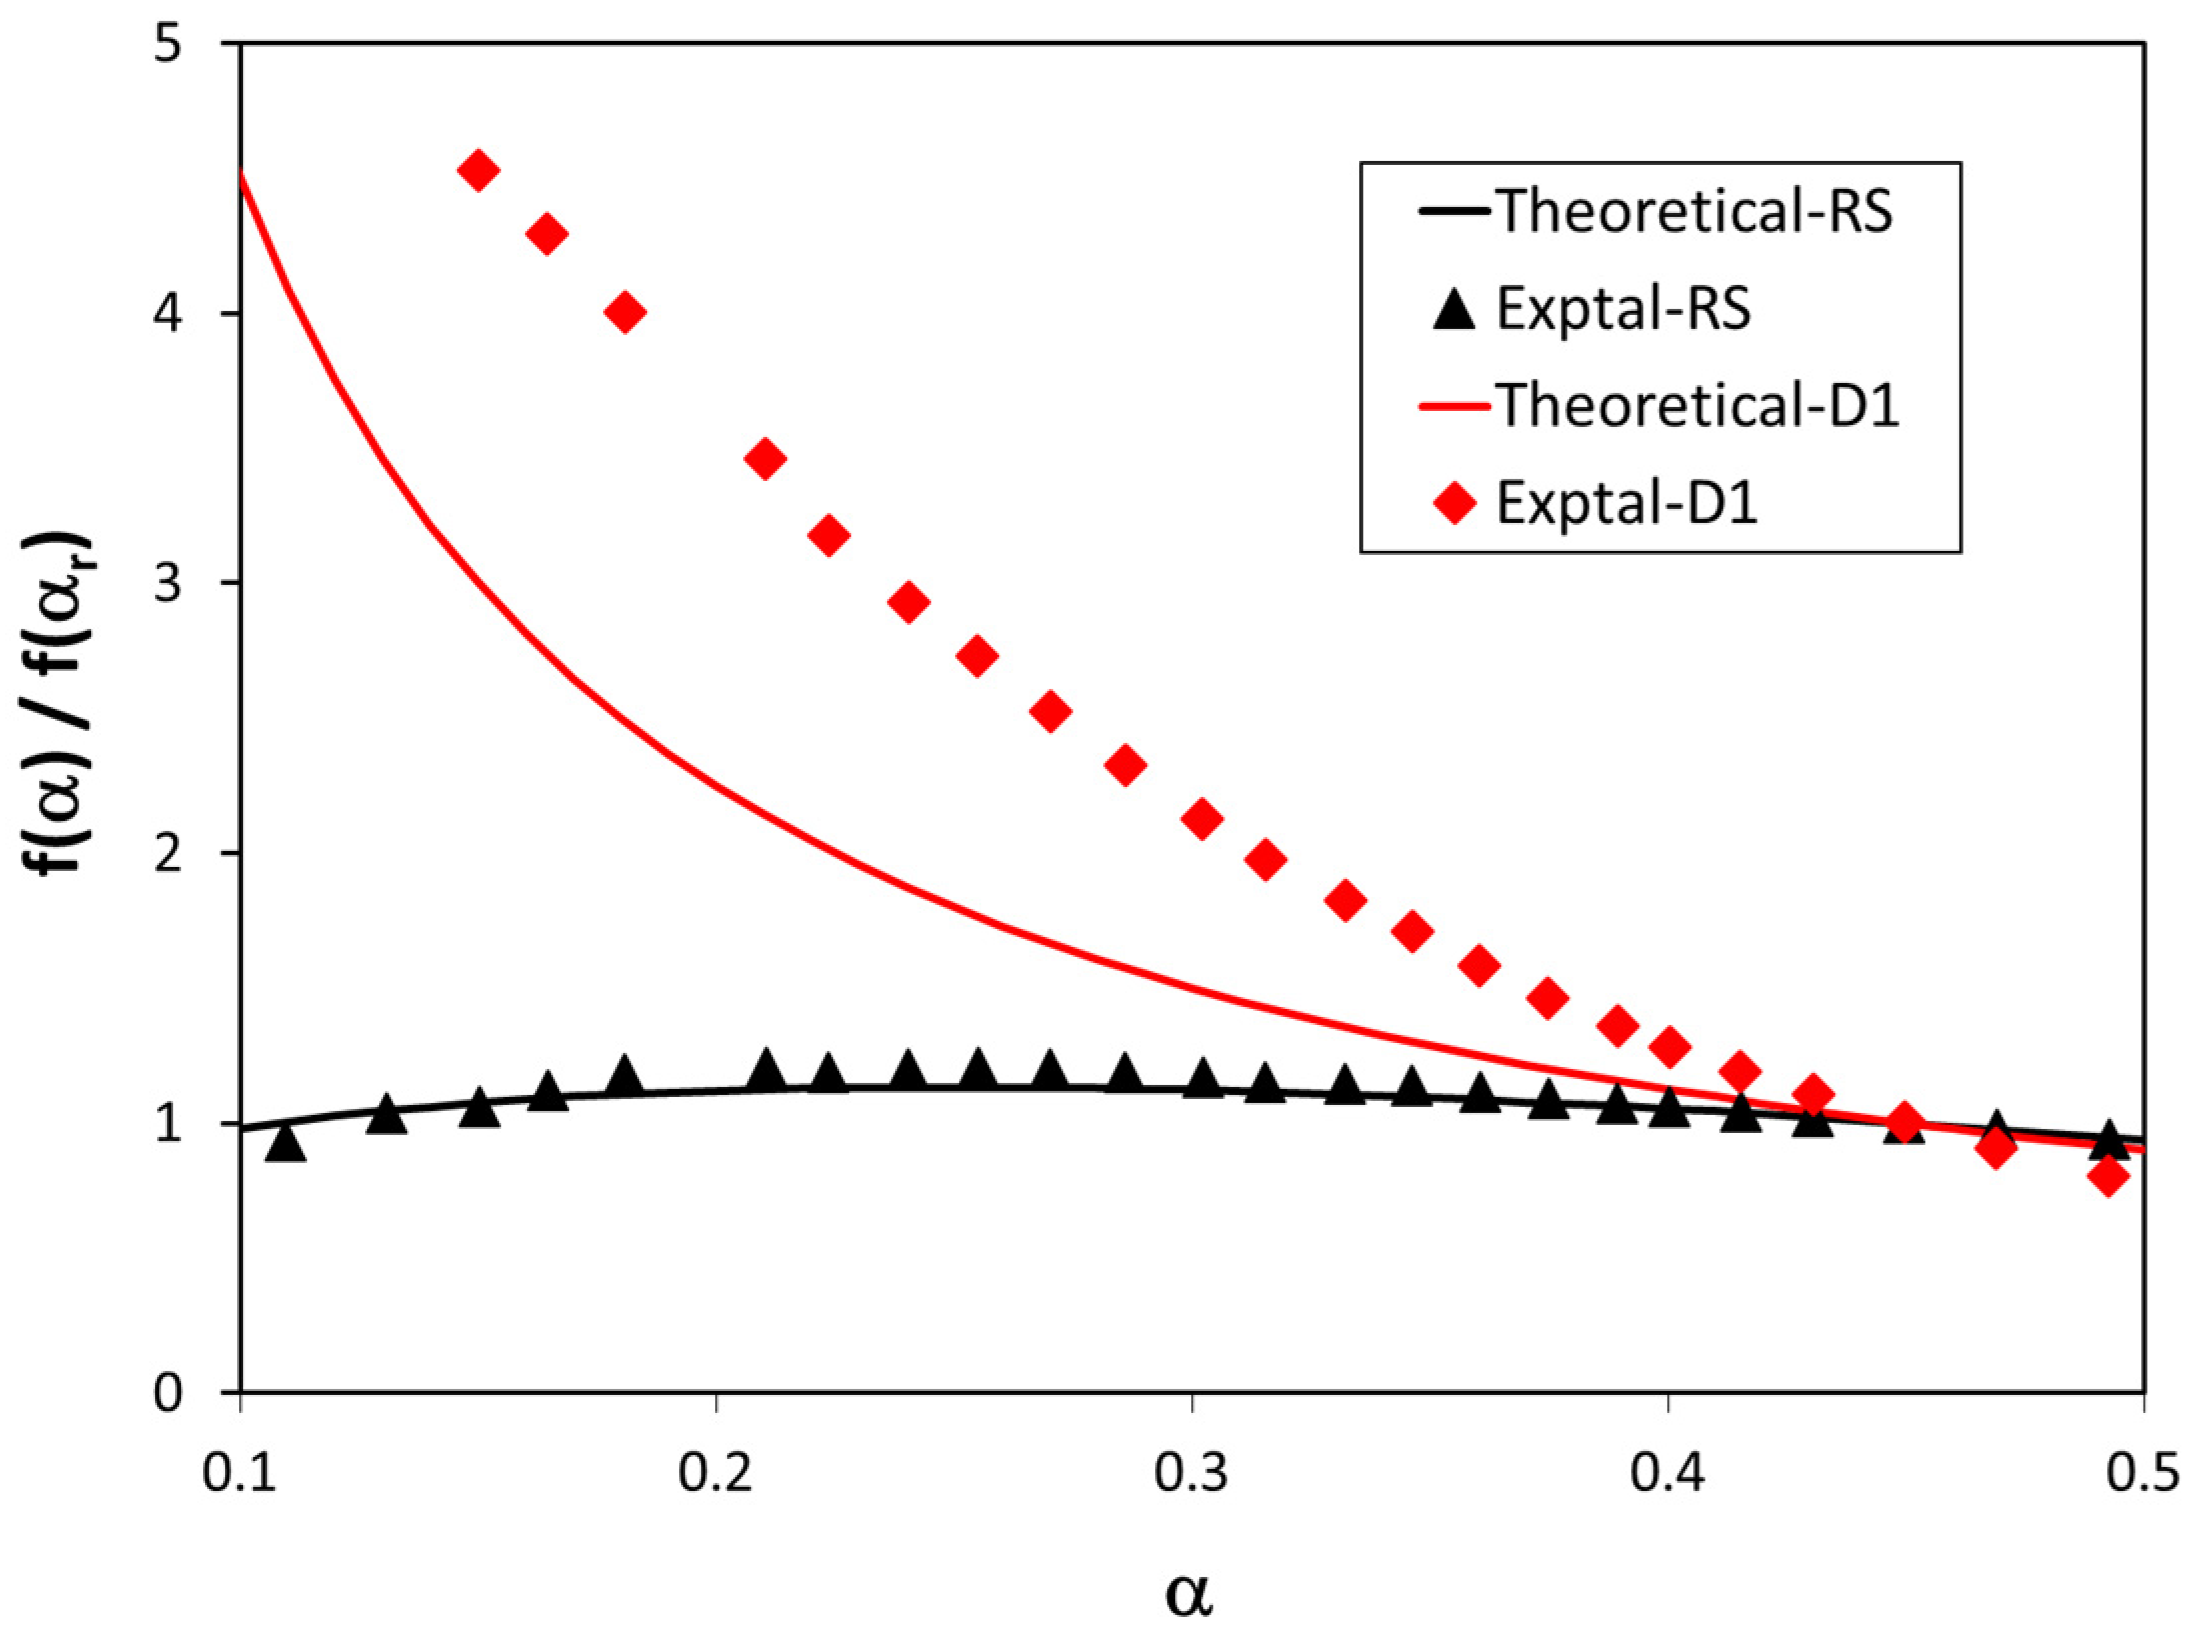
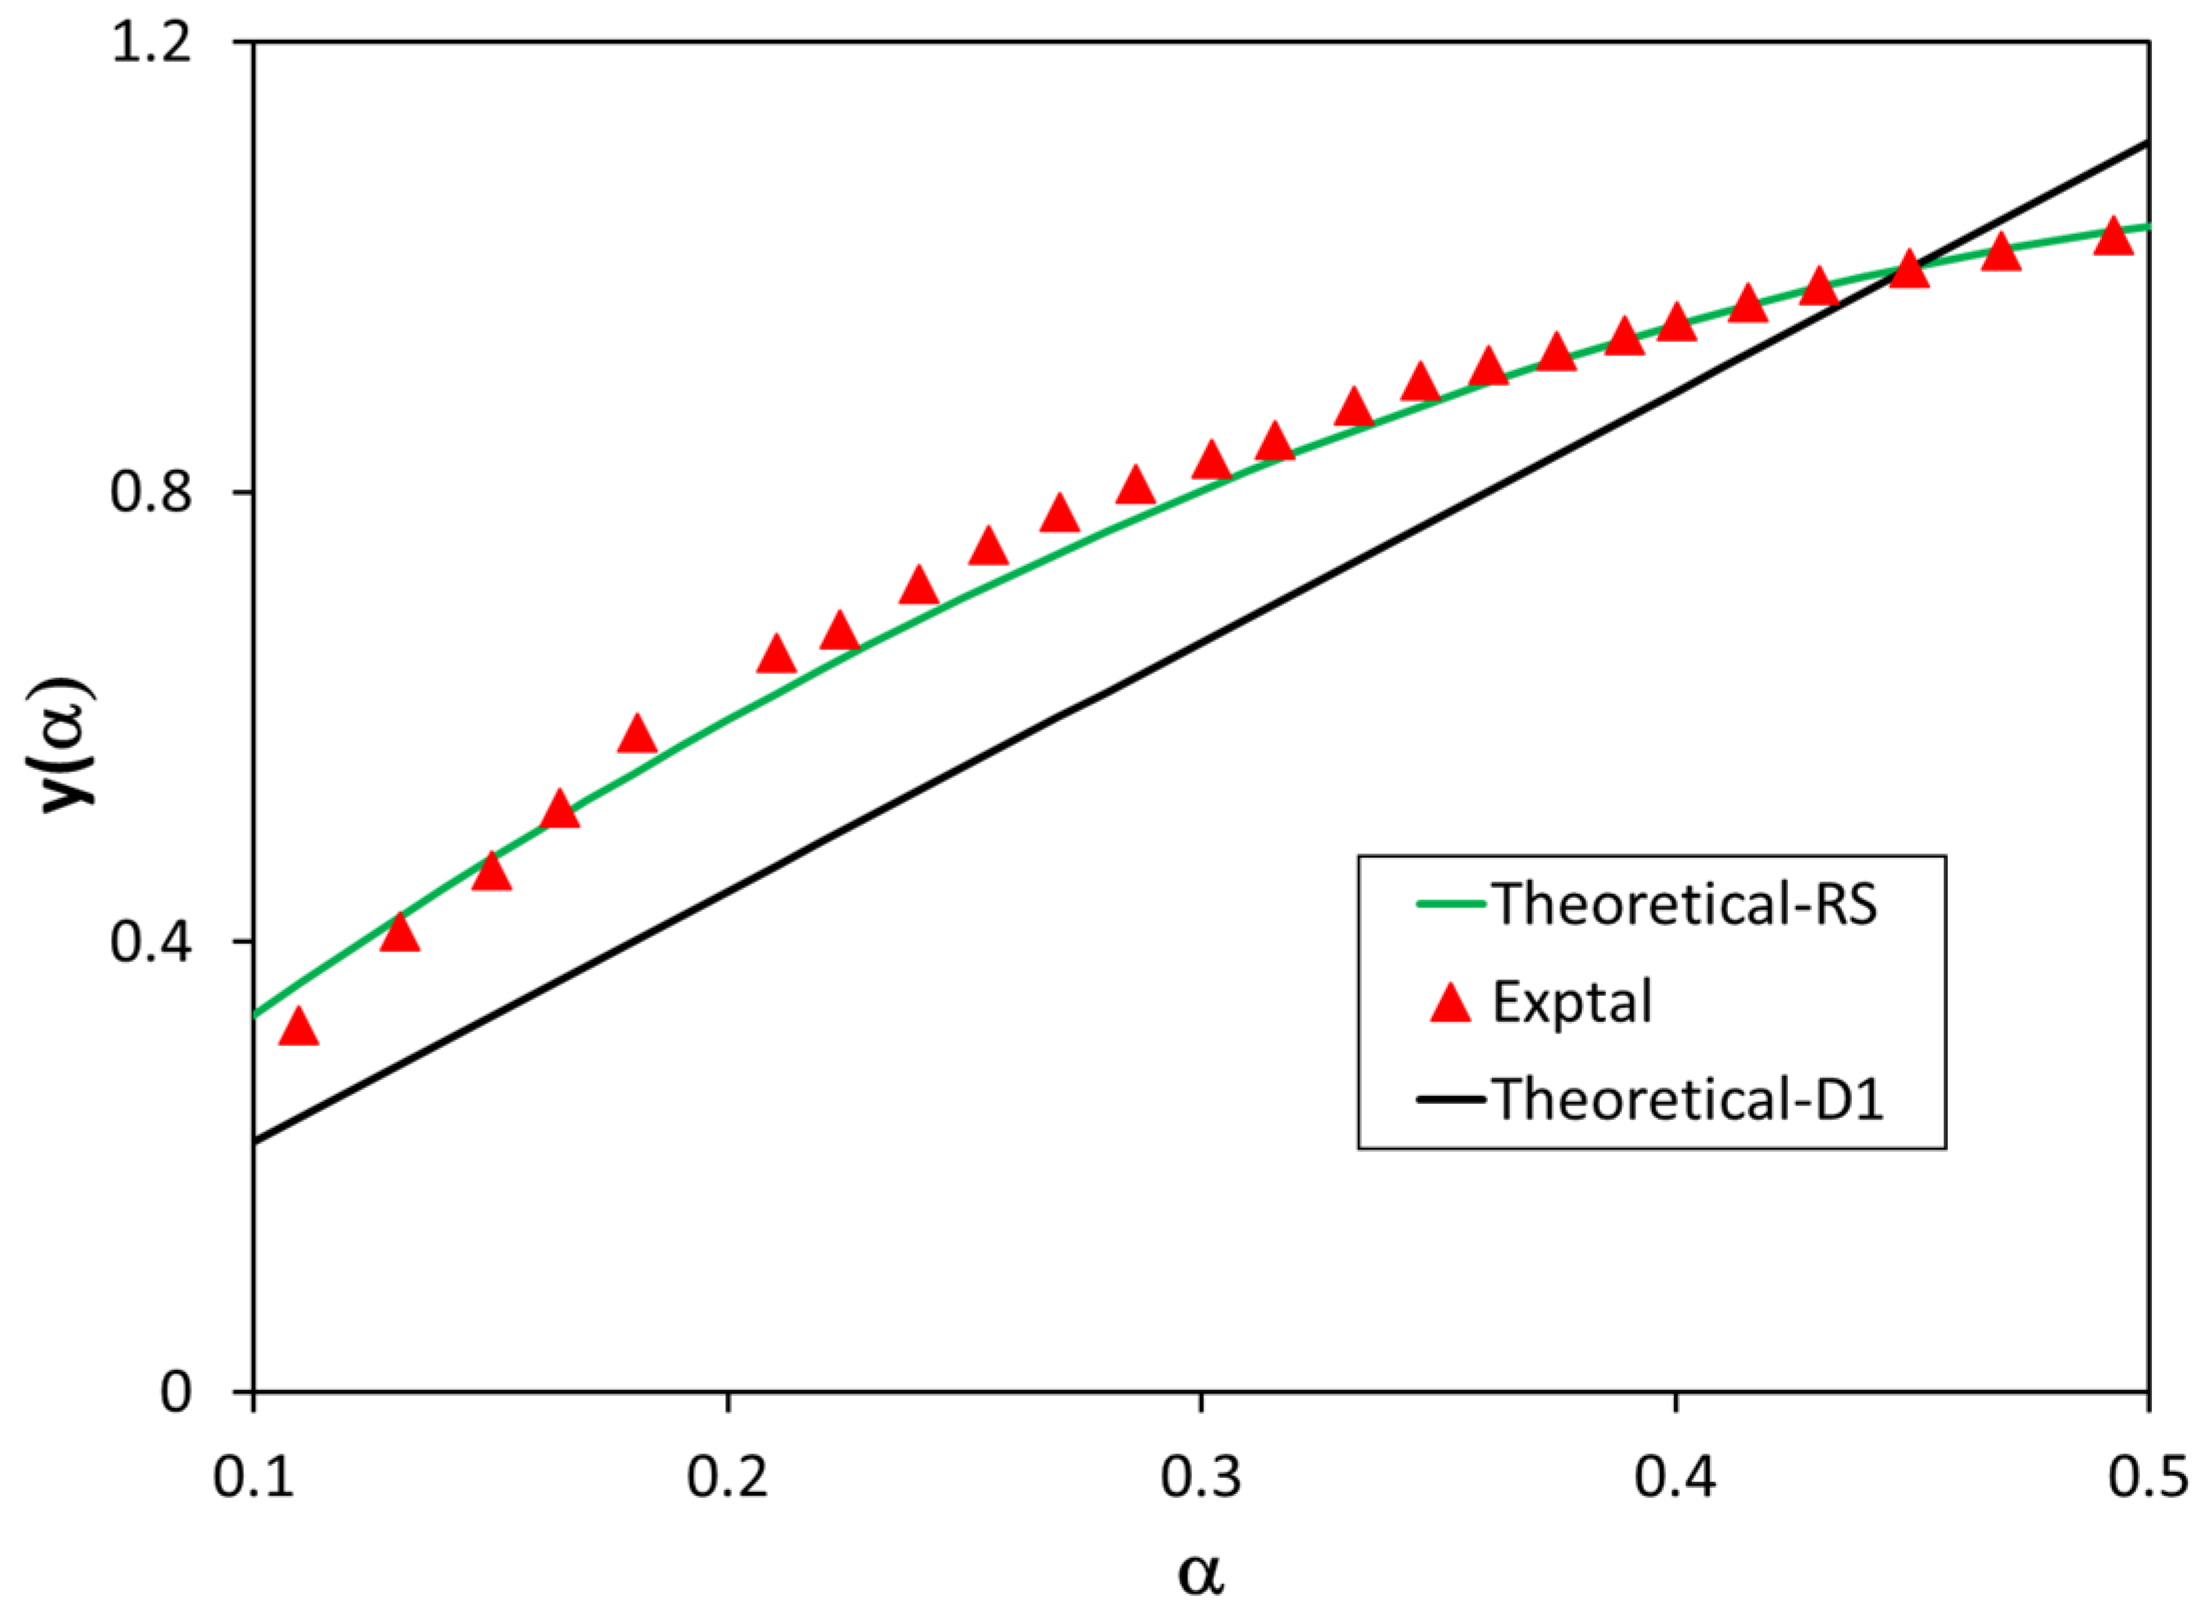
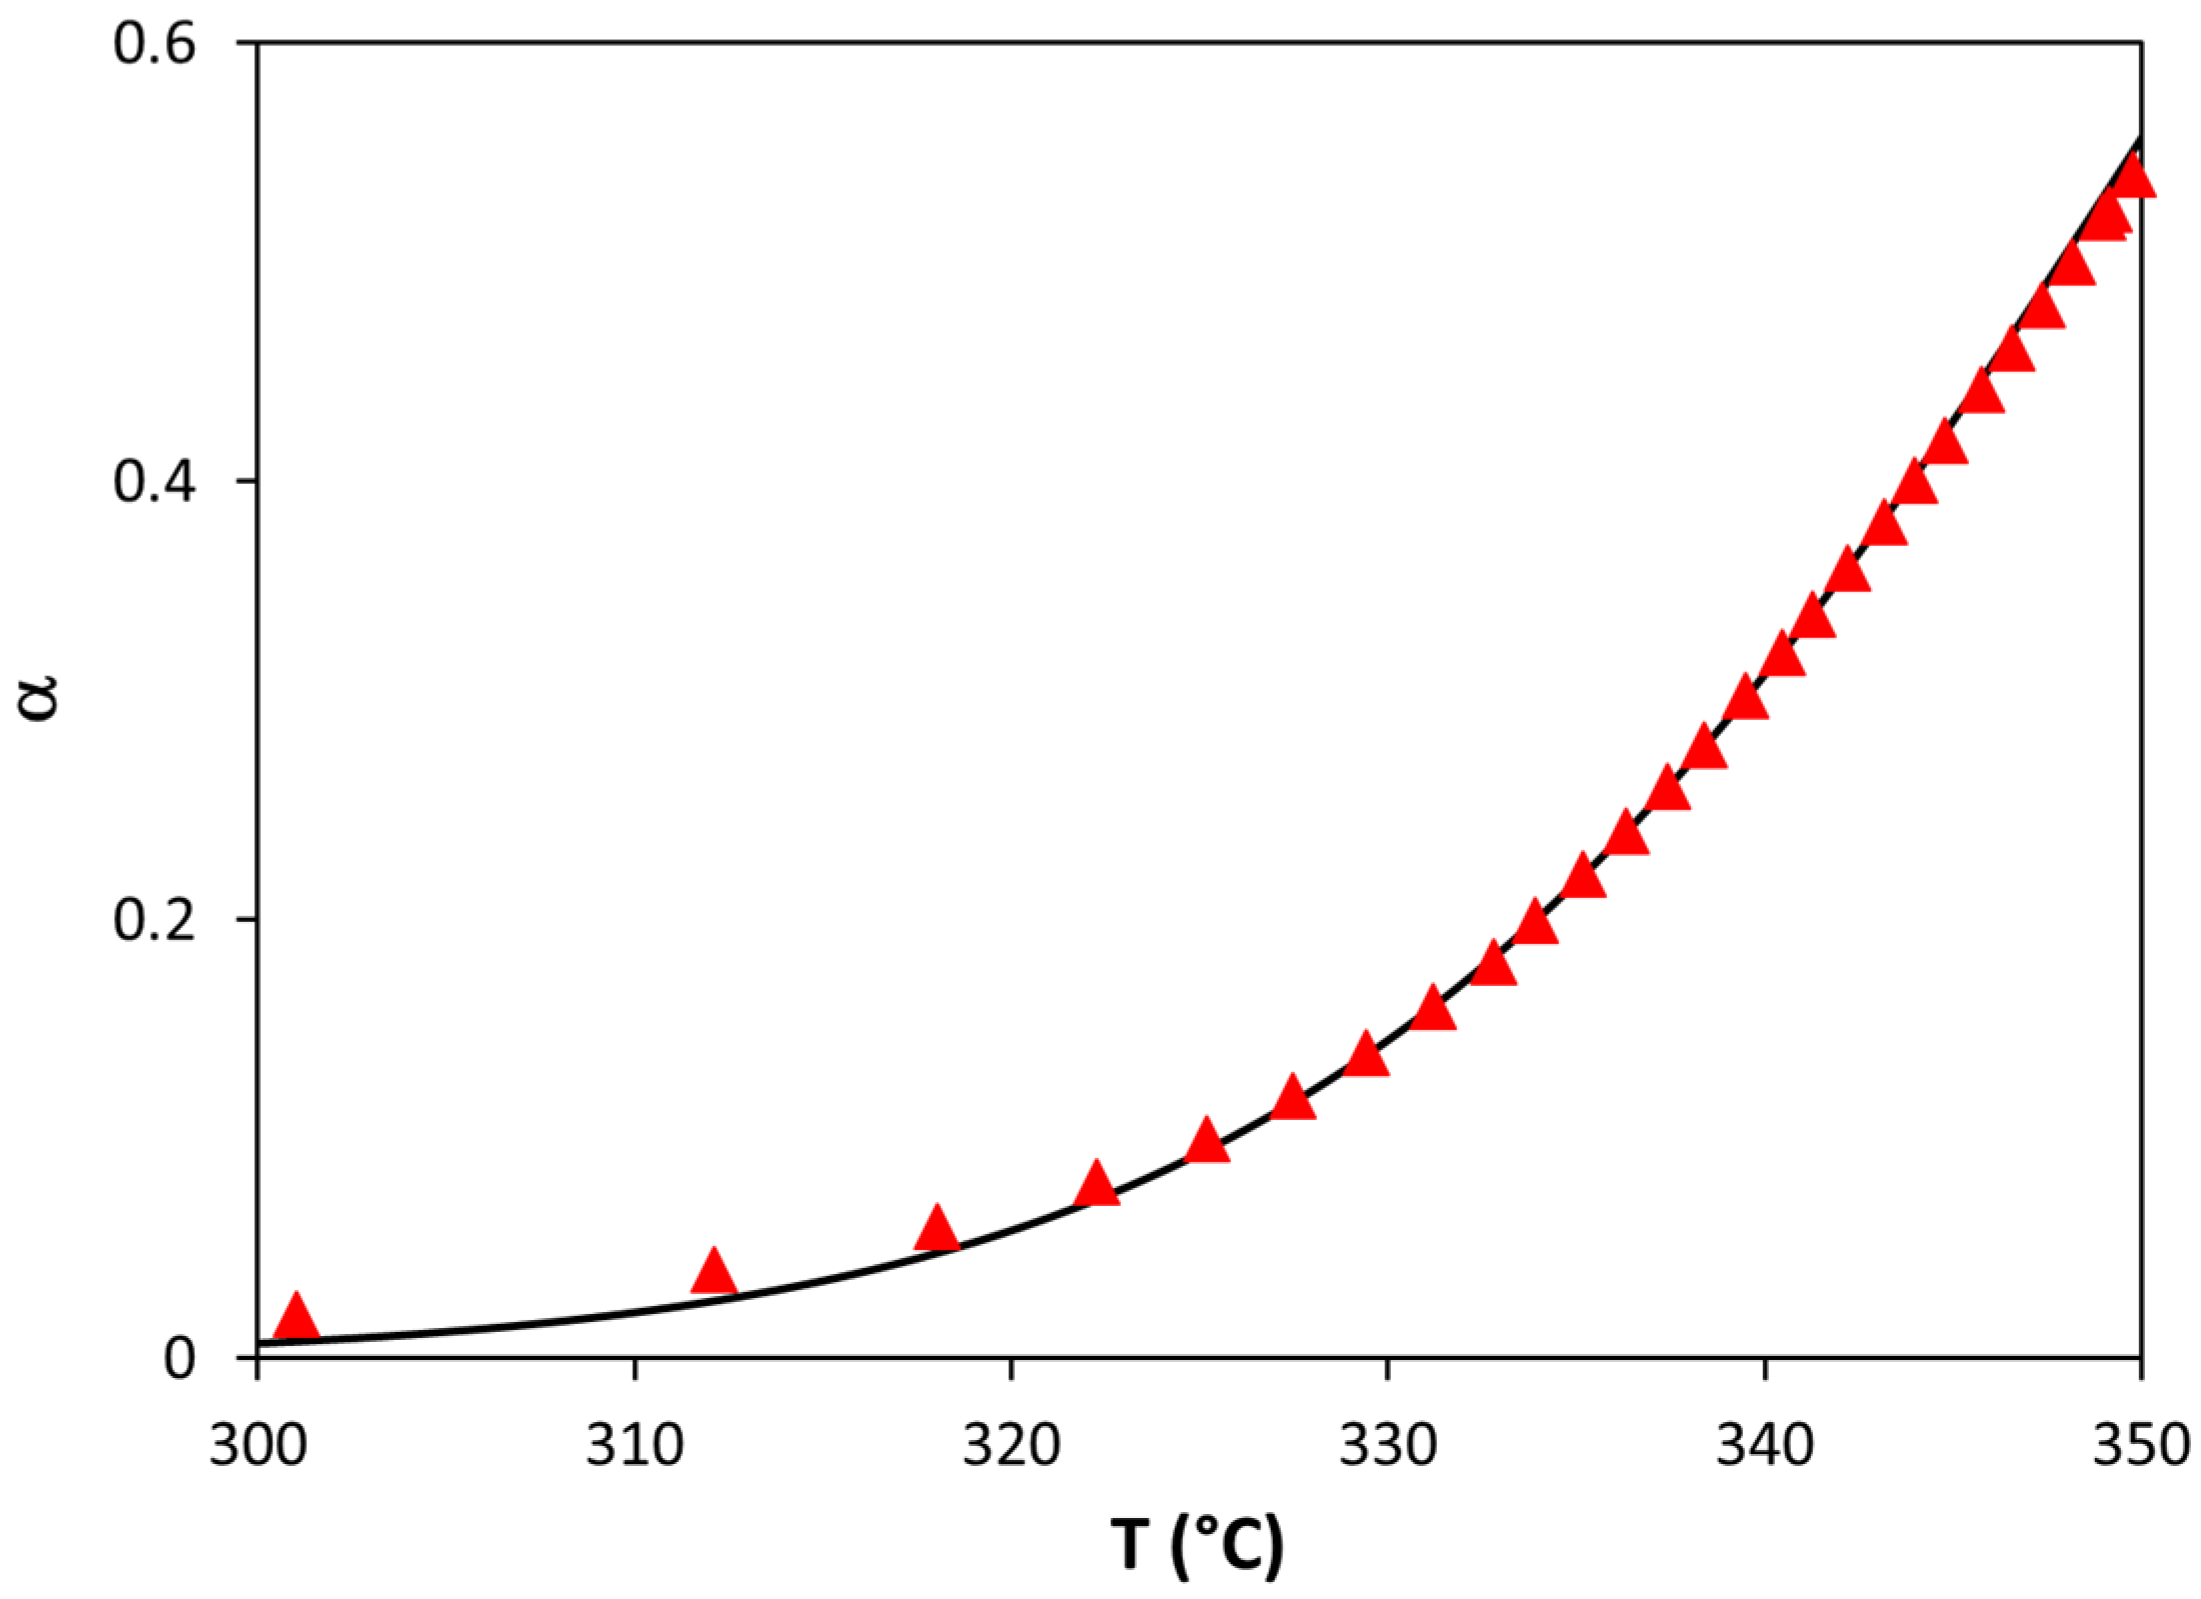
4. Results and Discussion
5. Conclusions
Author Contributions
Funding
Conflicts of Interest
Nomenclature
| A | frequency factor (s−1) |
| E | activation energy (J/mol) |
| f(α) | conversion function (adimensional) |
| k | kinetic constant (s−1) |
| R | gas constant (J/mol·K) |
| t | time (s) |
| T | temperature (K) |
| w | residual weight (%) |
| y(α) | master plot as a function of conversion |
| Greek letters | |
| α | conversion (adimensional) |
| β | linear heating rate (K/s) |
References
- Nakajima, H.; Dijkstra, P.; Loos, K. The recent developments in biobased polymers toward general and engineering applications: Polymers that are upgraded from biodegradable polymers, analogous to petroleum-derived polymers, and newly developed. Polymers 2017, 9, 523. [Google Scholar] [CrossRef]
- Vadori, R.; Misra, M.; Mohanty, A.K. Sustainable biobased blends from the reactive extrusion of polylactide and acrylonitrile butadiene styrene. J. Appl. Polym. Sci. 2016, 133, 4377. [Google Scholar] [CrossRef]
- Siracusa, V.; Rocculi, P.; Romani, S.; Rosa, M.D. Biodegradable polymers for food packaging: A review. Trends Food Sci. Technol. 2008, 19, 634–643. [Google Scholar] [CrossRef]
- Garlotta, D. A Literature Review of Poly(Lactic Acid). J. Polym. Environ. 2001, 9, 63–84. [Google Scholar] [CrossRef]
- Auras, R.; Harte, B.; Selke, S. An overview of polylactides as packaging materials. Macromol. Biosci. 2004, 4, 835–864. [Google Scholar] [CrossRef]
- Zeng, J.B.; Li, K.A.; Du, A.K. Compatibilization strategies in poly(lactic acid)-based blends. RSC Adv. 2015, 5, 32546–32565. [Google Scholar] [CrossRef]
- García-Masabet, V.; Santana Pérez, O.; Cailloux, J.; Abt, T.; Sánchez-Soto, M.; Carrasco, F.; Maspoch, M.L. PLA/PA boi-blends: Induced morphology by extrusion. Polymers 2020, 12, 10. [Google Scholar] [CrossRef] [Green Version]
- Anderson, K.S.; Schreck, K.M.; Hillmyer, M.A. Toughening polylactide. Polym. Rev. 2008, 48, 85–108. [Google Scholar] [CrossRef]
- Babu, R.P.; O’Connor, K.; Seeram, R. Current progress on bio-based polymers and their future trends. Prog. Biomater. 2013, 2, 8. [Google Scholar] [CrossRef] [Green Version]
- Silva, A.P.B.; Montagna, L.S.; Passador, F.R.; Rezende, M.C.; Lemes, A.P. Biodegradable nanocomposites based on PLA/PHBV blend reinforced with carbon nanotubes with potential for electrical and electromagnetic applications. Express Polym. Lett. 2021, 15, 987–1003. [Google Scholar] [CrossRef]
- Hamad, K.; Kaseem, M.; Ayyoob, M.; Joo, J.; Deri, F. Polylactic acid blends: The future of green, light and tough. Progr. Polym. Sci. 2018, 85, 83–127. [Google Scholar] [CrossRef]
- Spinella, S.; Cai, J.; Samuel, C.; Zhu, J.; McCallum, S.A.; Habibi, Y.; Raquez, J.M.; Dubois, P.; Gross, R.A. Polylactide/poly(ω-hydroxytetradecanoic acid) reactive blending: A green renewable approach to improving polylactide properties. Biomacromolecules 2015, 16, 1818–1826. [Google Scholar] [CrossRef]
- Kakroodi, A.R.; Kazemi, Y.; Ding, W.; Ameli, A.; Park, C.B. Poly(lactic acid)-based in situ microfibrillar composites with enhanced crystallization kinetics, mechanical properties, rheological behavior, and foaming ability. Biomacromolecules 2015, 16, 3925–3935. [Google Scholar] [CrossRef]
- Pai, F.C.; Lai, S.M.; Chu, H.H. Characterization and properties of reactive poly(lactic acid)/polyamide 610 biomass blends. J. Appl. Polym. Sci. 2013, 130, 2563–2571. [Google Scholar] [CrossRef]
- Stoclet, G.; Seguela, R.; Lefebvre, J.M. Morphology, thermal behavior and mechanical properties of binary blends of compatible biosourced polymers: Polylactide/polyamide-11. Polymer 2011, 52, 1417–1425. [Google Scholar] [CrossRef]
- Rashmi, B.J.; Prashantha, K.; Lacrampe, M.F.; Krawczak, P. Toughening of poly(lactic acid) without sacrificing stiffness and strength by melt-blending with polyamide-11 and selective localization of halloysite nanotubes. Express Polym. Lett. 2015, 9, 721–735. [Google Scholar] [CrossRef]
- Nuzzo, A.; Coiai, S.; Carroccio, S.C.; Dintcheva, N.T.; Gambarotti, C.; Filippone, G. Heat-resistant fully biobased nanocomposite blends based on poly(lactic acid). Macromol. Mater. Eng. 2014, 299, 31–40. [Google Scholar] [CrossRef]
- Patel, R.; Ruehle, D.A.; Dorgan, J.R.; Halley, P.; Martin, D. Biorenewable blends of polyamide-11 and polylactide. Polym. Eng. Sci. 2014, 54, 1523–1532. [Google Scholar] [CrossRef]
- Palacios, J.K.; Sangroniz, A.; Eguiazabal, J.I.; Etxeberria, A.; Muller, A.J. Tailoring the properties of PP/PA6 nano-structured blends by the addition of nanosilica and compatibilizer agents. Eur. Polym. J. 2016, 85, 532–552. [Google Scholar] [CrossRef]
- Keridou, I.; Cailloux, J.; Martínez, J.C.; Santana, O.; Maspoch, M.L.; Puiggalí, J.; Franco, L. Biphasic polylactide/polyamide 6,10 blends: Influence of composition on polyamide structure and polyester crystallization. Polymer 2020, 202, 122676. [Google Scholar] [CrossRef]
- Walha, F.; Lamnawar, K.; Maazouz, A.; Jaziri, M. Rheological, morphological and mechanical studies of sustainably sourced polymer blends based on poly(lactic acid) and polyamide 11. Polymers 2016, 8, 61. [Google Scholar] [CrossRef] [Green Version]
- Yu, H.; Huang, N.; Wang, C.; Tang, Z. Modeling of poly(L-lactide) thermal degradation: Theoretical prediction of molecular weight and polydispersity index. J. Appl. Polym. Sci. 2003, 11, 2557–2562. [Google Scholar] [CrossRef]
- Antunes, A.; Luyt, A.S.; Kasak, P.; Aljarod, O.; Hassan, M.K.; Popelka, A. Effect of plasma treatment on accelerated PLA degradation. Express Polym. Lett. 2021, 15, 725–743. [Google Scholar] [CrossRef]
- Carrasco, F.; Pagès, P. Thermogravimetric analysis of polystyrene: Influence of sample weight and heating rate on thermal and kinetic parameters. J. Appl. Polym. Sci. 1996, 61, 187–197. [Google Scholar] [CrossRef]
- Bianchi, O.; Martins, J.D.; Florio, R.; Oliveira, R.V.B. Changes in activation energy and kinetic mechanism during EVA crosslinking. Polym. Test. 2011, 30, 616–624. [Google Scholar] [CrossRef]
- Paik, P.; Kar, K.K. Thermal degradation kinetics and estimation of lifetime of polyethylene particles: Effects of particle size. Mater. Chem. Phys. 2009, 113, 953–961. [Google Scholar] [CrossRef]
- Carrasco, F.; Pagès, P. Thermal degradation and stability of epoxy nanocomposites: Influence of montmorillonite content and cure temperature. Polym. Degrad. Stab. 2008, 93, 1000–1007. [Google Scholar] [CrossRef]
- Pérez-Maqueda, L.A.; Criado, J.M.; Sánchez-Jiménez, P.E. Combined kinetic analysis of solid-state reactions: A powerful tool for the simultaneous determination of kinetic parameters and the kinetic model without previous assumptions on the reaction mechanism. J. Phys. Chem. A 2006, 110, 12456–12462. [Google Scholar] [CrossRef]
- Carrasco, F.; Pagès, P.; Gámez-Pérez, J.; Santana, O.O.; Maspoch, M.L. Processing of poly(lactic acid): Characterization of chemical structure, thermal stability and mechanical properties. Polym. Degrad. Stab. 2010, 95, 116–125. [Google Scholar] [CrossRef]
- Velázquez-Infante, J.C.; Gámez-Pérez, J.; Franco-Urquiza, E.A.; Santana, O.O.; Carrasco, F.; Maspoch, M.L. Effect of the unidirectional drawing on the thermal and mechanical properties of PLA film with different L-isomer content. J. Appl. Polym. Sci. 2013, 127, 2661–2669. [Google Scholar] [CrossRef]
- Vyazovkin, S.; Sbirrazzuoli, N. Isoconversional Kinetic Analysis of Thermally Stimulated Processes in Polymers. Macromol. Rapid Commun. 2006, 27, 1515–1532. [Google Scholar] [CrossRef]
- Cañavate, J.; Pagès, P.; Saurina, J.; Colom, X.; Carrasco, F. Determination of small interactions in polymer composites by means of FTIR and DSC. Polym. Bull. 2000, 44, 293–300. [Google Scholar] [CrossRef]
- Sánchez-Jiménez, P.E.; Pérez-Maqueda, L.A.; Perejón, A.; Criado, J.M. Combined kinetic analysis of thermal degradation of polymeric materials under any thermal pathway. Polym. Degrad. Stab. 2009, 94, 2079–2085. [Google Scholar] [CrossRef] [Green Version]
- Pérez-Maqueda, L.A.; Sánchez-Jiménez, P.E.; Perejón, A.; García-Garrido, C.; Criado, J.M.; Benítez-Guerrero, M. Scission kinetic model for the prediction of polymer pyrolysis curves from chain structure. Polym. Test. 2014, 37, 1–5. [Google Scholar] [CrossRef]
- Carrasco, F. The evaluation of kinetic parameters from thermogravimetric data: Comparison between established methods and the general analytical equation. Thermochim. Acta 1993, 213, 115–134. [Google Scholar] [CrossRef]
- Carrasco, F.; Pérez-Maqueda, L.A.; Sánchez-Jiménez, P.E.; Perejón, A.; Santana, O.O.; Maspoch, M.L. Enhanced general analytical equation for the kinetics of the thermal degradation of poly(lactic acid) driven by random scission. Polym. Test. 2013, 32, 937–945. [Google Scholar] [CrossRef]
- Vyazovkin, S.; Burnham, A.K.; Criado, J.M.; Pérez-Maqueda, L.A.; Popescu, C.; Sbirrazzuoli, N. ICTAC Kinetics Committee recommendations for performing kinetic computations on thermal analysis data. Thermochim. Acta 2011, 520, 1–19. [Google Scholar] [CrossRef]
- Carrasco, F.; Santana, O.; Cailloux, J.; Maspoch, M.L. Kinetics of the thermal degradation of poly(lactic acid) obtained by reactive extrusion: Influence of the addition of montmorillonite nanoparticles. Polym. Test. 2015, 48, 69–81. [Google Scholar] [CrossRef]
- Cailloux, J.; Abt, T.; García-Masabet, V.; Santana, O.; Sánchez-Soto, M.; Carrasco, F.; Maspoch, M.L. Effect of the viscosity ratio on the PLA/PA 10.10 bioblends morphology and mechanical properties. Express Polym. Lett. 2018, 12, 569–582. [Google Scholar] [CrossRef]
- Criado, J.M.; Málek, J.; Ortega, A. Applicability of the master plots in kinetic analysis of non-isothermal data. Thermochim. Acta 1989, 147, 377–385. [Google Scholar] [CrossRef]


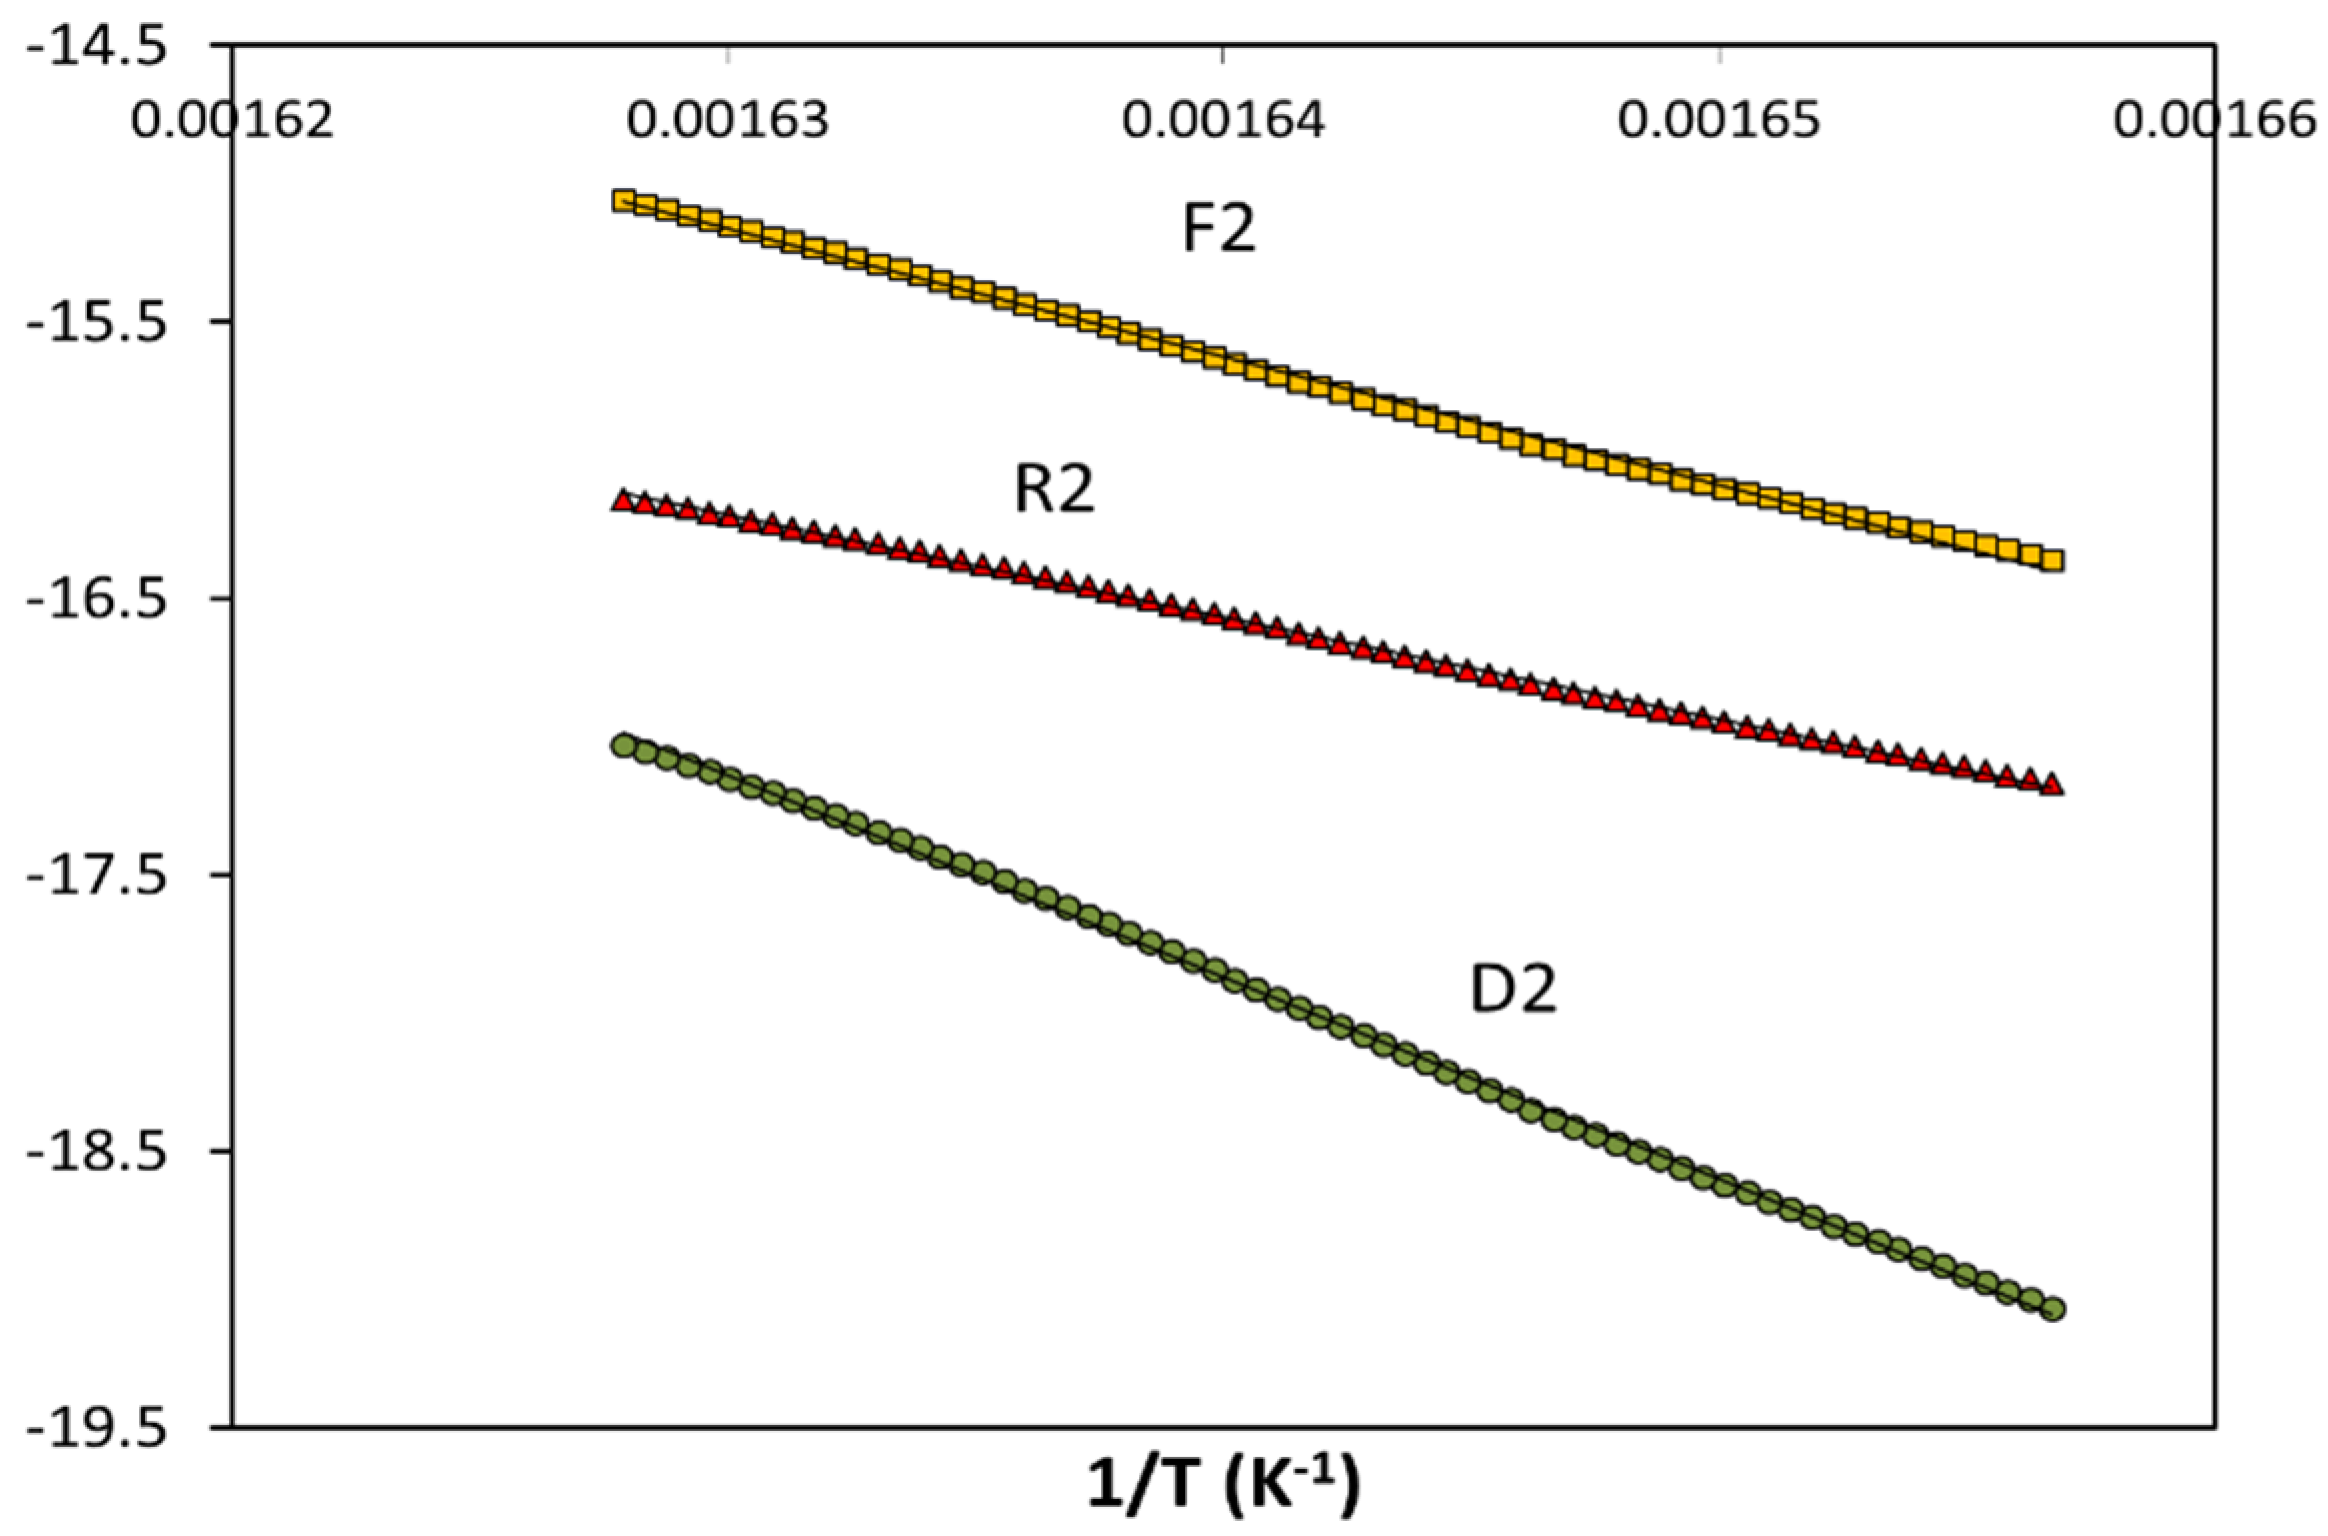
| Mechanism | General Analytical Equation in Linear Form | |
|---|---|---|
| n-order | ||
| Autocatalytic | ||
| Random scission | ||
| R1 | ||
| R2 | ||
| R3 | ||
| F1 | ||
| F2 | ||
| F3 | ||
| D1 | ||
| D2 | ||
| D3 |
| T5 (°C) | T95 (°C) | αm | Tm (°C) | (dα/dT)m (K−1) | αr | Tr (°C) | (dα/dT)r (K−1) | |
|---|---|---|---|---|---|---|---|---|
| PLA/PA 90/10 | 315.8 | 455.0 | 0.54 | 349.8 | 2.39·10−2 | 0.45 | 346.1 | 2.38·10−2 |
| PLA/PA 80/20 | 317.4 | 554.4 | 0.43 | 343.1 | 2.49·10−2 | 0.40 | 341.8 | 2.46·10−2 |
| PLA/PA 70/30 | 318.8 | 540.2 | 0.35 | 339.2 | 2.83·10−2 | 0.35 | 339.3 | 1.76·10−2 |
| PLA/PA 60/40 | 320.5 | 484.1 | 0.30 | 338.5 | 2.69·10−2 | 0.30 | 338.4 | 0.49·10−2 |
| PLA/PA 50/50 | 321.2 | 479.2 | 0.27 | 337.6 | 2.01·10−2 | 0.25 | 336.6 | 0.18·10−2 |
| E (kJ/mol) | |||||
|---|---|---|---|---|---|
| Mechanism | 90/10 | 80/20 | 70/30 | 60/40 | 50/50 |
| n-order | 236 ± 4 | 259 ± 3 | 309 ± 3 | 311 ± 3 | 283 ± 3 |
| Autocatalytic | 192 ± 3 | 212 ± 3 | 253 ± 3 | 254 ± 3 | 231 ± 2 |
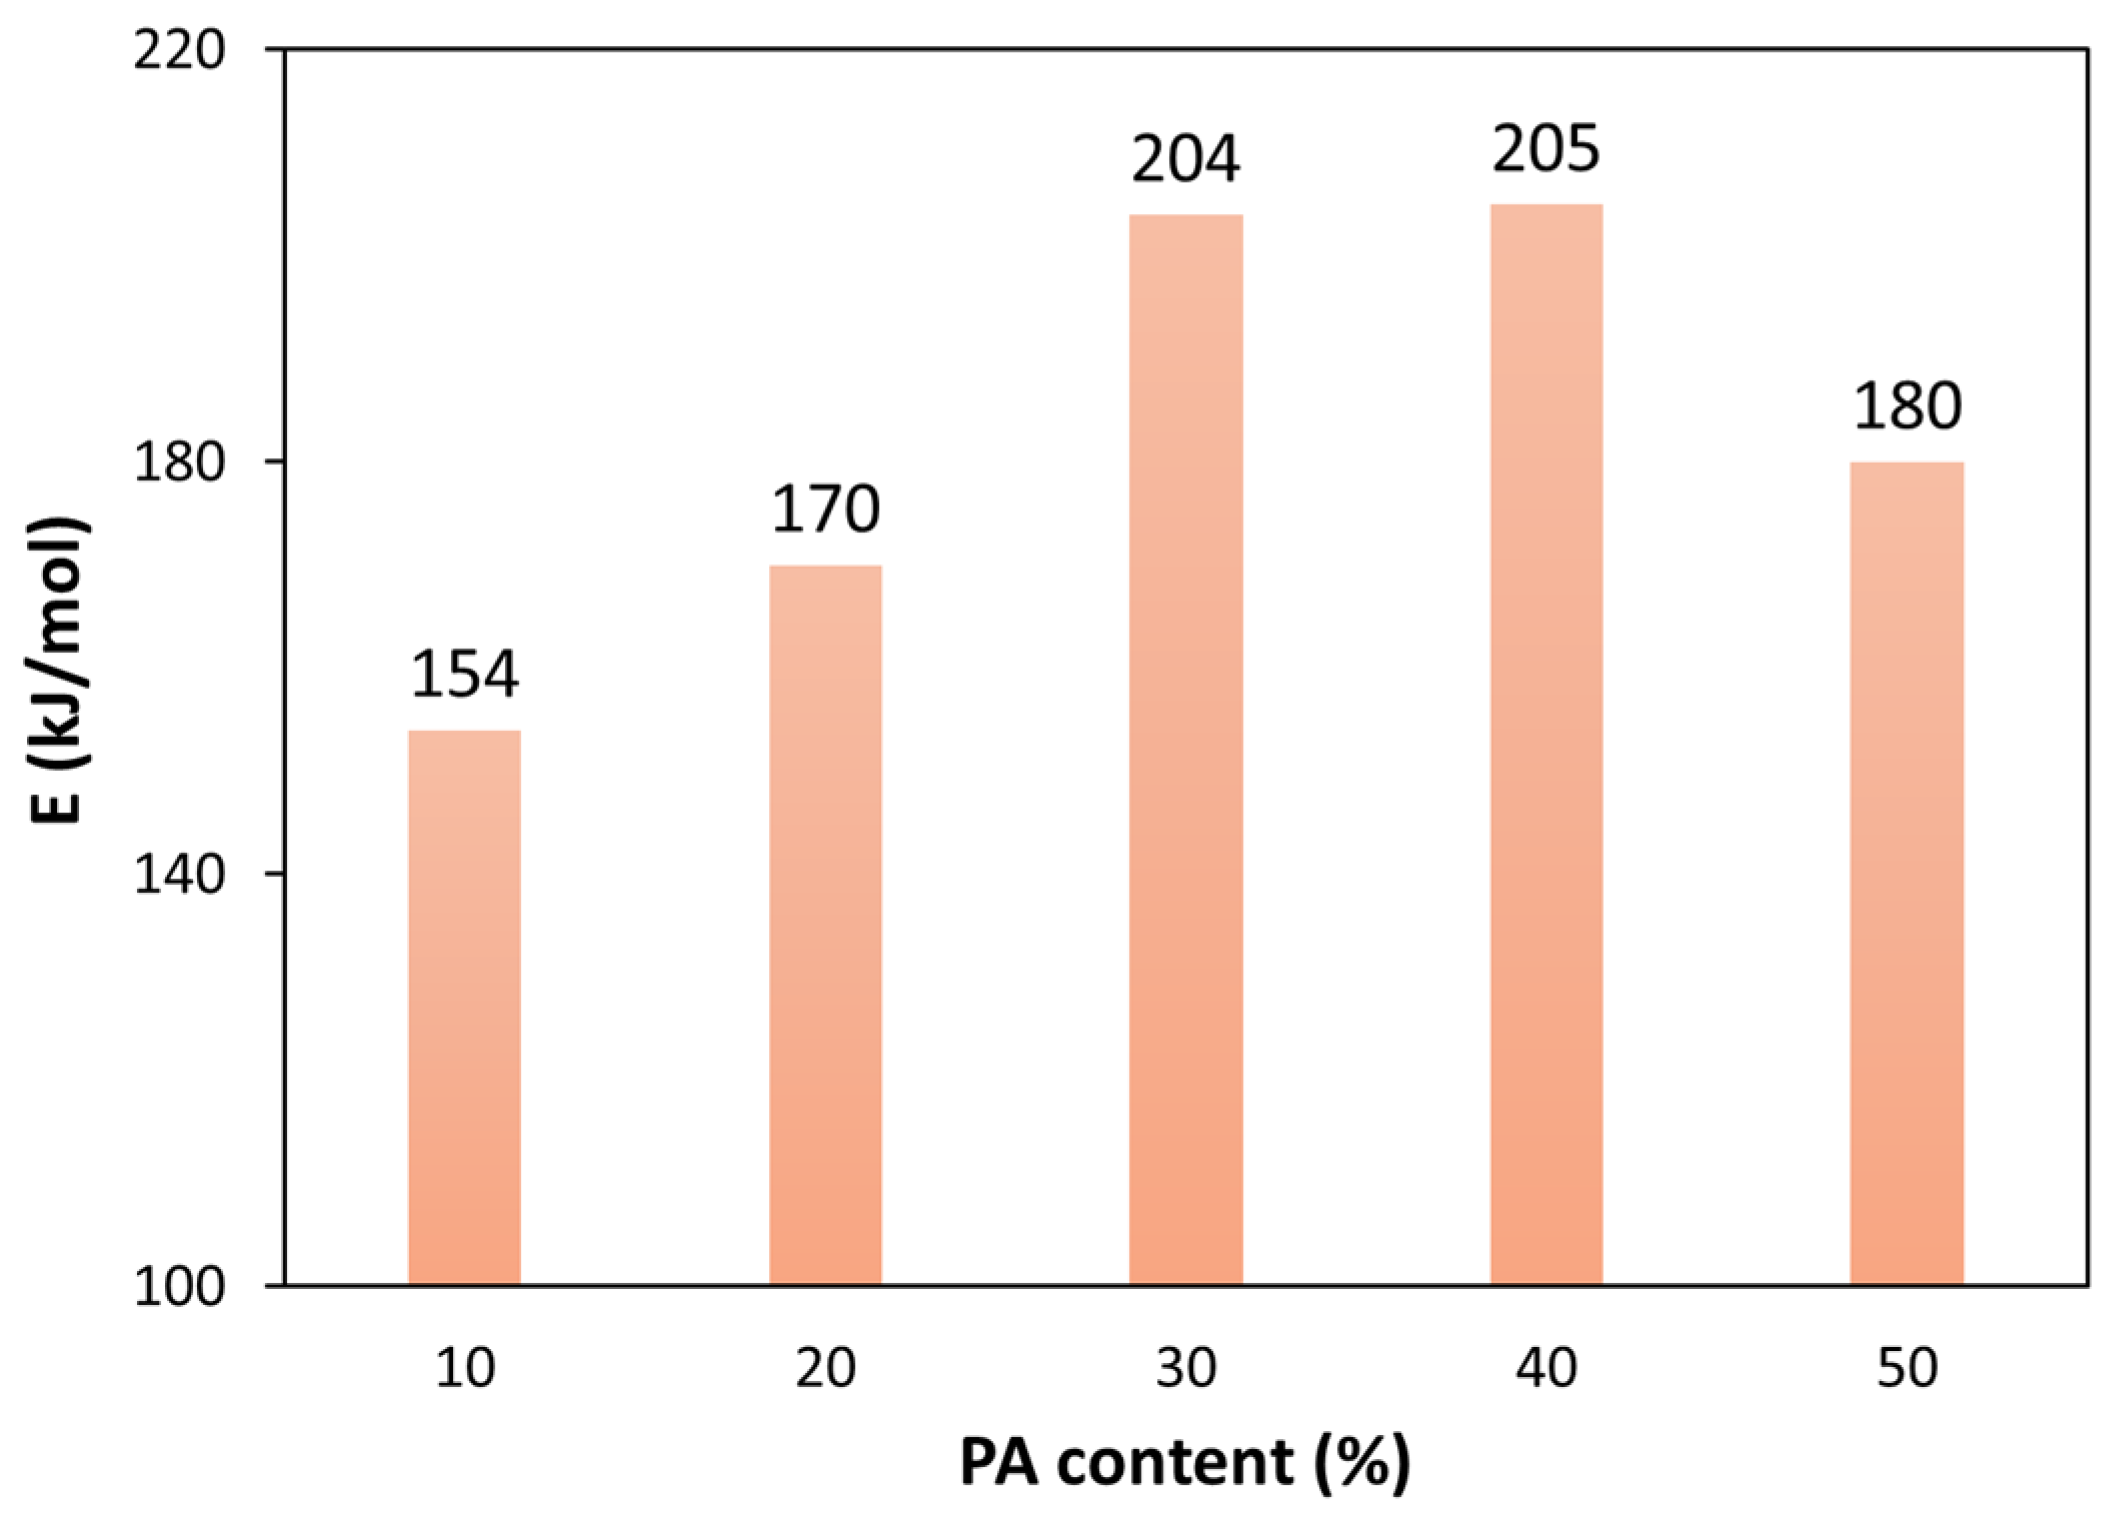
| Random scission | 154 ± 2 | 170 ± 2 | 204 ± 3 | 205 ± 3 | 180 ± 2 |
| F1 | 253 ± 4 | 278 ± 4 | 332 ± 4 | 334 ± 5 | 300 ± 4 |
| R1 | 216 ± 4 | 237 ± 3 | 283 ± 3 | 284 ± 3 | 263 ± 3 |
| D1 | 441 ± 5 | 484 ± 5 | 576 ± 6 | 578 ± 6 | 536 ± 6 |
| F2 | 294 ± 4 | 324 ± 5 | 386 ± 5 | 389 ± 5 | 340 ± 4 |
| R2 | 234 ± 4 | 257 ± 3 | 307 ± 3 | 308 ± 4 | 281 ± 3 |
| D2 | 464 ± 6 | 510 ± 6 | 607 ± 6 | 610 ± 5 | 559 ± 6 |
| F3 | 340 ± 5 | 375 ± 5 | 446 ± 6 | 450 ± 6 | 384 ± 5 |
| R3 | 240 ± 3 | 264 ± 3 | 315 ± 4 | 317 ± 4 | 287 ± 3 |
| D3 | 490 ± 7 | 538 ± 7 | 640 ± 8 | 643 ± 8 | 584 ± 7 |
| IME (%) | |||||
|---|---|---|---|---|---|
| Mechanism | 90/10 | 80/20 | 70/30 | 60/40 | 50/50 |
| n-order | 28.7 ± 0.7 | 22.9 ± 0.6 | 7.9 ± 0.2 | 7.8 ± 0.2 | 21.1 ± 0.5 |
| Autocatalytic | 20.3 ± 0.6 | 17.7 ± 0.4 | 7.1 ± 0.2 | 7.0 ± 0.2 | 40.1 ± 0.5 |
| Random scission | 5.5 ± 0.2 | 6.0 ± 0.2 | 6.2 ± 0.2 | 6.2 ± 0.2 | 6.7 ± 0.3 |
| F1 | 20.3 ± 0.5 | 18.1 ± 0.4 | 7.2 ± 0.2 | 7.6 ± 0.3 | 25.7 ± 0.4 |
| R1 | 37.2 ± 0.8 | 28.1 ± 0.6 | 11.1 ± 0.3 | 9.4 ± 0.3 | 19.5 ± 0.4 |
| D1 | 87.8 ± 0.9 | 57.5 ± 0.8 | 14.5 ± 0.3 | 17.3 ± 0.4 | 27.3 ± 0.5 |
| F2 | 5.8 ± 0.3 | 6.8 ± 0.2 | 8.9 ± 0.3 | 9.0 ± 0.3 | 25.7 ± 0.5 |
| R2 | 29.5 ± 0.6 | 23.4 ± 0.5 | 8.9 ± 0.3 | 7.8 ± 0.2 | 20.9 ± 0.4 |
| D2 | 81.3 ± 0.9 | 54.0 ± 0.7 | 11.0 ± 0.3 | 17.1 ± 0.4 | 28.7 ± 0.6 |
| F3 | 40.3 ± 0.7 | 12.2 ± 0.4 | 15.7 ± 0.4 | 12.3 ± 0.3 | 28.0 ± 0.7 |
| R3 | 26.7 ± 0.5 | 21.7 ± 0.4 | 8.6 ± 0.3 | 8.0 ± 0.3 | 21.4 ± 0.6 |
| D3 | 71.1 ± 0.7 | 48.9 ± 0.8 | 10.8 ± 0.3 | 17.0 ± 0.4 | 30.0 ± 0.7 |
Publisher’s Note: MDPI stays neutral with regard to jurisdictional claims in published maps and institutional affiliations. |
© 2021 by the authors. Licensee MDPI, Basel, Switzerland. This article is an open access article distributed under the terms and conditions of the Creative Commons Attribution (CC BY) license (https://creativecommons.org/licenses/by/4.0/).
Share and Cite
Carrasco, F.; Santana Pérez, O.; Maspoch, M.L. Kinetics of the Thermal Degradation of Poly(lactic acid) and Polyamide Bioblends. Polymers 2021, 13, 3996. https://doi.org/10.3390/polym13223996
Carrasco F, Santana Pérez O, Maspoch ML. Kinetics of the Thermal Degradation of Poly(lactic acid) and Polyamide Bioblends. Polymers. 2021; 13(22):3996. https://doi.org/10.3390/polym13223996
Chicago/Turabian StyleCarrasco, Félix, Orlando Santana Pérez, and Maria Lluïsa Maspoch. 2021. "Kinetics of the Thermal Degradation of Poly(lactic acid) and Polyamide Bioblends" Polymers 13, no. 22: 3996. https://doi.org/10.3390/polym13223996