Article

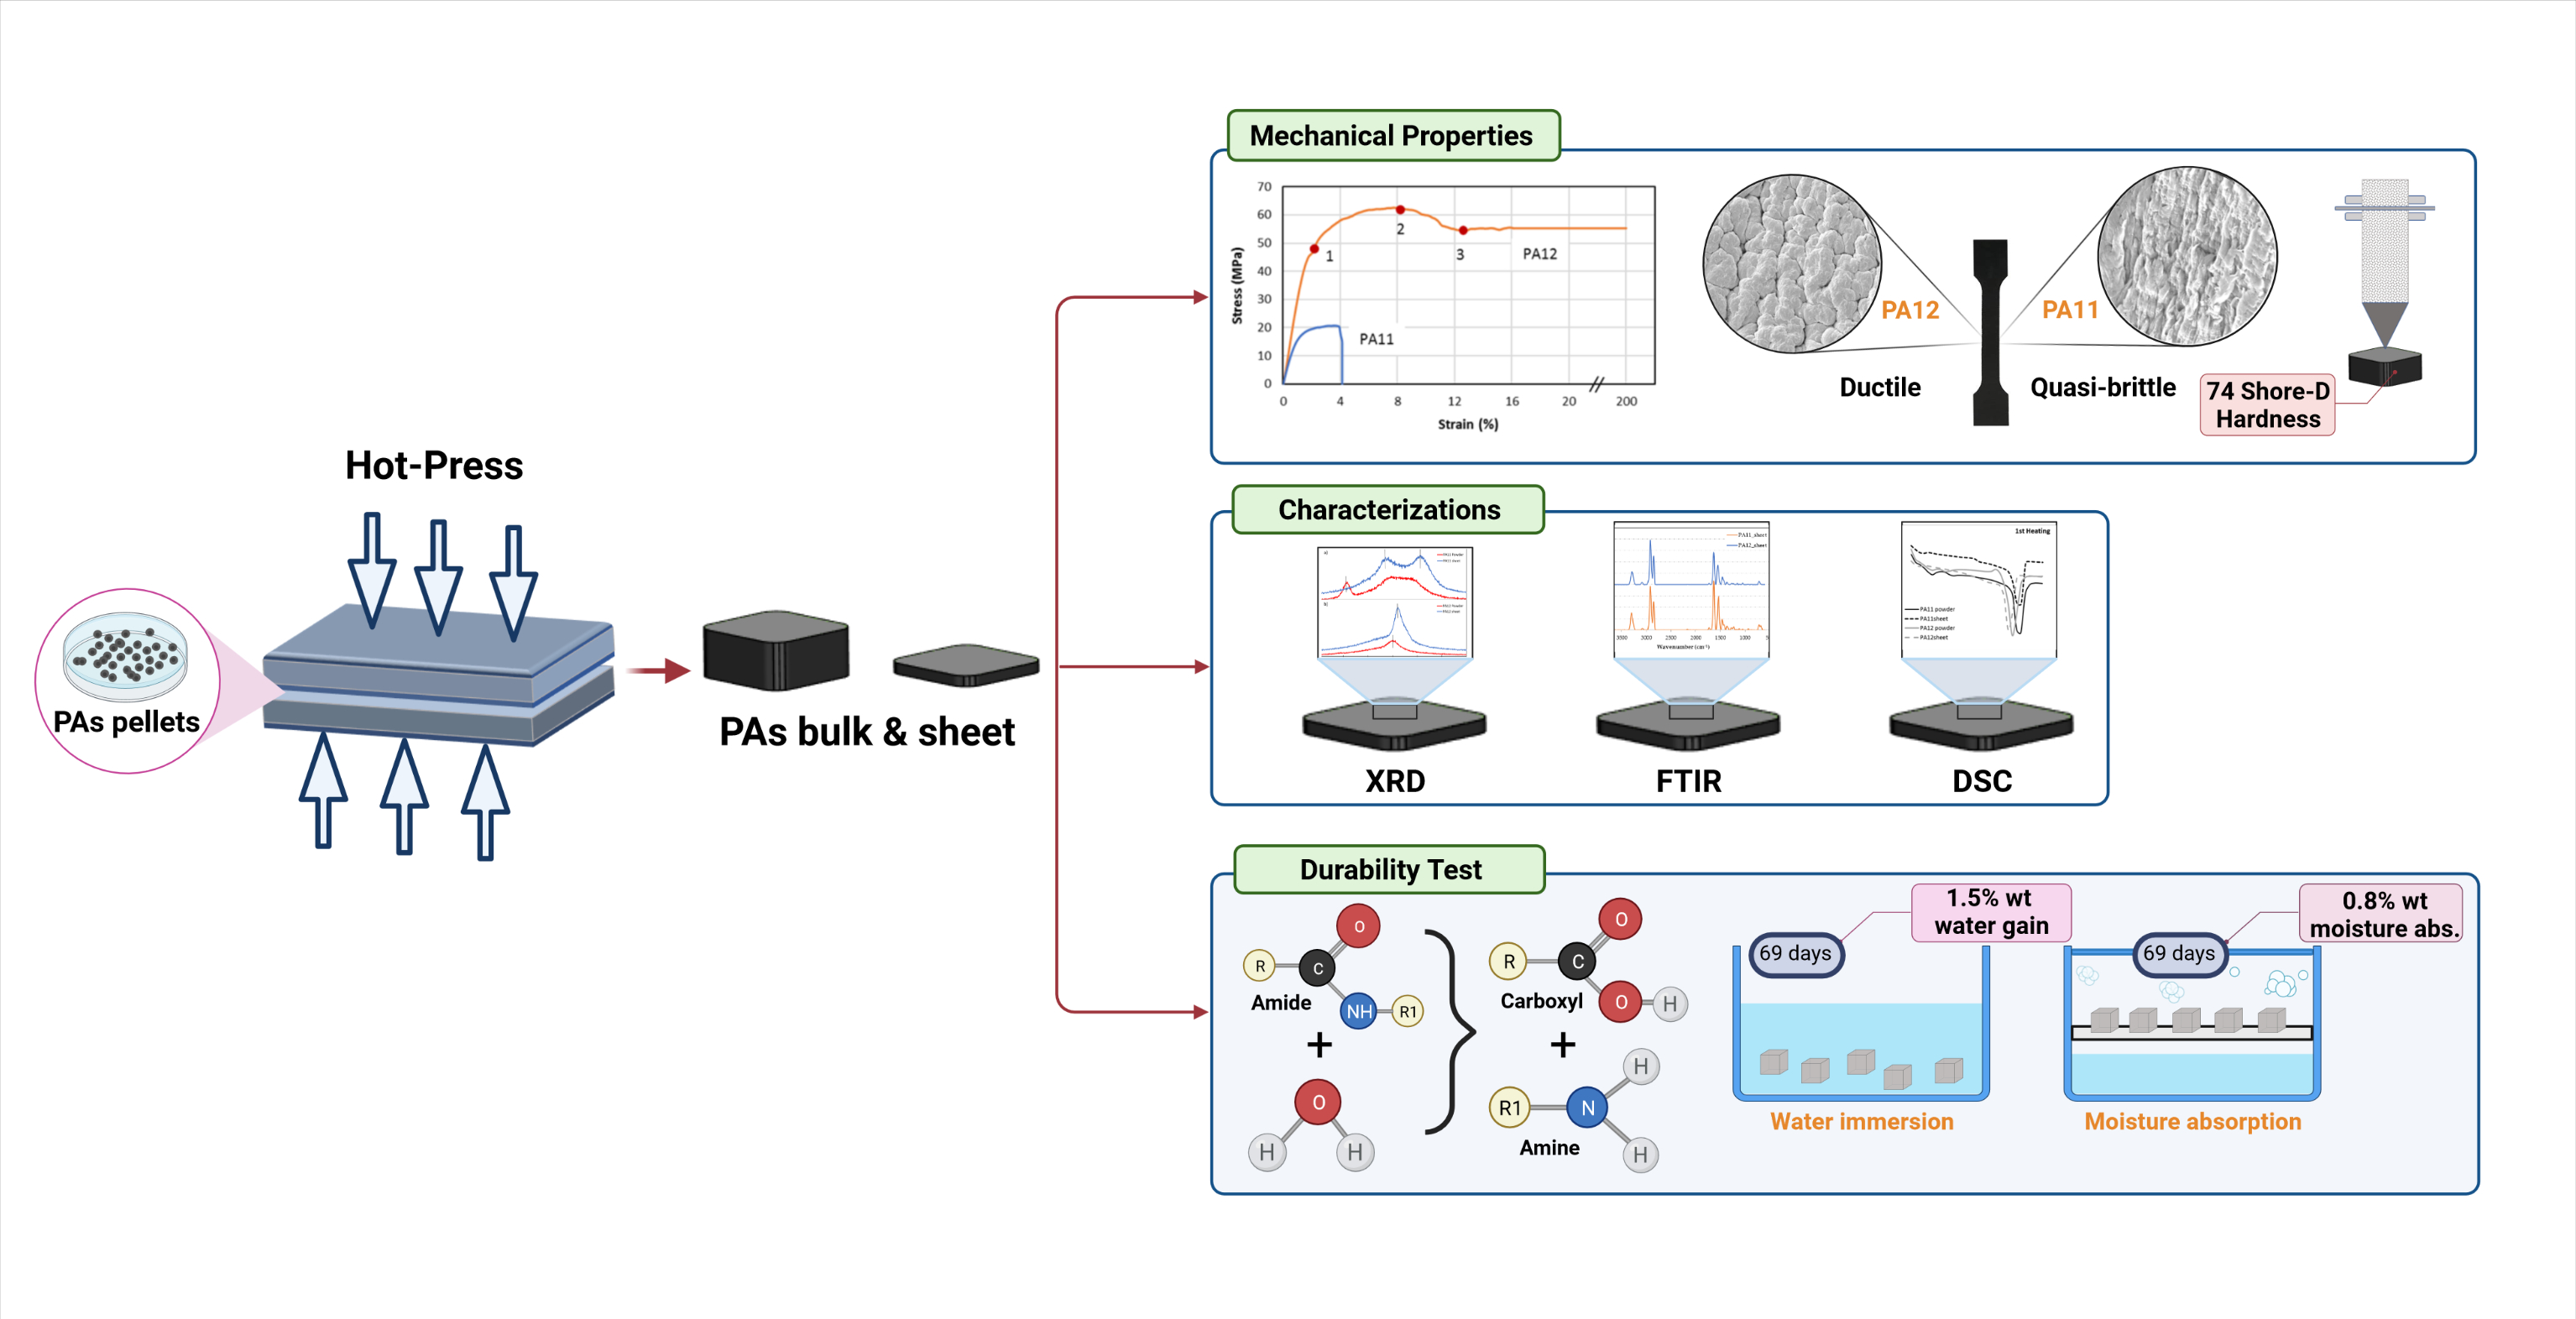
Comparative Characterization of Hot-Pressed Polyamide 11 and 12: Mechanical, Thermal and Durability Properties

by
Mohsen Bahrami
1,*,
Juana Abenojar
1,2 and
Miguel Angel Martínez
1
1
Materials Science and Engineering and Chemical Engineering Department, University Carlos III de Madrid, 28911 Leganes, Spain
2
Mechanical Engineering Department, ICAI, Universidad Pontificia Comillas, 28015 Madrid, Spain
*
Author to whom correspondence should be addressed.
Polymers 2021, 13(20), 3553; https://doi.org/10.3390/polym13203553
Submission received: 26 September 2021 / Revised: 8 October 2021 / Accepted: 12 October 2021 / Published: 15 October 2021
(This article belongs to the Special Issue Polymer Composite Analysis and Characterization)

Abstract

:
Chemically speaking, polyamide 11 (PA11) and polyamide 12 (PA12) have a similar backbone, differing only in one carbon. From an origin point of view, PA11 is considered a bioplastic polyamide composed from renewable resources, compared to oil-based PA12. Each of them has a number of advantages over the other, which makes their selection a challenging issue. Depending on the target application, diverse assessments and comparisons are needed to fulfill this mission. The current study addresses this research gap to characterize and compare PA11 and PA12 manufactured by the hot press technique in terms of their mechanical, thermal and durability properties for the first time, demonstrating their potential for future works as matrices in composite materials. In this regard, different characterization techniques are applied to the hot-pressed polymer sheets, including X-ray diffraction (XRD), differential scanning calorimetry (DSC), Fourier transform infrared spectroscopy (FTIR) and scanning electron microscopy (SEM). The mechanical performance of the PA11 and PA12 sheets is compared based on tensile tests and shore hardness measurement. The durability behavior of these two polyamides is evaluated in water and relative humidity conditions at different aging times. The experimental results show the ductile behavior of PA12 with respect to the quasi-brittle PA11. Both have a relatively small water and moisture gain: 1.5 wt% and 0.8 wt%, respectively. The higher crystallinity of PA12 (2.1 times more than PA11) with γ-phase is one of the leading parameters to achieve better mechanical and durability properties. The FTIR spectra displayed slight acid hydrolysis. Accordingly, absorbed water or moisture does not cause plasticization; thus, neither hardness nor dimension changes.

Graphical Abstract

1. Introduction

Nylon is a term representing certain types of thermoplastic polymers belonging to the family known as polyamides. The term nylon, derived from a combination of New York and London, was suggested by Wallace Carothers, an early researcher of these materials at Du Pont Chemical Co. of America in 1928, who found that a pound of nylon could be converted to a length equal to the distance between New York (NY) and London (LON) [1,2]. A wide range of polyamides have been manufactured and marketed under various trade names. Generally, their names can be classified into two types, i.e., nylon XY, such as nylon 66, and nylon Z, such as nylon 6. X and Y refer to the number of carbon atoms in the diamine and diacid monomer, respectively. Moreover, Z in Z-type nylon refers to the number of carbon atoms in the monomer [1]. Polyamides can be divided into two general groups of aromatic and aliphatic. The latter polyamide is the paramount class of engineering thermoplastic polymers and shows the most impressive material characteristics compared to other polymers used in the industry [3]. These materials have been extensively investigated for decades in several industrial fields, including the automotive, textile, packaging, electric and electronics, sports and oil and gas industries, due to their unique combinations of properties, such as excellent durability [4] and mechanical strength [5], high-temperature and chemical resistance [6], ease of processing and high melting point [7]. Especially in recent years, the demand for PA products has increased significantly to replace specific metal structures in the fields of power tools, automotive and power train systems [8]. The chemical structure of polyamides mainly consists of amide groups that participate in hydrogen bonding resulting in reduced interchain mobility and accordingly causes high melting temperatures and high strength [9].
Along with PA6 and PA66, which constitute approximately 90% of the world’s overall polyamide utilization [10], PA11 and PA12 are other commercially notable members of the single-monomer nylon family. From a structural point of view, PA11 and 12, which are made up of amide groups separated by 10 or 11 CH2 groups (Figure 1), are constructed by a longer aliphatic chain length, a higher concentration of methylene groups and a lower amount of hydrogen bonds per unit of mass in comparison to other PAs [11].
PA12 is an oil-based thermoplastic polyamide with a semicrystalline structure [13]. It can be prepared from laurolactam monomer as well as the corresponding w-amino acid [14]. Depending on the crystallization conditions, it can demonstrate different crystalline forms. The main crystal form of γ, which has hexagonal packing with a strong diffraction peak, is obtained from melting at atmospheric pressure [15]. The α form with a monoclinic lattice gives two diffraction peaks with d-spacing of around 0.37 nm and 0.44 nm [16]. Koch and Jue [17] also reported two other crystalline forms of α’ and γ’. The performance of this polyamide is highly dependent on its crystal structure and morphology. PA12 possesses the outstanding mechanical properties of PA6 and 66, such as hardness, tensile strength, fatigue and impact resistance, a low coefficient of friction and resistance to aromatic hydrocarbons [14]. Moreover, it has the lowest melting point (which is still high enough for most practical purposes) among the polyamides and a lower moisture absorption capacity [18]. Due to its relatively long hydrocarbon chain, the density of PA12 is only 1.01 g/cm3. Based on the mentioned characteristics, PA12 and its copolymers are used in many industries, especially in sports goods [19] (e.g., soccer shoes [20]), aerospace [21,22,23], automotives [24] (e.g., fuel tubes [25] and under-the-hood [26]), food (e.g., packaging [27,28,29]), health (e.g., femoral stems [30], hip implants [31] and biomedical [32]) and the oil and gas (e.g., oil and gas pipelines [33,34] and crude oil transport [35]) industry.
On the other hand, PA11 is a bio-based polyamide synthesized from renewable resources such as castor oil that, compared to oil-based PA12, has a lower carbon footprint [6,36]. The progressive demand for this polyamide is not only due to its biocompatibility but also because of its high impact strength, high fatigue resistance [37], low moisture absorption [38], close-molding tolerance and excellent chemical and aging resistance [39]. PA11 is a semicrystalline polyamide with six different reported crystalline phases, including α, α’, δ, δ’, γ and β [40,41]. Among them, α, α’ have a triclinic structure and δ, δ’, γ have a pseudohexagonal one. The mechanical properties of this polyamide are highly affected by these phases and the degree of crystallinity [42]. Low moisture absorption is one of the critical features of PA11, which is caused by increasing the ratio of methylene to amide groups [18]. Moreover, due to the relatively low processing temperature of PA11 (approximately 185 °C), this polymer is widely used as a matrix in natural fiber-reinforced composites because of the low thermal stability of natural fibers [43,44,45,46,47].
These polyamides have been processed by different techniques. For example, PA12 and PA11 are the most extensively utilized polymers with some categories of powder bed fusion (PBF) techniques. [48]. Lanzl et al. [49] employed selective laser sintering (SLS, one of the PBF sub-techniques) to manufacture and characterize copper-filled PA12 in terms of thermal conductivity. One of the advantages of this processing technique is the ability to produce parts with high geometric complexity. Pandelidi et al. [50] characterized PA11 powders processed by the multi-jet fusing technique (MJF, another category of PBF techniques) and investigated the effects of PA11 refresh ratios on its mechanical performance. These two polyamides are favorable in these techniques due to the broad temperature range between their melting and crystallization temperature during heating and cooling, respectively. Moreover, PA11 and PA12 have excellent printability in 3D printing techniques. In the study of Rahim et al. [3], the mechanical properties of PA12 printed parts were improved by employing the fused deposition modeling (FDM) technique and incorporating bioceramic fillers. On the other hand, there is a common polymer-processing technology of injection molding. Jariyavidyanont et al. evaluated the skin/core structure of injection-molded PA11. They found that the gradient of the semicrystalline structure in the skin and core of the injected polymer did not lead to shear-induced crystallization effects [51]. In another study, Meyer et al. [52] examined the effect of melting temperature, as the critical process parameter of the injection molding technique, to produce plates of PA12.
The hot press technique is still a popular processing method to produce non-complex-shaped polymers. In comparison to injection molding, it can provide a higher molding pressure and longer annealing time, which leads to superior properties in some aspects [53]. Moreover, the shear-induced issue during injection molding, which causes deformation or molecule orientation, does not occur in the hot press method. In addition, this technique is still more feasible and cost-efficient with respect to fusion-based techniques. As far as we are aware, many authors have studied the properties of sintered, molded or lasered PA11 and PA12. However, there is still a lack of information regarding comparing these two commercial polyamides simultaneously in terms of their mechanical, thermal and durability properties when manufactured using the hot press technique. To compensate for this research gap, the present study investigated the tensile, hardness, thermal and durability properties of hot-pressed PA11 and PA12 simultaneously for the first time. It is worth mentioning that this research study is the initial step toward future works to employ these two thermoplastics as a matrix in hybrid composites with carbon and natural fibers.

2. Materials and Methods

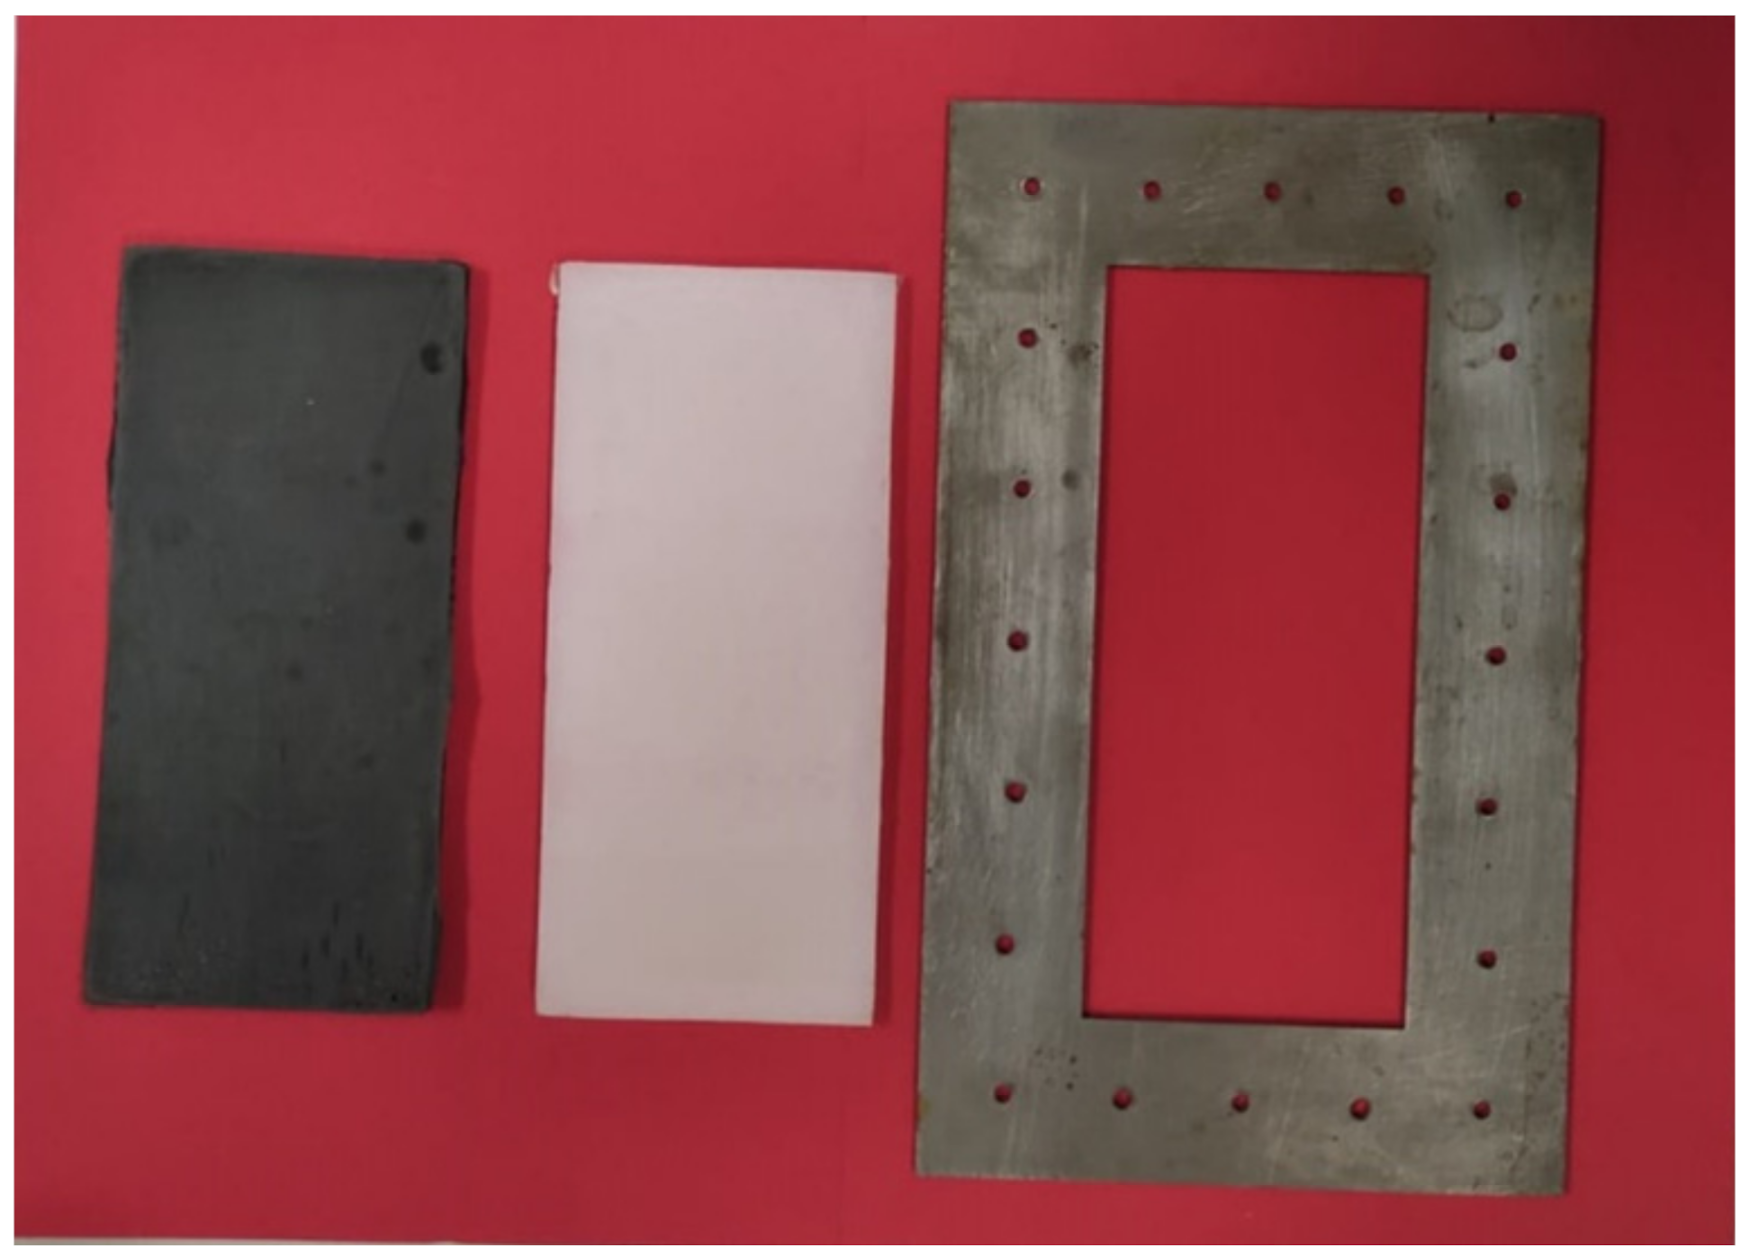
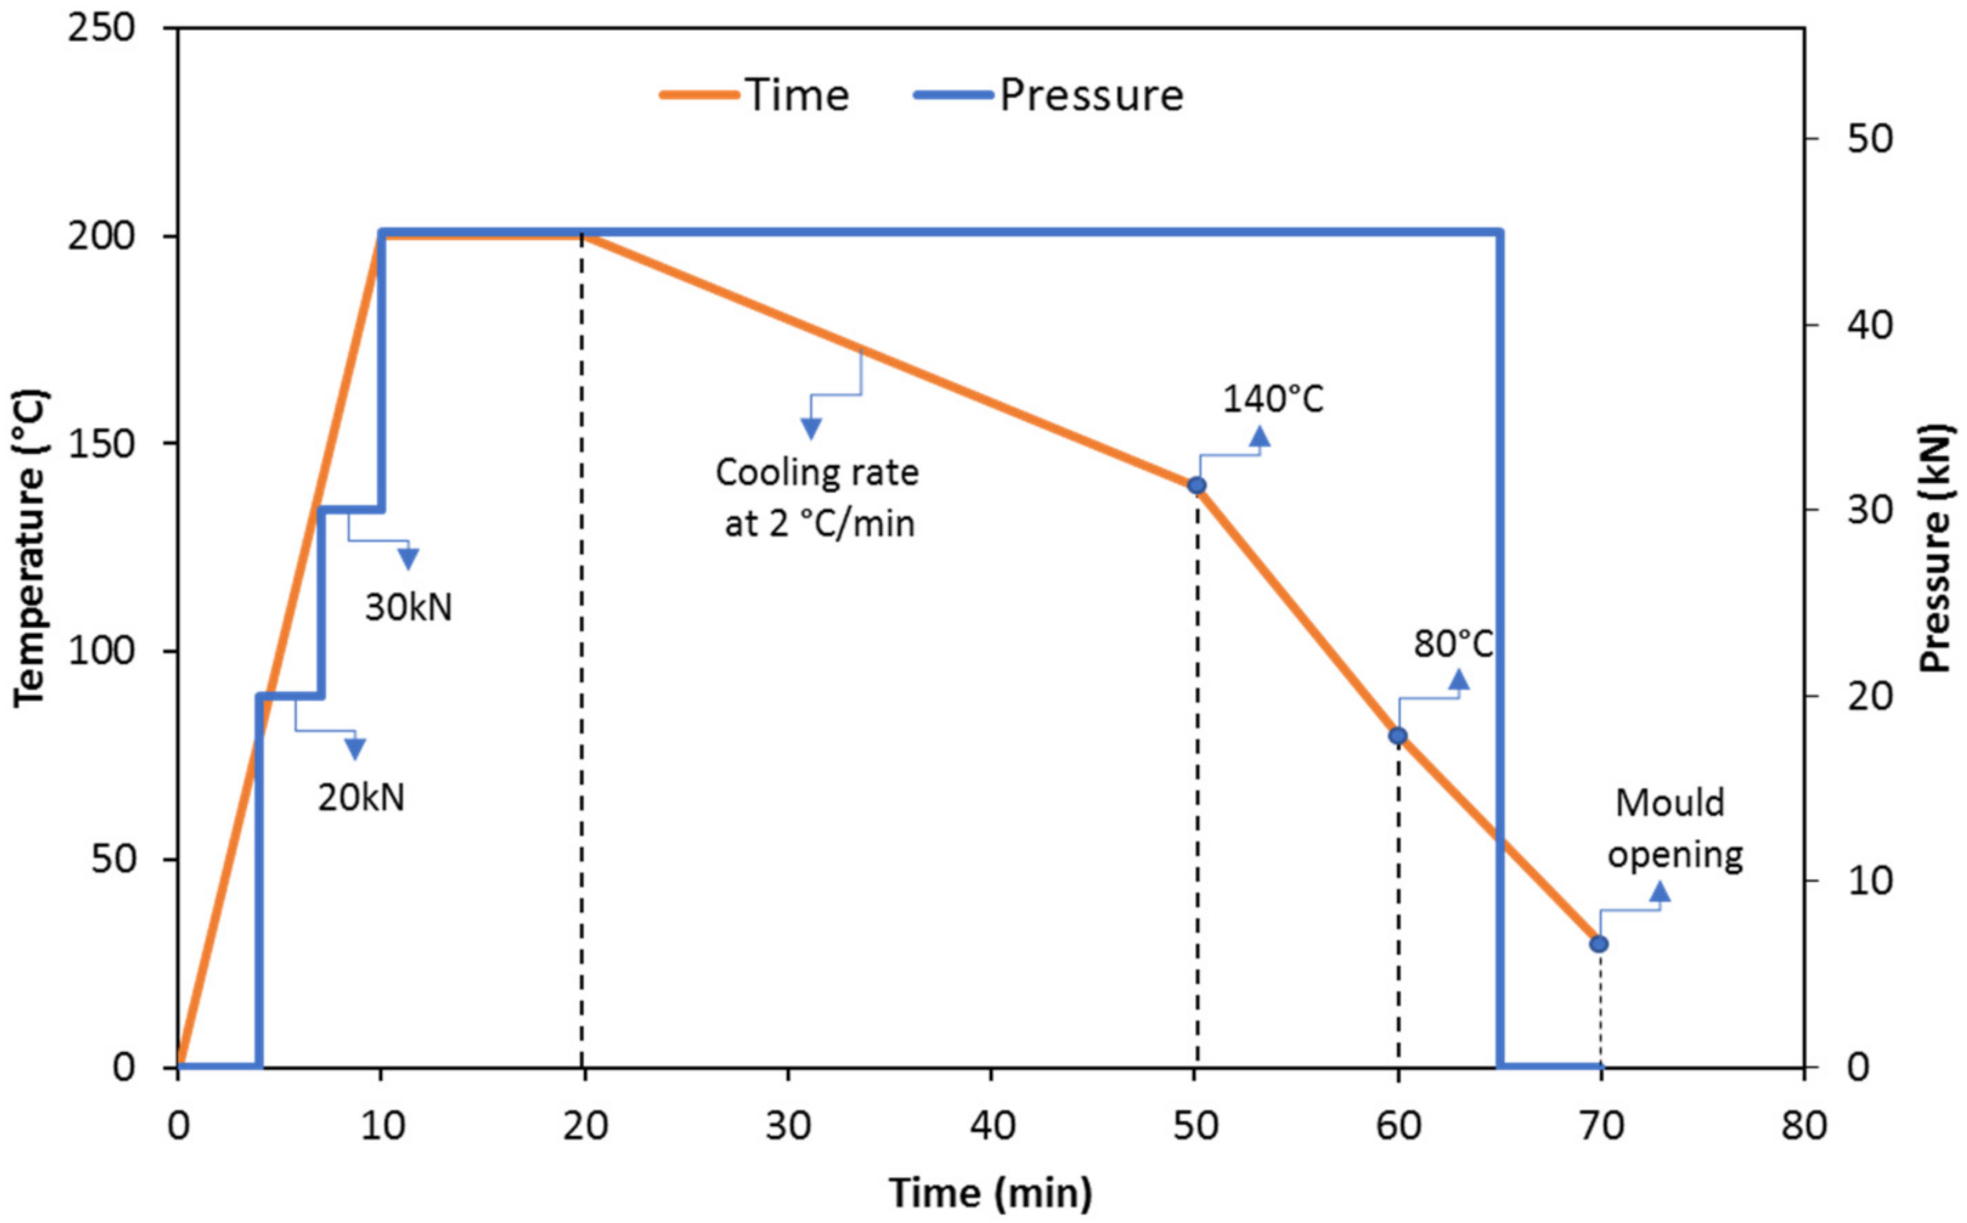
2.1. Materials and Sample Preparation

Commercial thermoplastic polyamide pellets (PA11 and PA12) were provided by Arkema (Madrid, Spain). PA sheets and bulks were prepared by a hot plate press machine (Fontune Presses TPB374, Barendrecht, The Netherlands). PA pellets were filled inside the steel mold; the mold was then sandwiched between two aluminum sheets of 2 mm and two steel plates of 3 mm thickness to produce bulk and sheets of polyamides with 4 mm and 1 mm thickness, respectively (Figure 2). PA pellets were melted in the hot press with a maximum temperature and pressure of 200 °C and 45 kN. The molding cycle is shown in Figure 3. Gradual pressure steps were employed to obtain better densification and remove the trapped air between pellets. The temperatures of 200 °C (during the heating) and 140 °C (during the cooling) were selected to fulfill the melting point and end of the crystallization peak according to the DSC results.

2.2. Mechanical Test

The tensile test was performed using a Universal Hydraulic Tensile Test Machine (Microtest EM2/FR, Madrid, Spain), according to the ASTM D638 standard. Five specific samples of each polyamide were cut to be tested according to the standard specimen dimensions. Tests were carried out with a load cell of 10 kN under a 0.5 mm/min crosshead speed. The anomalous results of these five specimens were checked by the statistical method of Grubbs.

2.3. X-ray Diffraction

The XRD experiment was conducted to study the crystal details of both powder and sheet PAs. The X-ray diffraction patterns were acquired using Philips X’Pert diffractometer provided with a PW3011/10 detector (Amsterdam, Netherlands) at a voltage of 40 kV and a current of 40 mA. The monochromatic radiation CuKα (λ = 1.54 Å, 40 kV and 40 mA) was performed at room temperature in the 10° < 2θ < 30° interval, with a stepping angle of 0.02° and point acquisition time of 1 s.

2.4. Differential Scanning Calorimetric (DSC) Technique

DSC analysis (DSC 822e, Mettler Toledo GmbH, Greifensee, Switzerland) was performed on the three polymer sheets of each polyamide to examine the thermal properties of the specimens. The DSC was performed with a heating rate of 20 °C/min in a temperature range of −20 °C to 200 °C. Aluminum crucibles of 40 µL were used and filled with 8–10 mg of polyamide. Moreover, nitrogen as a purge gas was fed at a rate of 50 mL/min. The degree of crystallinity was obtained with Equation (1) [54]:
X C = Δ H m Δ H m o × 100 % .  
where Xc is the degree of crystallinity, ΔHm is the melting enthalpy of the polymer and ΔHmo is the melting enthalpy of the 100% crystalline PAs (ΔHmo, PA11: 244 J/g [55], ΔHmo, PA12: 95 J/g [56]).

2.5. Fourier Transform Infrared Spectroscopy (FTIR)

The FTIR spectra of the PA sheets were captured using an infrared spectrometer machine (Brucker Optic GmbH, Madrid, Spain). The produced spectra at approximately 5–10 μm depth were recorded with a Bruker Tensor 27 spectrometer, which used a diamond prism with a resolution of 4 cm−1, 32 scans and an incident radiation angle of 45°. The attenuated total multiple reflection technique (ATR) was used to analyze the surface chemical modifications (FTIR-ATR). Three spectra were recorded for each polymer to ensure homogenous results.

2.6. Durability Test

The water or moisture absorption is facilitated in polyamides due to the presence of polar amide groups, by forming hydrogen bonds with water molecules [57]. Water and moisture can affect the polymer characteristics in terms of mechanical, chemical and physical properties as well as dimensional stability [58]. Absorbed water or moisture reduces entanglement between polymer chains, leading to increased chain mobility. This behavior, called the plasticizing effect, even reduces the potential sites for inter-polyamide chain hydrogen bonding [59]. Accordingly, the strength and stiffness would be decreased [60]. In this study, the water and moisture absorption behavior of polymers in water and relative humidity were evaluated. In this regard, the bulk polyamide specimens according to the standard (ASTM D570-98) were cut to dimensions of 20 × 20 × 4 mm3 and were placed into two different containers. The PAs were immersed in distilled water at room temperature in the first container for the water absorption measurement. The second container was filled with distilled water and maintained at a constant temperature of 23 °C and relative humidity of 50%. Then, specimens were placed on a grid to prevent contact with water. For both tests, the specimens were removed from each container after aging times of 2 h, 5 h, 24 h, 168 h, 360 h, 744 h, 1512 h and 1656 h; afterward, excess water from the surface of the samples was dried gently with tissue paper and weighed immediately. After each removal, water and moisture absorption was evaluated by the relative uptake of weight, Mt, according to Equation (2):
M t = W t W 0 W 0 × 100
where W0 is the weight of the initial specimen in dry conditions and Wt is the weight of the wet specimen at each aging time. Three specimens were measured for each aging time. Furthermore, during the durability test, the DSC and FTIR analyses were carried out on the specimens with the aging times of 2 h, 24 h, 360 h, 744 h and 1656 h to evaluate the behavior of the polymers after water and moisture uptake.

2.7. Hardness Measurement

The hardness of the PA specimens before and after the durability test was determined using the Shore-D durometer (Bareiss Prüfgerätebau Gmb, Oberdischingen, Germany) as per ASTM D-2240. The measurements were carried out on 9 points of the specimens in accordance with the standard, and the accuracy of results was checked with the Grubbs method, similarly to the tensile test.

3. Results and Discussion

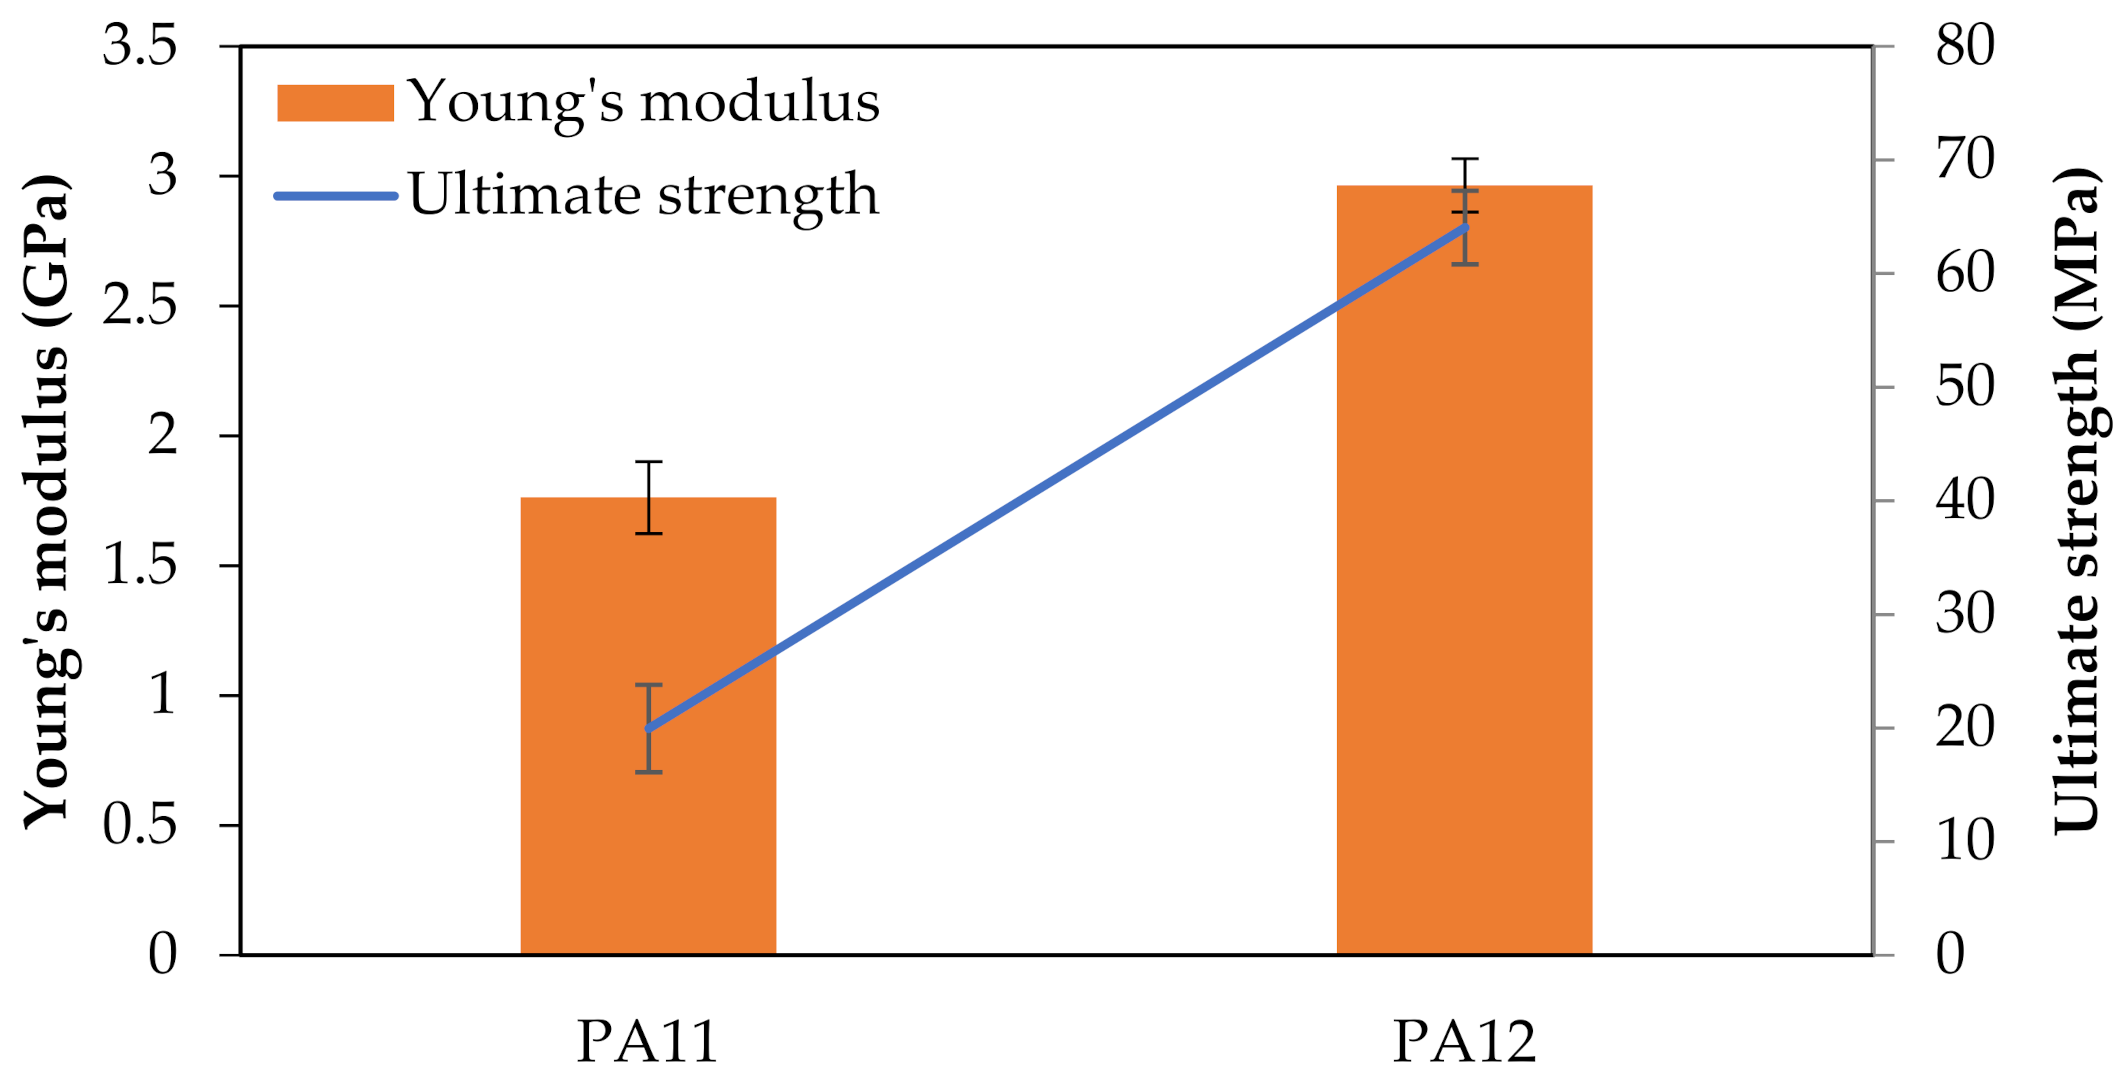
3.1. Tensile Strength

Figure 4 compares the stress–strain response of PA11 and PA12 under the tensile test. The tensile properties of PAs are also summarized in Table 1. PA11 showed quasi-brittle behavior; after the elastic deformation, the specimens underwent yielding followed by a plastic deformation region.
On the other hand, PA12 demonstrated highly ductile behavior. Samples were stretched up to 200% before breaking because of the high resistance to deformation. They had higher tensile strength, Young’s modulus as well as elongation in comparison to PA11 (Figure 5). Points 1 and 2 are the first and second yield stress, which correspond to the plasticization and breakage of crystals, respectively [61]. Moreover, point 3 is the beginning of necking, and the whitening phenomenon is significant at this point for thermoplastics [62]. The mentioned behavior of specimens under tensile load are compared in Figure 6.
The difference in the tensile properties of these two PAs can be explained in terms of the degree of crystallinity. The tensile strength and elastic modulus are directly related to the stiffer part of the structure, i.e., the crystal phase. Accordingly, the higher degree of crystallinity leads to superior tensile strength and elastic modulus. As will be discussed in Section 3.3, the DSC results showed a higher degree of crystallinity in PA12, which validates the tensile test results.
SEM observations were performed on cross-sections of the fractured polymers after tensile loading. To better explain the SEM images, understanding the microstructure of PA11 and PA12 and the fraction mechanisms is essential. These polymers are semicrystalline, comprising crystalline and amorphous phases; thus, their microstructure is highly heterogenous. The crystalline lamella is connected to the amorphous region by non-entangled chains or taut tiemolecules [63,64]. Due to the significantly lower Young’s modulus of amorphous regions compared to crystal lamella, the first deformation usually occurs in the lamellar amorphous phase in the form of lamella separation, interlamellar shear and rotation of lamellar stacks. This usually happens at small strains before yielding [65]. Interlamellar separation causes strong hydrostatic tension within the constrained amorphous network, which leads to mixed fracture behavior. On one hand, this local stress can be relieved through cavitation within the amorphous network around the yielding point. On the other hand, simultaneously, the highly extended tie chains transfer concentrated forces to the crystal lamella. The latter results in slipping on the preferred lattice planes, lamella fragmentation, chain unfolding and/or crystal breakup [64,66].
As illustrated in Figure 7a, the fragmentation appears within the waviness fracture surface of PA12 in the form of folds or rounded kinks of lamella. The large kinks (Figure 7b) are usually formed by significant plastic strain, which is typical for a ductile fracture. This fracture type was also reported once both slip in the crystals and deformation of the amorphous regions occurred simultaneously [67]. On the contrary, Figure 8a exhibits a smooth surface for the quasi-brittle fracture of PA11. According to Figure 8b,c, the deformation occurred in the form of chain tilting and twisting by slipping and orienting along the force direction under the tension.
Table 2 compares the tensile properties of the current study with previous works. PA12 exhibited improved tensile properties with respect to other studies. A higher degree of crystallinity would be an essential parameter for this achievement. Furthermore, the higher impact pressure of the hot press technique regarding injection molding and laser sintering resulted in a more compact structure with lower porosity and better tensile properties. As for PA11, although it had a higher elastic modulus, its ultimate strength was lower than in previous works. This can be explained by the more brittle behavior of the produced polymer in this study, besides the lower degree of crystallinity compared to the other works. The low elongation at break is evidence for this hypothesis. Moreover, this variance may be attributed to differences in the type of feedstock of PA11 and also the manufacturing methods. A better comparison might be obtained by considering the porosity percentage of each study, which is beyond the scope of the current study.

3.2. X-ray Diffraction

It is well-documented that the PAs investigated in this research have two different kinds of crystal forms: α crystals and γ crystals. PA12 has a monoclinic structure as α crystals, while PA11 has a triclinic structure as α crystals. Additionally, all of the PAs have a pseudohexagonal crystal structure as γ crystals. PA11 has a predominant amount of α crystals, while PA12 tends to contain γ crystals instead of α crystals [77]. Figure 9 exhibits the XRD patterns of PAs in the form of powder and sheets. The principal differences between the powder and sheet XRD results arise from the fact that powders are generally analyzed by Theta/2Theta geometry. In contrast, sheets typically are analyzed in grazing incidence geometry. Moreover, measurements on powders will always display a random orientation of the grains, whereas sheet crystals show more pronounced peaks for one lattice plane due to the preferred orientation, and all the others have substantially lowered or even absent peak intensities. In this regard, the sheet patterns are considered in this study.
As shown in Figure 9a, the XRD pattern of the PA11 sheet has an amorphous halo with two crystalline reflection peaks corresponding to the α phase at 2θ = 20.5° and 23.7° (Table 3), respectively, associated with the (100) and (010/110) planes with a “d spacing” of 0.432 nm and 0.375 nm, indicating the presence of the triclinic α-form of PA11 [78,79,80]. In the literature, it is reported that these two reflection peaks merge into a single reflection peak of pseudohexagonal γ-phase upon increasing the temperature [81,82]. Similarly, PA12 is a semicrystalline polymer, and therefore the PA12 sheet exhibits a crystalline peak at 21.45° indicating the γ-crystal form (100) corresponding to d spacings of 0.413 nm [83].
In linear aliphatic polyamides, it is a controlling factor for crystalline phases that all the hydrogen bonds are completely satisfied [84]. To this aim, in PA11 and PA12, the chains would be adept in two different configurations (Figure 10) and can orient in a parallel or antiparallel way in the α and γ phase depending on the number of CH2 groups in the structure. Within the α phase of PA11, the chains appear in a fully extended configuration, and hydrogen bonds form a large molecular sheet by occurring between amides in the same plane as the CH2 zig-zags. Within the γ phase of PA12, the chains appear in a slightly twisted configuration, and hydrogen bonds occur between antiparallel chains [3,78,84]. Regarding the phase stability, the α and γ phase have close internal energy, reported from 0.045 to 1.30 kcal/mol as energy differences [85,86,87,88]. In computational studies, it was shown that for polyamides with less than six methylene units (n < 6), the α phase is more stable, and for those with more than six (n > 6), the γ phase is more stable [85,88]. Although this agrees with the results of the last part that PA12 with the γ phase is more stable and has higher tensile properties, most of the computational studies focus on defect-free crystals. Thus, due to the inevitable presence of defects and also the slight differences in phases’ internal energy, a direct relation between mechanical properties and the type of crystal phase is unreliable.

3.3. DSC Analyses

Thermal properties were measured by DSC for sheets of PA11 and PA12. The thermographs obtained during the first and second heating are depicted in Figure 11. On the right-hand side of the heating curves, the sharp endothermic peaks present a melting point, and on the left-hand side, the lower-temperature zone shows the glass transition. Moreover, the exothermic peaks in cooling curves are assigned to the recrystallization process. Melting temperature (Tm), recrystallization temperature (Tc), melting enthalpy (ΔH) and degree of crystallinity (Xc), which were measured based on Equation (1), are shown in Table 4. The degree of crystallinity of PA12 is around 2.1 times more than PA11, which is one of the reasons for the higher tensile properties and lower water absorption of PA12. Moreover, PA12 has a greater recrystallization enthalpy than melting enthalpy, which produces a higher melting peak and a slight increase in Tg within the second heating. For PA11, the opposite takes place.
Furthermore, Figure 12 compares the first heating cycle of PA powders with their sheets. It was observed that after hot pressing the PA11 powder, Tg decreased and Xc increased. The thermal history of powder is erased by heating in the hot press; then, the enthalpy of relaxation (known as aging) disappears, and any water adsorbed on the surface is lost. Since the cooling in the hot press is slow, there is more time for crystallization; thus, the crystallinity increases and Tg decreases. For PA12, in addition to the mentioned explanation, recrystallization must occur in the hot press before melting due to the heat effect. However, during DSC, this process is not known. Thus, the Tg decreased, and the crystallinity was the same as that of the powder. The powders’ thermal properties as determined by DSC are presented in Tables S1 and S2 of the Supplementary Materials.

3.4. FTIR-ATR Analyses

Figure 13 illustrates the obtained spectra for both hot-pressed PAs. All spectra were normalized based on the methyl peak (around 2918 cm−1). Very similar peaks were obtained for both PA11 and PA12. The typical bands for PA11 and PA12, i.e., amide I, amide II and amide III, were observed at 1635 cm−1, 1540 cm−1 and 1275 cm−1, respectively. The intense bands for these two polyamides were symmetric and antisymmetric stretching vibrations of C-H at 2850.7 cm−1 and 2918.2 cm−1, respectively. Furthermore, the characterization bands in the region from 3500 cm−1 to 3000 cm−1 belong to the hydrogen-bonded N-H stretching (3080 cm−1) and OH/NH groups (3400–3100 cm−1). A shoulder at 1429 cm−1 represents the CH2 scissor vibration. Curve-fitting results are listed in Table 5. Both spectra showed a small peak corresponding to the carboxyl group (O-C=O). This peak can be used to provide information about possible acid hydrolysis in the material.

3.5. Durability Test

Weight gain measurements after the durability test for each aging time are shown in Figure 14 and Figure 15. For both PAs, there is an increase in the water/moisture gain% when increasing the aging time. When approaching the saturation level, because the diffusion flux became zero, less water was absorbed until the water and moisture gain remained constant. After around two months, both PAs had the same saturation level for water and moisture absorption, i.e., 1.5% and 0.8%, respectively. These values show a resistance improvement compared to other reported manufacturing techniques such as laser sintering [13,90] and injection molding [91], which can be explained by the low porosity of the polymers processed by the hot press.
However, consistent with previous reports [58,92], PA12 absorbs the least water among all polyamides at each aging time due to the lower concentration of amides in the polymer chain. Moreover, the overall hydrophobicity of the polyamide increases with a higher repeating unit length, which is equivalent to an increase in the methylene:amide group ratio per repeat unit. The higher degree of crystallinity in PA12 may have been another underlying cause for the lower water absorption since water is absorbed in the amorphous regions, where the hydrogen bonds are free to interact with moisture [60].
In order to investigate the effect of absorbed water and moisture on the absorbance bands of PAs, FTIR-ATR analysis was performed on the test specimens up to the saturation level. Since the water absorbance bands are overlapped with amine bands (3400–3100 cm−1), it is impossible to confirm whether there was an amine reaction or free water absorption from the gathered FTIR spectra in relation to this band. However, based on the peaks’ intensity in the regions of 3400–3100 cm−1 (OH and NH stretching) and 1750–1500 cm−1 (amide/amine N-H deformation, C=N stretching and C-N stretching of amides), it is possible to track the water absorption effects. The water molecules are first bound to the polymer by forming hydrogen bonds with the C=O and the −NH. Then, the remaining water diffuses into the free volume, making it impossible to detect free absorbed water in the FTIR spectra.
Figure 16 and Figure 17 compare the mentioned peaks for PA11 and PA12 after the durability test for 774 h and saturation level. To better interpret the peaks, the area under each curve was measured (Tables S3–S6 and Figures S1–S4 in the Supplementary Material). In Figure 16a–d, the peaks assigned to OH/NH stretching (PA11-W/RH: 3306 cm−1 and PA12-W/RH: 3292 cm−1) decreased upon the durability test compared to the neat PAs. The only exception is that the absorbing band belonging to 774 h in PA11-RH had a 39% increase in curve area, which might be due to the reversible reaction of water with amide groups.
In addition, Figure 17 reveals that the peaks associated with amide I (C=O bonds at 1635 cm−1) decreased after absorbing water and moisture. This reduction for PA11 was higher in both cases of water (49%) and moisture (39%) absorption compared to PA12 (13% and 19% for water and moisture, respectively), meaning a higher tendency of the amide group in PA11 to react with absorbed water and form a hydrogen bond. This implies a decrease in molecular weight and accordingly a destructive hydrolysis process, because hydrolysis leads to chain scissions, contributing to lowering the molecular weight [93]. In other words, a decrease in molecular weight encourages a plasticizing effect, which interrupts the intermolecular hydrogen bonding and increases segmental motion [9]. Although the plasticizing effect is more evident at high temperatures [94], it also occurs at low temperatures with embrittlement effects in PAs [95].
Since the deionized water used in the durability test had a pH value of around 6, the acid hydrolysis process was expected [38,96]. According to Figure 18, after the reaction of water with amide groups, hydrolysis leads to the destruction of amides by chain scission [97]. Each chain scission forms an amine and carboxylic acid end-group as reaction products. Amides hydrolyze slowly due to their basic leaving groups as well as the weak nucleophilicity of water. The determining step of the reaction rate in this process is the formation of the tetrahedral intermediate by protonation of carbonyl oxygen and subsequently the nucleophilic attack of the water. This step is followed by the transfer of a proton from water to the amine. Then, the tetrahedral intermediate breaks down into carboxylic and amine groups. This process is a reversible reaction, meaning that the amine end can attack the carboxylic end and create a longer-chain polymer [59,98].
The amide hydrolysis process can be verified in the FTIR spectra; on the one hand, the O−C=O peak (1716 cm−1) intensity increased (Figure 17), especially in PA12, after water immersion and moisture absorption. On the other hand, bonded NH at 3082 cm−1 increased in all tested PAs.
All the PAs that were subjected to water immersion and relative humidity were evaluated by DSC analysis. The thermal properties after each aging time were measured and are shown in Table 6. Different parameters led to almost unchanged thermal properties. The distribution of values was evaluated by analysis of variance (ANOVA). The p-value of ANOVA was lower than the confidence interval (95% or alpha = 0.05), which proves similarity of all data. Firstly, the water/moisture gain was less than 1.5%, which is a relatively low amount; consequently, the hydrolysis process would be slight. Secondly, the durability test was performed at room temperature; thus, there was no phase transformation within the structure of the polyamides. In this regard, the only visible change was the slight decrease in Tg during the aging, which was assumed to result from the hydrolysis, which promotes the mobility of amorphous chains. The differences found in crystallinity show that the process is reversible; when the crystallinity decreases, the amorphous phase increases and vice versa. Although the differences are minimal, this may be due to measurement error since this analysis cannot be repeated more than three times to avoid changes in the sample.
The results of the Shore-D hardness measurements are presented in Table 7. As can be seen, the hardness values are nearly the same before and after aging for both PA11 and PA12, meaning that water and moisture did not affect the hardness of specimens. It can be concluded that the water/moisture absorption was not sufficient to deteriorate the hardness of the polymers. This means that there was no plasticizing effect. It shows that acid hydrolysis was slight; consequently, the mechanical properties were not compromised. Since abrasive resistance is an essential property for tribological applications, the Shore-D test confirmed the hardness stability of PA11 and PA12 in applications that require tribological properties in humid or wet environments.

4. Conclusions

In this study, hot-pressed PA11 and PA12 sheets were characterized employing XRD, DSC, FTIR and SEM imaging. Furthermore, the manufactured PAs were compared in terms of tensile properties, hardness and durability. Compared to the other manufacturing techniques (e.g., SLS and injection molding), the hot press method still has some benefits, such as high molding pressure, which can lead to superior material properties. The XRD and DSC results revealed that the predominate crystal phases in PA11 and PA12 are the triclinic α-phase and pseudohexagonal γ-phase, respectively, resulting in 21% and 49% crystallinity. By comparing the stress–strain curves and SEM micrographs, it could be concluded that PA12 has superior tensile properties with ductile behavior, which resulted in a waviness fracture surface consisting of folds or rounded kinks. Due to the presence of more crystalline phases, which provided more ductility, the tensile properties of PA12 were significantly improved with respect to previous works. On the contrary, PA11 with quasi-brittle behavior had a smooth fracture surface consisting of tilted and twisted lamella.
After two months of aging, both PA11 and PA12 had relatively low water (1.5 wt%) and moisture (0.8 wt%) gain under water and 50% relative humidity conditions. A much greater reduction in the C=O peak intensity in the FTIR spectra of PA11 after the durability test proved the greater tendency of this polyamide with respect to PA12 in terms of water/moisture absorption. Furthermore, a decrease in molecular weight and increase in bonded −NH implied slight hydrolysis. However, a low amount of absorbed water/moisture and hydrolysis did not deteriorate the dimensional stability or mechanical properties of the polyamides, such as hardness. In brief, although the bio-based PA11 is preferable over oil-based PA12 from an environmental perspective, PA12 is a more exploitable option due to the better mechanical performance and durability. The aim of future work is to employ these two commercial polyamides as matrices of hybrid composites to achieve high-performance materials.

Supplementary Materials

The following are available online at https://www.mdpi.com/article/10.3390/polym13203553/s1, Table S1: Thermal properties of PA11 powder analyzed by DSC; Table S2: Thermal properties of PA12 powder analyzed by DSC; Figure S1: Comparison of OH/NH and amide I bands for PA11-W at different aging times; Table S3: Calculated area assigned to each FTIR peak for PA11-W; Figure S2: Comparison of OH/NH and amide I bands for PA11-RH at different aging times; Table S4: Calculated area assigned to each FTIR peak for PA11-RH; Figure S3: Comparison of OH/NH and amide I bands for PA12-W at different aging times; Table S5: Calculated area assigned to each FTIR peak for PA12-W; Figure S4: Comparison of OH/NH and amide I bands for PA12-RH at different aging times; Table S6: Calculated area assigned to each FTIR peak for PA12-RH.

Author Contributions

Conceptualization and methodology, M.B., J.A. and M.A.M.; writing—original draft preparation, M.B.; writing—review and editing, M.B., J.A. and M.A.M.; supervision, J.A. and M.A.M. All authors have read and agreed to the published version of the manuscript.

Funding

This research received no external funding.

Conflicts of Interest

The authors declare no conflict of interest.

References

  1. Deopura, B.; Alagirusamy, R.; Joshi, M.; Gupta, B. Polyesters and Polyamides; Elsevier: Amsterdam, The Netherlands, 2008. [Google Scholar]
  2. MacGregor, A.; Graham, J.; Stafford, G.; Huggett, R. Recent experiences with denture polymers. J. Dent. 1984, 12, 146–157. [Google Scholar] [CrossRef]
  3. Rahim, T.; Abdullah, A.; Akil, H.M.; Mohamad, D.; Rajion, Z. The improvement of mechanical and thermal properties of pol-yamide 12 3D printed parts by fused deposition modelling. Express Polym. Lett. 2017, 11, 963–982. [Google Scholar] [CrossRef]
  4. Primc, G. Surface modification of polyamides by gaseous plasma—Review and scientific challenges. Polymer 2020, 12, 3020. [Google Scholar] [CrossRef] [PubMed]
  5. Štěpánová, V.; Šrámková, P.; Sihelník, S.; Stupavská, M.; Jurmanová, J.; Kováčik, D. The effect of ambient air plasma generated by coplanar and volume dielectric barrier discharge on the surface characteristics of polyamide foils. Vacuum 2021, 183, 109887. [Google Scholar] [CrossRef]
  6. Martino, L.; Basilissi, L.; Farina, H.; Ortenzi, M.A.; Zini, E.; di Silvestro, G.; Scandola, M. Bio-based polyamide 11: Synthesis, rhe-ology and solid-state properties of star structures. Eur. Polym. J. 2014, 59, 69–77. [Google Scholar] [CrossRef]
  7. Lao, S.; Yong, W.; Nguyen, K.; Moon, T.; Koo, J.; Pilato, L.; Wissler, G. Flame-retardant polyamide 11 and 12 nanocomposites: Processing, morphology, and mechanical properties. J. Compos. Mater. 2010, 44, 2933–2951. [Google Scholar] [CrossRef]
  8. Jia, N.; Kagan, V.A. Interpretations of tensile properties of polyamide 6 and PET based thermoplastics using ASTM and ISO procedures. In Limitations of Test Methods for Plastics; ASTM International: Pennsylvania, PA, USA, 2008; p. 54. [Google Scholar]
  9. Marchildon, K. Polyamides—Still Strong After Seventy Years. Macromol. React. Eng. 2011, 5, 22–54. [Google Scholar] [CrossRef]
  10. Chemsystems Online. PERP Program—Nylon 6 and Nylon 66; White Plains Inc.: White Plains, NY, USA, 2009. [Google Scholar]
  11. Telen, L.; van Puyvelde, P.; Goderis, B. Random copolymers from polyamide 11 and polyamide 12 by reactive extrusion: Syn-thesis, eutectic phase behavior, and polymorphism. Macromolecules 2016, 49, 876–890. [Google Scholar] [CrossRef]
  12. Zhou, C.; Qi, S.; Zhu, P.; Zhao, Y.; Xu, Y.; Dong, X.; Wang, D. The methylene infrared vibration and dielectric behavior monitored by amide group arrangement for long chain polyamides. Polymer 2020, 190, 122231. [Google Scholar] [CrossRef]
  13. Salazar, A.; Rico, A.; Rodríguez, J.; Escudero, J.S.; Seltzer, R.; de la Escalera Cutillas, F.M. Monotonic loading and fatigue response of a bio-based polyamide PA11 and a petrol-based polyamide PA12 manufactured by selective laser sintering. Eur. Polym. J. 2014, 59, 36–45. [Google Scholar] [CrossRef]
  14. Griehl, W.; Ruestem, D. Nylon-12-preparation, properties, and applications. Ind. Eng. Chem. 1970, 62, 16–22. [Google Scholar] [CrossRef]
  15. Hiramatsu, N.; Haraguchi, K.; Hirakawa, S. Study of transformations among α, γ and γ’forms in nylon 12 by x-ray and DSC. Jpn. J. Appl. Phys. 1983, 22, 335. [Google Scholar] [CrossRef]
  16. Wu, J.; Xu, X.; Zhao, Z.; Wang, M.; Zhang, J. Study in performance and morphology of polyamide 12 produced by selective laser sintering technology. Rapid Prototyp. J. 2018, 24, 813–820. [Google Scholar] [CrossRef]
  17. Li, L.; Koch, M.H.; de Jeu, W.H. Crystalline structure and morphology in nylon-12: A small-and wide-angle X-ray scattering study. Macromolecules 2003, 36, 1626–1632. [Google Scholar] [CrossRef]
  18. Page, I. Polyamides as Engineering Thermoplastic Materials; iSmithers Rapra Publishing: Shrewsbury, Shropshire, UK, 2000. [Google Scholar]
  19. Ullah, H.; Harland, A.R.; Silberschmidt, V.V. Dynamic bending behaviour of woven composites for sports products: Experiments and damage analysis. Mater. Des. 2015, 88, 149–156. [Google Scholar] [CrossRef] [Green Version]
  20. Pelt, M.V. Bio-Based Polyamides: Environmental Impact and Applicability in Soccer Shoe Outsoles. Master’s Thesis, Utrecht University, Utrecht, The Netherlands, 2016. [Google Scholar]
  21. Williams, G.; Trask, R.; Bond, I. A self-healing carbon fibre reinforced polymer for aerospace applications. Compos. Part A Appl. Sci. Manuf. 2007, 38, 1525–1532. [Google Scholar] [CrossRef]
  22. Paggi, R.; Salmoria, G.; Lago, A.; Beal, V. Functionally graded PA12/MWCNTs composite fabricated by SLS to aerospace ap-plications: Mechanical and electrical behavior. In Innovative Developments in Design and Manufacturing; CRC Press: Boca Raton, FL, USA, 2009; pp. 241–246. [Google Scholar]
  23. Griffiths, K. Polyamides in aerospace industry. Trans. IMF 2007, 85, 235–236. [Google Scholar] [CrossRef]
  24. Mayyas, A.; Qattawi, A.; Omar, M.; Shan, D. Design for sustainability in automotive industry: A comprehensive review. Renew. Sustain. Energy Rev. 2012, 16, 1845–1862. [Google Scholar] [CrossRef]
  25. Iwasa, T.; Funaki, A.; Nishi, E.; Laganis, E.; Isobe, N.; Nishioka, T.; Nakamura, K. Development of Two-Layer Fuel Tube System Consisting of Adhesive-ETFE And Modified-PA12; SAE International: Warrendale, PA, USA, 2004. [Google Scholar]
  26. Bhattacharya, A.B.; Chatterjee, T.; Naskar, K. Automotive applications of thermoplastic vulcanizates. J. Appl. Polym. Sci. 2020, 137, 49181. [Google Scholar] [CrossRef]
  27. Heimrich, M.; Bönsch, M.; Nickl, H.; Simat, T. Cyclic oligomers in polyamide for food contact material: Quantification by HPLC-CLND and single-substance calibration. Food Addit. Contam. Part A 2012, 29, 846–860. [Google Scholar] [CrossRef]
  28. Stoffers, N.H.; Dekker, M.; Linssen, J.P.H.; Störmer, A.; Franz, R. Alternative fatty food simulants and diffusion kinetics of nylon 12 food packaging. Food Addit. Contam. 2003, 20, 949–959. [Google Scholar] [CrossRef]
  29. Gill, Y.Q.; Abid, U.; Song, M. High performance Nylon12/clay nanocomposites for potential packaging applications. J. Appl. Polym. Sci. 2020, 137, 49247. [Google Scholar] [CrossRef]
  30. Campbell, M.; Bureau, M.N. Performance of CF/PA12 composite femoral stems. J. Mater. Sci. Mater. Med. 2007, 19, 683–693. [Google Scholar] [CrossRef]
  31. Rahim, E. Nondestructive Evaluation of a Polymer Composite Hip Implant Using Lock-In Thermography. Master’s Thesis, Ryerson University, Ontario, ON, Canada, 2010. [Google Scholar]
  32. Rahim, T.N.A.T.; Abdullah, A.M.; Akil, H.M.; Mohamad, D. Comparison of mechanical properties for polyamide 12 compo-site-based biomaterials fabricated by fused filament fabrication and injection molding. AIP Conf. Proc. 2016, 1791, 020007. [Google Scholar]
  33. Mason, J.F.; Stanley, M.; Ponda, A.; Demicoli, D. Case study: Engineered polyamide 12 (PA12) pipeline liner for management of sour gas corrosion at elevated temperatures. In CORROSION 2017; OnePetro: Richardson, TX, USA, 2017. [Google Scholar]
  34. Khalid, H.U.; Ismail, M.C.; Nosbi, N. Permeation damage of polymer liner in oil and gas pipelines: A review. Polymer 2020, 12, 2307. [Google Scholar] [CrossRef]
  35. Blevins, C.J. Characterization of Polyamide-12; Hydrolysis Kinetics Comparison, and the Study of Crude-oil Pipeline Appli-cations. Bachelor’s Thesis, College of William and Mary, Williamsburg, VA, USA, 2013. [Google Scholar]
  36. Panaitescu, D.M.; Gabor, R.A.; Frone, A.N.; Vasile, E. Influence of thermal treatment on mechanical and morphological char-acteristics of polyamide 11/cellulose nanofiber nanocomposites. J. Nanomater. 2015, 16, 4. [Google Scholar]
  37. McKeen, L.W. Fatigue and Tribological Properties of Plastics and Elastomers; William Andrew Publishing: Norwich, NY, USA, 2016. [Google Scholar]
  38. Jacques, B.; Werth, M.; Merdas, I.; Thominette, F.; Verdu, J. Hydrolytic ageing of polyamide 11. 1. Hydrolysis kinetics in water. Polymer 2002, 43, 6439–6447. [Google Scholar] [CrossRef]
  39. Nayak, P.L. Natural Oil-Based Polymers: Opportunities and challenges. J. Macromol. Sci. Part C 2000, 40, 1–21. [Google Scholar] [CrossRef]
  40. Zhang, G.; Li, Y.; Yan, D. Polymorphism in nylon-11/montmorillonite nanocomposite. J. Polym. Sci. Part B Polym. Phys. 2003, 42, 253–259. [Google Scholar] [CrossRef]
  41. Mathias, L.J.; Powell, D.G.; Autran, J.P.; Porter, R.S. Nitrogen-15 NMR characterization of multiple crystal forms and phase transitions in polyundecanamide (Nylon 11). Macromolecules 1990, 23, 963–967. [Google Scholar] [CrossRef]
  42. Nair, S.S.; Ramesh, C.; Tashiro, K. Crystalline phases in nylon-11: Studies using HTWAXS and HTFTIR. Macromolecules 2006, 39, 2841–2848. [Google Scholar] [CrossRef]
  43. Botelho, E.; Rezende, M.; Lauke, B. Mechanical behavior of carbon fiber reinforced polyamide composites. Compos. Sci. Technol. 2003, 63, 1843–1855. [Google Scholar] [CrossRef]
  44. Kuciel, S.; Kuzniar, P.; Liber-Knec, A. Polyamides from renewable sources as matrices of short fiber reinforced biocomposites. Polimer 2012, 57, 627–634. [Google Scholar] [CrossRef]
  45. Feldmann, M.; Bledzki, A.K. Bio-based polyamides reinforced with cellulosic fibres—Processing and properties. Compos. Sci. Technol. 2014, 100, 113–120. [Google Scholar] [CrossRef]
  46. Oksman, K.; Mathew, A.P.; Sain, M. Novel bionanocomposites: Processing, properties and potential applications. Plast. Rubber Compos. 2009, 38, 396–405. [Google Scholar] [CrossRef]
  47. Bahrami, M.; Abenojar, J.; Martínez, M.Á. Recent progress in hybrid biocomposites: Mechanical properties, water absorption, and flame retardancy. Materials 2020, 13, 5145. [Google Scholar] [CrossRef]
  48. Cai, C.; Tey, W.S.; Chen, J.; Zhu, W.; Liu, X.; Liu, T.; Zhao, L.; Zhou, K. Comparative study on 3D printing of polyamide 12 by selective laser sintering and multi jet fusion. J. Mater. Process. Technol. 2021, 288, 116882. [Google Scholar] [CrossRef]
  49. Lanzl, L.; Wudy, K.; Greiner, S.; Drummer, D. Selective laser sintering of copper filled polyamide 12: Characterization of powder properties and process behavior. Polym. Compos. 2018, 40, 1801–1809. [Google Scholar] [CrossRef]
  50. Pandelidi, C.; Lee, K.P.M.; Kajtaz, M. Effects of polyamide-11 powder refresh ratios in multi-jet fusion: A comparison of new and used powder. Addit. Manuf. 2021, 40, 101933. [Google Scholar]
  51. Jariyavidyanont, K.; Williams, J.L.; Rhoades, A.M.; Kühnert, I.; Focke, W.; Androsch, R. Crystallization of polyamide 11 during injection molding. Polym. Eng. Sci. 2017, 58, 1053–1061. [Google Scholar] [CrossRef]
  52. Meyer, T.; Harland, A.; Haworth, B.; Holmes, C.; Lucas, T.; Sherratt, P. The influence of different melt temperatures on the me-chanical properties of injection molded PA-12 and the post process detection by thermal analysis. Int. Polym. Process. 2017, 32, 90–101. [Google Scholar] [CrossRef]
  53. Yang, X.; Yang, W.; Fan, J.; Wu, J.; Zhang, K. Effects of molding on property of thermally conductive and electrically insulating polyamide 6–based composite. J. Thermoplast. Compos. Mater. 2019, 32, 1190–1203. [Google Scholar] [CrossRef]
  54. Campoy, I.; Gómez, M.; Marco, C. Structure and thermal properties of blends of nylon 6 and a liquid crystal copolyester. Polymer 1998, 39, 6279–6288. [Google Scholar] [CrossRef]
  55. Wunderlich, B. Thermal Analysis of Polymeric Materials; Springer Science & Business Media: Berlin/Heidelberg, Germany, 2005. [Google Scholar]
  56. Kaiser, G.; Füglein, E.; Jeschke, Y.; Kapsch, E.; Steidl, D. Handbook Differential Scanning Calorimetry (DSC) on Polymers; NETZSCH-Gerätebau GmbH: Selb, Germany, 2015. [Google Scholar]
  57. Acierno, S.; Van Puyvelde, P. Rheological behavior of polyamide 11 with varying initial moisture content. J. Appl. Polym. Sci. 2005, 97, 666–670. [Google Scholar] [CrossRef]
  58. Nguyen, P.H.; Spoljaric, S.; Seppälä, J. Redefining polyamide property profiles via renewable long-chain aliphatic segments: Towards impact resistance and low water absorption. Eur. Polym. J. 2018, 109, 16–25. [Google Scholar] [CrossRef]
  59. Meyer, A.; Jones, N.; Lin, Y.; Kranbuehl, D. Characterizing and modeling the hydrolysis of polyamide-11 in a pH 7 water en-vironment. Macromolecules 2002, 35, 2784–2798. [Google Scholar] [CrossRef]
  60. Paolucci, F.; Peters, G.W.; Govaert, L.E. Plasticity-controlled failure of sintered and molded polyamide 12: Influence of temper-ature and water absorption. J. Appl. Polym. Sci. 2020, 137, 48525. [Google Scholar] [CrossRef] [Green Version]
  61. Bélec, L. Contribution of the amorphous and crystal phase of polyamide 11 and polyamide 12 during their straining in the transition range. Doctoral dissertation. Poitiers 1995. [Google Scholar]
  62. Maïza, S.; Lefebvre, X.; Brusselle-Dupend, N.; Klopffer, M.H.; Cangémi, L.; Castagnet, S.; Grandidier, J.C. Physicochemical and mechanical degradation of polyamide 11 induced by hydrolysis and thermal aging. J. Appl. Polym. Sci. 2019, 136, 47628. [Google Scholar] [CrossRef]
  63. Wietzke, S.; Jansen, C.; Reuter, M.; Jung, T.; Hehl, J.; Kraft, D.; Chatterjee, S.; Greiner, A.; Koch, M. Thermomorphological study of the terahertz lattice modes in polyvinylidene fluoride and high-density polyethylene. Appl. Phys. Lett. 2010, 97, 022901. [Google Scholar] [CrossRef]
  64. Kausch, H.-H.; Gensler, R.; Grein, C.; Plummer, C.J.G.; Scaramuzzino, P. Crazing in semicrystalline thermoplastics. J. Macromol. Sci. Part B 1999, 38, 803–815. [Google Scholar] [CrossRef]
  65. Zhang, Y.; Ben Jar, P.-Y.; Xue, S.; Li, L. Quantification of strain-induced damage in semi-crystalline polymers: A review. J. Mater. Sci. 2018, 54, 62–82. [Google Scholar] [CrossRef]
  66. Gümüs, S.; Lackner, J.M.; Polat, Şeyda; Kraschitzer, W.; Hanning, H.; Bayram, A.; Kaya, M.; Çallı, M.; Alkan, A. Failure behavior of PA12 based SLS lattice structure with macro-porosity. In MATEC Web of Conferences; EDP Sciences: Les Ulis, France, 2018; Volume 188, p. 03007. [Google Scholar]
  67. Kinloch, A.J.; Young, R.J. Fracture Behaviour of Polymers; Springer Science & Business Media: Berlin/Heidelberg, Germany, 1995. [Google Scholar]
  68. Russo, P.; Simeoli, G.; Vitiello, L.; Filippone, G. Bio-Polyamide 11 Hybrid Composites Reinforced with Basalt/Flax Interwoven Fibers: A Tough Green Composite for Semi-Structural Applications. Fibers 2019, 7, 41. [Google Scholar] [CrossRef] [Green Version]
  69. Huynh, M.D.; Trung, T.H.; Van Cong, D.; Hoang, T.; Dantras, E.; Lacabanne, C.; Giang, N.V. Effect of Maleic Anhydride Grafted Ethylene Vinyl Acetate Compatibilizer on the Mechanical, Thermal Properties and Weathering Resistance of Polyamide 11/Bamboo Fiber Composite. Mater. Trans. 2020, 61, 1527–1534. [Google Scholar] [CrossRef]
  70. Takahashi, Y.; Suzumoto, Y.; Enomoto, K. Functionalization of carbon nanofiber and its effect on tensile properties of PA11 matrix composite reinforced with carbon nanofiber. AIP Conf. Proc. 2016, 1779, 040001. [Google Scholar]
  71. Francisco, D.L.; De Paiva, L.B.; Aldeia, W.; Lugão, A.B.; Moura, E.A.B. Investigation on mechanical behaviors of polyamide 11 reinforced with halloysite nanotubes. In Characterization of Minerals, Metals, and Materials; Springer: Cham, Switzerland, 2019; pp. 693–701. [Google Scholar]
  72. Zierdt, P.; Theumer, T.; Kulkarni, G.; Däumlich, V.; Klehm, J.; Hirsch, U.; Weber, A. Sustainable wood-plastic composites from bio-based polyamide 11 and chemically modified beech fibers. Sustain. Mater. Technol. 2015, 6, 6–14. [Google Scholar] [CrossRef]
  73. Walter, R.; Friedrich, K.; Gurka, M. Characterization of mechanical properties of additively manufactured polymers and composites. In AIP Conference Proceedings; AIP Publishing: College Park, MD, USA, 2018; Volume 1981, p. 020033. [Google Scholar]
  74. Almansoori, A.; Majewski, C.; Rodenburg, C. Nanoclay/polymer composite powders for use in laser sintering applications: Effects of nanoclay plasma treatment. JOM 2017, 69, 2278–2285. [Google Scholar] [CrossRef] [Green Version]
  75. Connor, H.J.O.; Dowling, D.P. Comparison between the properties of polyamide 12 and glass bead filled polyamide 12 using the multi jet fusion printing process. Addit. Manuf. 2020, 31, 100961. [Google Scholar] [CrossRef]
  76. Doagou-Rad, S.; Islam, A.; Antusch, S.; Jung, J.; Klein, A.; Plewa, K.; Piotter, V. Investigation of conductive hybrid polymer composites reinforced with copper micro fibers and carbon nanotubes produced by injection molding. Mater. Today Commun. 2019, 20, 100566. [Google Scholar] [CrossRef]
  77. Aharoni, S.M. n-Nylons: Their Synthesis, Structure, and Properties; Wiley-Blackwell: Hoboken, NJ, USA, 1997. [Google Scholar]
  78. Fornes, T.; Paul, D. Structure and properties of nanocomposites based on nylon-11 and-12 compared with those based on ny-lon-6. Macromolecules 2004, 37, 7698–7709. [Google Scholar] [CrossRef]
  79. Hu, G.S.; Ding, Z.Y.; Li, Y.C.; Wang, B.B. Crystalline morphology and melting behavior of nylon11/ethylene-vinyl alco-hol/dicumyl peroxide blends. J. Polym. Res. 2009, 16, 263–269. [Google Scholar] [CrossRef]
  80. Liu, T.; Lim, K.P.; Tjiu, W.C.; Pramoda, K.; Chen, Z.-K. Preparation and characterization of nylon 11/organoclay nanocomposites. Polymer 2003, 44, 3529–3535. [Google Scholar] [CrossRef]
  81. Liu, T.; Chen, D.; Phang, I.Y.; Wei, C. Studies on crystal transition of polyamide 11 nanocomposites by variable-temperature X-ray diffraction. Chin. J. Polym. Sci. 2013, 32, 115–122. [Google Scholar] [CrossRef]
  82. Ricou, P.; Pinel, E.; Juhasz, N. Temperature experiments for improved accuracy in the calculation of polyamide-11 crystallinity by X-ray diffraction. Adv. X-ray Anal. 2005, 48, 171–175. [Google Scholar]
  83. Bai, L.; Hong, Z.; Wang, D.; Li, J.; Wang, X.; Pan, G.; Li, L.; Li, X. Deformation-induced phase transitions of polyamide 12 in its elastomer segmented copolymers. Polymer 2010, 51, 5604–5611. [Google Scholar] [CrossRef]
  84. Inoue, K.; Hoshino, S. Crystal structure of nylon 12. J. Polym. Sci. Polym. Phys. Ed. 1973, 11, 1077–1089. [Google Scholar] [CrossRef]
  85. Quarti, C.; Milani, A.; Civalleri, B.; Orlando, R.; Castiglioni, C. Ab initio calculation of the crystalline structure and IR spectrum of polymers: Nylon 6 polymorphs. J. Phys. Chem. B 2012, 116, 8299–8311. [Google Scholar] [CrossRef]
  86. Arabnejad, S.; Manzhos, S.; He, C.; Shim, V.P.W. Shear-induced conformation change in α-crystalline nylon6. Appl. Phys. Lett. 2014, 105, 221910. [Google Scholar] [CrossRef]
  87. Bernadó, P.; Alemán, C.; Puiggalí, J. Relative stability between the α and γ forms of even nylons based on group contributions. Eur. Polym. J. 1999, 35, 835–847. [Google Scholar] [CrossRef]
  88. Dasgupta, S.; Hammond, W.B.; Goddard, W.A. Crystal structures and properties of nylon polymers from theory. J. Am. Chem. Soc. 1996, 118, 12291–12301. [Google Scholar] [CrossRef]
  89. Socrates, G. Infrared and Raman Characteristic Group Frequencies: Tables and Charts; Wiley: Hoboken, NJ, USA, 2004. [Google Scholar]
  90. Seltzer, R.; de la Escalera, F.M.; Segurado, J. Effect of water conditioning on the fracture behavior of PA12 composites processed by selective laser sintering. Mater. Sci. Eng. A 2011, 528, 6927–6933. [Google Scholar] [CrossRef]
  91. McKeen, L.W. The Effect of Creep and Other Time Related Factors on Plastics and Elastomers; Elsevier: Amsterdam, The Netherlands, 2015. [Google Scholar]
  92. Tanaka, K.; Mizuno, S.; Honda, H.; Katayama, T.; Enoki, S. Effect of water absorption on the mechanical properties of carbon fiber/polyamide composites. J. Solid Mech. Mater. Eng. 2013, 7, 520–529. [Google Scholar] [CrossRef] [Green Version]
  93. Mazan, T.; Berggren, R.; Jørgensen, J.K.; Echtermeyer, A. Aging of polyamide 11. Part 1: Evaluating degradation by thermal, mechanical, and viscometric analysis. J. Appl. Polym. Sci. 2015, 132, 20. [Google Scholar] [CrossRef]
  94. Roy, S. Moisture-induced degradation. In Long-Term Durability of Polymeric Matrix Composites; Springer: Boston, MA, USA, 2012; pp. 181–236. [Google Scholar]
  95. Venoor, V.; Park, J.H.; O Kazmer, D.; Sobkowicz, M.J. Understanding the effect of water in polyamides: A review. Polym. Rev. 2021, 61, 598–645. [Google Scholar] [CrossRef]
  96. El-Mazry, C.; Correc, O.; Colin, X. A new kinetic model for predicting polyamide 6-6 hydrolysis and its mechanical embrittle-ment. Polym. Degrad. Stab. 2012, 97, 1049–1059. [Google Scholar] [CrossRef] [Green Version]
  97. Caglieri, S.C.; Pagnan, M. Theoretical study on the acid hydrolysis of aliphatic and aromatic amides. Inf. tecnológica 2013, 24, 35–40. [Google Scholar] [CrossRef]
  98. Smith, P. The Effect of Ethanol, Methanol, and Water on the Hydrolytic Degradation of Polyamide-11. Bachelor’s Thesis, College of William and Mary, Williamsburg, VA, USA, 2016. [Google Scholar]
Figure 1. Chemical structure of PA11 and PA12 [12] (N: number of methylene groups between amide groups). Copyright 2020 Elsevier.
Polymers 13 03553 g001
Figure 2. Hot-pressed PAs.
Polymers 13 03553 g002
Figure 3. Hot press cycle for manufacturing PA samples.
Polymers 13 03553 g003
Figure 4. Stress–strain curves of PA11 and PA12 upon tensile test.
Polymers 13 03553 g004
Figure 5. Comparison of tensile properties between PA11 and PA12.
Polymers 13 03553 g005
Figure 6. Comparison of tensile specimens: (a) PA12, (b) PA11.
Polymers 13 03553 g006
Figure 7. SEM micrographs of the PA12 fracture surface: (a) magnification of 100×, (b) magnification of 2000×.
Polymers 13 03553 g007
Figure 8. SEM micrographs of the PA11 fracture surface: (a) magnification of 100×, (b) magnification of 400×, (c) magnification of 2000×.
Polymers 13 03553 g008
Figure 9. XRD patterns for PAs in the form of powder and sheets: (a) PA11, (b) PA12.
Polymers 13 03553 g009
Figure 10. Chains in the (a) fully extended and (b) twisted configuration in PAs. Adapted from [84]. Copyright 1973 John Wiley and Sons.
Polymers 13 03553 g010
Figure 11. DSC thermograms of PA sheets (heating rate: 20 °C/min): (a) PA11, (b) PA12.
Polymers 13 03553 g011
Figure 12. DSC thermograms of PA powders and sheets in the first heating cycle.
Polymers 13 03553 g012
Figure 13. FTIR spectra of hot-pressed PA11 and PA12.
Polymers 13 03553 g013
Figure 14. Water gain of PA11 and PA12 at different aging times.
Polymers 13 03553 g014
Figure 15. Moisture gain of PA11 and PA12 at different aging times.
Polymers 13 03553 g015
Figure 16. Comparison of OH/NH band between PA11 and PA12 after water and moisture absorption: (a) PA11-W; (b) PA12-W; (c) PA11-RH; (d) PA12-RH.
Polymers 13 03553 g016
Figure 17. Comparison of amide I band between PA11 and PA12 after water and moisture absorption: (a) PA11-W; (b) PA12-W; (c) PA11-RH; (d) PA12-RH.
Polymers 13 03553 g017
Figure 18. Reversible reaction of an amide in an acid medium in polyamides.
Polymers 13 03553 g018
Table 1. Tensile properties of PA11 and PA12.
E (MPa)Ultimate Strength (MPa)Elongation at Break (%)
PA111762.2 ± 138.320.0 ± 3.84
PA122964.3 ± 102.864.0 ± 3.2200
Table 2. Comparison of tensile properties between the present study and previous works.
Manufacturing TechniqueE (GPa)Ultimate Strength (MPa)Elongation at Break (%)χc (%)Ref.
PA11Hot press1.720423Present work
Hot press1.044.92627[68]
Hot press0.332252-[69]
SLS1.349.6-28[7]
Injection molding-39Without break-[70]
Extrusion1.236.5235-[71]
Injection molding1.348137-[72]
PA12Hot press2.96420049Present work
Hot press1.751.2163 [73]
Hot press0.839.624-[74]
HP jet fusion1.2471926[75]
Injection molding1.335230-[76]
SLS1.742.27-[73]
SLS1.433--[7]
Table 3. XRD experimental peak positions in PA11 and PA12.
Phase2θ°
PA11α (triclinic)20.5
23.7
PA12γ (hexagonal)21.45
Table 4. Thermal properties of studied polyamides by DSC.
PA11PA12
1st HeatingCooling2nd Heating 1st HeatingCooling2nd Heating
Tg (°C)44.49 45.95Tg (°C)42.77 49.29
Tm (°C)193.90 188.50Tm (°C)178.86 178.05
Tc (°C) 162.52 Tc (°C) 144.07
∆H (J/g)51.8739.2747.86∆H (J/g)46.5257.1547.15
χc (%)23.1617.5321.37χc (%)49.4860.1649.63
Table 5. Curve-fitting results of FTIR spectra for PA11 and PA12 [89].
Frequency (cm−1)Vibration
3301N−H stretching strong band/OH
3082NH groups weak band
2918CH2 asymmetric stretching
2850CH2 symmetric stretching
1732O−C=O
1635Amide I, C=O stretching
1550Amide II, C- stretching + C=O in-plane bending
1465CH2 bending asym
1367CH2 bending sym
1275Amide III, NH−O stretching
1226C−O−C streching sym/CH2 bending
1111CH3 rocking
934C−C(O) stretching mode (amide IV)
721CH2 rocking/C=O deformation
678NH out-of-plane mode (amide V)
Table 6. Thermal properties of studied polyamides by DSC after the durability test.
PropertySample0 h2 h24 h360 h744 h1656 h
Tg (°C)PA11-HR44.4942.3440.6239.3439.7839.89
Tm (°C)193.9194.98197.89194.3193.28195.16
∆H (J/g)51.8752.5545.75148.2257.83
χc (%)23.1623.4620.422.7721.5325.82
Tg (°C)PA11-WA44.4942.5742.8342.0740.5941.22
Tm (°C)193.9195.02194.67194.62195.25195.16
∆H (J/g)51.8750.2744.8844.8448.4357
χc (%)23.1622.4420.0320.0221.6225.45
Tg (°C)PA12-HR42.7741.8941.6139.8437.7139.33
Tm (°C)178.86180.94185.94184.14182.96184.88
∆H (J/g)46.5250.1340.1133.2647.0945.83
χc (%)49.4852.7742.2235.0149.5748.25
Tg (°C)PA12-WA42.7743.3547.0348.0140.9239.95
Tm (°C)178.86184.03182.66182.06182.46184.2
∆H (J/g)46.524334.5646.1739.4946.64
χc (%)49.4845.2636.3848.641.5749.09
Table 7. Shore-D hardness values (±2) for PA11 and PA12 at different aging times.
Time (h)PA11-RHPA12-RHPA11-WPA12-W
074737473
2474717473
36074727473
74474727471
165673747272
Publisher’s Note: MDPI stays neutral with regard to jurisdictional claims in published maps and institutional affiliations.

