
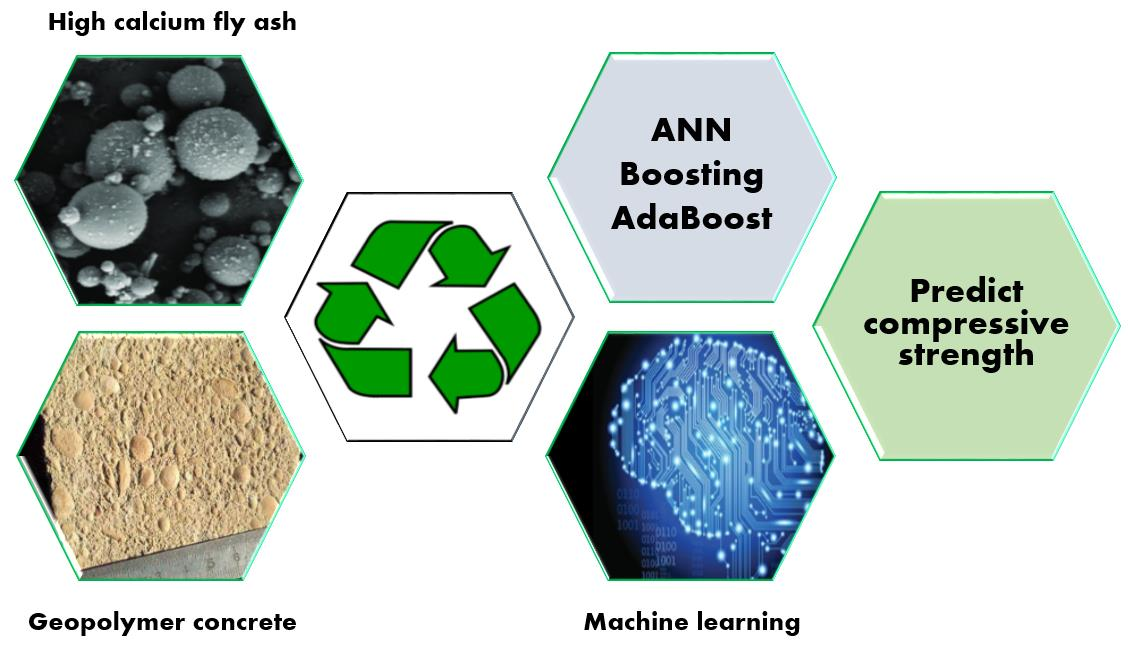
Prediction of Geopolymer Concrete Compressive Strength Using Novel Machine Learning Algorithms

 , , , , , and
Abstract
:
1. Introduction
2. Literature Review
3. Methodology and Data Description
3.1. Artificial Neural Network (ANN)
3.2. Boosting Algorithm
3.3. AdaBoost Algorithm
4. Results and Discussions
4.1. Statistical Results from Artificial Neural Network (ANN) Model
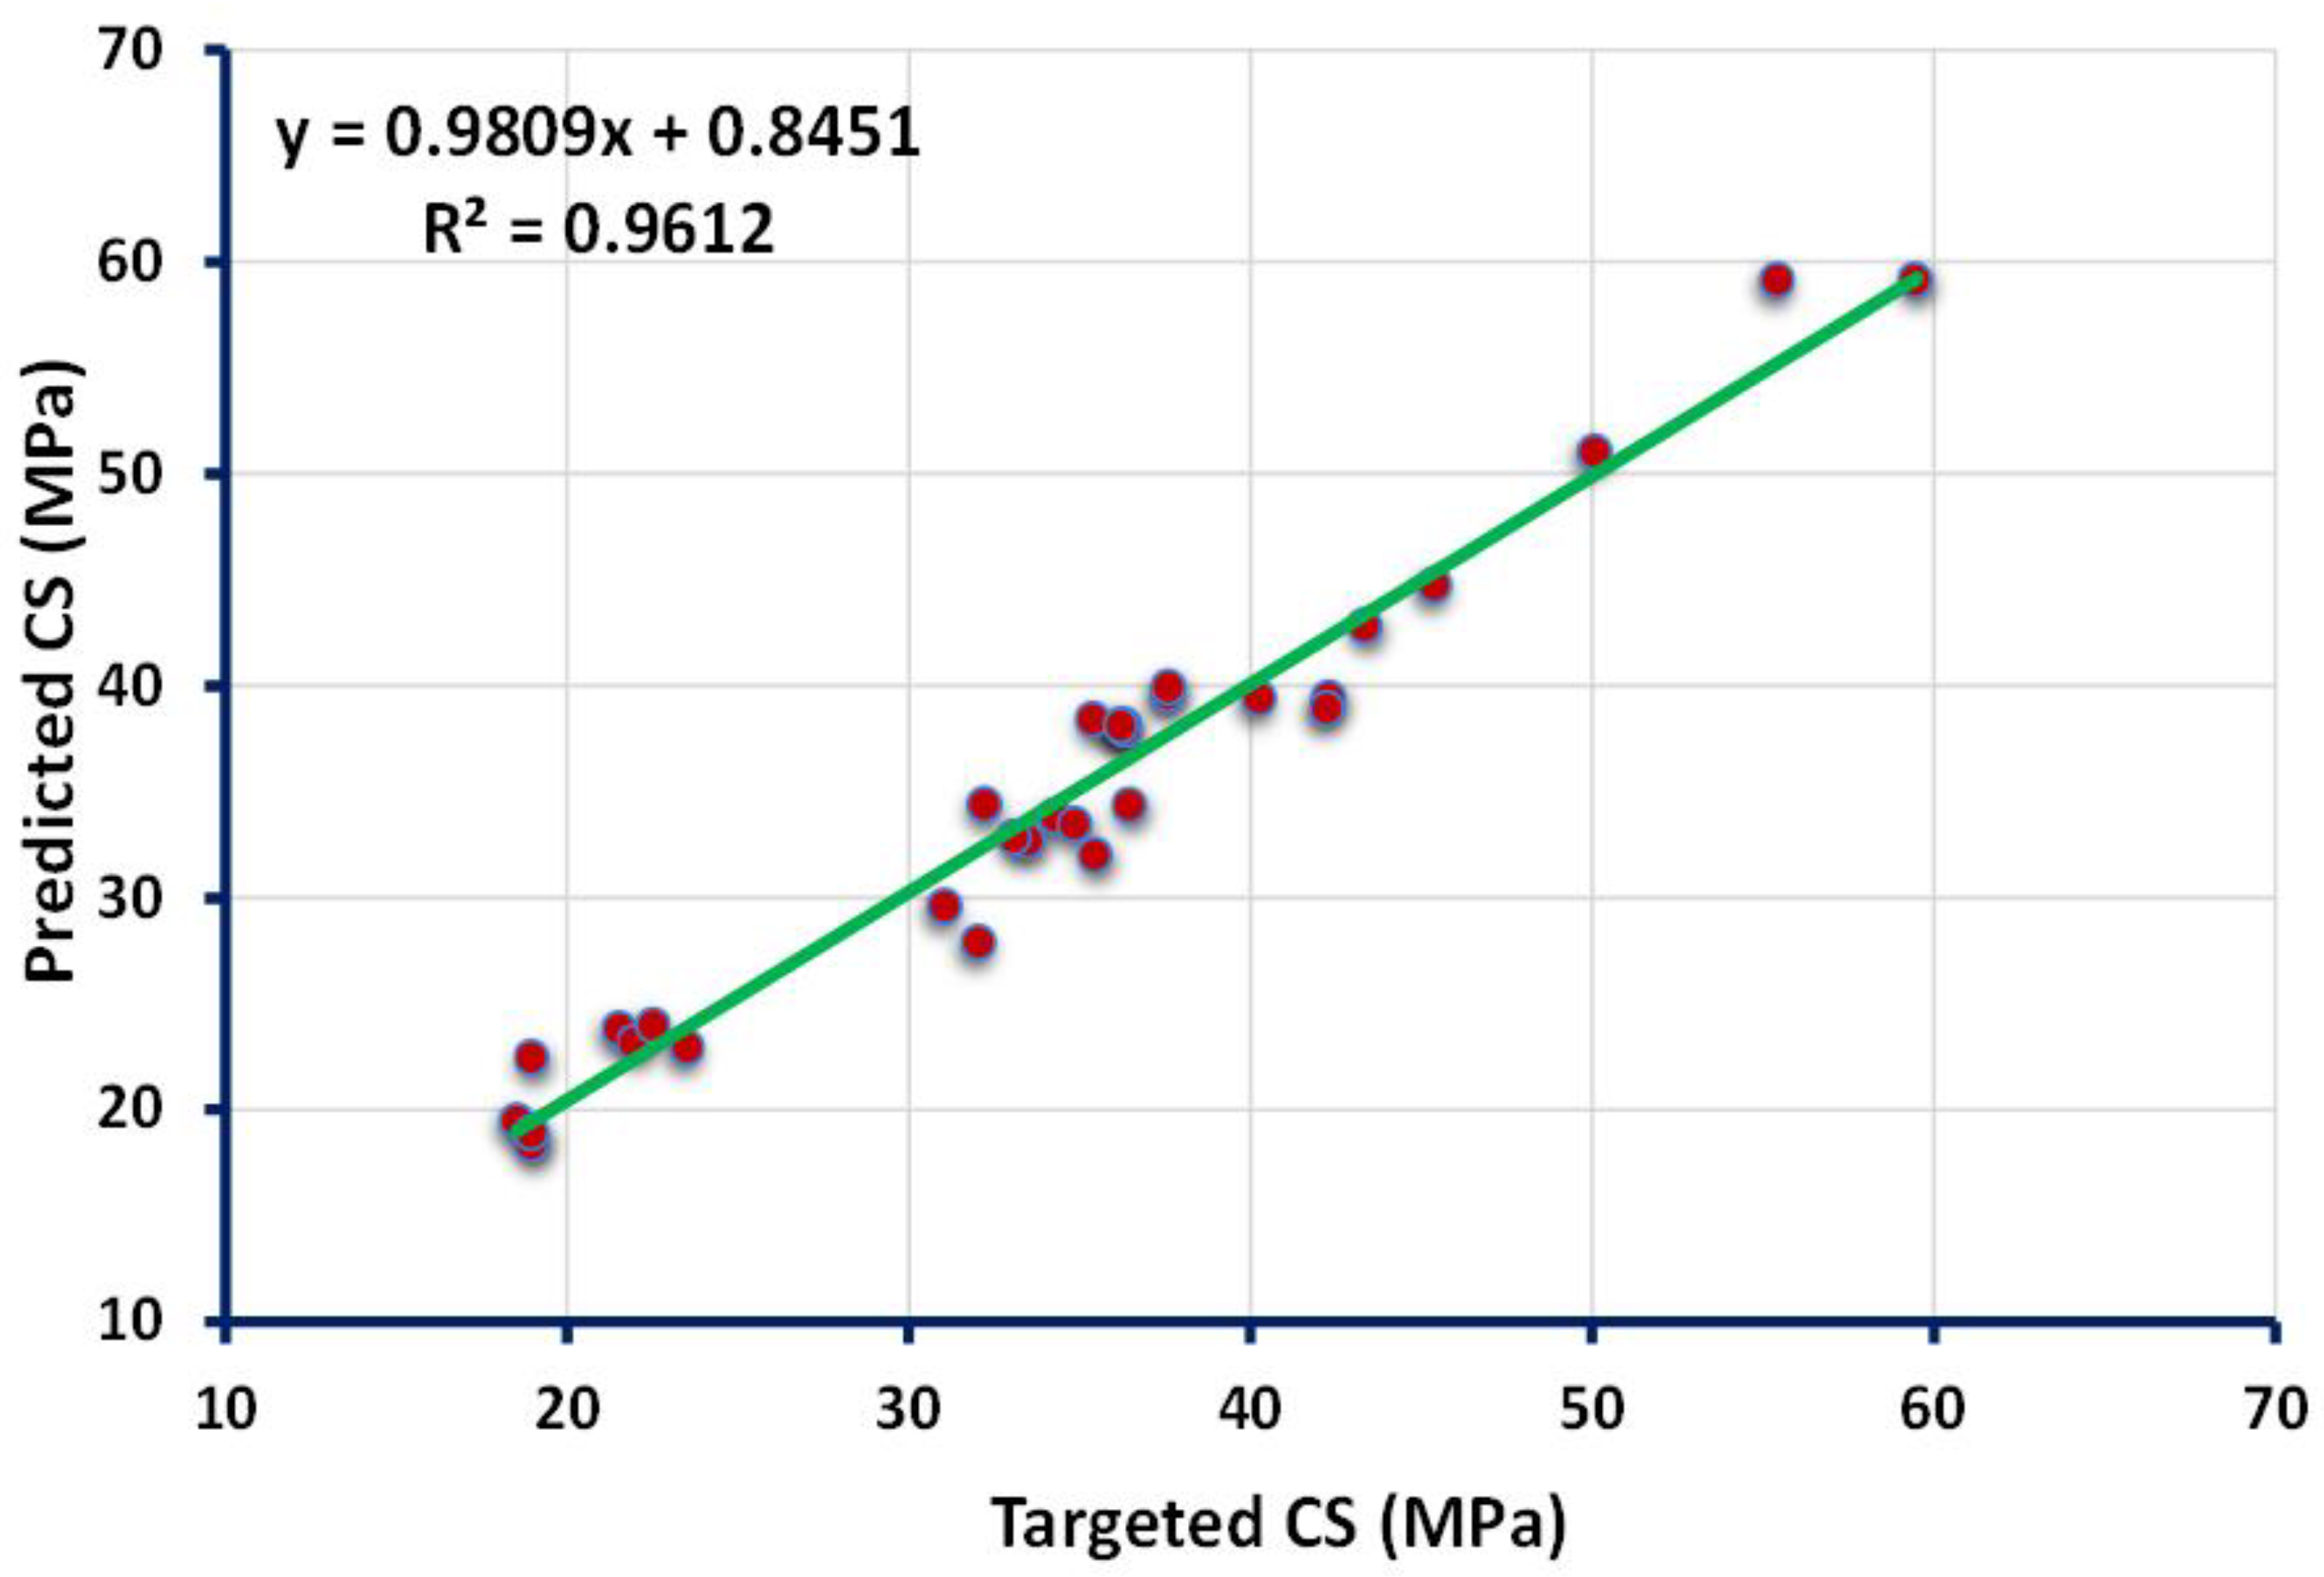
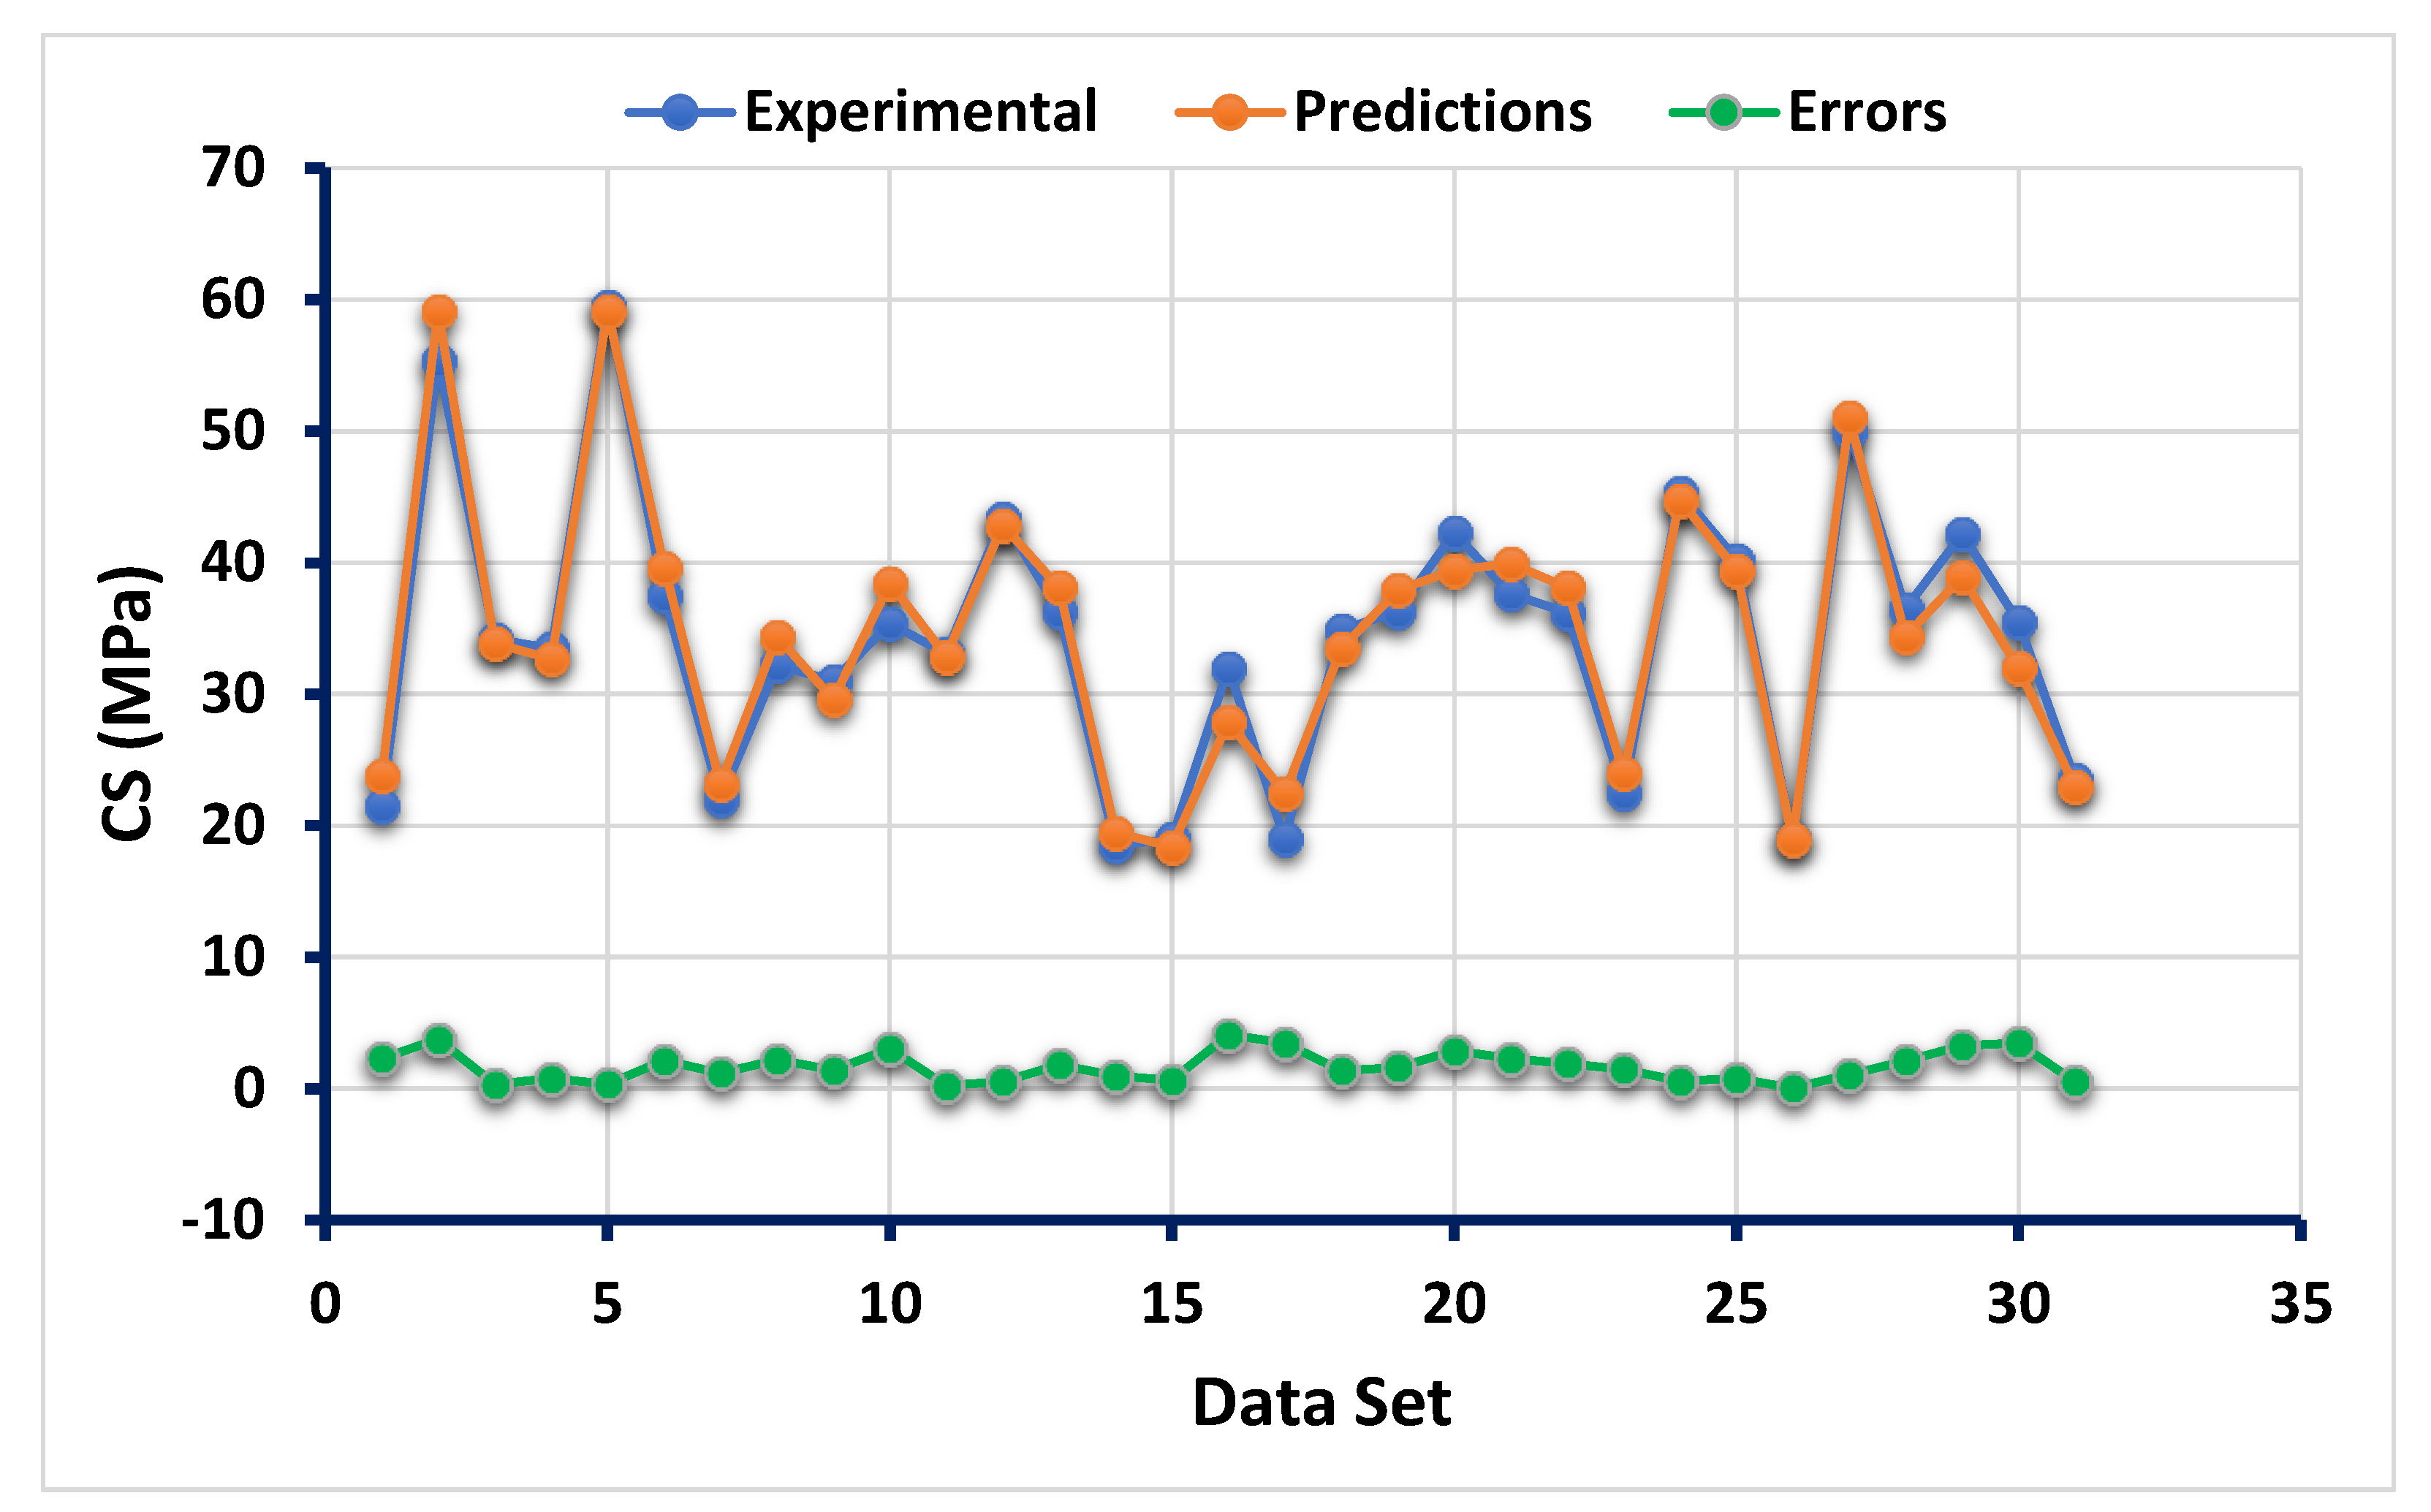
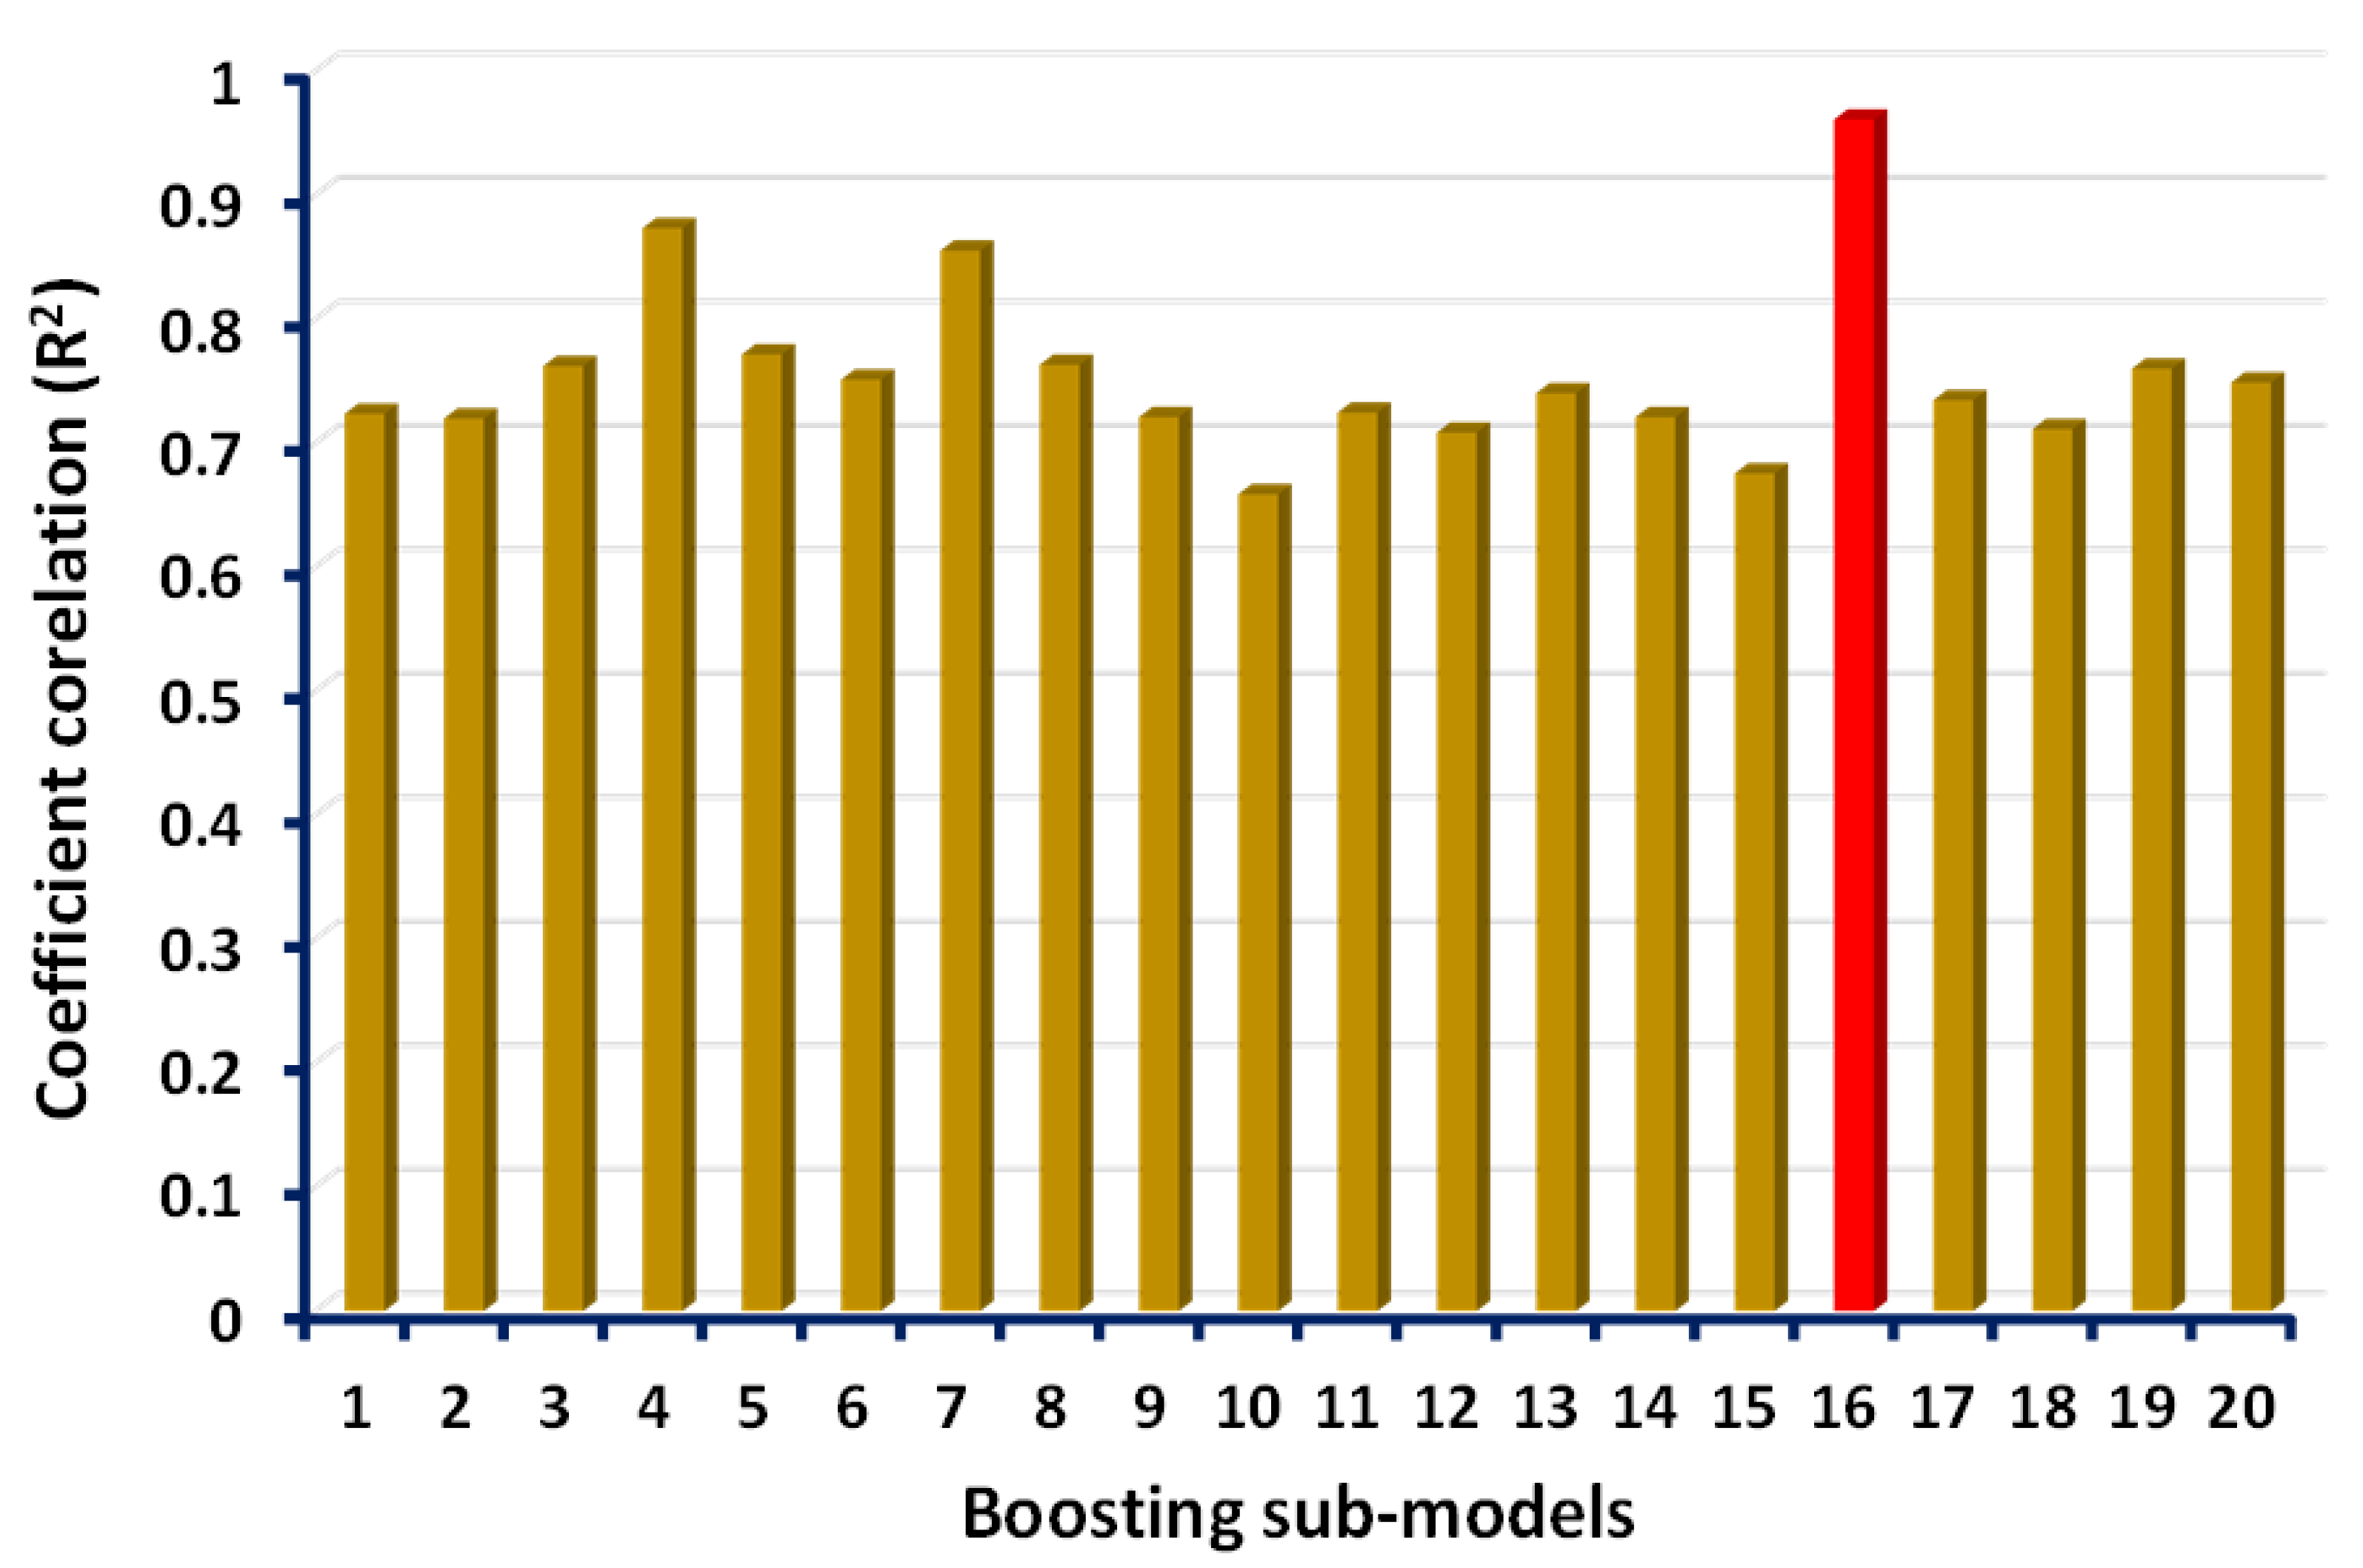
4.2. Statistical Results from Boosting Approach
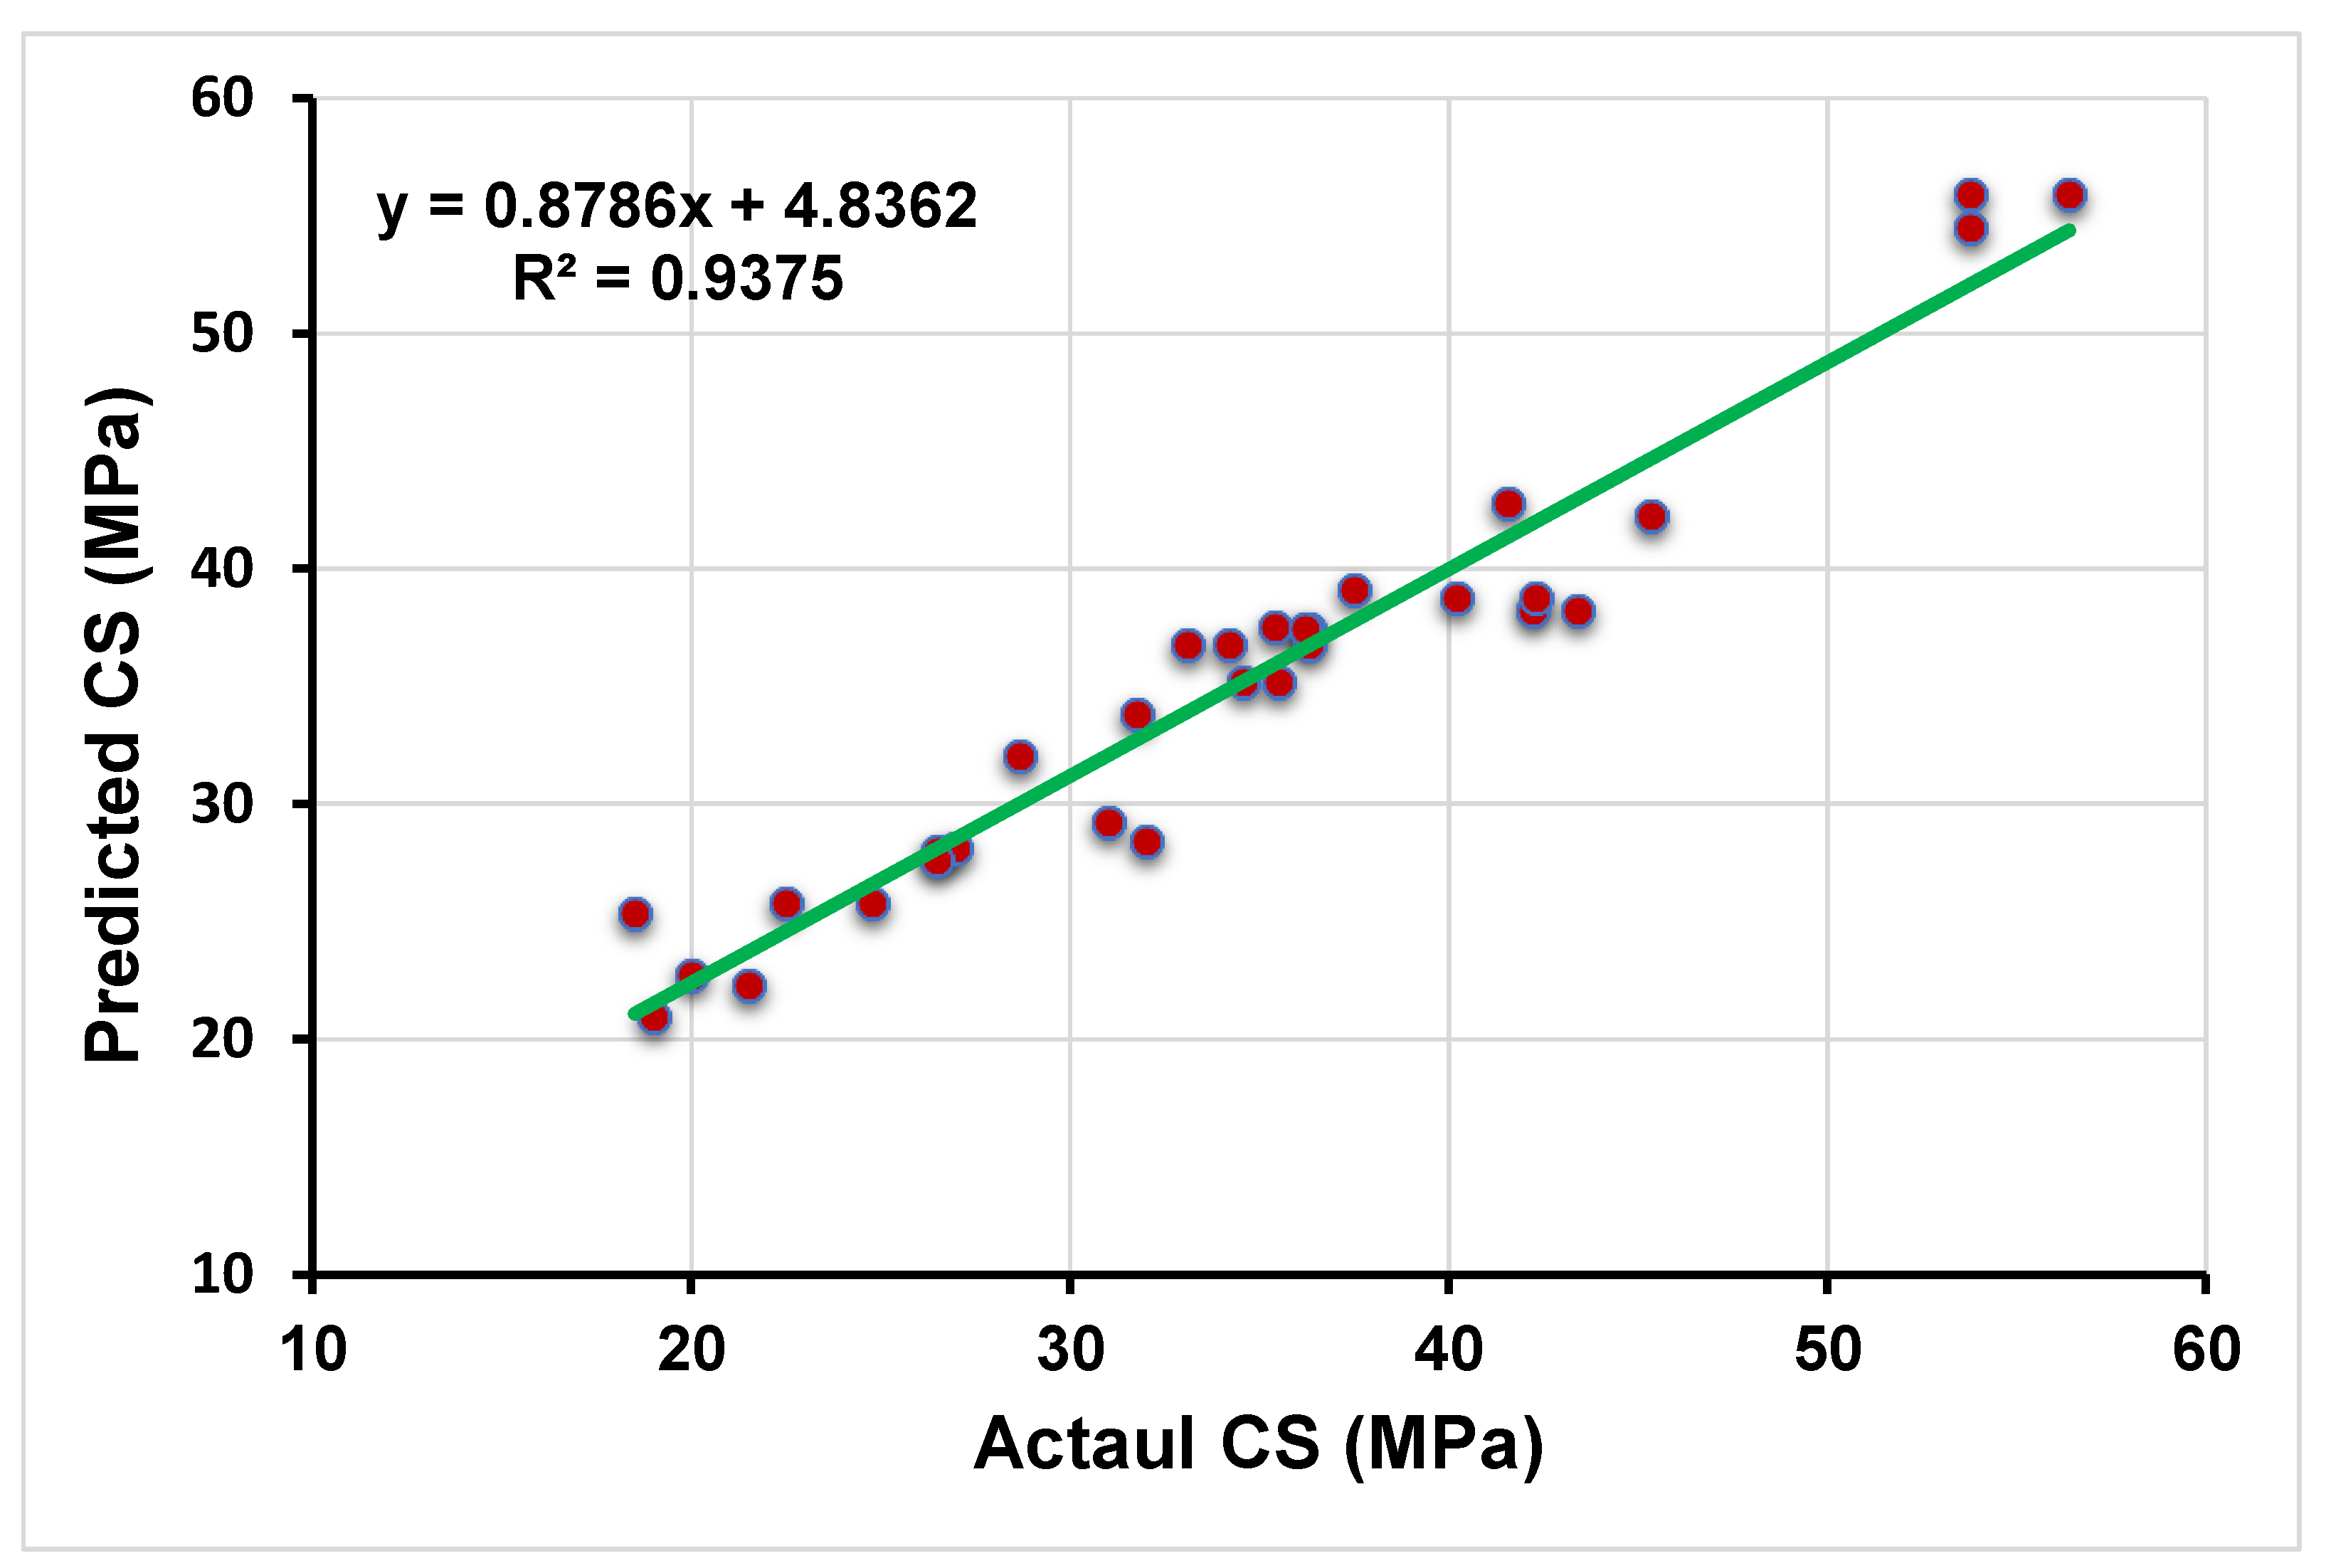
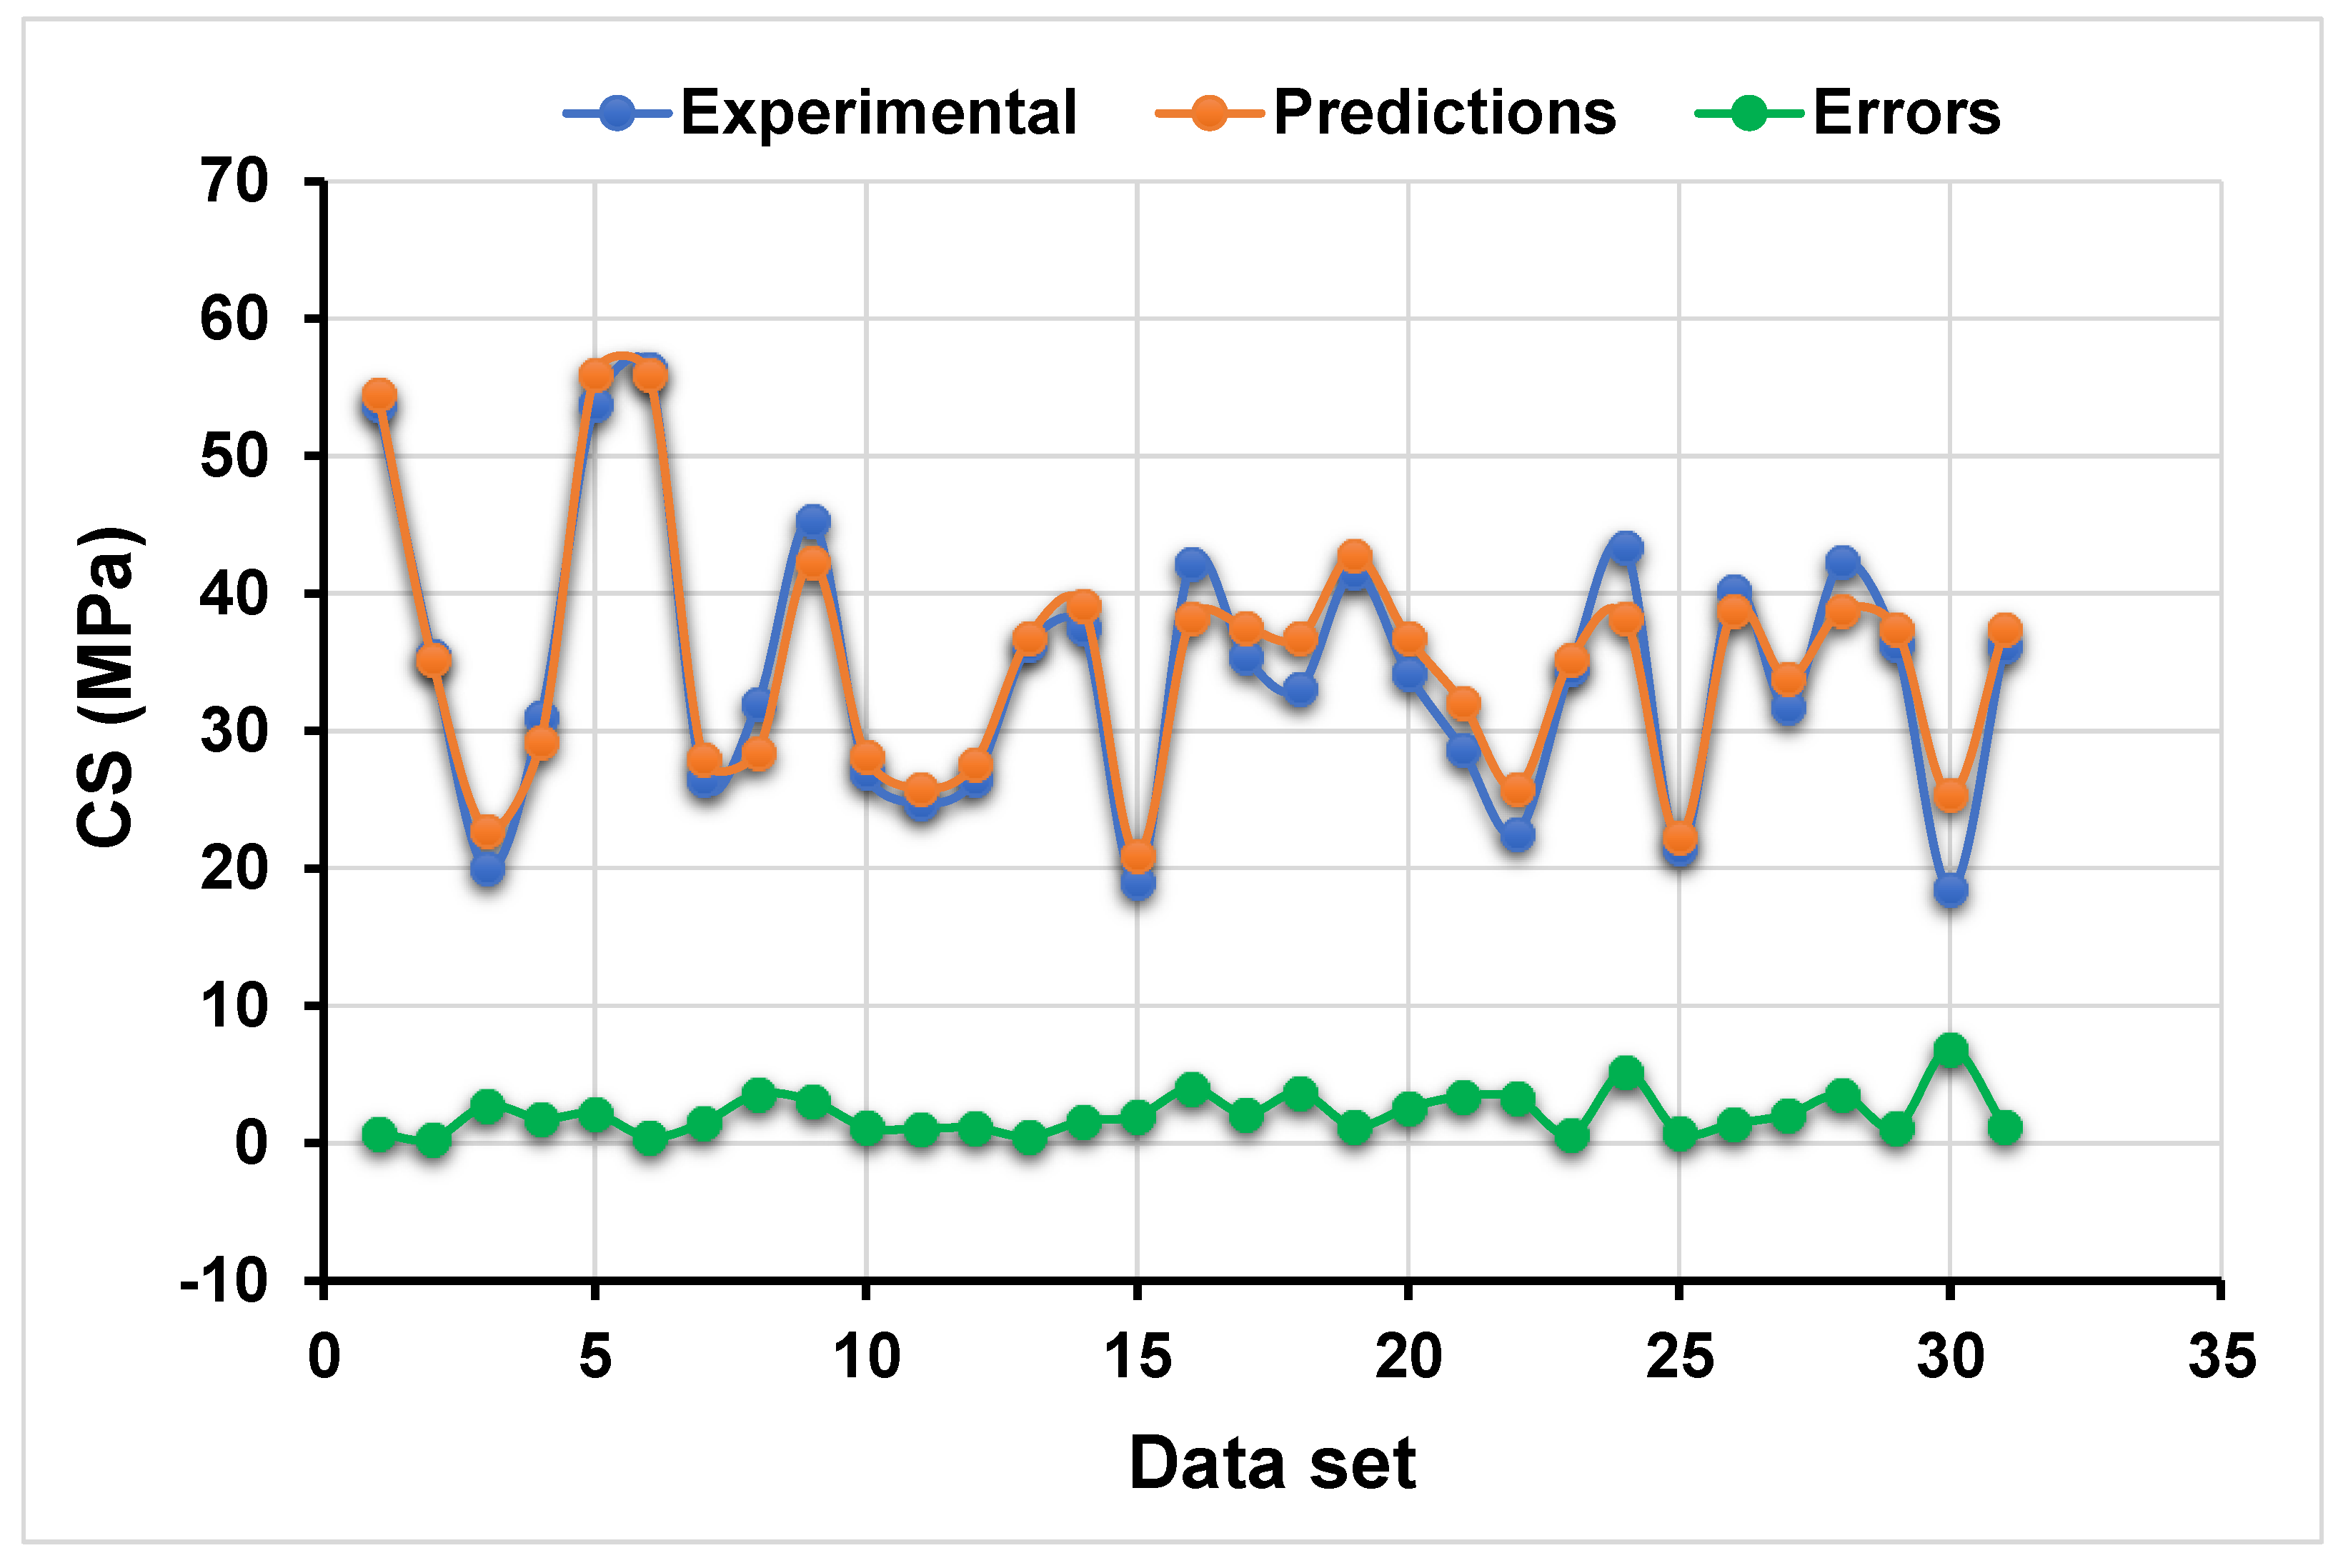
4.3. Statistical Result for Adaboost Approach
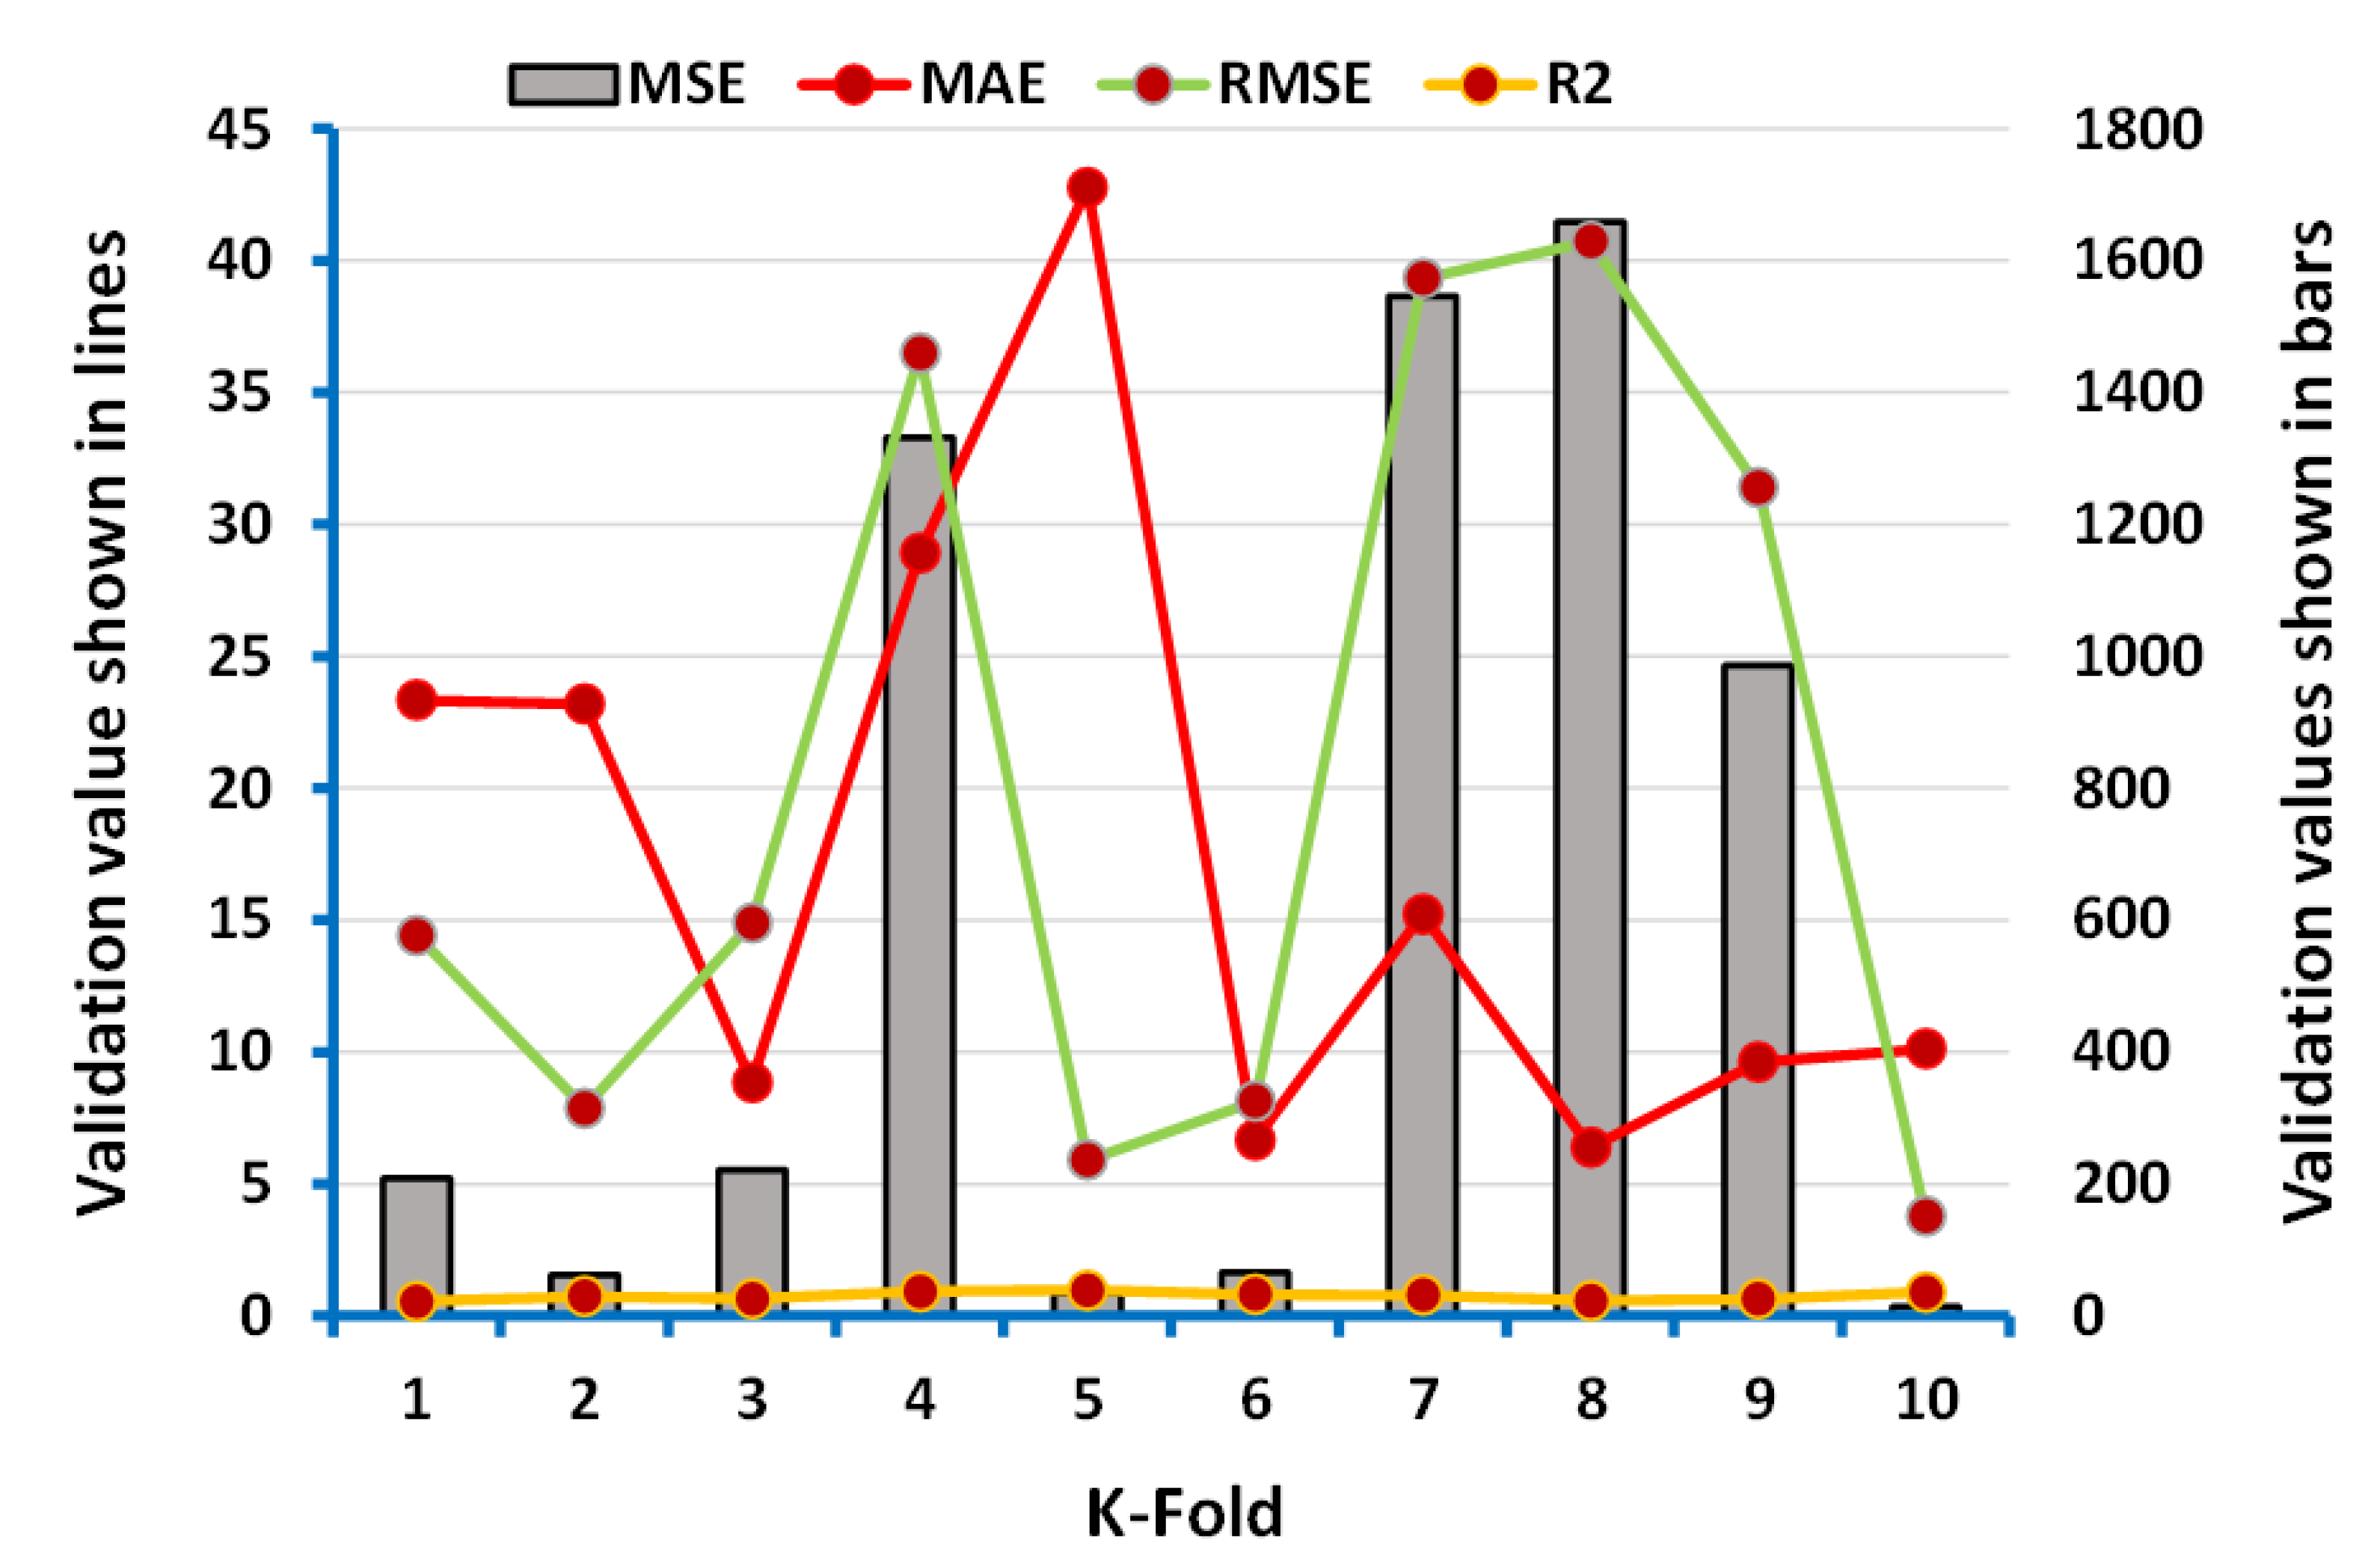
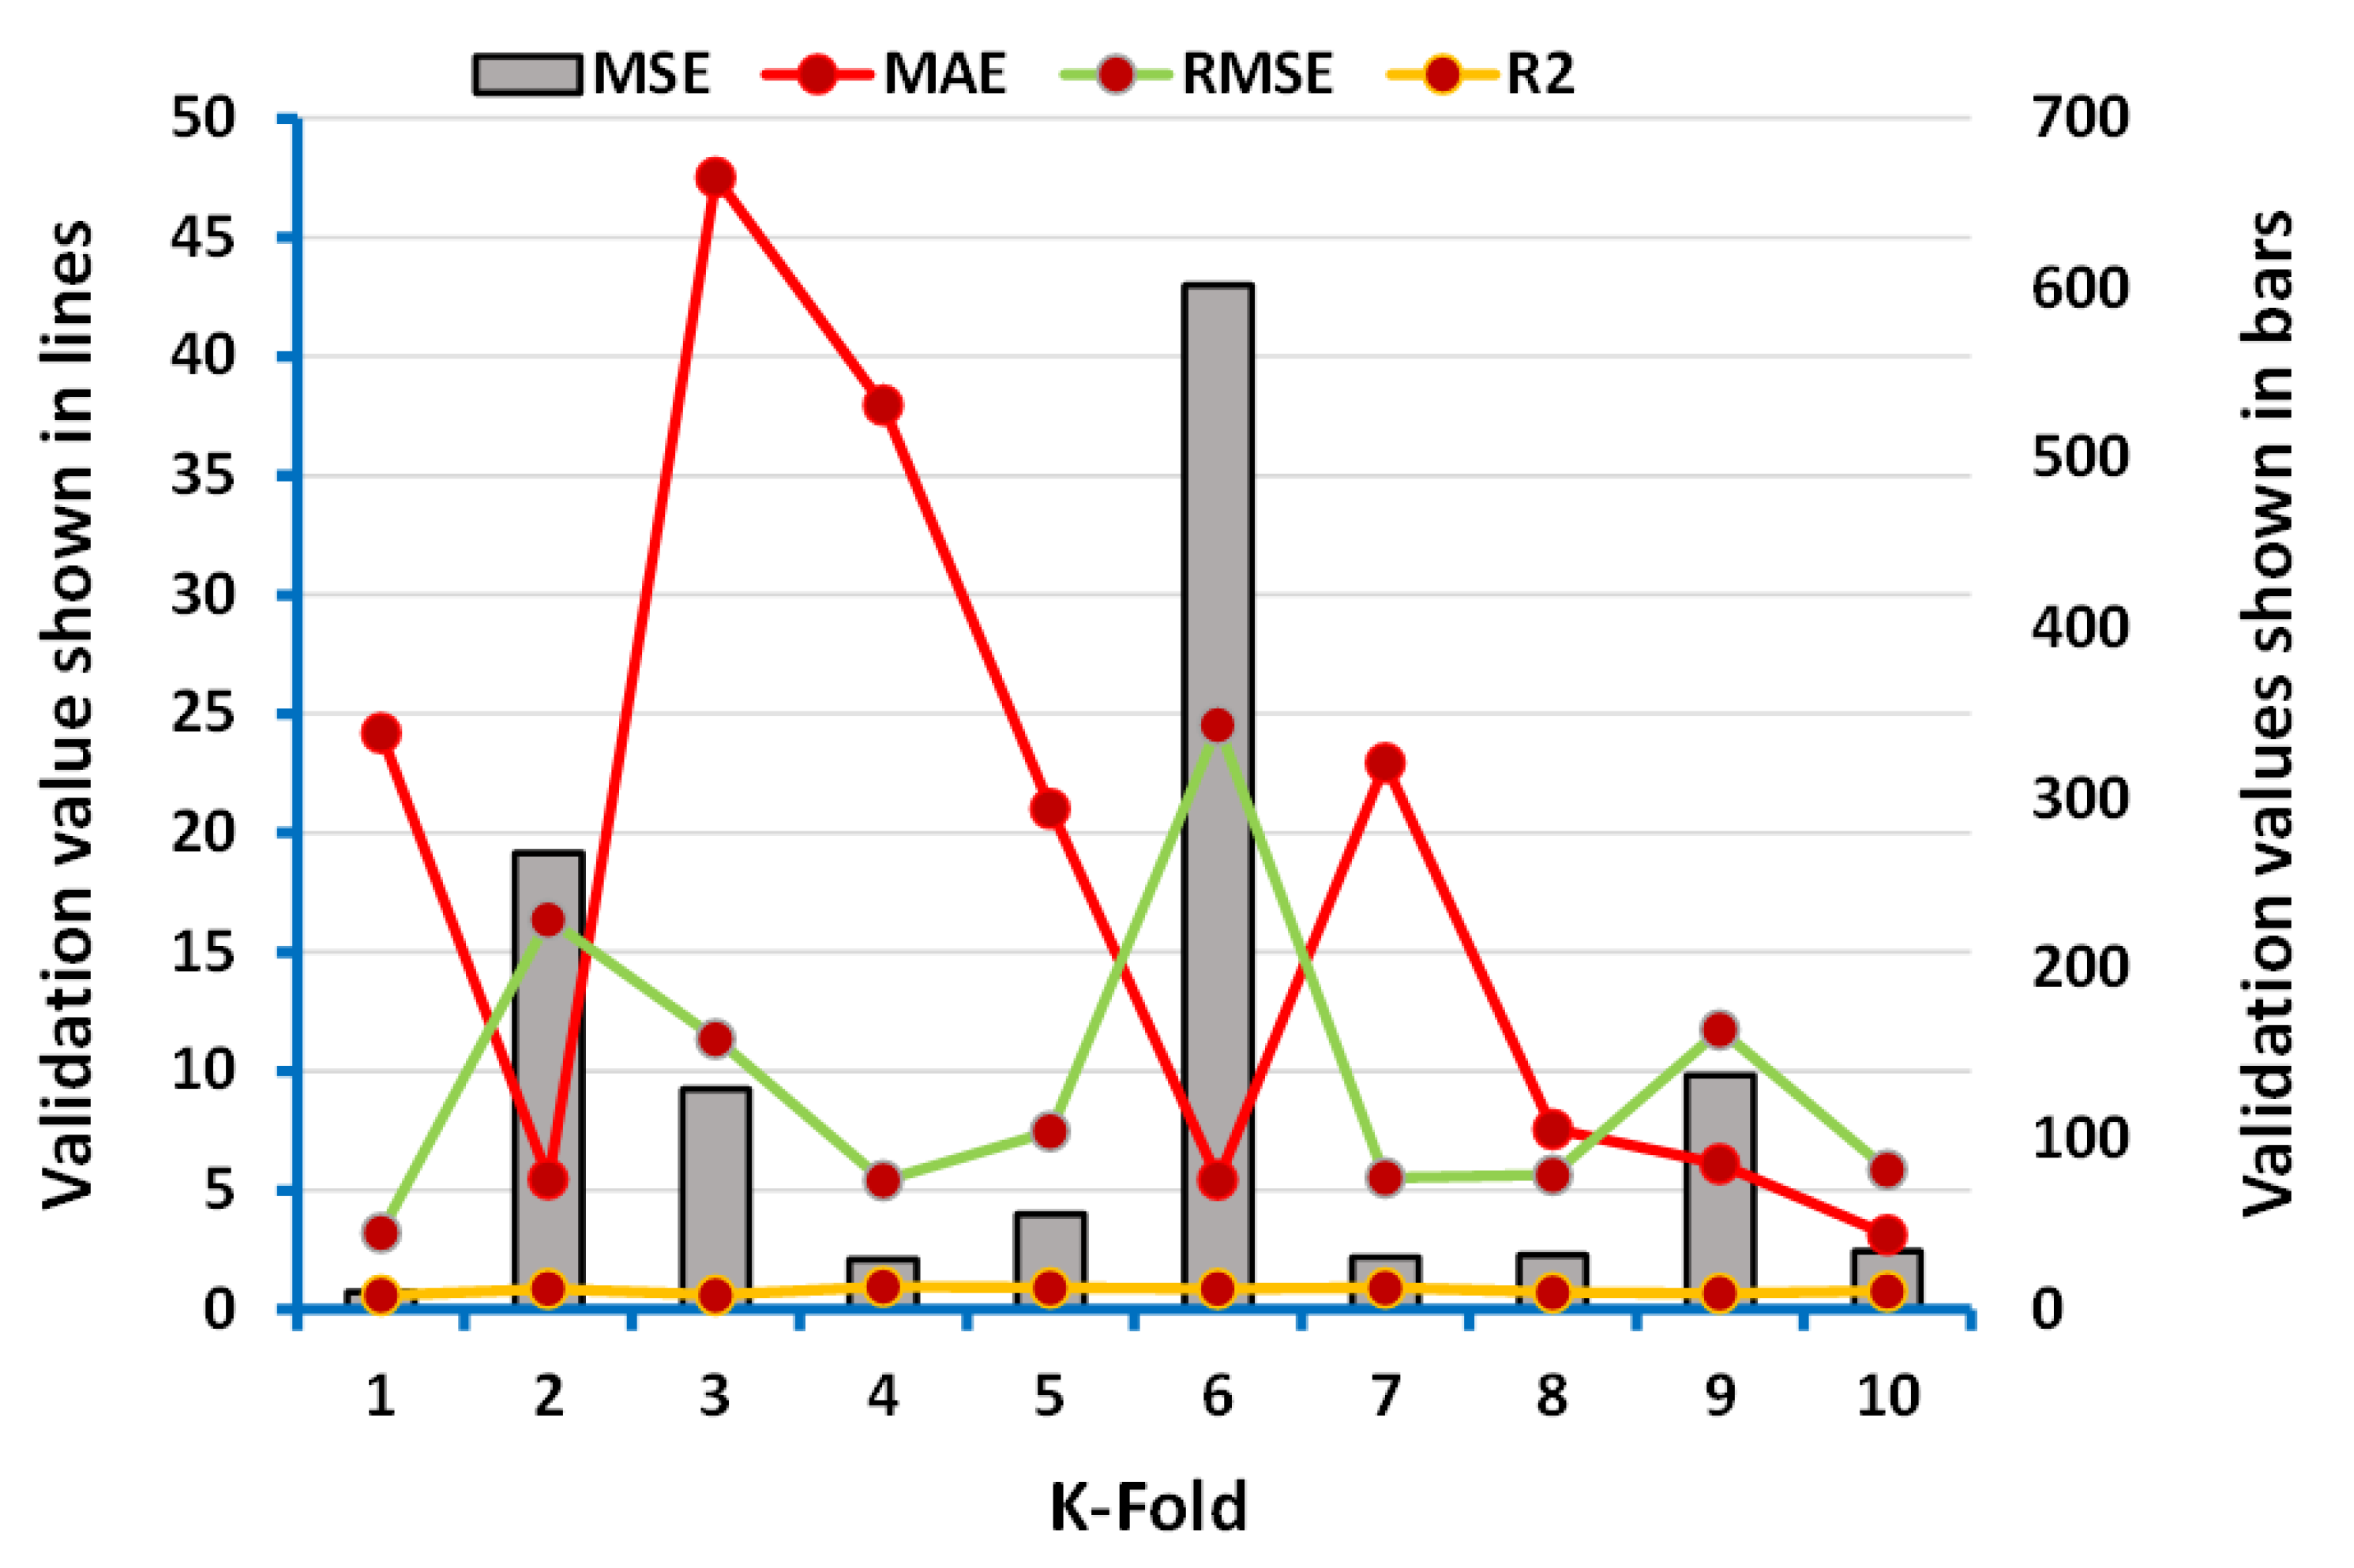
4.4. K-Fold Cross-Validation Process
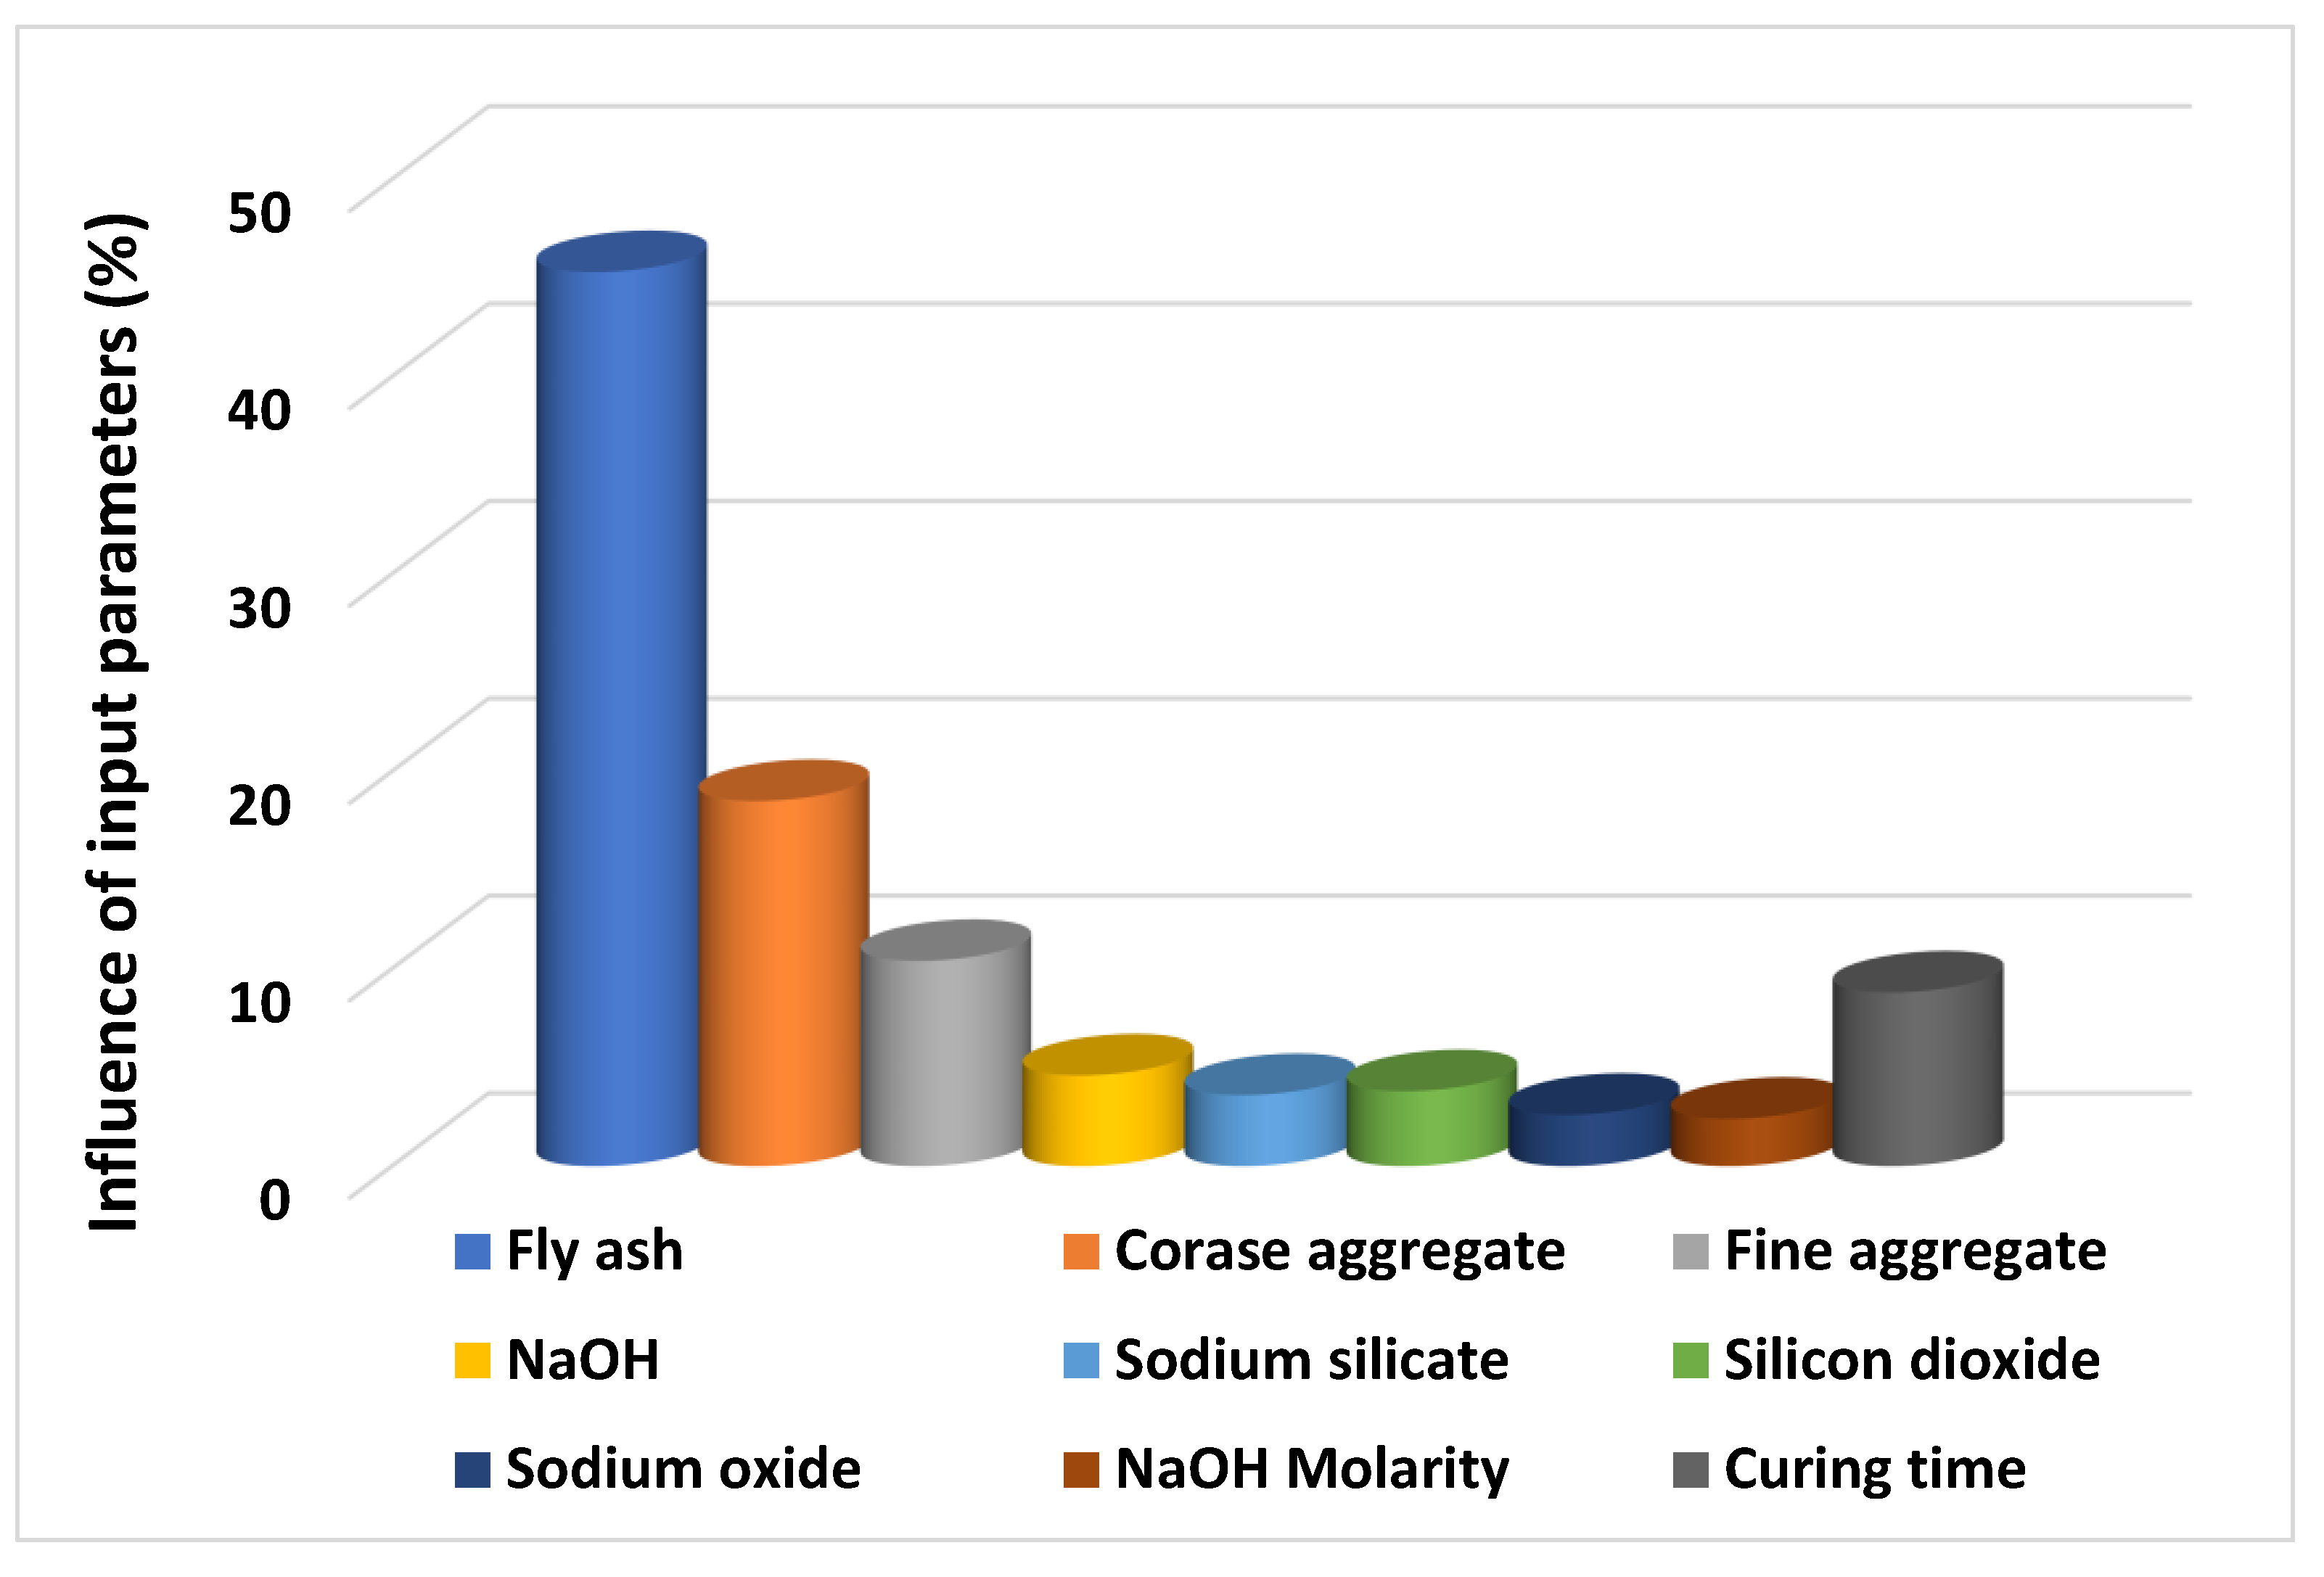
5. Sensitivity Analyses
6. Discussion
7. Conclusions
- The ML algorithms (both ensemble and individual) can be successfully utilized to predict the mechanical properties of any type of geopolymer concrete.
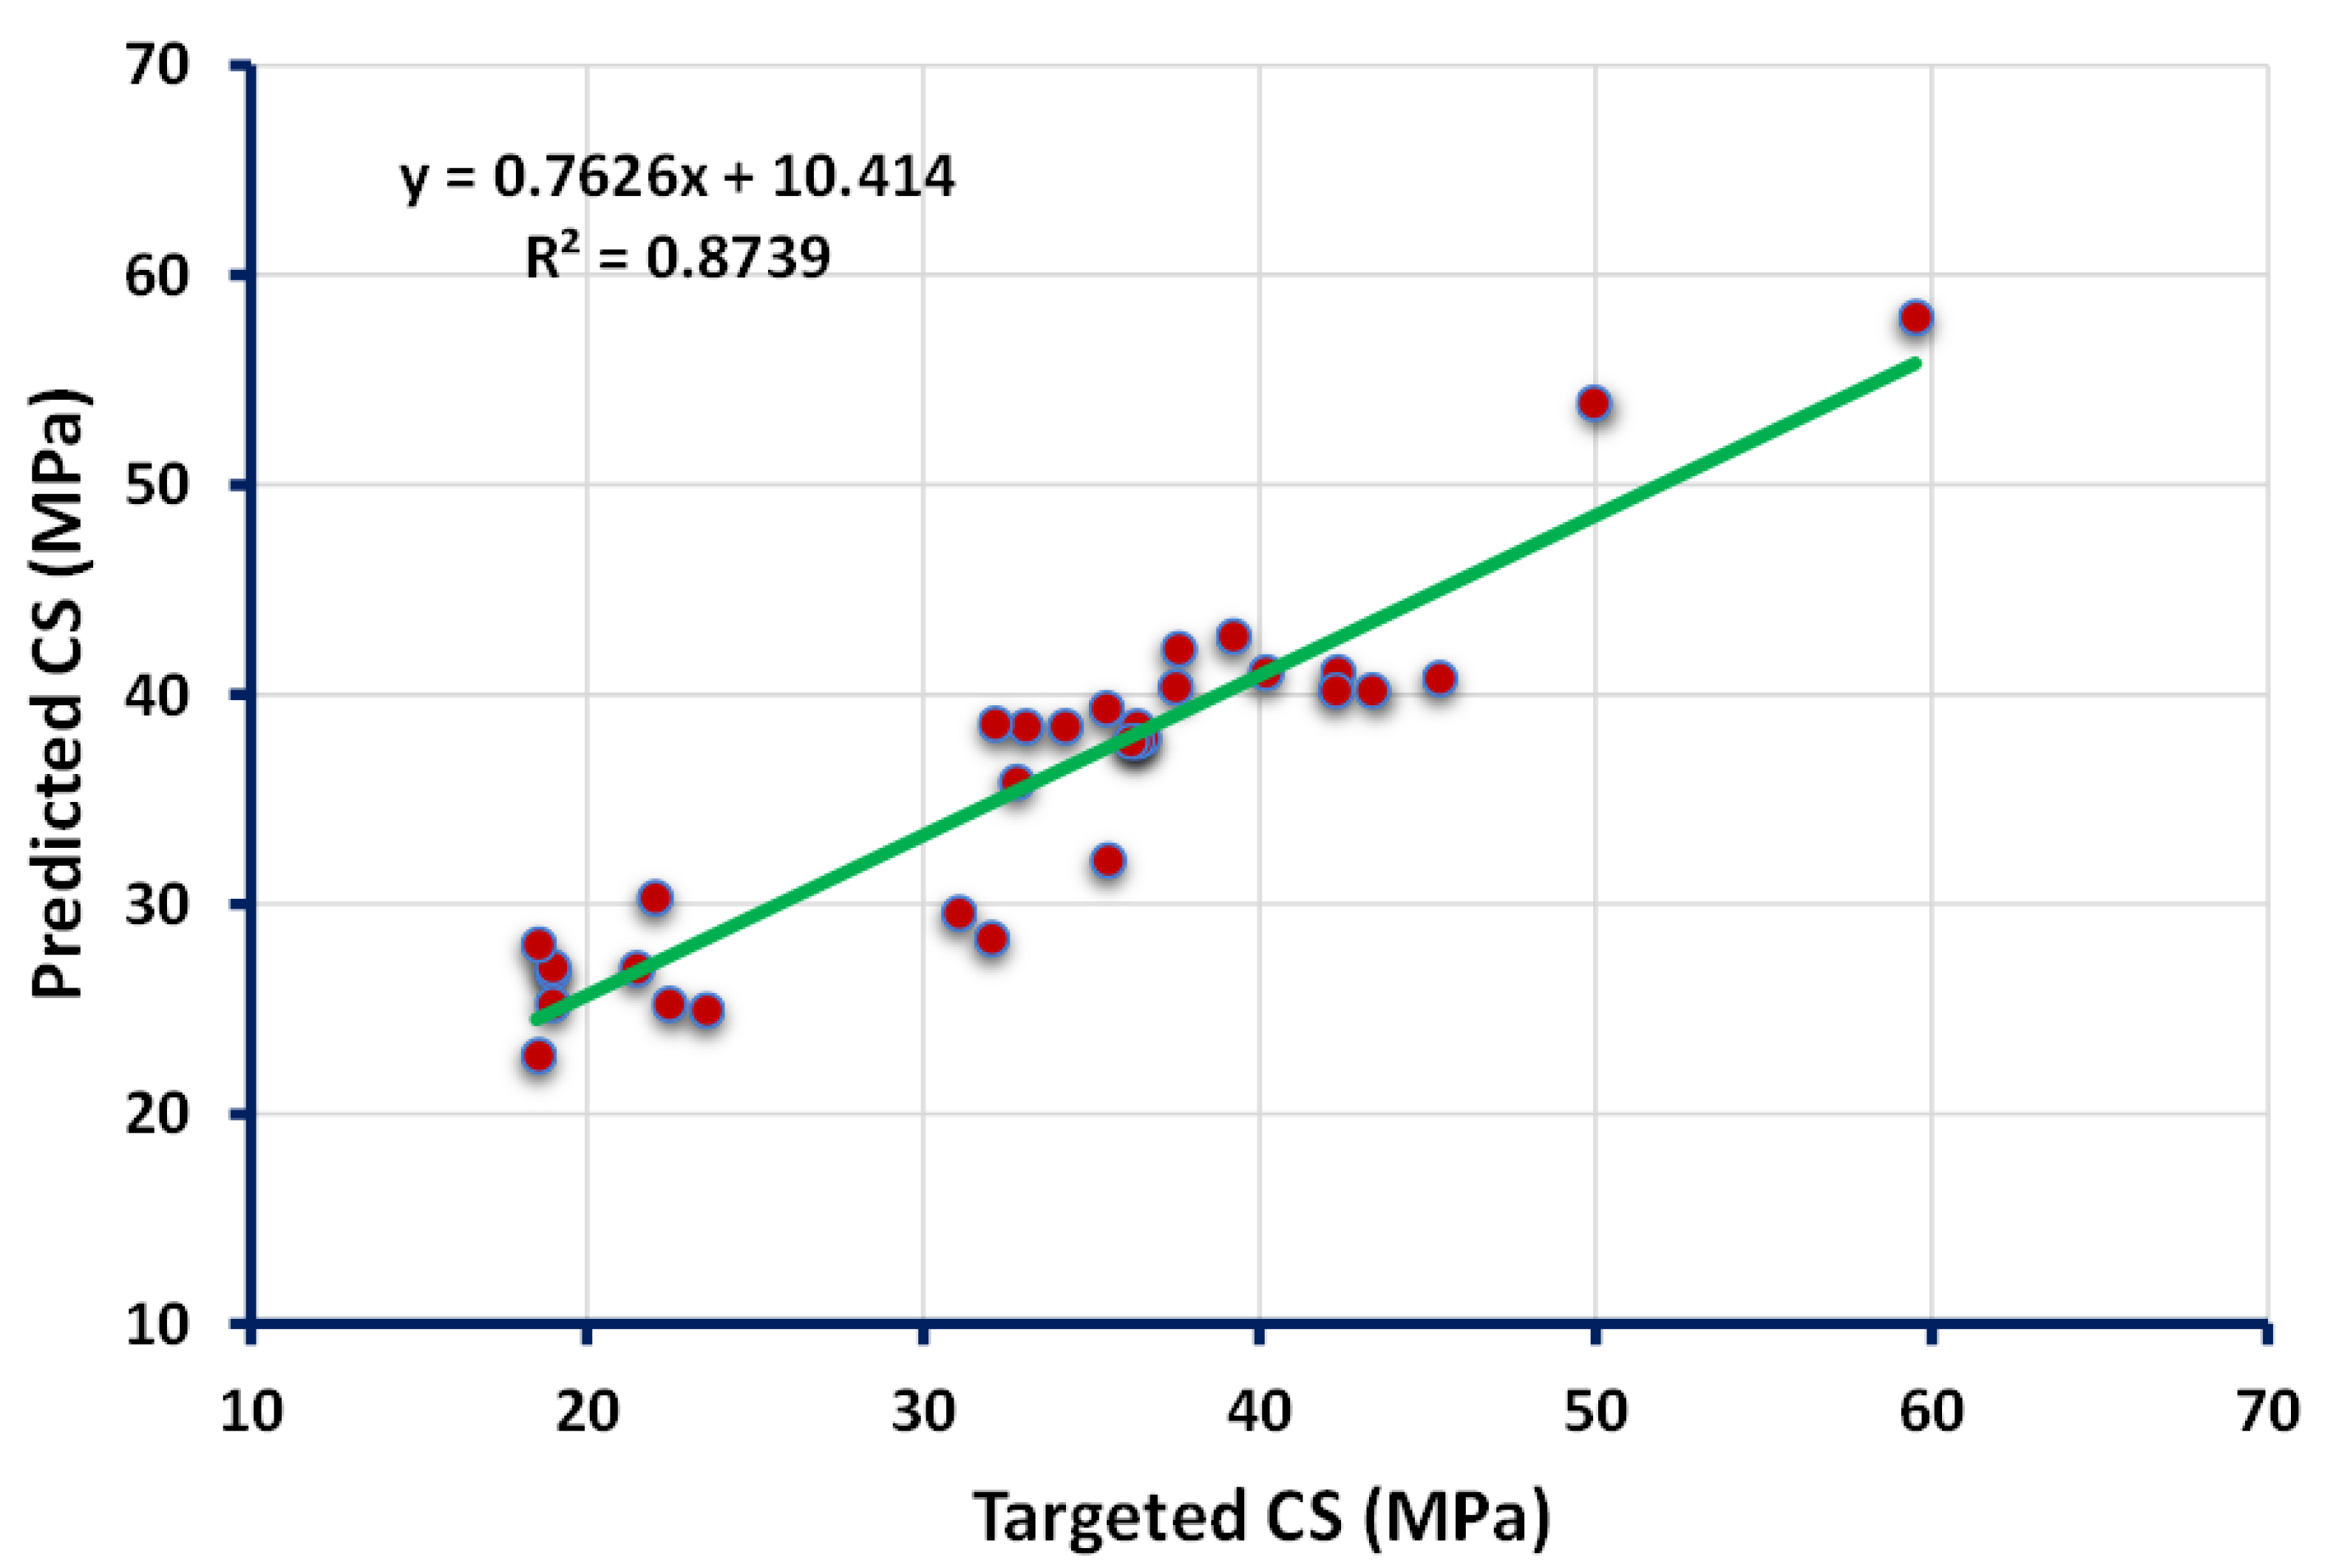
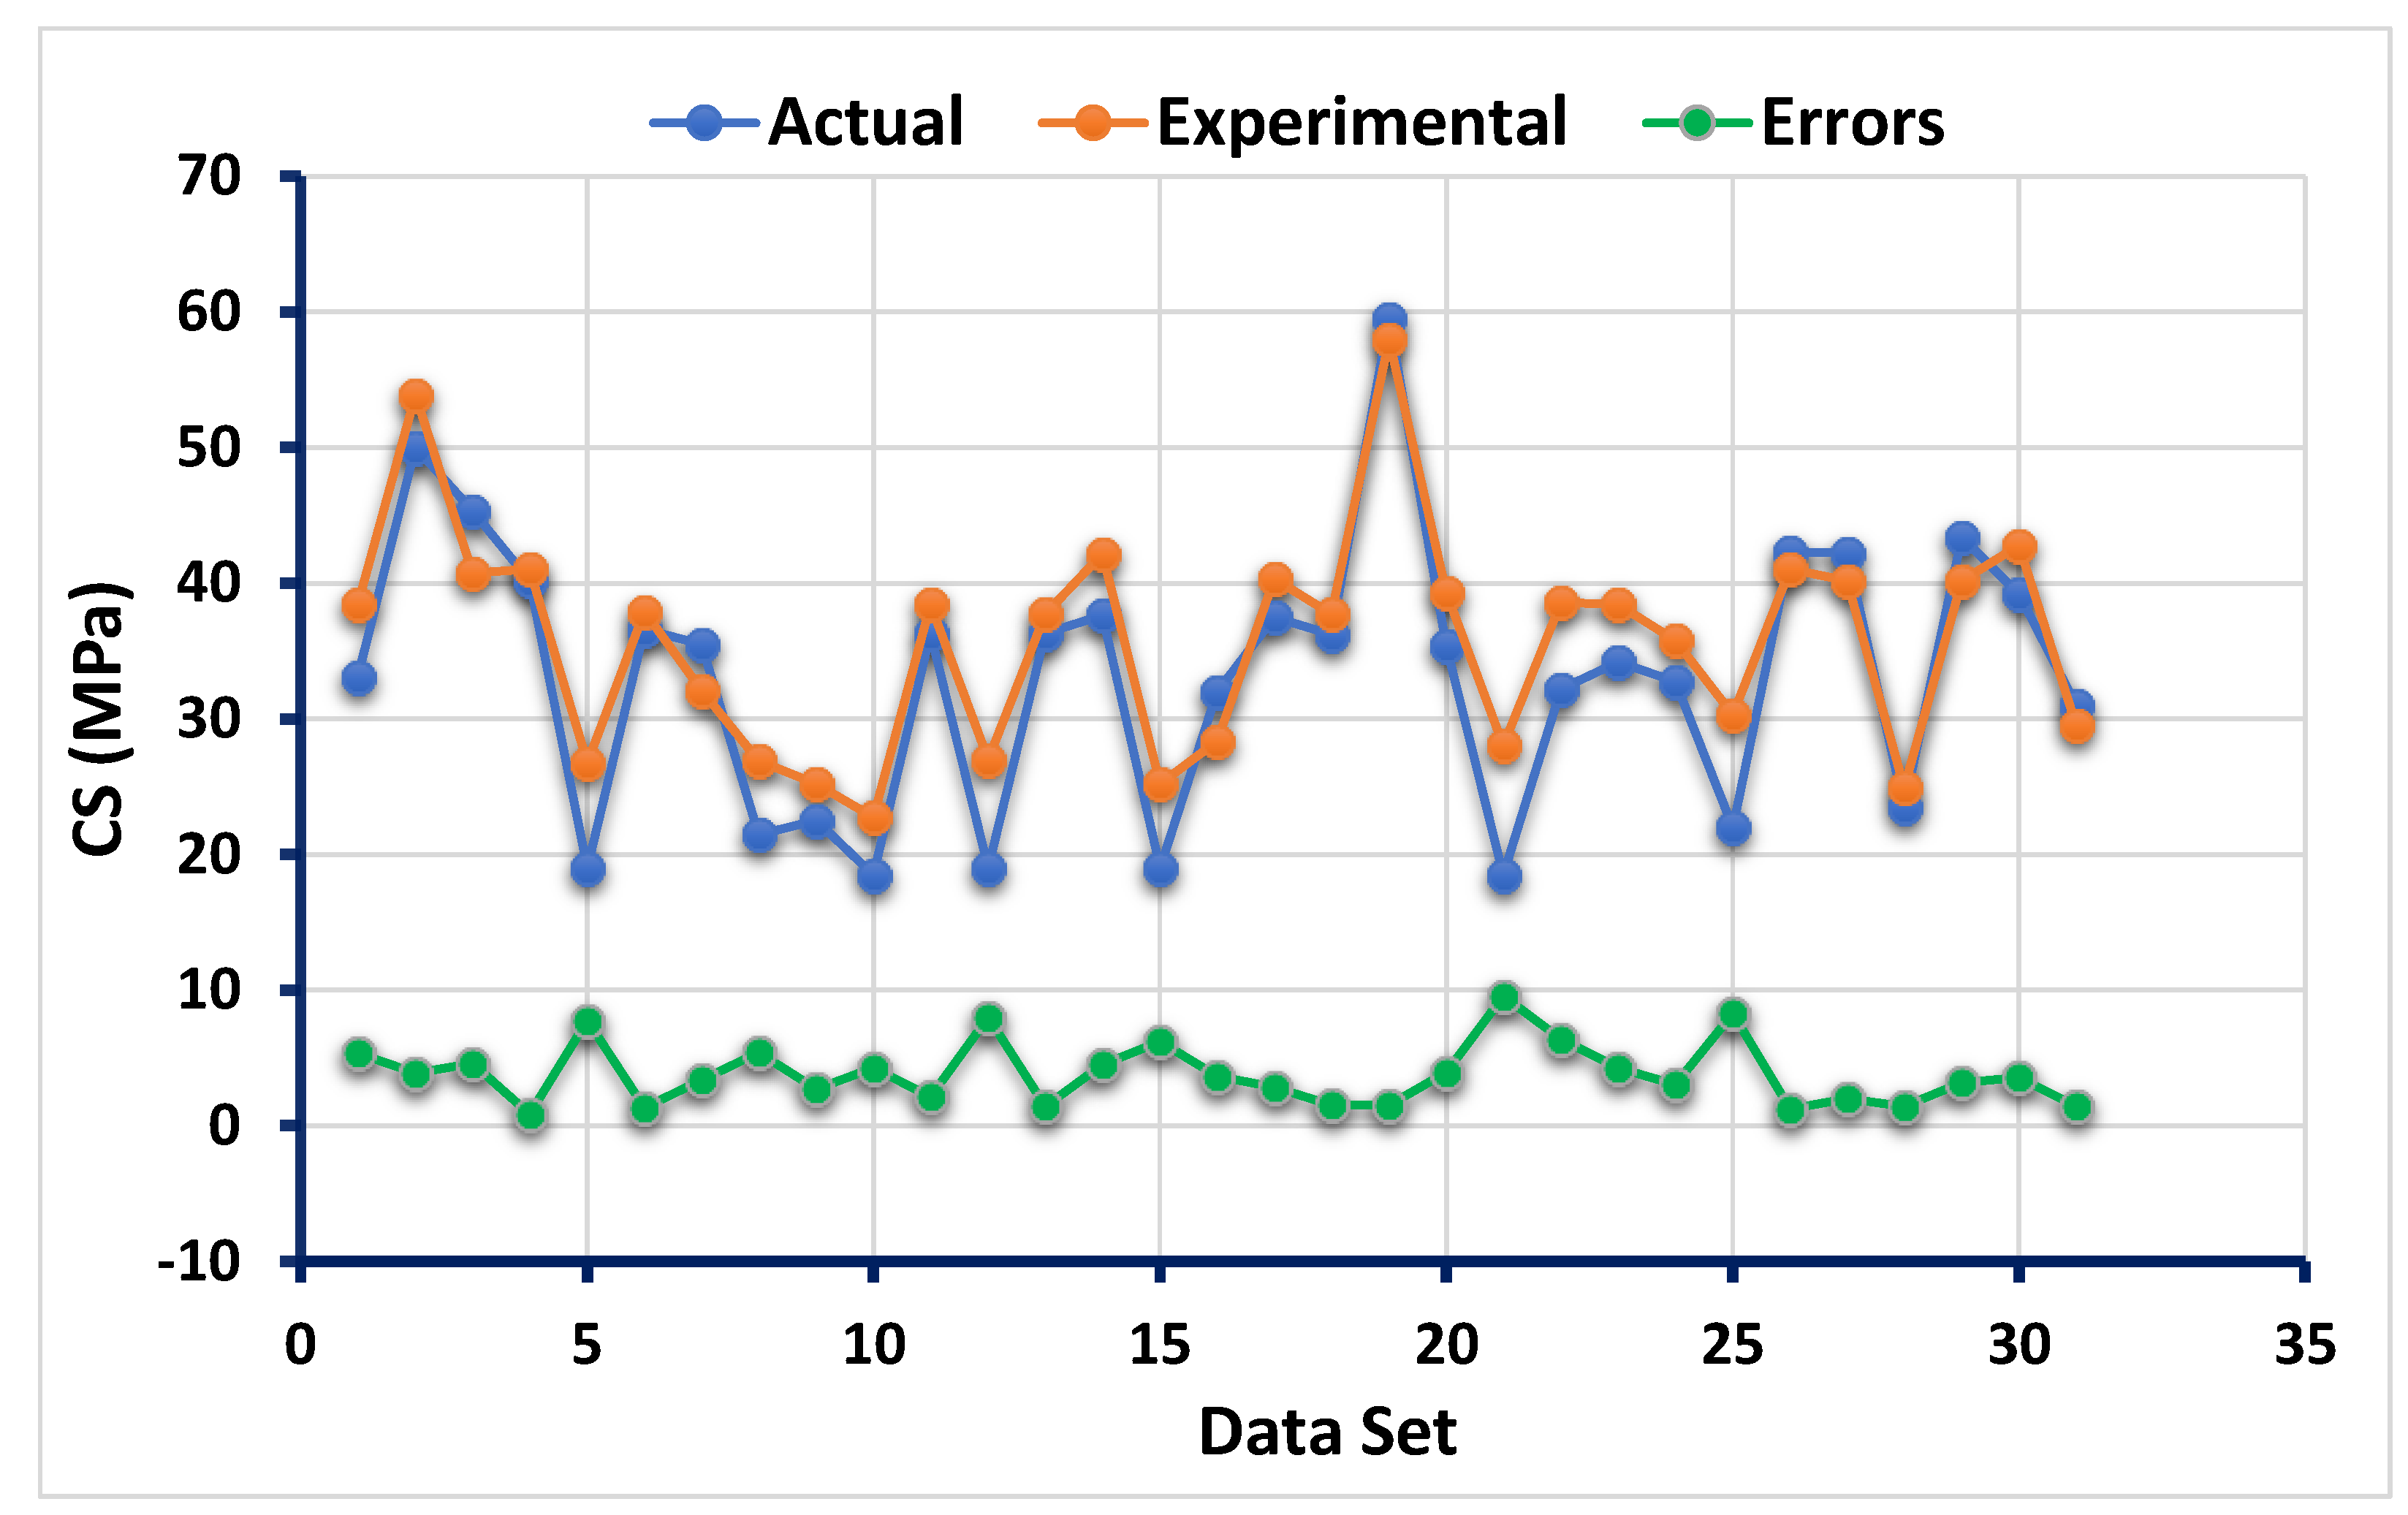
- The ensemble ML techniques boosting and AdaBoost were very effective when treated for forecasting the CS of GPC by indicating the high value of R2 equals 0.96 and 0.93, respectively. However, the individual ML approach (ANN) gives the R2 value equal to 0.87, indicating the poor accuracy level towards the prediction of CS as opposed to boosting algorithm.
- The high precision level of the boosting technique also confirms the lesser values of the errors from the ANN approach. The MAE, MSE, and RMSE values for boosting were 1.69 MPa, 4.16 MPa, and 2.04 MPa, respectively, while these values for the ANN model were 3.86 MPa, 20.16 MPa, and 4.49 MPa, respectively, and similar values were reported for AdaBoost model as 2.16 MPa, 6.84 MPa, and 2.62 MPa, respectively.
- Statistical analyses and method of k-fold cross validation also confirm that the performance of boosting ML technique was effective to forecast the CS as compared to the ANN model.
- Sensitivity analysis reveals that the fly ash was the superior parameter which contributed magnificently at 45.3% towards the prediction of CS for GPC.
- Overall, the combined effect of the obtained result from the coefficient of determination (R2) and result from various errors makes an indication for boosting technique as the best performer when compared to AdaBoost and ANN model.
Author Contributions
Funding
Institutional Review Board Statement
Informed Consent Statement
Data Availability Statement
Acknowledgments
Conflicts of Interest
References
- Meyer, C. The greening of the concrete industry. Cem. Concr. Compos. 2009, 31, 601–605. [Google Scholar] [CrossRef]
- De Brito, J.; Kurda, R. The past and future of sustainable concrete: A critical review and new strategies on cement-based materials. J. Clean. Prod. 2021, 281, 123558. [Google Scholar] [CrossRef]
- John, J.P. Parametric studies of cement production processes. J. Energy 2020, 2020, 1–17. [Google Scholar] [CrossRef]
- Bourtsalas, A.; Zhang, J.; Castaldi, M.; Themelis, N. Use of non-recycled plastics and paper as alternative fuel in cement production. J. Clean. Prod. 2018, 181, 8–16. [Google Scholar] [CrossRef]
- Mehra, S.; Singh, M.; Sharma, G.; Kumar, S.; Chadha, P. Impact of construction material on environment. Ecol. Health Eff. Build. Mater. 2022, 427–442. [Google Scholar] [CrossRef]
- Miller, S.; John, V.M.; Pacca, S.; Horvath, A. Carbon dioxide reduction potential in the global cement industry by 2050. Cem. Concr. Res. 2018, 114, 115–124. [Google Scholar] [CrossRef]
- Benhelal, E.; Shamsaei, E.; Rashid, M.I. Challenges against CO2 abatement strategies in cement industry: A review. J. Environ. Sci. 2021, 104, 84–101. [Google Scholar] [CrossRef]
- Zhang, C.-Y.; Han, R.; Yu, B.; Wei, Y.-M. Accounting process-related CO2 emissions from global cement production under shared socioeconomic pathways. J. Clean. Prod. 2018, 184, 451–465. [Google Scholar] [CrossRef]
- Khan, M.; Ali, M. Use of glass and nylon fibers in concrete for controlling early age micro cracking in bridge decks. Constr. Build. Mater. 2016, 125, 800–808. [Google Scholar] [CrossRef]
- Khan, M.; Ali, M. Improvement in concrete behavior with fly ash, silica-fume and coconut fibres. Constr. Build. Mater. 2019, 203, 174–187. [Google Scholar] [CrossRef]
- Ahmad, W.; Farooq, S.H.; Usman, M.; Khan, M.; Ahmad, A.; Aslam, F.; Al Yousef, R.; Al Abduljabbar, H.; Sufian, M. Effect of coconut fiber length and content on properties of high strength concrete. Materials 2020, 13, 1075. [Google Scholar] [CrossRef] [Green Version]
- Iyer, V.G. Industrial landfill sources of air, water and land pollution in India. World J. Environ. Res. 2013, 1, 57–60. Available online: http://archives.un-pub.eu/index.php/wjer/article/view/1061 (accessed on 2 September 2021).
- Khan, M.; Ali, M. Effectiveness of hair and wave polypropylene fibers for concrete roads. Constr. Build. Mater. 2018, 166, 581–591. [Google Scholar] [CrossRef]
- Khan, M.; Cao, M. Effect of hybrid basalt fibre length and content on properties of cementitious composites. Mag. Concr. Res. 2021, 73, 487–498. [Google Scholar] [CrossRef]
- Bajpai, R.; Choudhary, K.; Srivastava, A.; Sangwan, K.S.; Singh, M. Environmental impact assessment of fly ash and silica fume based geopolymer concrete. J. Clean. Prod. 2020, 254, 120147. [Google Scholar] [CrossRef]
- Zhang, P.; Gao, Z.; Wang, J.; Guo, J.; Hu, S.; Ling, Y. Properties of fresh and hardened fly ash/slag based geopolymer concrete: A review. J. Clean. Prod. 2020, 270, 122389. [Google Scholar] [CrossRef]
- Shahmansouri, A.A.; Yazdani, M.; Ghanbari, S.; Bengar, H.A.; Jafari, A.; Ghatte, H.F. Artificial neural network model to predict the compressive strength of eco-friendly geopolymer concrete incorporating silica fume and natural zeolite. J. Clean. Prod. 2021, 279, 123697. [Google Scholar] [CrossRef]
- Das, S.K.; Mustakim, S.M.; Adesina, A.; Mishra, J.; Alomayri, T.S.; Assaedi, H.S.; Kaze, C.R. Fresh, strength and microstructure properties of geopolymer concrete incorporating lime and silica fume as replacement of fly ash. J. Build. Eng. 2020, 32, 101780. [Google Scholar] [CrossRef]
- Singh, B.; Ishwarya, G.; Gupta, M.; Bhattacharyya, S. Geopolymer concrete: A review of some recent developments. Constr. Build. Mater. 2015, 85, 78–90. [Google Scholar] [CrossRef]
- Xie, T.; Yang, G.; Zhao, X.; Xu, J.; Fang, C. A unified model for predicting the compressive strength of recycled aggregate concrete containing supplementary cementitious materials. J. Clean. Prod. 2020, 251, 119752. [Google Scholar] [CrossRef]
- Muthukrishnan, S.; Kua, H.W.; Na Yu, L.; Chung, J.K.H. Fresh Properties of Cementitious materials containing rice husk ash for construction 3D printing. J. Mater. Civ. Eng. 2020, 32, 04020195. [Google Scholar] [CrossRef]
- Rao, K.; Ch, N.S.K. Achieving Sustainability by the utilization of fly ash as a secondary cementitious material. J. Eng. Des. 2021, 2021, 113–124. Available online: http://www.thedesignengineering.com/index.php/DE/article/view/2262 (accessed on 2 September 2021).
- Batayneh, M.; Marie, I.; Asi, I. Use of selected waste materials in concrete mixes. Waste Manag. 2007, 27, 1870–1876. [Google Scholar] [CrossRef]
- Wałach, D.; Cała, M.; Ostrowski, K.; Jaskowska-Lemańska, J. Analiza wpływu separowanych popiołów dennych na mrozoodporność betonu. Bud. Zoptymalizowanym Potencjale Energetycznym 2017, 19, 47–54. [Google Scholar] [CrossRef]
- Juraszka, B.T. Piecuch, Incineration of post-coagulation sediments containing organic glues and utilization of secondary waste–ash. Energy Policy J. 2007, 10, 85–101. [Google Scholar]
- Pietrzak, A. The concept of “glass houses” in energy-efficient civil enginineering. Constr. Optim. Energy Potential 2014, 1, 86–93. [Google Scholar]
- Seghir, N.T.; Mellas, M.; Sadowski, Ł.; Krolicka, A.; Żak, A.; Ostrowski, K. The utilization of waste marble dust as a cement replacement in air-cured mortar. Sustainability 2019, 11, 2215. [Google Scholar] [CrossRef] [Green Version]
- Sufian, M.; Ullah, S.; Ostrowski, K.; Ahmad, A.; Zia, A.; Śliwa-Wieczorek, K.; Siddiq, M.; Awan, A. An experimental and empirical study on the use of waste marble powder in construction material. Materials 2021, 14, 3829. [Google Scholar] [CrossRef]
- Dybeł, P.; Wałach, D.; Ostrowski, K. The Top-bar effect in specimens with a single casting point at one edge in high-performance self-compacting concrete. J. Adv. Concr. Technol. 2018, 16, 282–292. [Google Scholar] [CrossRef] [Green Version]
- Cao, M.; Mao, Y.; Khan, M.; Si, W.; Shen, S. Different testing methods for assessing the synthetic fiber distribution in cement-based composites. Constr. Build. Mater. 2018, 184, 128–142. [Google Scholar] [CrossRef]
- Khan, M.; Ali, M. Effect of super plasticizer on the properties of medium strength concrete prepared with coconut fiber. Constr. Build. Mater. 2018, 182, 703–715. [Google Scholar] [CrossRef]
- Khan, M.; Cao, M.; Ali, M. Effect of basalt fibers on mechanical properties of calcium carbonate whisker-steel fiber reinforced concrete. Constr. Build. Mater. 2018, 192, 742–753. [Google Scholar] [CrossRef]
- Ganesh, A.C.; Muthukannan, M. Development of high performance sustainable optimized fiber reinforced geopolymer concrete and prediction of compressive strength. J. Clean. Prod. 2021, 282, 124543. [Google Scholar] [CrossRef]
- Aneja, S.; Sharma, A.; Gupta, R.; Yoo, D.-Y. Bayesian Regularized artificial neural network model to predict strength characteristics of fly-ash and bottom-ash based geopolymer concrete. Materials 2021, 14, 1729. [Google Scholar] [CrossRef] [PubMed]
- Khan, M.A.; Zafar, A.; Akbar, A.; Javed, M.; Mosavi, A. Application of Gene expression programming (GEP) for the prediction of compressive strength of geopolymer concrete. Materials 2021, 14, 1106. [Google Scholar] [CrossRef] [PubMed]
- Ma, C.-K.; Awang, A.Z.; Omar, W. Structural and material performance of geopolymer concrete: A review. Constr. Build. Mater. 2018, 186, 90–102. [Google Scholar] [CrossRef]
- Chenarlogh, V.A.; Razzazi, F.; Mohammadyahya, N. A multi-view human action recognition system in limited data case using multi-stream CNN. In Proceedings of the 2019 5th Iranian Conference on Signal Processing and Intelligent Systems (ICSPIS), Shahrood, Iran, 18–19 December 2019; Institute of Electrical and Electronics Engineers (IEEE): New York, NY, USA, 2019; pp. 1–11. [Google Scholar]
- Roshani, M.; Phan, G.; Faraj, R.H.; Phan, N.-H.; Roshani, G.H.; Nazemi, B.; Corniani, E.; Nazemi, E. Proposing a gamma radiation based intelligent system for simultaneous analyzing and detecting type and amount of petroleum by-products. Nucl. Eng. Technol. 2021, 53, 1277–1283. [Google Scholar] [CrossRef]
- Pourghebleh, B.; Anvigh, A.A.; Ramtin, A.R.; Mohammadi, B. The importance of nature-inspired meta-heuristic algorithms for solving virtual machine consolidation problem in cloud environments. Clust. Comput. 2021, 24, 1–24. [Google Scholar] [CrossRef]
- Karbassi, A.; Mohebi, B.; Rezaee, S.; Lestuzzi, P. Damage prediction for regular reinforced concrete buildings using the decision tree algorithm. Comput. Struct. 2014, 130, 46–56. [Google Scholar] [CrossRef]
- Ahmad, A.; Chaiyasarn, K.; Farooq, F.; Ahmad, W.; Suparp, S.; Aslam, F. Compressive strength prediction via gene expression programming (GEP) and artificial neural network (ANN) for concrete containing RCA. Buildings 2021, 11, 324. [Google Scholar] [CrossRef]
- Song, H.; Ahmad, A.; Ostrowski, K.A.; Dudek, M. Analyzing the compressive strength of ceramic waste-based concrete using experiment and artificial neural network (ANN) approach. Materials 2021, 14, 4518. [Google Scholar] [CrossRef]
- Khan, M.A.; Memon, S.A.; Farooq, F.; Javed, M.F.; Aslam, F.; Alyousef, R. Compressive strength of fly-ash-based geopolymer concrete by gene expression programming and random forest. Adv. Civ. Eng. 2021, 2021, 1–17. [Google Scholar] [CrossRef]
- Aslam, F.; Farooq, F.; Amin, M.N.; Khan, K.; Waheed, A.; Akbar, A.; Javed, M.F.; Alyousef, R.; Alabdulijabbar, H. Applications of gene expression programming for estimating compressive strength of high-strength concrete. Adv. Civ. Eng. 2020, 2020, 1–23. [Google Scholar] [CrossRef]
- Chu, H.-H.; Khan, M.A.; Javed, M.; Zafar, A.; Alabduljabbar, H.; Qayyum, S. Sustainable use of fly-ash: Use of gene-expression programming (GEP) and multi-expression programming (MEP) for forecasting the compressive strength geopolymer concrete. Ain Shams Eng. J. 2021. [Google Scholar] [CrossRef]
- Iqbal, M.F.; Liu, Q.-F.; Azim, I.; Zhu, X.; Yang, J.; Javed, M.F.; Rauf, M. Prediction of mechanical properties of green concrete incorporating waste foundry sand based on gene expression programming. J. Hazard. Mater. 2020, 384, 121322. [Google Scholar] [CrossRef]
- Golafshani, E.M.; Behnood, A. Predicting the mechanical properties of sustainable concrete containing waste foundry sand using multi-objective ANN approach. Constr. Build. Mater. 2021, 291, 123314. [Google Scholar] [CrossRef]
- Sun, Y.; Hanhan, I.; Sangid, M.D.; Lin, G. Predicting Mechanical Properties from Microstructure Images in Fiber-Reinforced Polymers Using Convolutional Neural Networks. Available online: https://arxiv.org/abs/2010.03675v1 (accessed on 28 August 2021).
- Akande, K.O.; Owolabi, T.O.; Twaha, S.; Olatunji, O.S. Performance comparison of SVM and ANN in predicting compressive strength of concrete. IOSR J. Comput. Eng. 2014, 16, 88–94. [Google Scholar] [CrossRef]
- Huang, J.; Sun, Y.; Zhang, J. Reduction of computational error by optimizing SVR kernel coefficients to simulate concrete compressive strength through the use of a human learning optimization algorithm. Eng. Comput. 2021, 1, 1–18. [Google Scholar] [CrossRef]
- Sarir, P.; Chen, J.; Asteris, P.G.; Armaghani, D.J.; Tahir, M.M. Developing GEP tree-based, neuro-swarm, and whale optimization models for evaluation of bearing capacity of concrete-filled steel tube columns. Eng. Comput. 2021, 37, 1–19. [Google Scholar] [CrossRef]
- Balf, F.R.; Kordkheili, H.M. A New method for predicting the ingredients of self-compacting concrete (SCC) including fly ash (FA) using data envelopment analysis (DEA). Arab. J. Sci. Eng. 2021, 46, 4439–4460. [Google Scholar] [CrossRef]
- Ahmad, A.; Farooq, F.; Ostrowski, K.; Śliwa-Wieczorek, K.; Czarnecki, S. Application of novel machine learning techniques for predicting the surface chloride concentration in concrete containing waste material. Materials 2021, 14, 2297. [Google Scholar] [CrossRef]
- Azimi-Pour, M.; Eskandari-Naddaf, H.; Pakzad, A. Linear and non-linear SVM prediction for fresh properties and compressive strength of high volume fly ash self-compacting concrete. Constr. Build. Mater. 2020, 230, 117021. [Google Scholar] [CrossRef]
- Saha, P.; Debnath, P.; Thomas, P. Prediction of fresh and hardened properties of self-compacting concrete using support vector regression approach. Neural Comput. Appl. 2019, 32, 7995–8010. [Google Scholar] [CrossRef]
- Shahmansouri, A.A.; Bengar, H.A.; Jahani, E. Predicting compressive strength and electrical resistivity of eco-friendly concrete containing natural zeolite via GEP algorithm. Constr. Build. Mater. 2019, 229, 116883. [Google Scholar] [CrossRef]
- Farooq, F.; Amin, M.N.; Khan, K.; Sadiq, M.R.; Javed, M.F.F.; Aslam, F.; Alyousef, R. A Comparative study of random forest and genetic engineering programming for the prediction of compressive strength of high strength concrete (HSC). Appl. Sci. 2020, 10, 7330. [Google Scholar] [CrossRef]
- Asteris, P.G.; Kolovos, K. Self-compacting concrete strength prediction using surrogate models. Neural Comput. Appl. 2017, 31, 409–424. [Google Scholar] [CrossRef]
- Selvaraj, S.; Sivaraman, S. Prediction model for optimized self-compacting concrete with fly ash using response surface method based on fuzzy classification. Neural Comput. Appl. 2019, 31, 1365–1373. [Google Scholar] [CrossRef]
- Zhang, J.; Ma, G.; Huang, Y.; Sun, J.; Aslani, F.; Nener, B. Modelling uniaxial compressive strength of lightweight self-compacting concrete using random forest regression. Constr. Build. Mater. 2019, 210, 713–719. [Google Scholar] [CrossRef]
- Kaveh, A. M5′ and Mars based prediction models for properties of self-compacting concrete containing Fly ash. Period. Polytech. Civ. Eng. 2017, 62, 281–294. [Google Scholar] [CrossRef] [Green Version]
- Sathyan, D.; Anand, K.B.; Prakash, A.J.; Premjith, B. Modeling the fresh and hardened stage properties of self-compacting concrete using random kitchen sink algorithm. Int. J. Concr. Struct. Mater. 2018, 12, 24. [Google Scholar] [CrossRef]
- Vakhshouri, B.; Nejadi, S. Prediction of compressive strength of self-compacting concrete by ANFIS models. Neurocomputing 2018, 280, 13–22. [Google Scholar] [CrossRef]
- Douma, O.B.; Boukhatem, B.; Ghrici, M.; Tagnit-Hamou, A. Prediction of properties of self-compacting concrete containing fly ash using artificial neural network. Neural Comput. Appl. 2016, 28, 707–718. [Google Scholar] [CrossRef]
- Abu Yaman, M.; Elaty, M.A.; Taman, M. Predicting the ingredients of self compacting concrete using artificial neural network. Alex. Eng. J. 2017, 56, 523–532. [Google Scholar] [CrossRef]
- Ahmad, A.; Farooq, F.; Niewiadomski, P.; Ostrowski, K.; Akbar, A.; Aslam, F.; Alyousef, R. Prediction of compressive strength of fly ash based concrete using individual and ensemble algorithm. Materials 2021, 14, 794. [Google Scholar] [CrossRef]
- Farooq, F.; Ahmed, W.; Akbar, A.; Aslam, F.; Alyousef, R. Predictive modeling for sustainable high-performance concrete from industrial wastes: A comparison and optimization of models using ensemble learners. J. Clean. Prod. 2021, 292, 126032. [Google Scholar] [CrossRef]
- Bušić, R.; Benšić, M.; Miličević, I.; Strukar, K. Prediction models for the mechanical properties of self-compacting concrete with recycled rubber and silica fume. Materials 2020, 13, 1821. [Google Scholar] [CrossRef] [Green Version]
- Javed, M.F.; Farooq, F.; Memon, S.A.; Akbar, A.; Khan, M.A.; Aslam, F.; Alyousef, R.; Alabduljabbar, H.; Rehman, S.K.U. New prediction model for the ultimate axial capacity of concrete-filled steel tubes: An evolutionary approach. Crystals 2020, 10, 741. [Google Scholar] [CrossRef]
- Al-Mughanam, T.; Aldhyani, T.; AlSubari, B.; Al-Yaari, M. Modeling of Compressive strength of sustainable self-compacting concrete incorporating treated palm oil fuel ash using artificial neural network. Sustainability 2020, 12, 9322. [Google Scholar] [CrossRef]
- Nematzadeh, M.; Shahmansouri, A.A.; Fakoor, M. Post-fire compressive strength of recycled PET aggregate concrete reinforced with steel fibers: Optimization and prediction via RSM and GEP. Constr. Build. Mater. 2020, 252, 119057. [Google Scholar] [CrossRef]
- Ahmad, A.; Ostrowski, K.; Maślak, M.; Farooq, F.; Mehmood, I.; Nafees, A. Comparative study of supervised machine learning algorithms for predicting the compressive strength of concrete at high temperature. Materials 2021, 14, 4222. [Google Scholar] [CrossRef] [PubMed]
- Kupwade-Patil, K.; Allouche, E.N. Impact of alkali silica reaction on fly ash-based geopolymer concrete. J. Mater. Civ. Eng. 2013, 25, 131–139. [Google Scholar] [CrossRef]
- Pane, I.; Imran, I.; Budiono, B. Compressive strength of fly ash-based geopolymer concrete with a variable of sodium hydroxide (NaOH) solution molarity. In MATEC Web of Conferences; EDP Sciences: Les Ulis, France, 2018; Volume 147, p. 01004. [Google Scholar]
- Embong, R.; Kusbiantoro, A.; Shafiq, N.; Nuruddin, M.F. Strength and microstructural properties of fly ash based geopolymer concrete containing high-calcium and water-absorptive aggregate. J. Clean. Prod. 2016, 112, 816–822. [Google Scholar] [CrossRef]
- Mehta, A.; Siddique, R. Sulfuric acid resistance of fly ash based geopolymer concrete. Constr. Build. Mater. 2017, 146, 136–143. [Google Scholar] [CrossRef]
- Lavanya, G.; Jegan, J. Durability study on high calcium fly ash based geopolymer concrete. Adv. Mater. Sci. Eng. 2015, 2015, 1–7. [Google Scholar] [CrossRef] [Green Version]
- Nazari, A.; Pacheco-Torgal, F. Predicting compressive strength of different geopolymers by artificial neural networks. Ceram. Int. 2013, 39, 2247–2257. [Google Scholar] [CrossRef] [Green Version]
- Anurag, M.; Deepika, C.; Namrata, J.; Manish, K.; Nidhi, S.; Durga, D. Effect of concentration of alkaline liquid and curing time on strength and water absorption of geopolymer concrete. ARPN J. Eng. Appl. Sci. 2008, 3, 14–18. Available online: www.arpnjournals.com (accessed on 2 September 2021).
- Rattanasak, U.; Chindaprasirt, P. Influence of NaOH solution on the synthesis of fly ash geopolymer. Miner. Eng. 2009, 22, 1073–1078. [Google Scholar] [CrossRef]
- Prabakar, J.; Dendorkar, N.; Morchhale, R. Influence of fly ash on strength behavior of typical soils. Constr. Build. Mater. 2004, 18, 263–267. [Google Scholar] [CrossRef]
- Shah, M.; Abunama, T.; Javed, M.; Bux, F.; Aldrees, A.; Tariq, M.; Mosavi, A. Modeling surface water quality using the adaptive neuro-fuzzy inference system aided by input optimization. Sustainability 2021, 13, 4576. [Google Scholar] [CrossRef]


| Sr. No | Type of ML | Notation | Data Points | Forecasted Properties | Year | Material Used | References |
|---|---|---|---|---|---|---|---|
| 1. | Support vector machine | SVM | 144 | CS | 2021 | FA | [50] |
| 2. | Gene expression programming | GEP | 303 | Bearing capacity of concrete-filled steel tube column | 2019 | _ | [51] |
| 3. | Data Envelopment Analysis | DEA | 114 | CS Slump test L-box test V-funnel test | 2021 | FA | [52] |
| 4. | Gene expression programming, Artificial neural network, Decision tree | GEP, ANN, DT | 642 | Surface Chloride Concentration | 2021 | FA | [53] |
| 5. | Support vector machine | SVM | - | CS | 2020 | FA | [54] |
| 6. | Support vector machine | SVM | 115 | Slump test L-box test V-funnel test CS | 2020 | FA | [55] |
| 7. | Gene Expression Programming | GEP | 351 | CS | 2020 | GGBS | [56] |
| 8. | Gene Expression Programming | GEP | 54 | CS | 2019 | NZ (Natural Zeolite) | [57] |
| 9. | Gene Expression programming | GEP | 357 | CS | 2020 | - | [44] |
| 10. | Random forest and Gene Expression programming | RF and GEP | 357 | CS | 2020 | - | [57] |
| 11. | Artificial neuron network | ANN | 205 | CS | 2019 | FA GGBFS SF RHA | [58] |
| 12. | Intelligent rule-based enhanced multiclass support vector machine and fuzzy rules | IREMSVM-FR with RSM | 114 | CS | 2019 | FA | [59] |
| 13. | Random forest | RF | 131 | CS | 2019 | FA GGBFS FA | [60] |
| 14. | Multivariate Adaptive regression spline | M5 MARS | 114 | CS Slump test L-box test V-funnel test | 2018 | FA | [61] |
| 15. | Random Kitchen Sink Algorithm | RKSA | 40 | V-funnel test J-ring test Slump test CS | 2018 | FA | [62] |
| 16. | Adaptive neuro-fuzzy inference system | ANFIS | 55 | CS | 2018 | - | [63] |
| 17. | Artificial neuron network | ANN | 114 | CS | 2017 | FA | [64] |
| 18. | Artificial neuron network | ANN | 69 | CS | 2017 | FA | [65] |
| 19. | Individual and ensemble algorithm | GEP, DT and Bagging | 270 | CS | 2021 | FA | [66] |
| 20. | Individual with ensemble modeling | ANN, bagging and boosting | 1030 | CS | 2021 | FA | [67] |
| 21. | Multivariate | MV | 21 | CS | 2020 | Crumb rubber with SF | [68] |
| 22. | Gene Expression programming | GEP | 277 | Axial capacity | 2020 | - | [69] |
| 23. | Adaptive neuro-fuzzy inference system | ANFIS with ANN | 7 | CS | 2020 | POFA | [70] |
| 24. | Response Surface Method, Gene expression programming | RSM, GEP | 108 | CS | 2020 | Steel Fibers | [71] |
| 25. | Decision tree, artificial neural network, bagging, and gradient boosting | DT, ANN, BR, GB | 207 | CS | 2021 | FA | [72] |
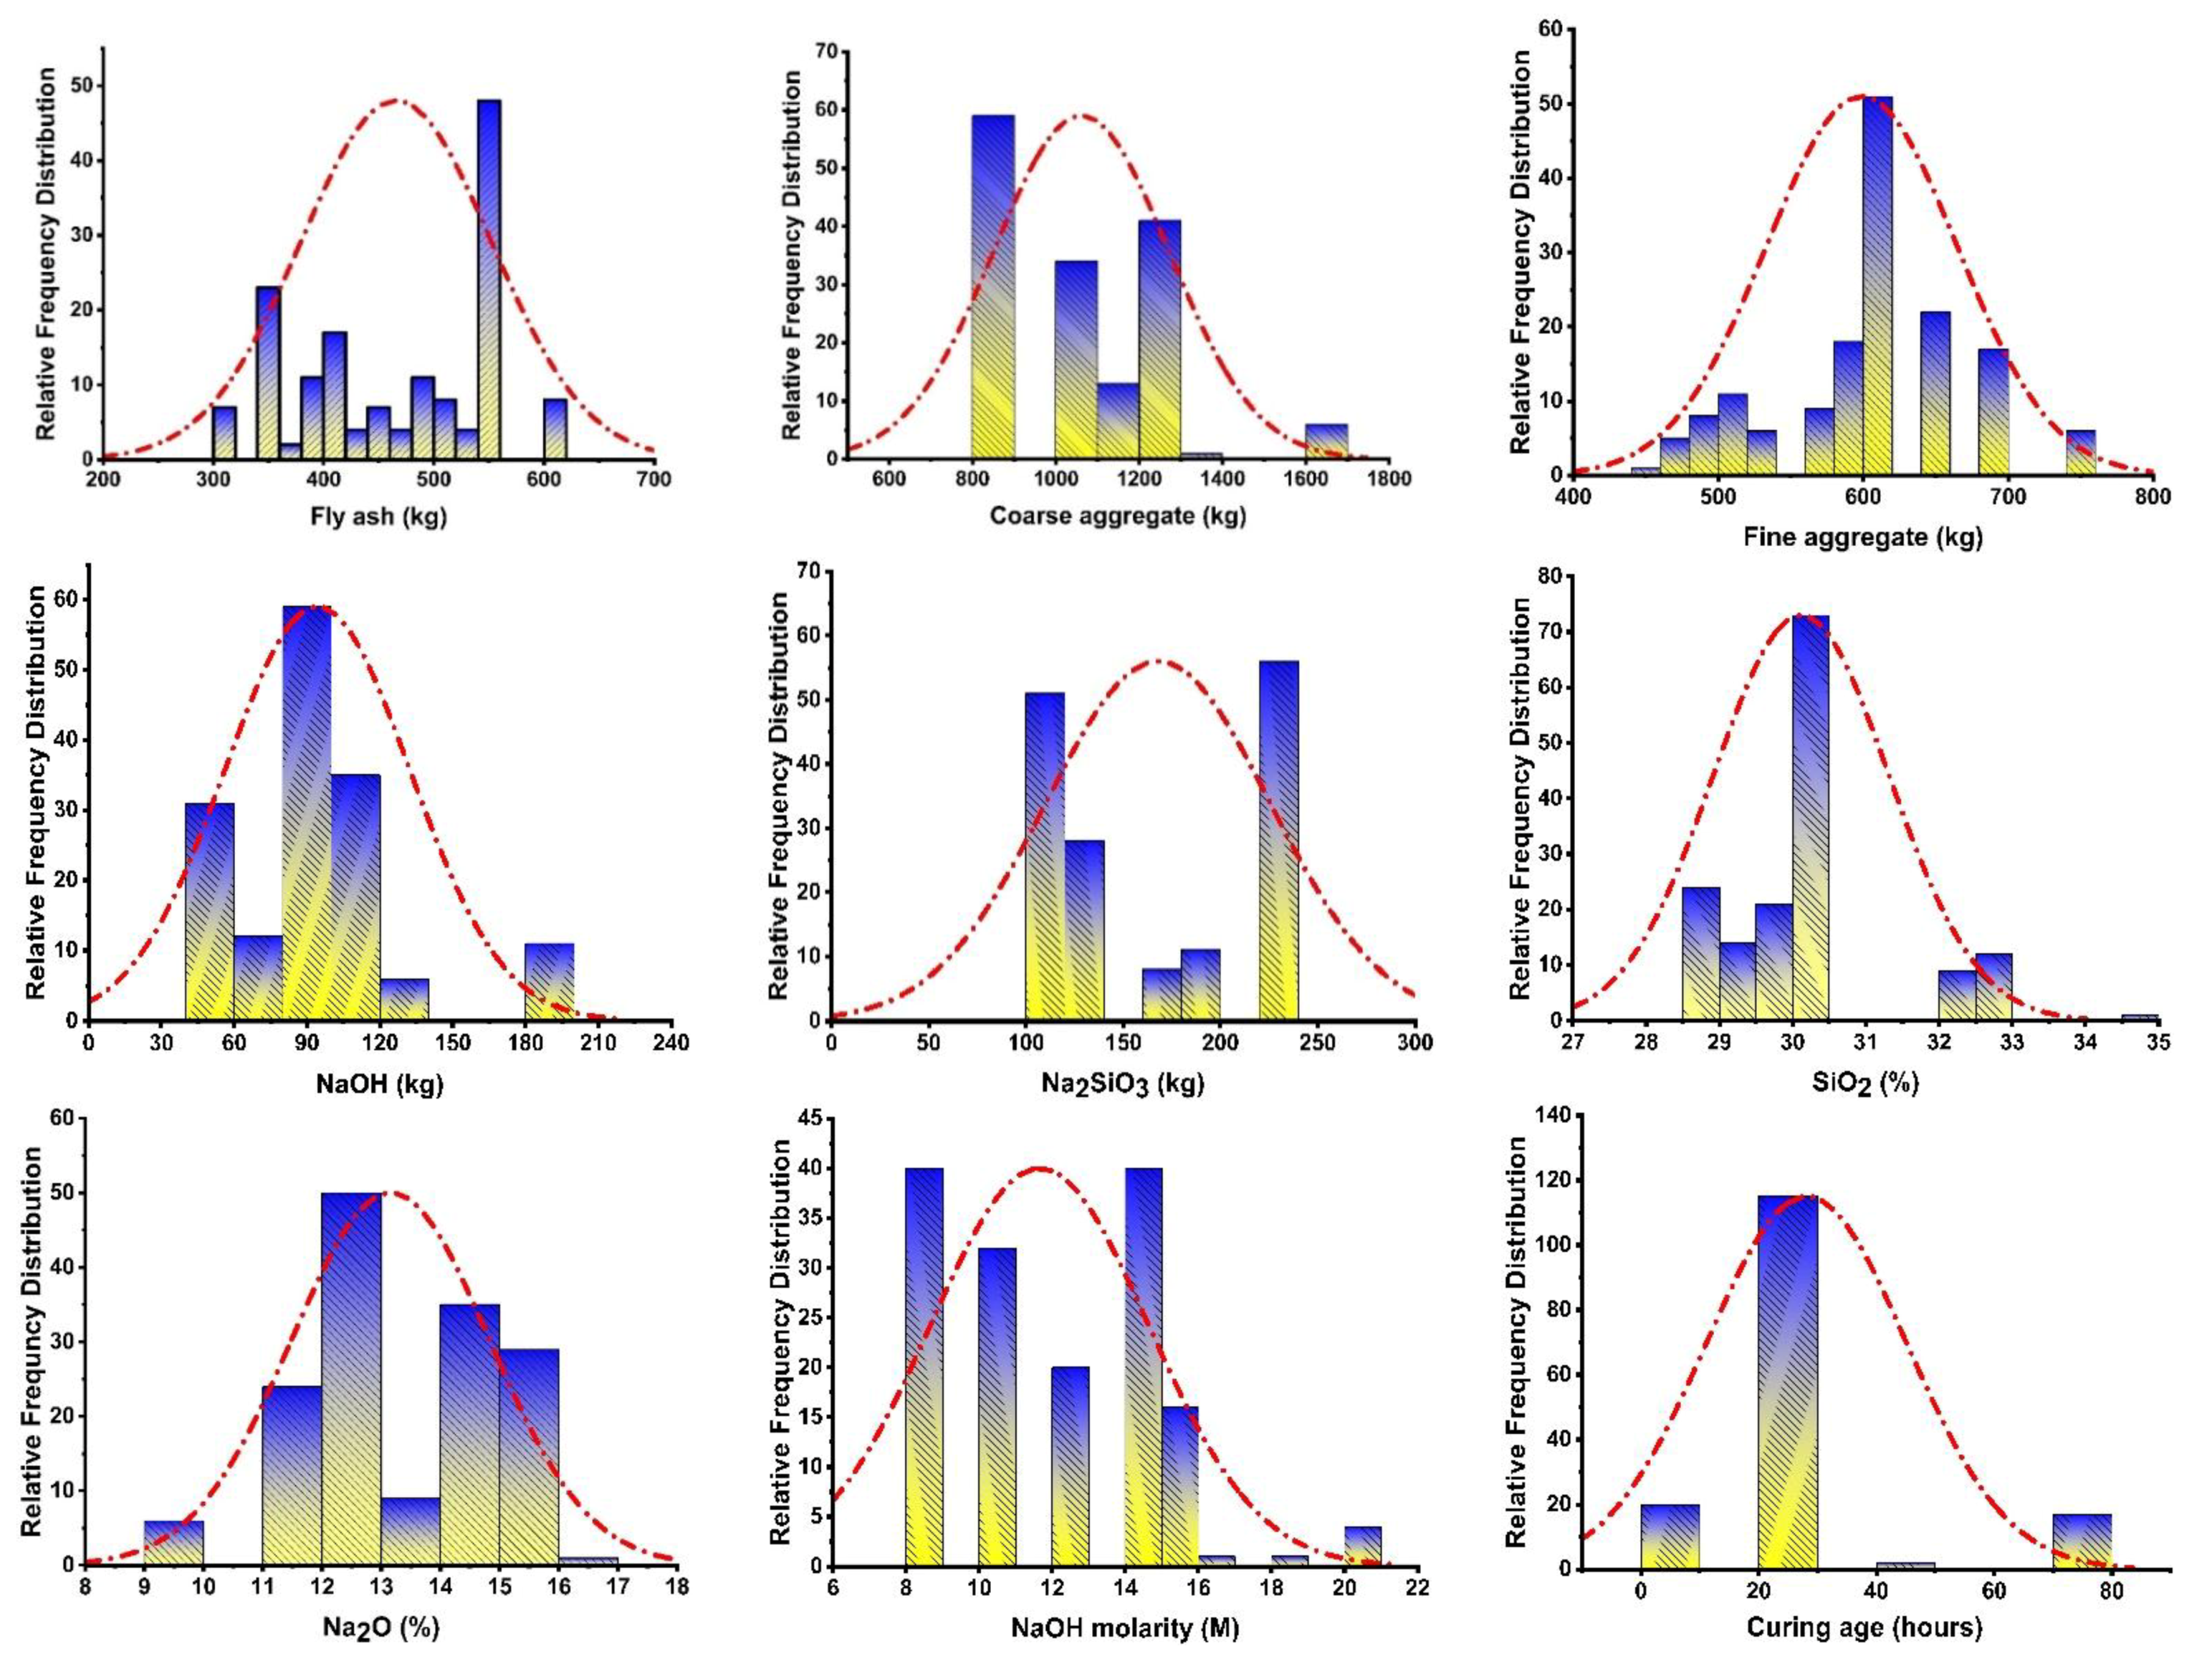
| Parameters | Fly Ash | Coarse Aggregate | Fine Aggregate | NaOH | Na2SiO3 | SiO2 | Na2O | Molarity of NaOH | Curing Age |
|---|---|---|---|---|---|---|---|---|---|
| Mean | 465.79 | 1060.99 | 598.93 | 94.26 | 167.87 | 30.12 | 13.16 | 11.65 | 28.13 |
| Standard Error | 6.97 | 16.93 | 5.29 | 3.07 | 4.64 | 0.10 | 0.13 | 0.24 | 1.37 |
| Median | 494.00 | 1091.00 | 600.00 | 95.00 | 138.00 | 30.00 | 12.00 | 12.00 | 24.00 |
| Mode | 550.00 | 838.00 | 600.00 | 95.00 | 239.00 | 30.00 | 12.00 | 8.00 | 24.00 |
| Standard Deviation | 86.54 | 210.13 | 65.61 | 38.05 | 57.61 | 1.20 | 1.67 | 2.98 | 17.01 |
| Sample Variance | 7489.66 | 44,152.69 | 4305.08 | 1447.46 | 3318.74 | 1.43 | 2.79 | 8.90 | 289.26 |
| Kurtosis | −1.26 | 0.77 | −0.07 | 1.78 | −1.77 | 1.92 | −0.68 | −0.31 | 2.44 |
| Skewness | −0.26 | 0.80 | 0.01 | 1.02 | 0.20 | 1.50 | −0.28 | 0.42 | 1.67 |
| Range | 300.00 | 846.00 | 291.00 | 157.00 | 136.00 | 6.00 | 7.20 | 12.00 | 69.00 |
| Minimum | 300.00 | 838.00 | 459.00 | 41.00 | 103.00 | 28.70 | 9.00 | 8.00 | 3.00 |
| Maximum | 600.00 | 1684.00 | 750.00 | 198.00 | 239.00 | 34.70 | 16.20 | 20.00 | 72.00 |
| Sum | 71,732.00 | 163,393.00 | 92,235.40 | 14,516.20 | 25,851.42 | 4637.90 | 2026.20 | 1794.00 | 4332.00 |
| Count | 154.00 | 154.00 | 154.00 | 154.00 | 154.00 | 154.00 | 154.00 | 154.00 | 154.00 |
| ML Algorithms | MAE (MPa) | MSE (MPa) | RMSE (MPa) |
|---|---|---|---|
| Artificial neural network (ANN) model | 3.86 | 20.16 | 4.49 |
| Boosting model | 1.69 | 4.16 | 2.04 |
| AdaBoost model | 2.16 | 6.84 | 2.62 |
Publisher’s Note: MDPI stays neutral with regard to jurisdictional claims in published maps and institutional affiliations. |
© 2021 by the authors. Licensee MDPI, Basel, Switzerland. This article is an open access article distributed under the terms and conditions of the Creative Commons Attribution (CC BY) license (https://creativecommons.org/licenses/by/4.0/).
Share and Cite
Ahmad, A.; Ahmad, W.; Chaiyasarn, K.; Ostrowski, K.A.; Aslam, F.; Zajdel, P.; Joyklad, P. Prediction of Geopolymer Concrete Compressive Strength Using Novel Machine Learning Algorithms. Polymers 2021, 13, 3389. https://doi.org/10.3390/polym13193389
Ahmad A, Ahmad W, Chaiyasarn K, Ostrowski KA, Aslam F, Zajdel P, Joyklad P. Prediction of Geopolymer Concrete Compressive Strength Using Novel Machine Learning Algorithms. Polymers. 2021; 13(19):3389. https://doi.org/10.3390/polym13193389
Chicago/Turabian StyleAhmad, Ayaz, Waqas Ahmad, Krisada Chaiyasarn, Krzysztof Adam Ostrowski, Fahid Aslam, Paulina Zajdel, and Panuwat Joyklad. 2021. "Prediction of Geopolymer Concrete Compressive Strength Using Novel Machine Learning Algorithms" Polymers 13, no. 19: 3389. https://doi.org/10.3390/polym13193389