
Effects of Fe(OH)3 and MnO2 Flocs on Iron/Manganese Removal and Fouling in Aerated Submerged Membrane Systems


 , , , ,
Abstract
:1. Introduction

| Removal Process | Ambient | Results | Reference |
|---|---|---|---|
| Aeration + Filtration | FeCOH3 covered filter | High-capacity Fe2+ adsorption | O’Connor [7] |
| Aeration + Filtration | Catalysts | Effective iron and manganese removal | Andersen [9] |
| Aeration | Catalysts—MnO2 | Effective manganese removal | Coughlin &Matsu [10], Sung [11], Tüfekci and Sarikaya [13], Güneş-Durak et al. [16] |
| Aeration | Catalysts—FeO | Effective iron removal | Sung [11] |
| Aeration | Catalysts—α-FeOOH | Fast oxidation | Davies and Morgan [12] |
| Aeration | Catalysts—Fe(OH)3/MnO2 | Effective manganese removal | Çelik [17], Türkoglu [18,19] |
| Aeration | Sufficient dissolved O2 | Completely manganese and iron removal | Cheng [20] |
| Biological trickling filter | (Absence iron and ammonia) | 94% manganese removal | Gouzinis et al. [24] |
| Reverse Osmosis-UF (Dead end) | Oxidant- Chlorine | 80% manganese removal | Choo et al. [5] |
| MF | Oxidant- NaOCl | 90% manganese removal | Kan et al. [22] |
| Aeration + MF | - | 99% iron and manganese removal | Celik [17] |
| Aeration + UF | - | 99% iron and manganese removal | Celik [17] |
2. Materials and Methods
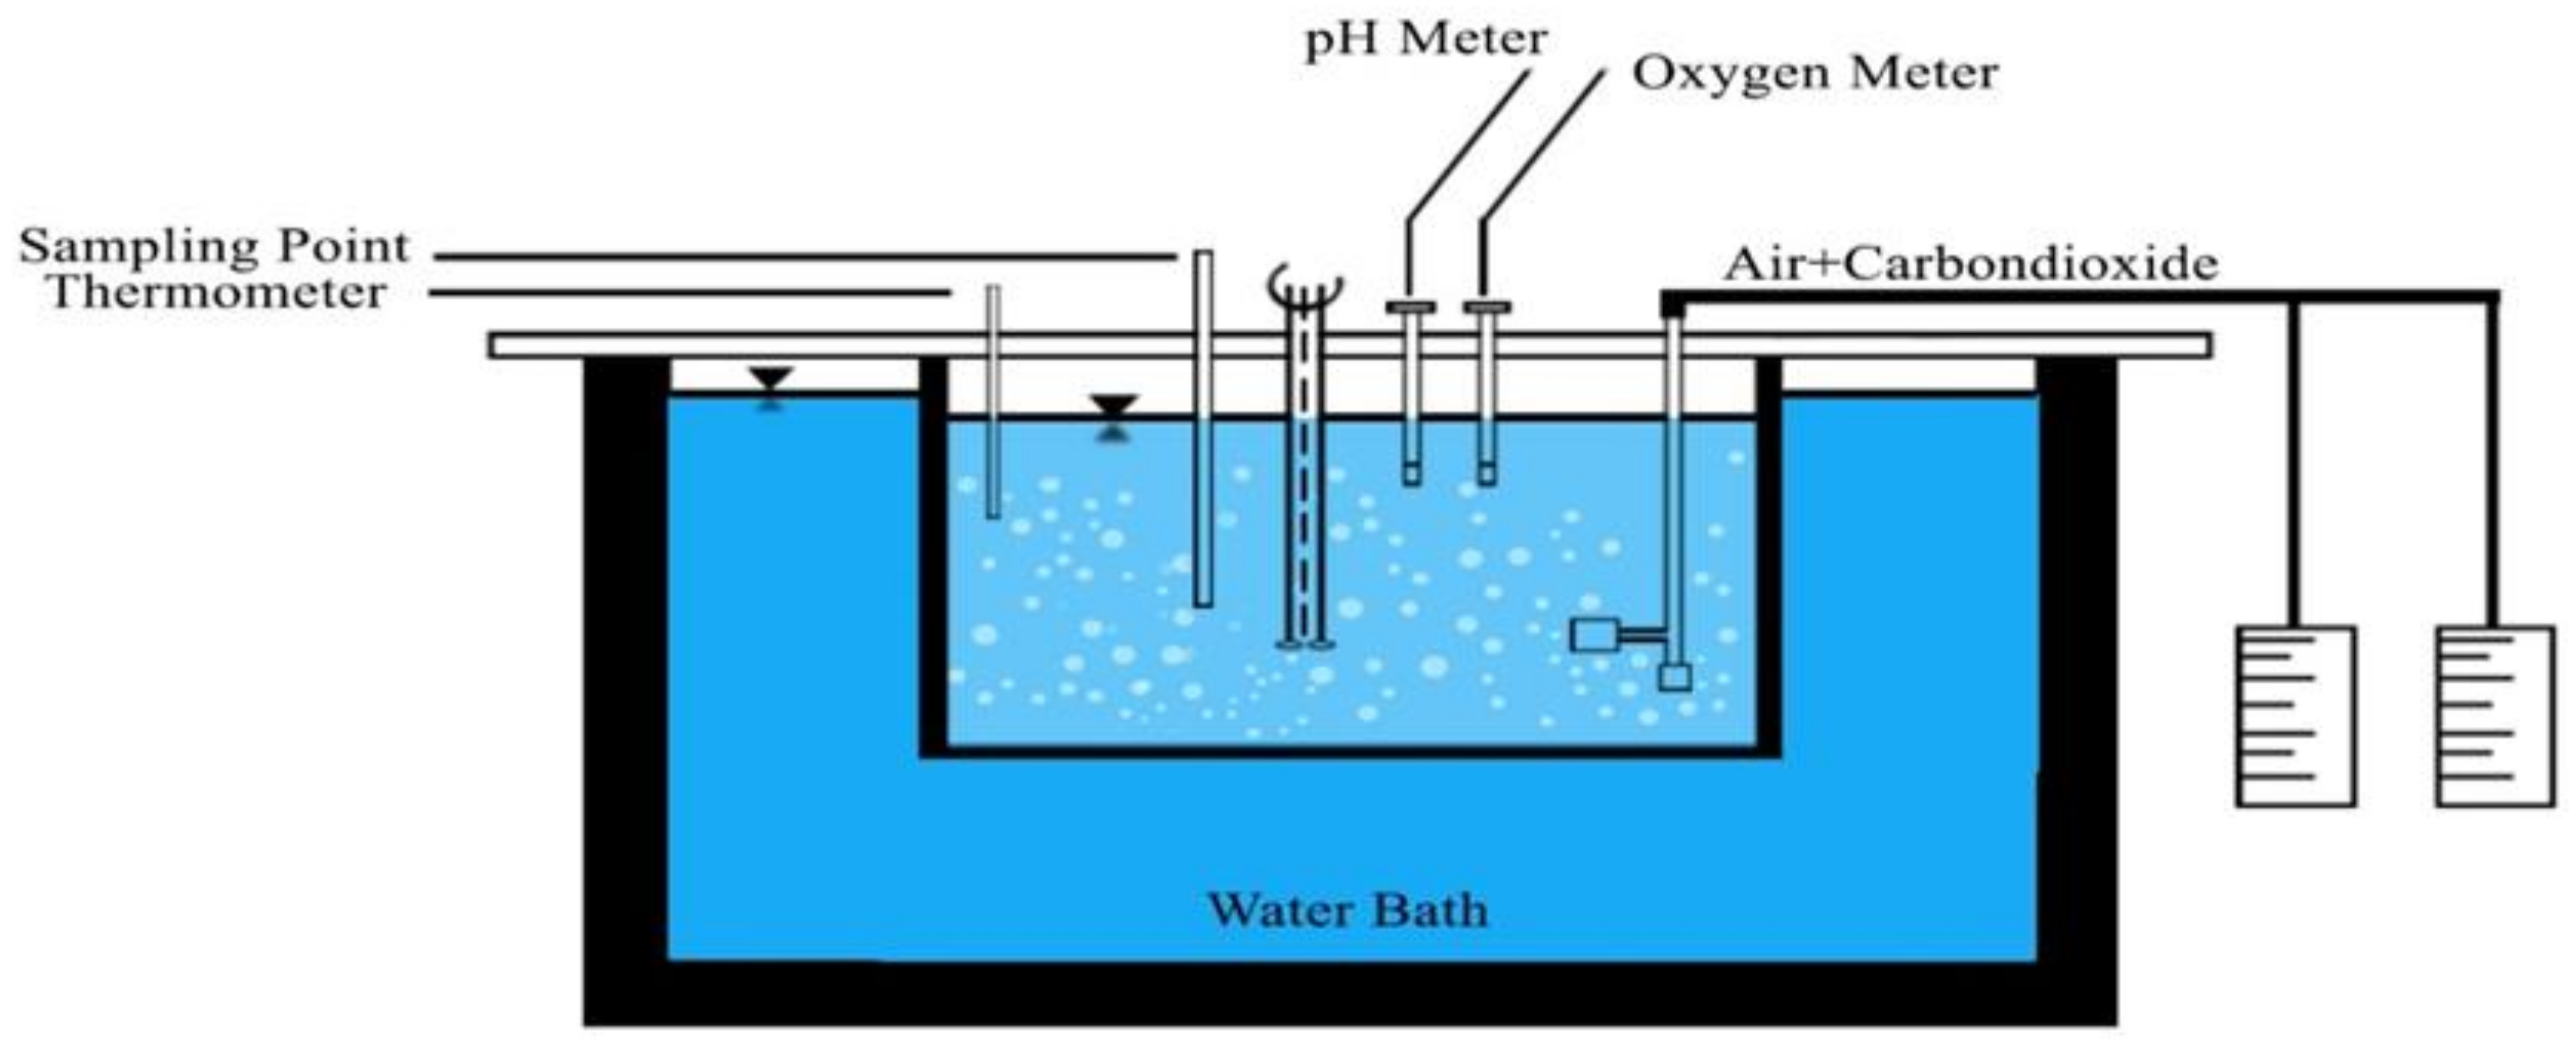
2.1. Experimental Setup of Oxidation
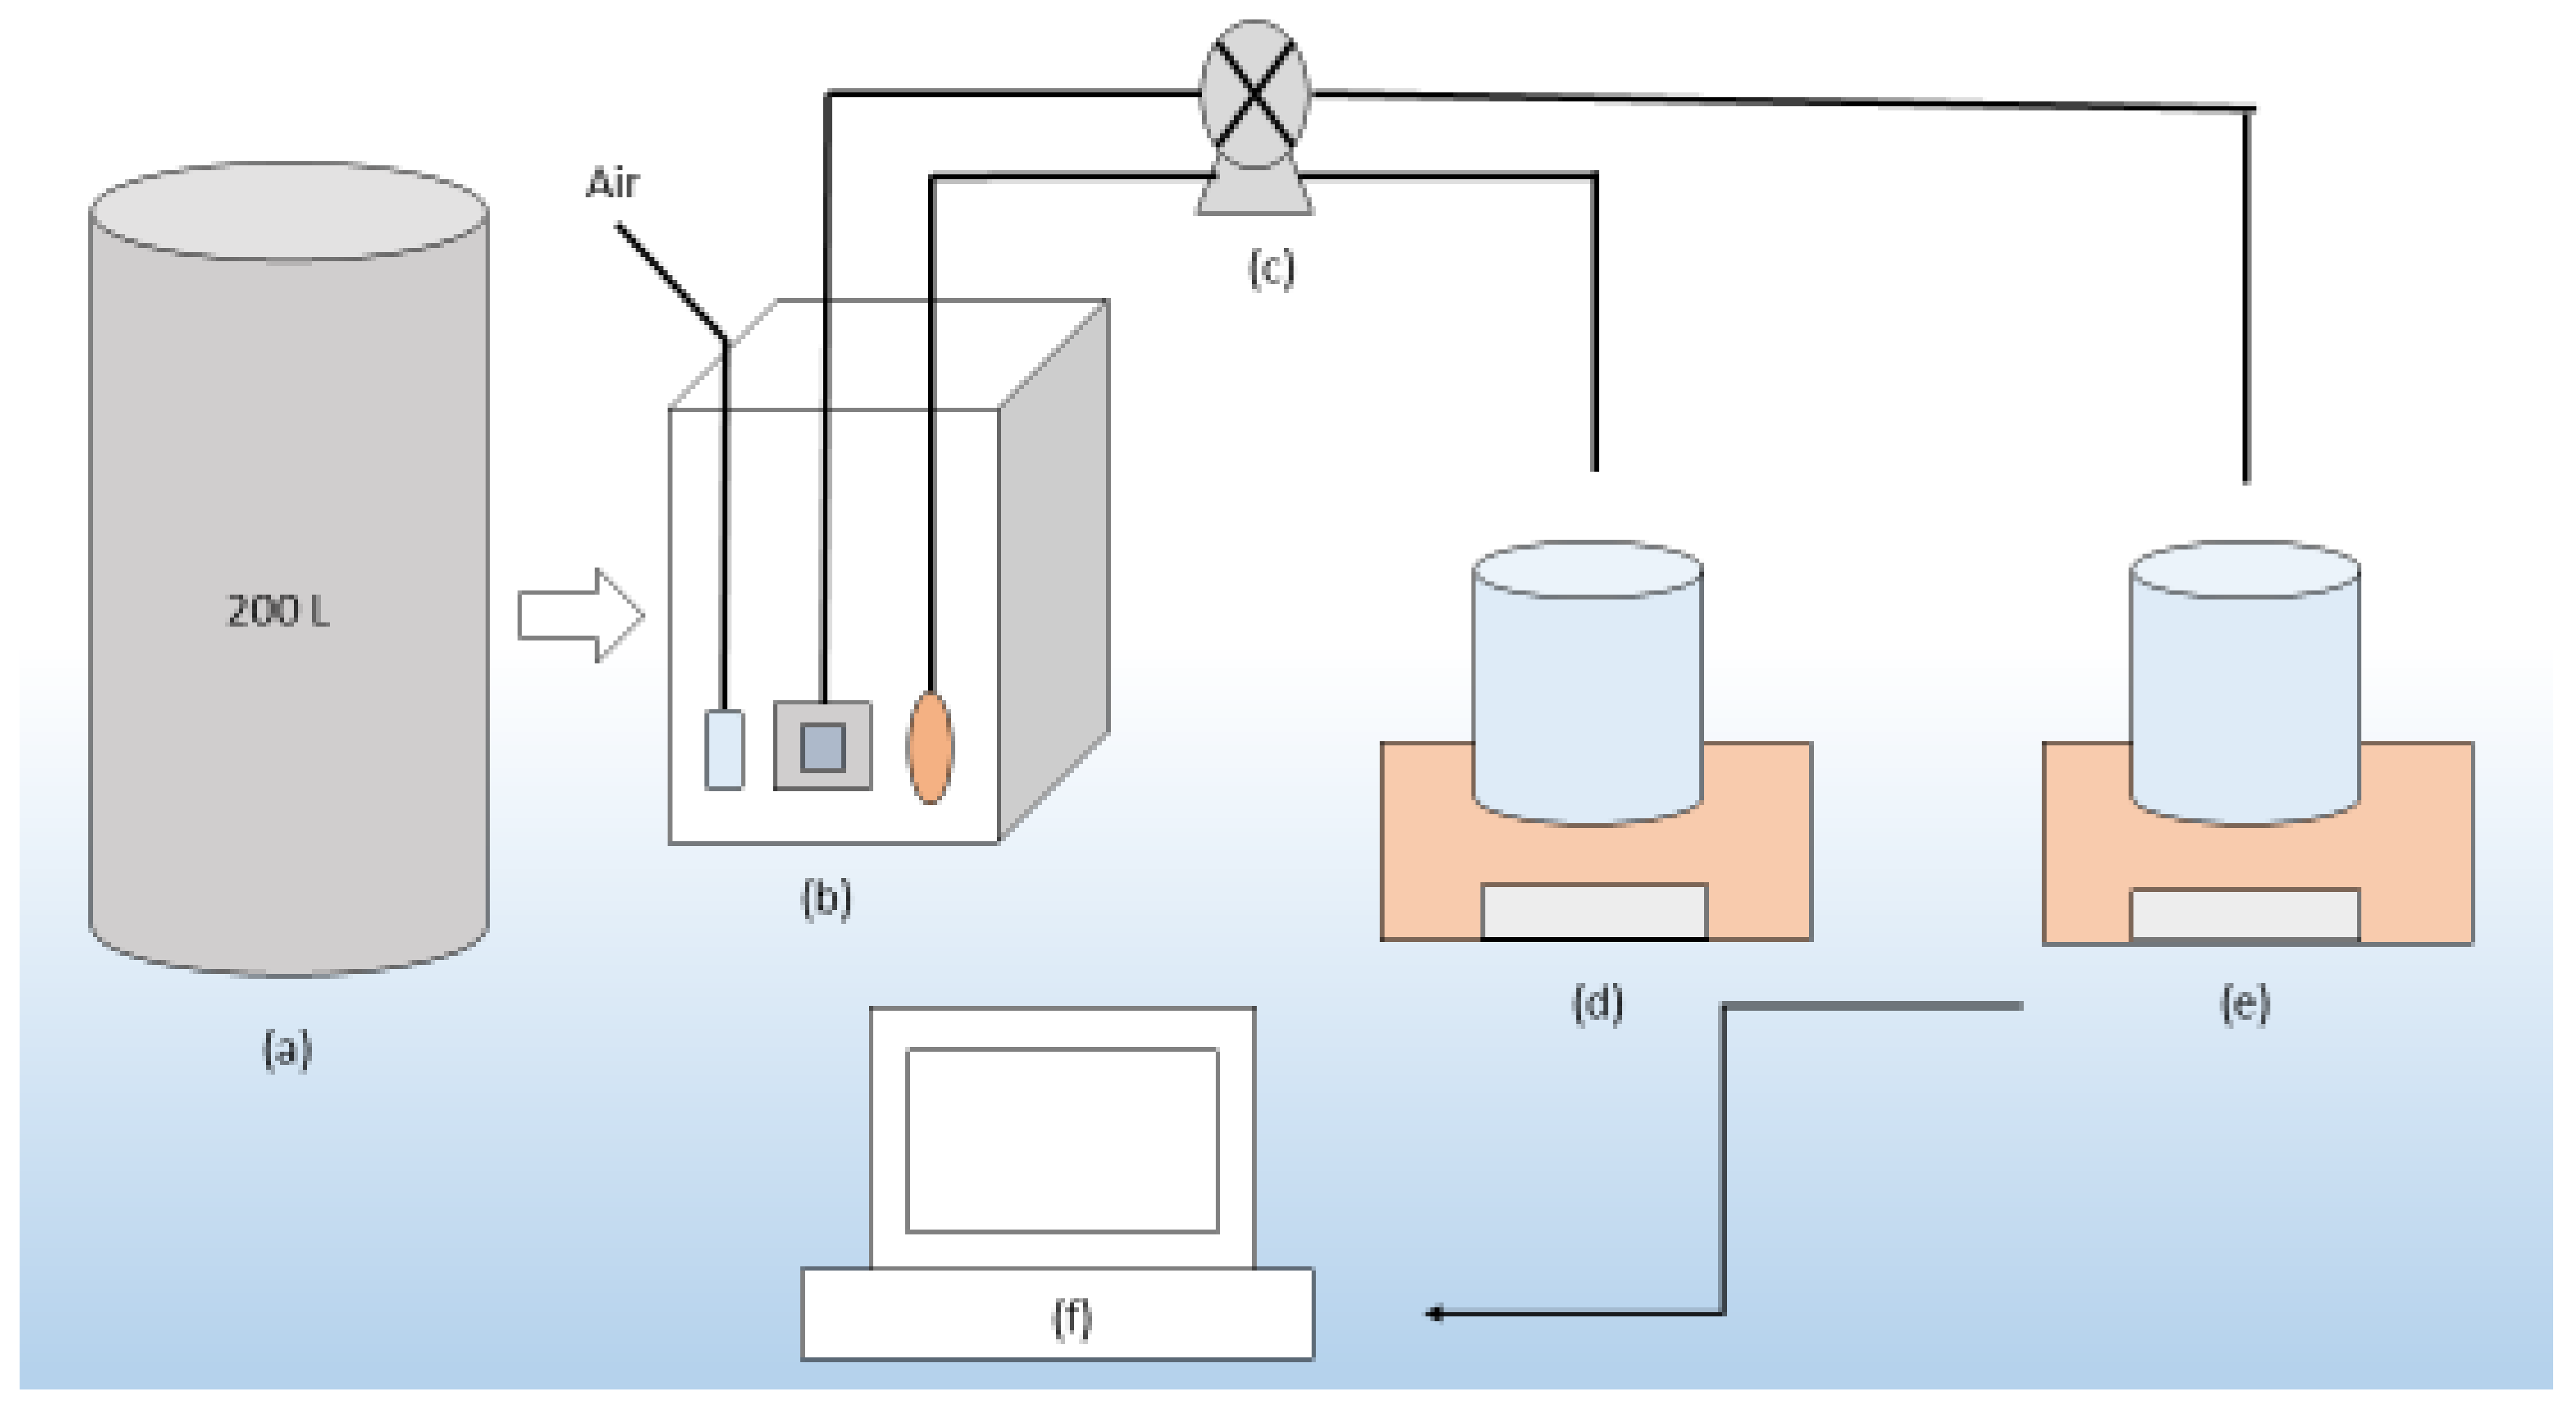
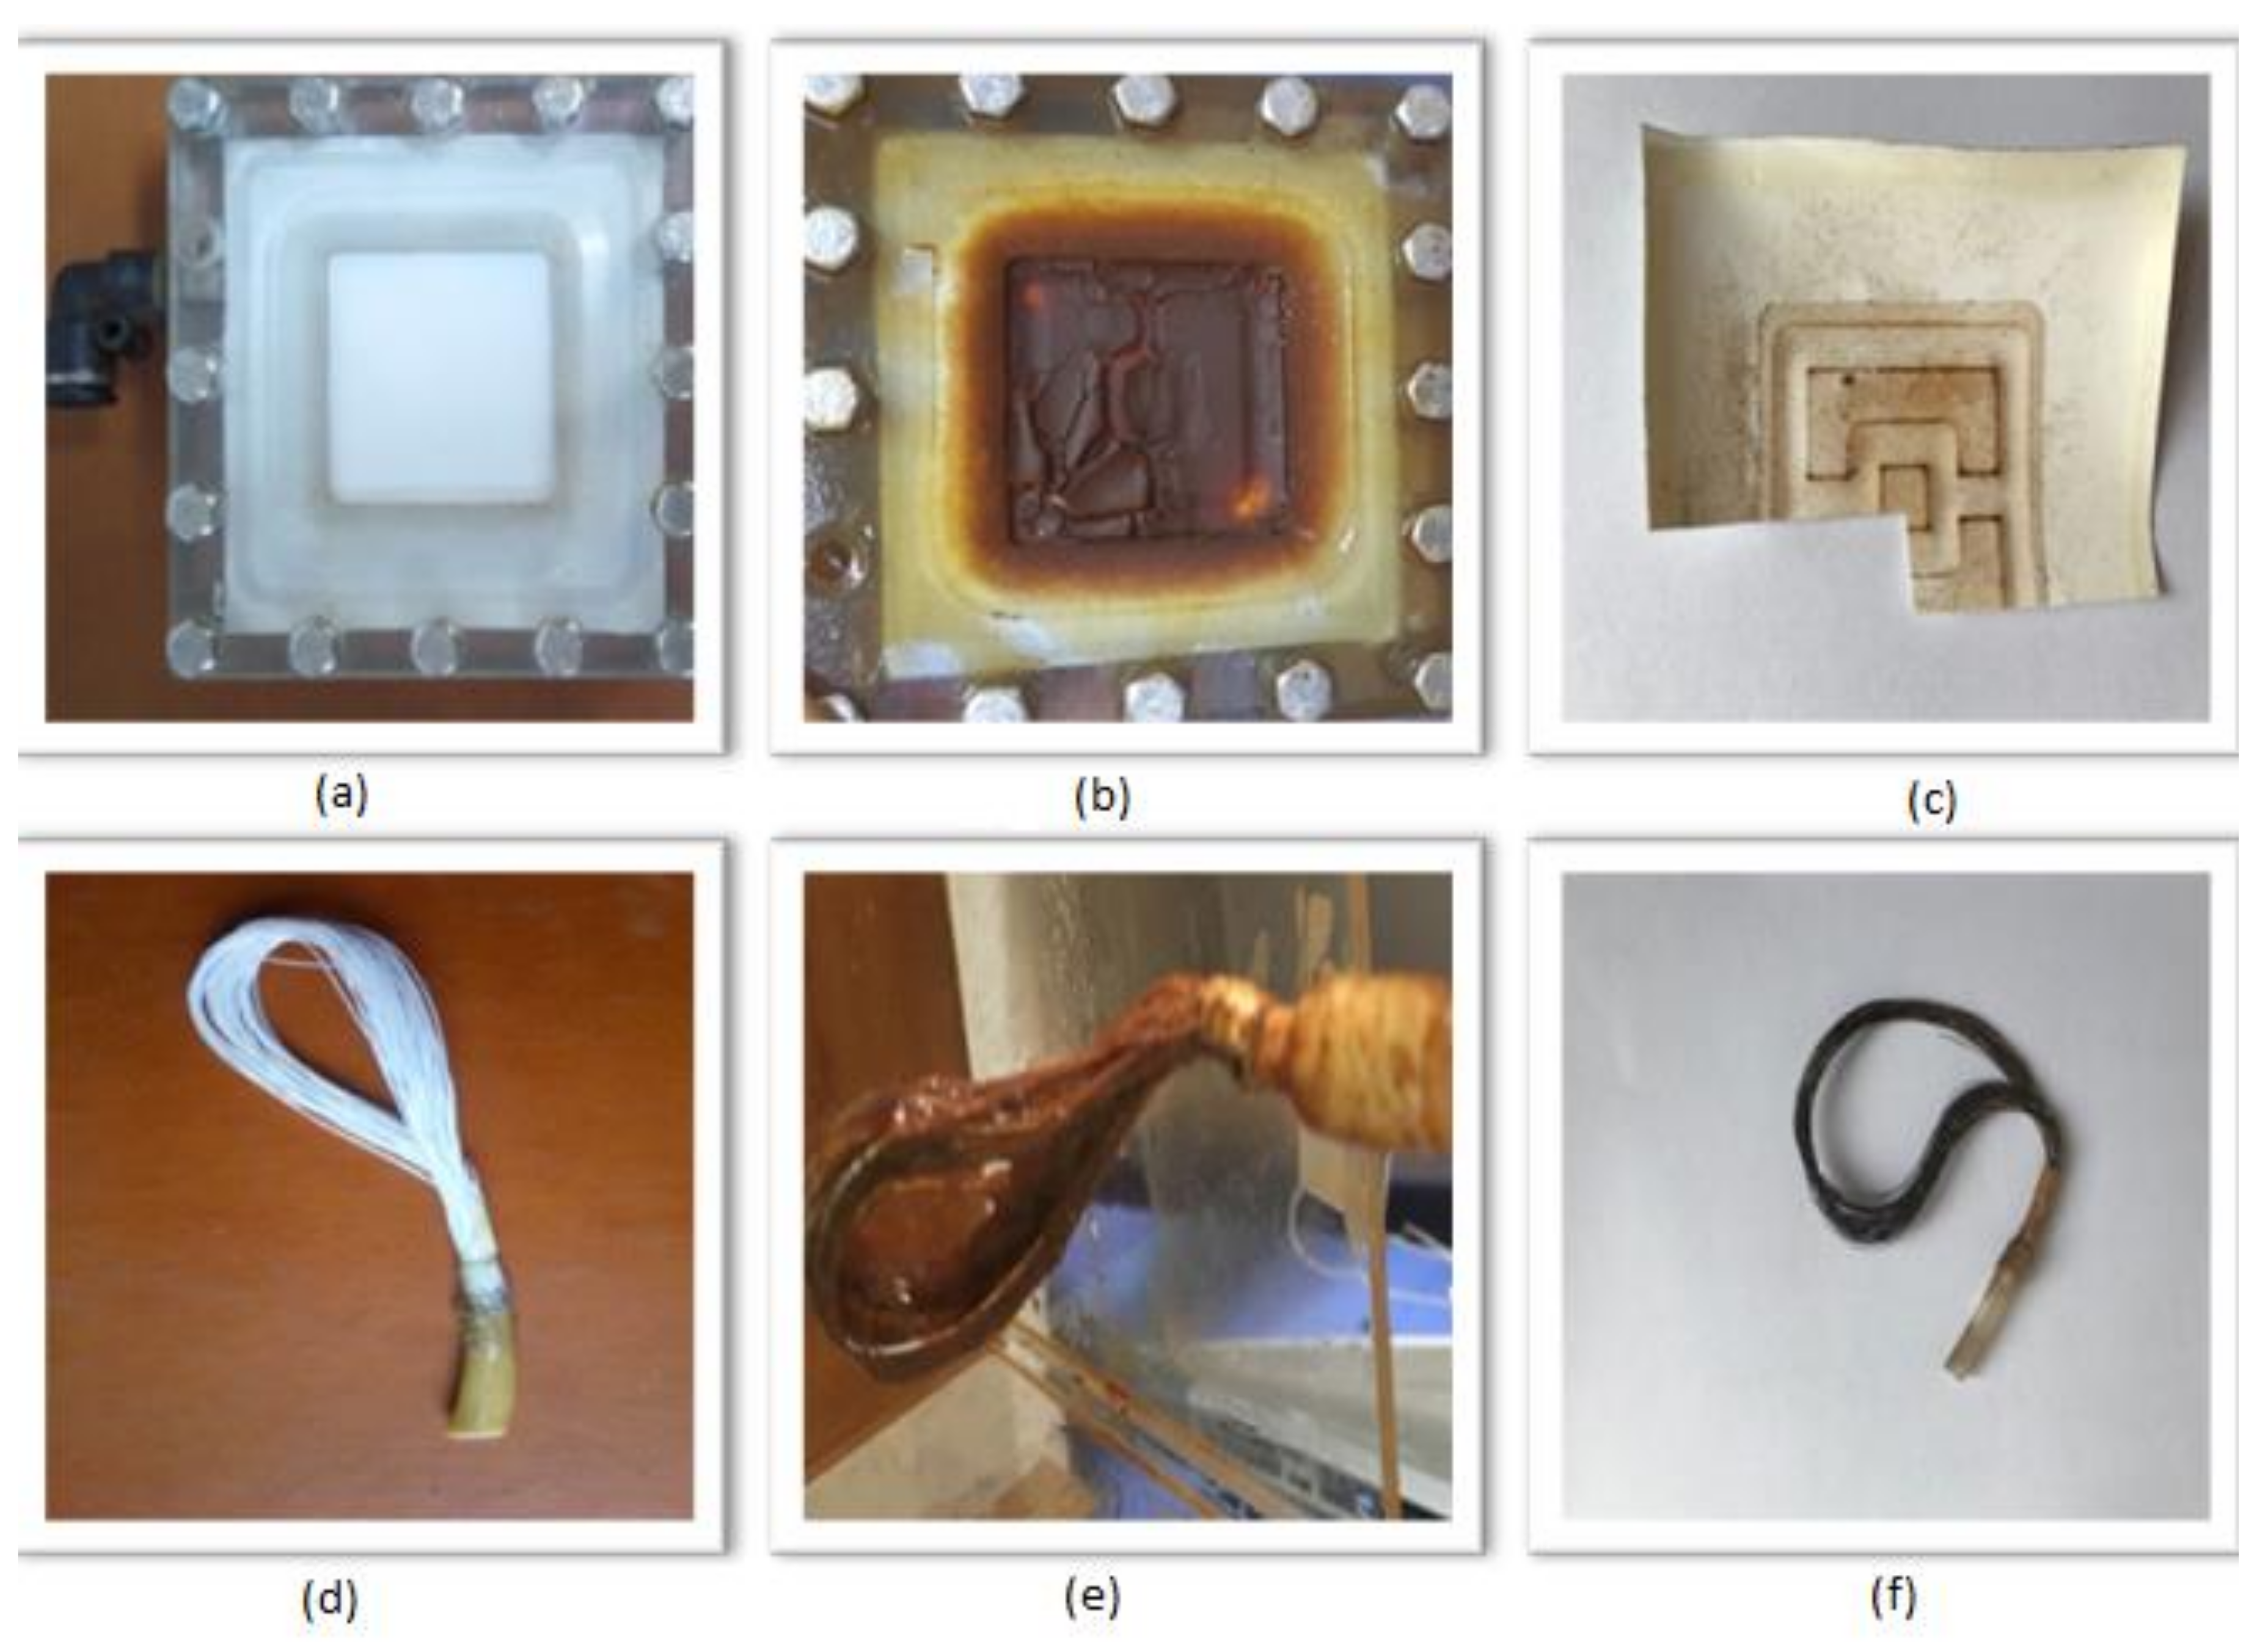
2.2. Experimental Setup of Submerged Membrane System
3. Results and Discussion
3.1. Oxidation Results
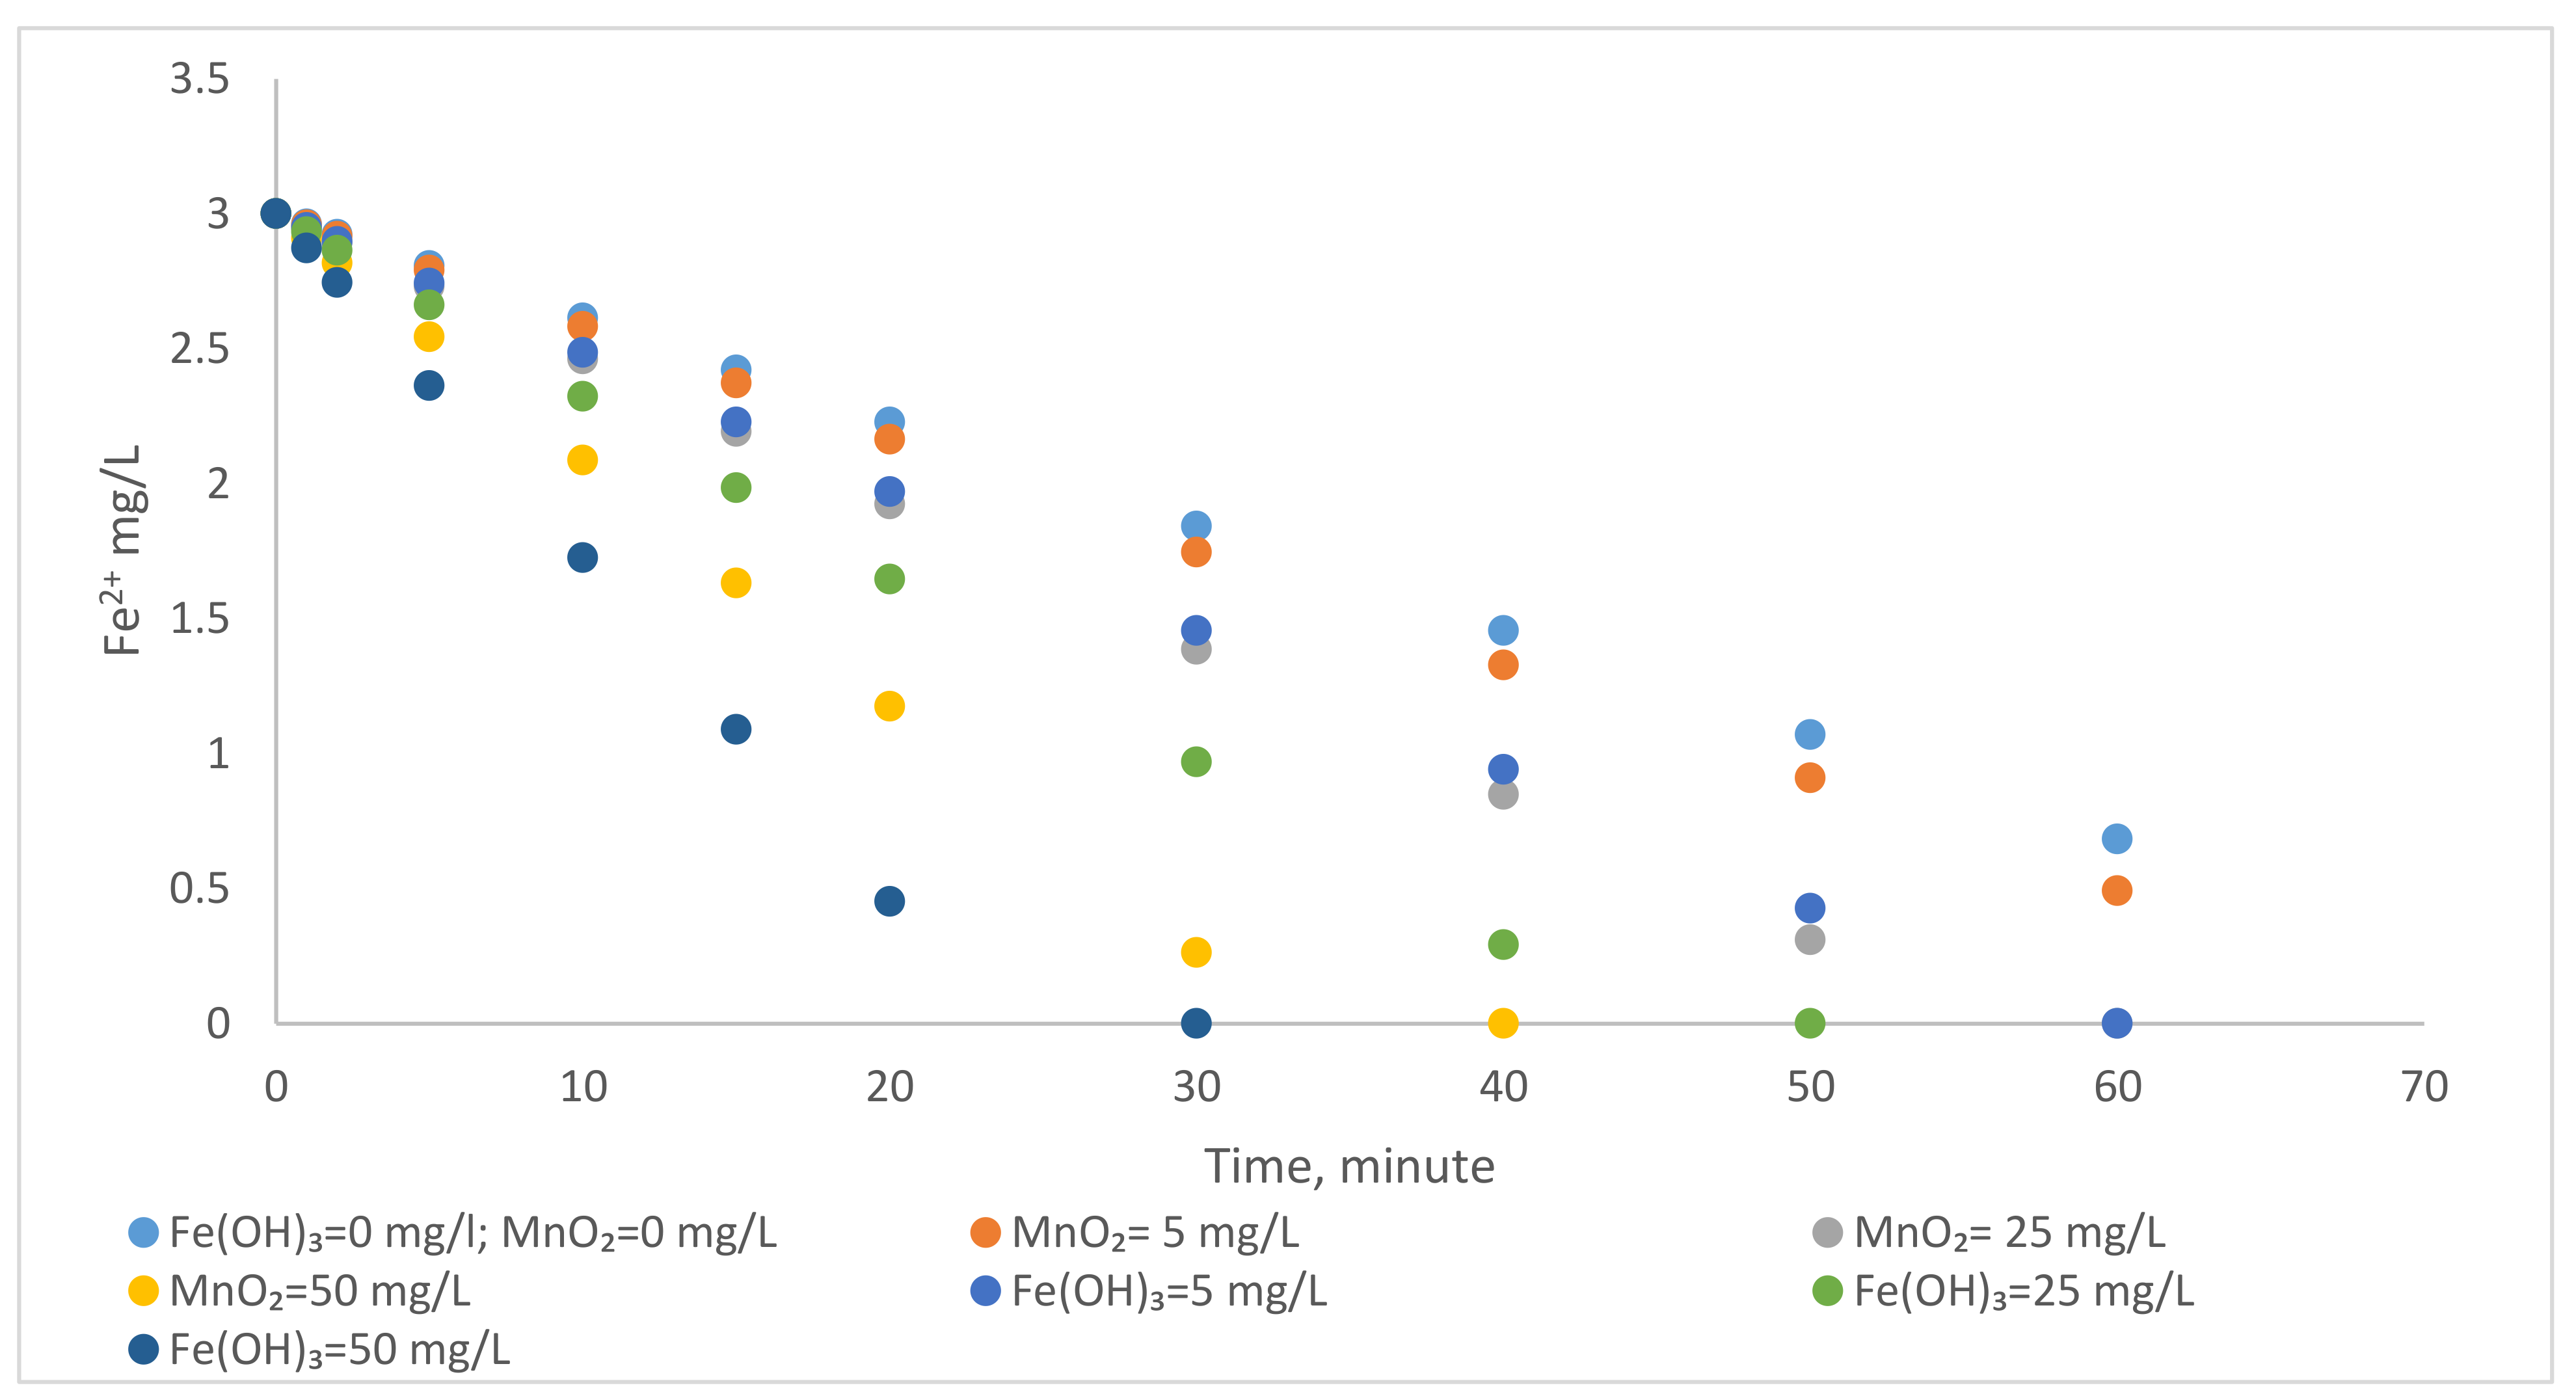
3.1.1. Catalytic Effect of MnO2 and Fe(OH)3 on Oxidation of Fe2+ by Aeration
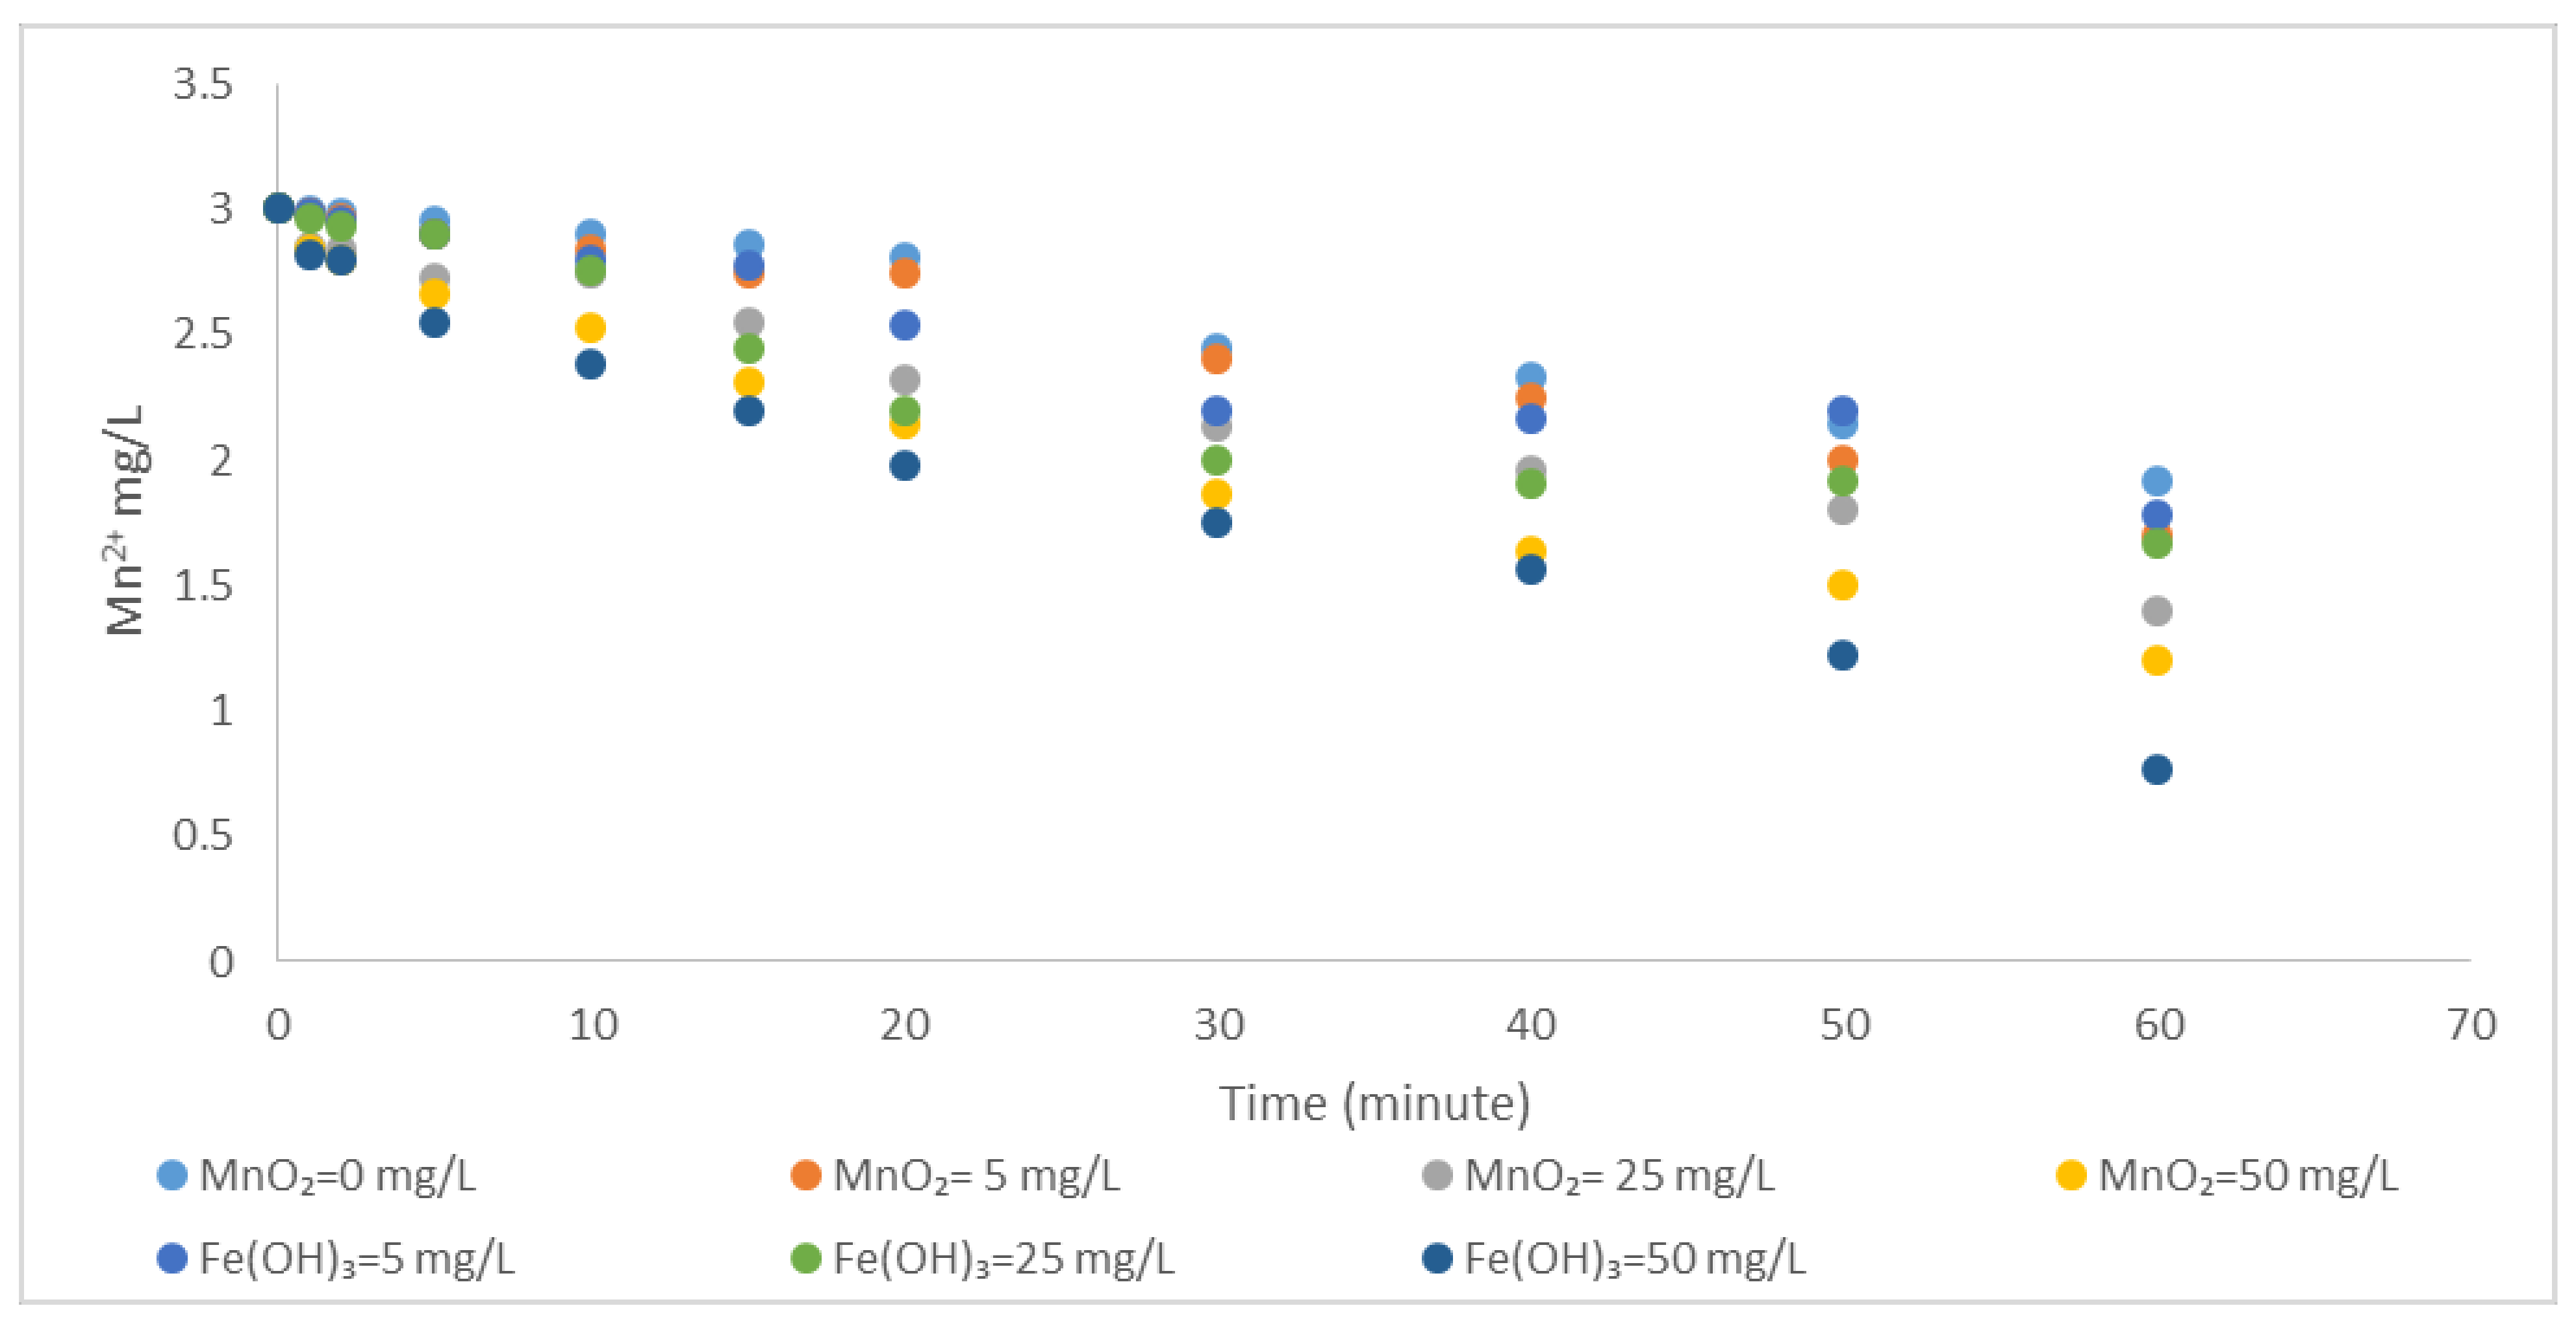
3.1.2. Catalytic Effect of MnO2 and Fe(OH)3 on Oxidation of Mn2+ by Aeration
3.2. Submerged Membrane Filtration Results
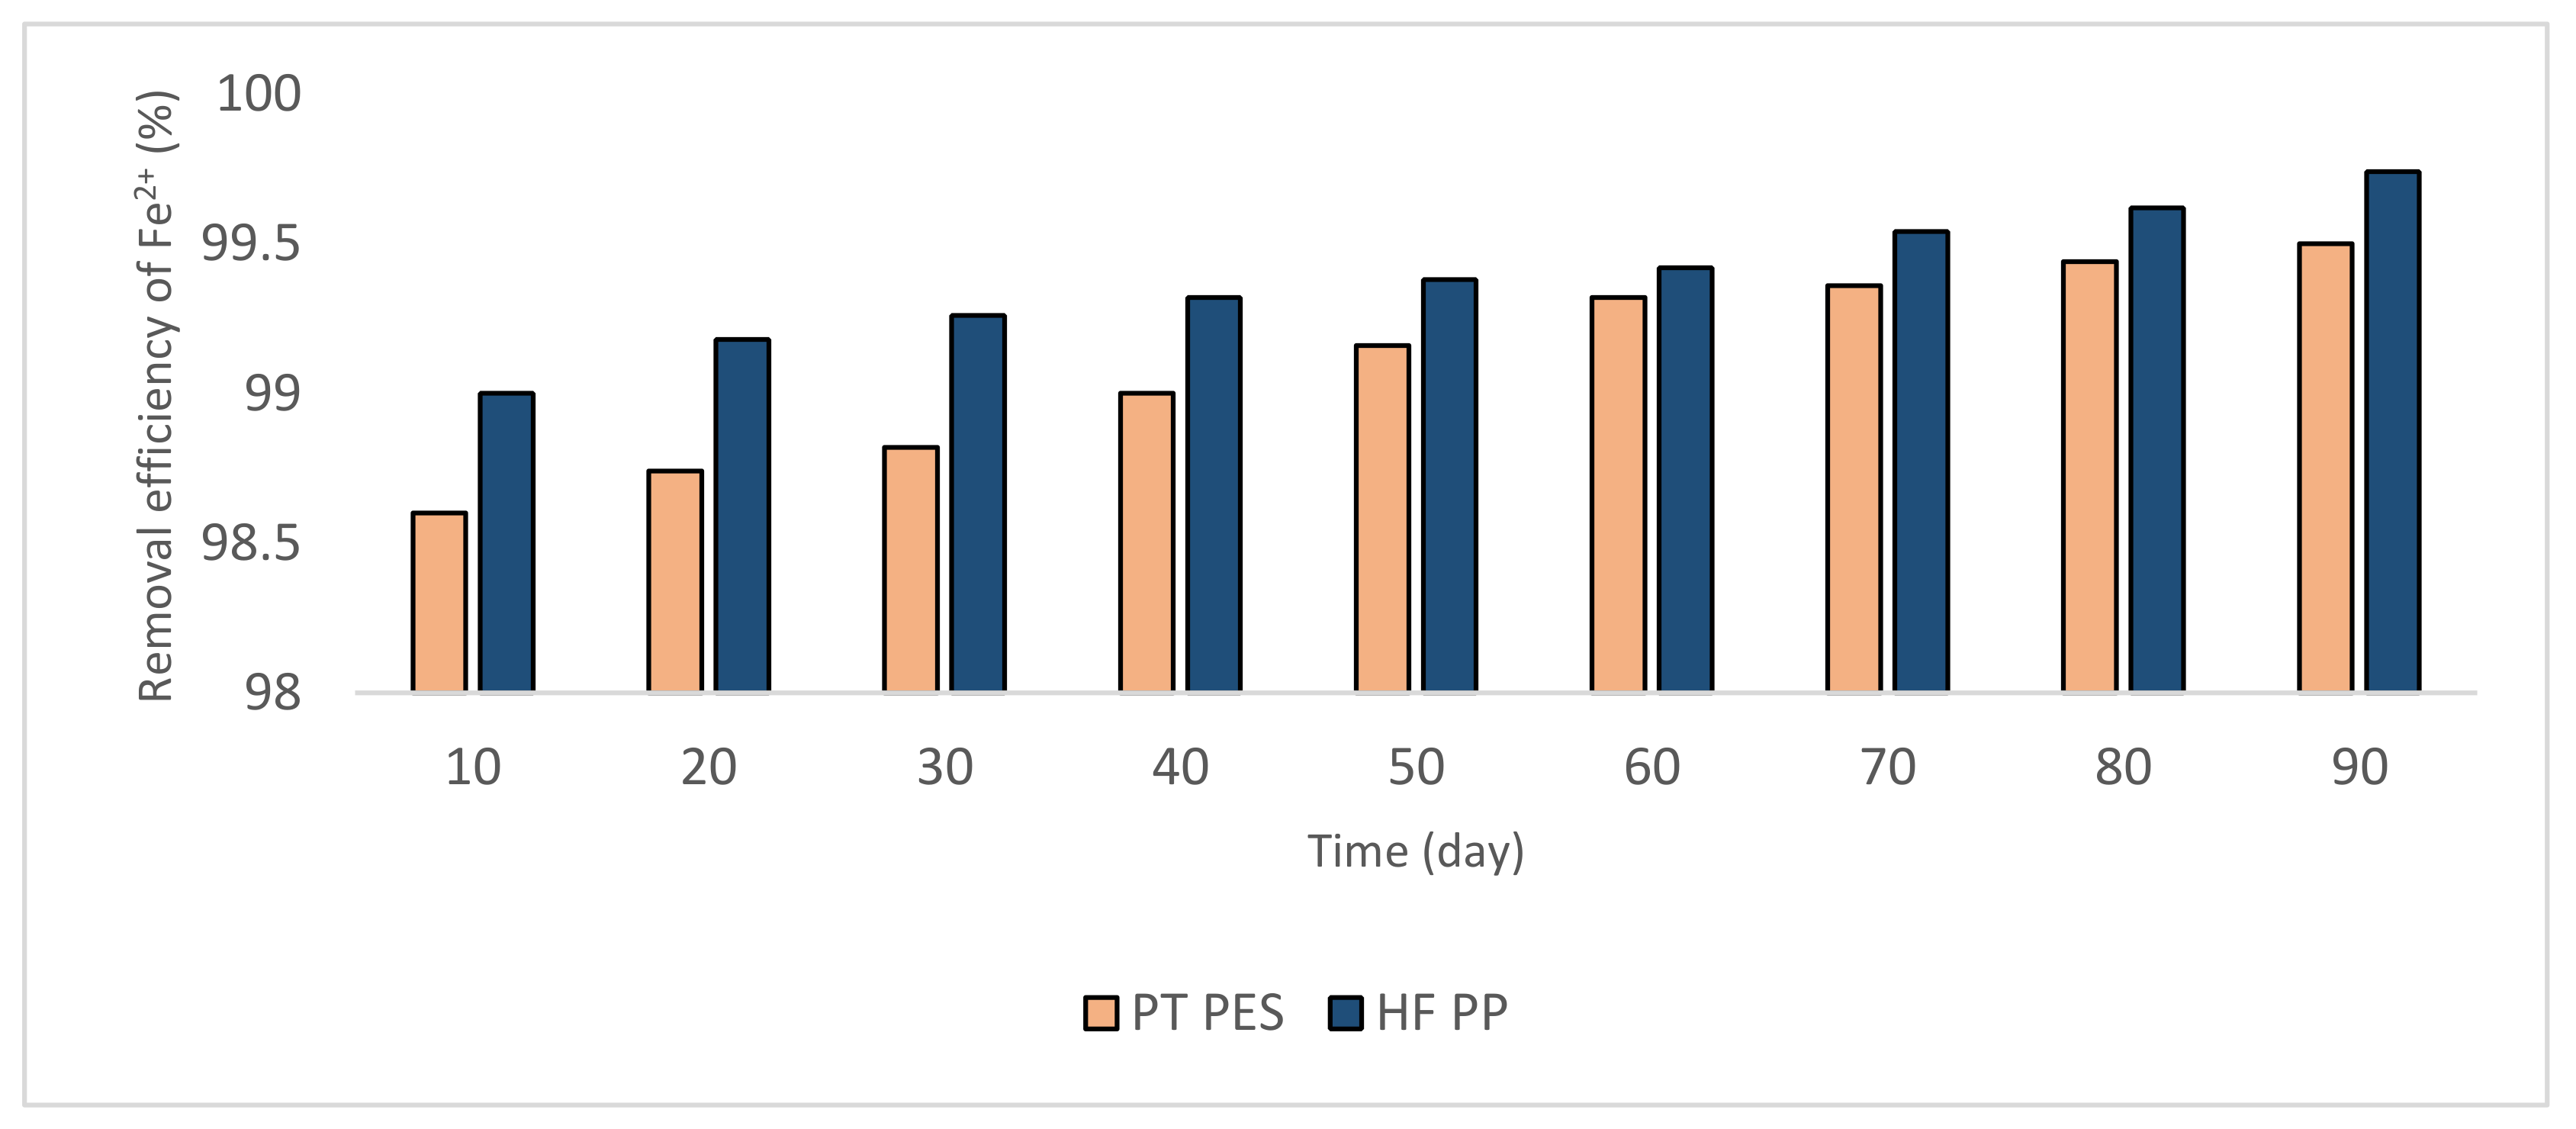
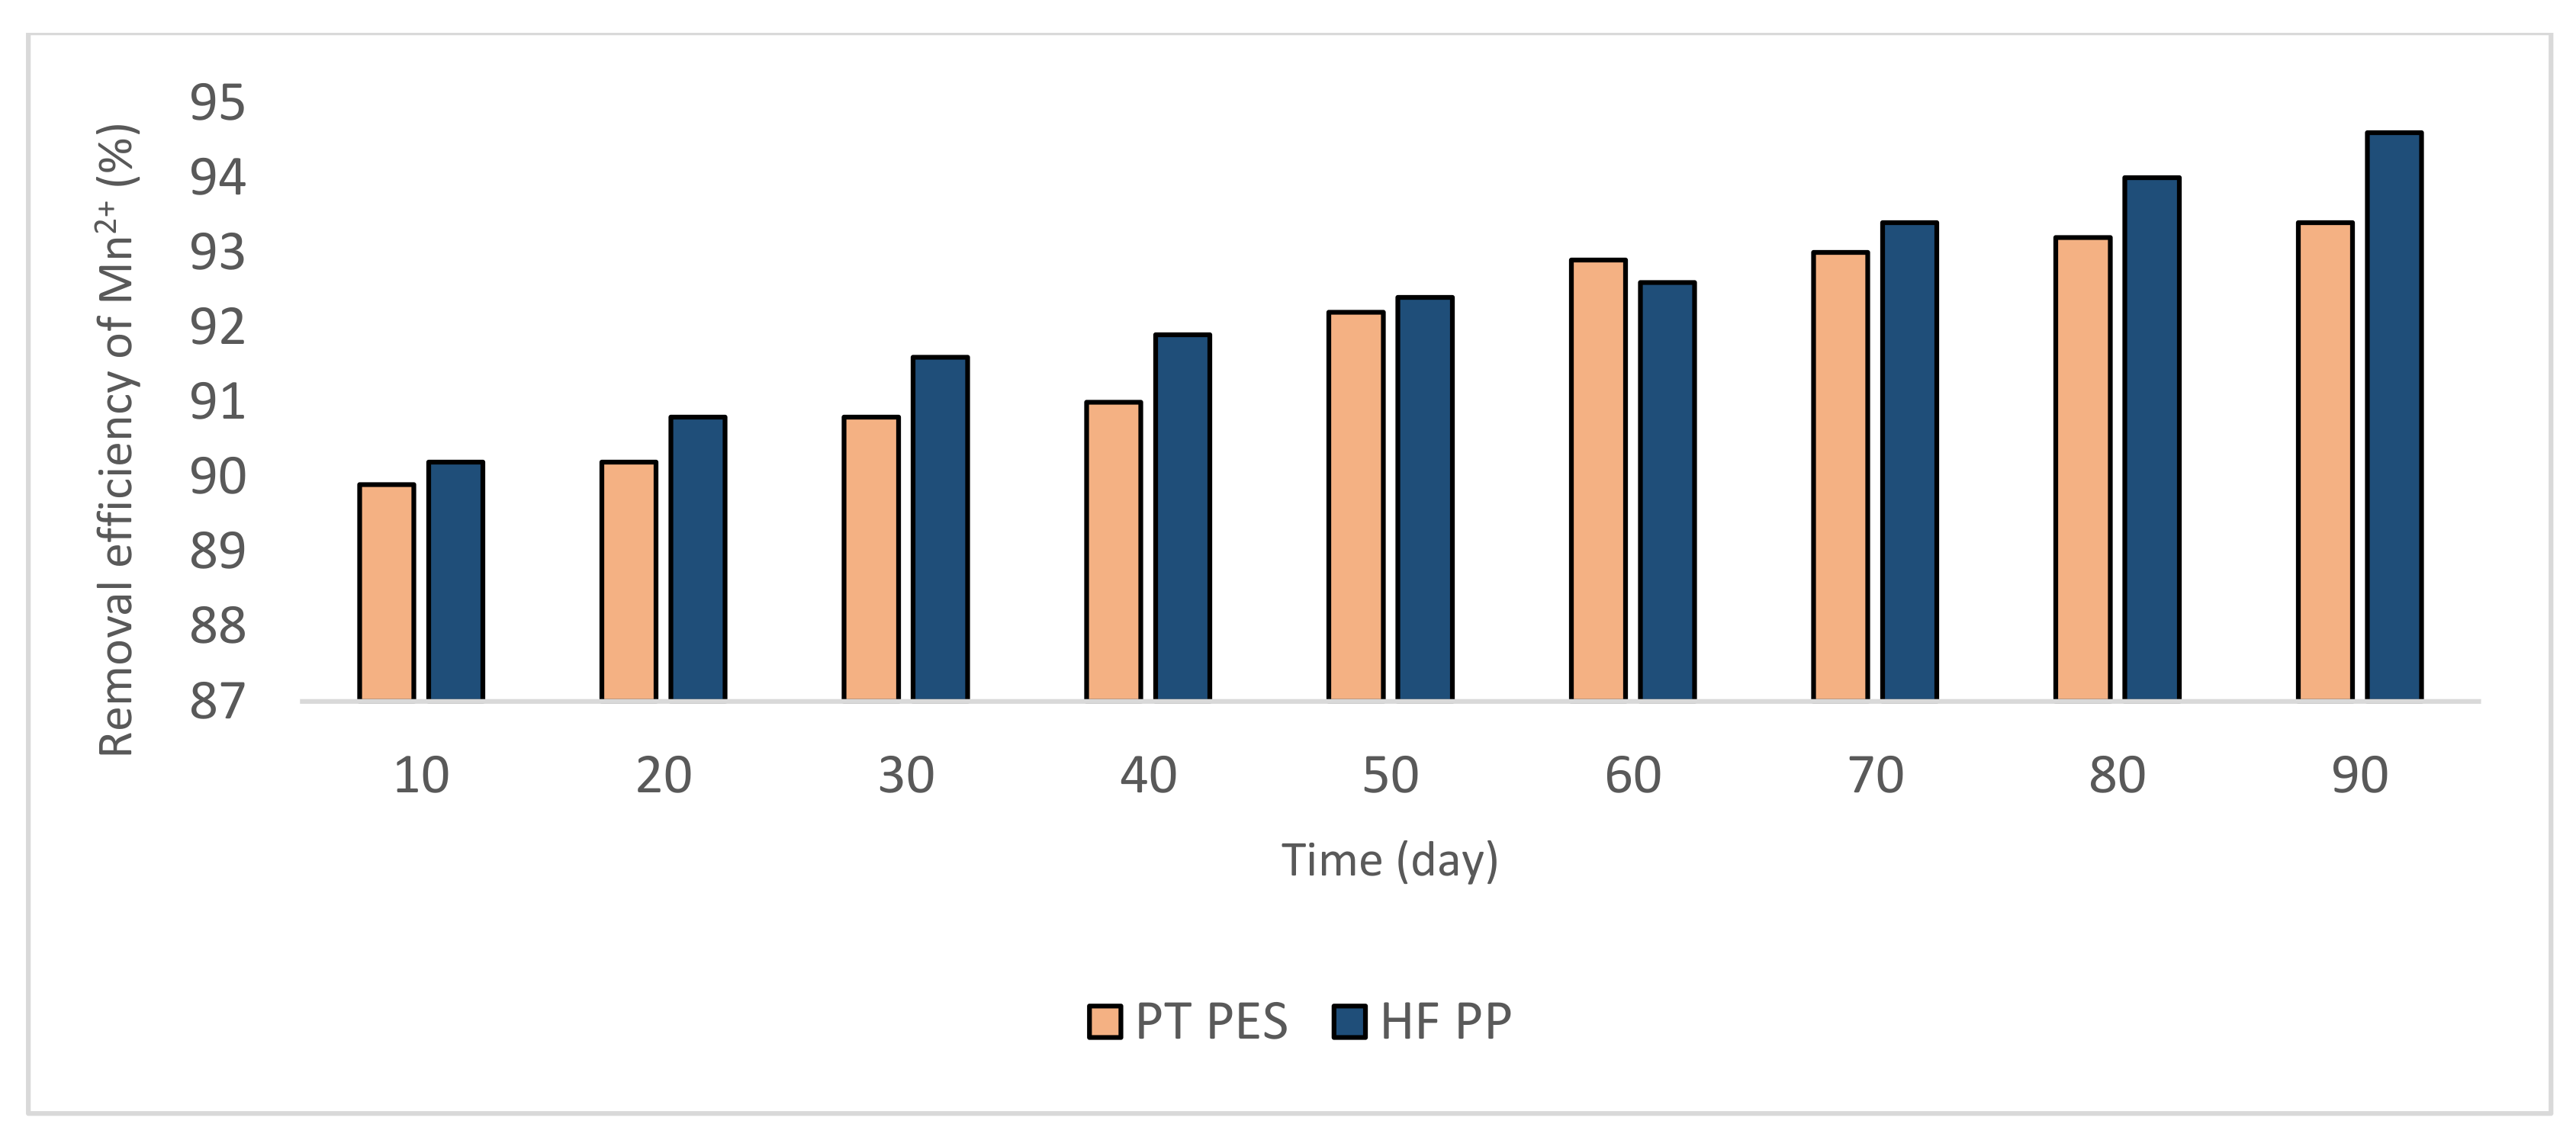
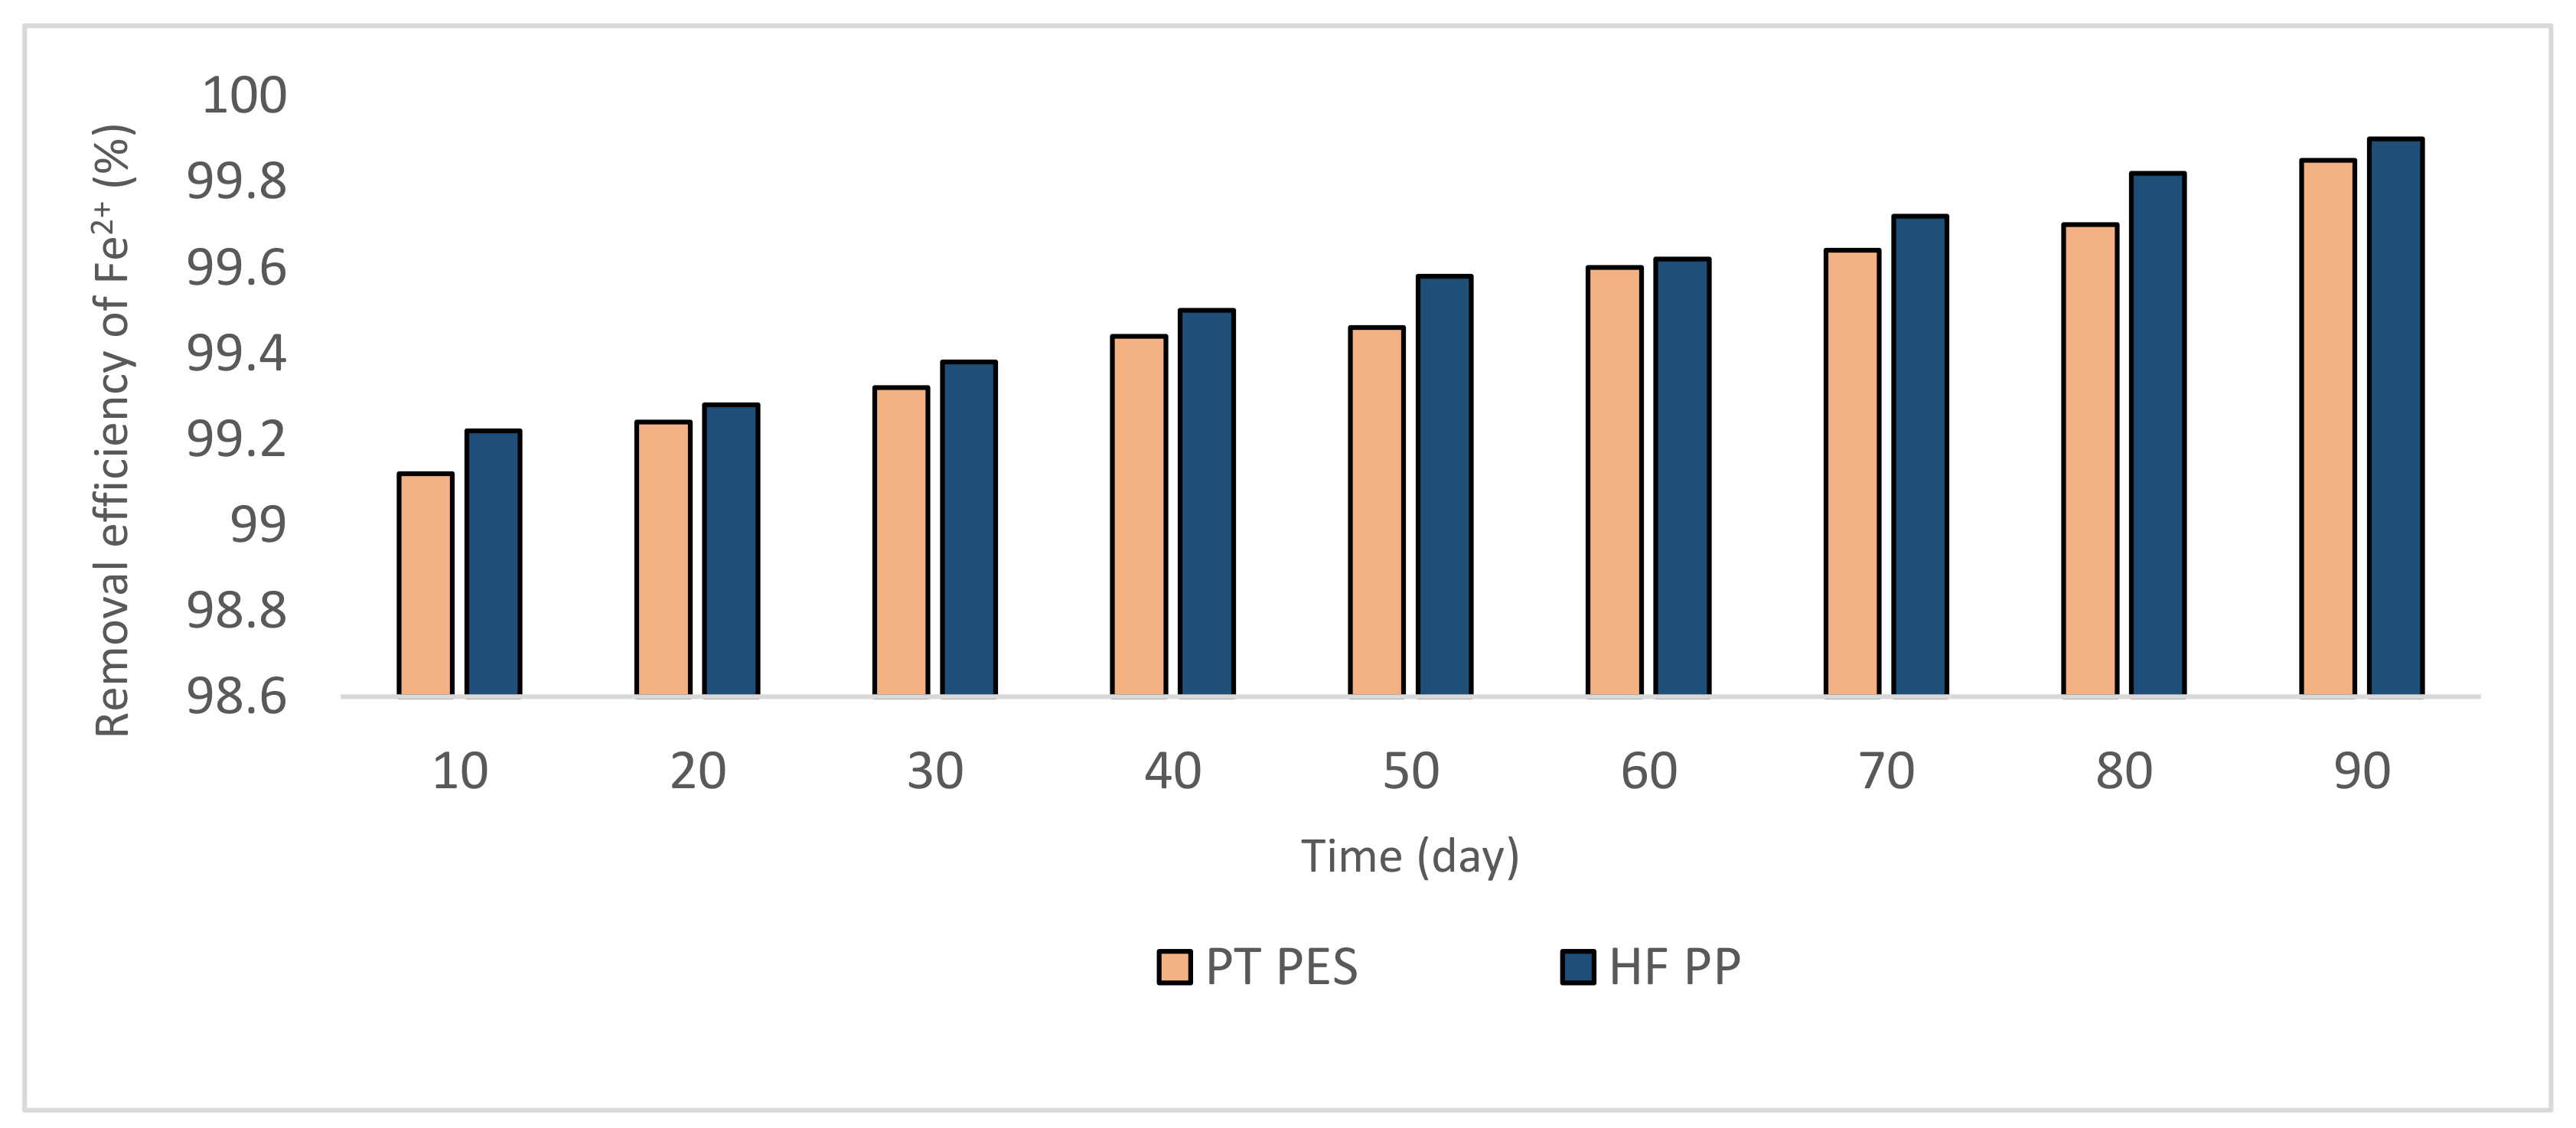
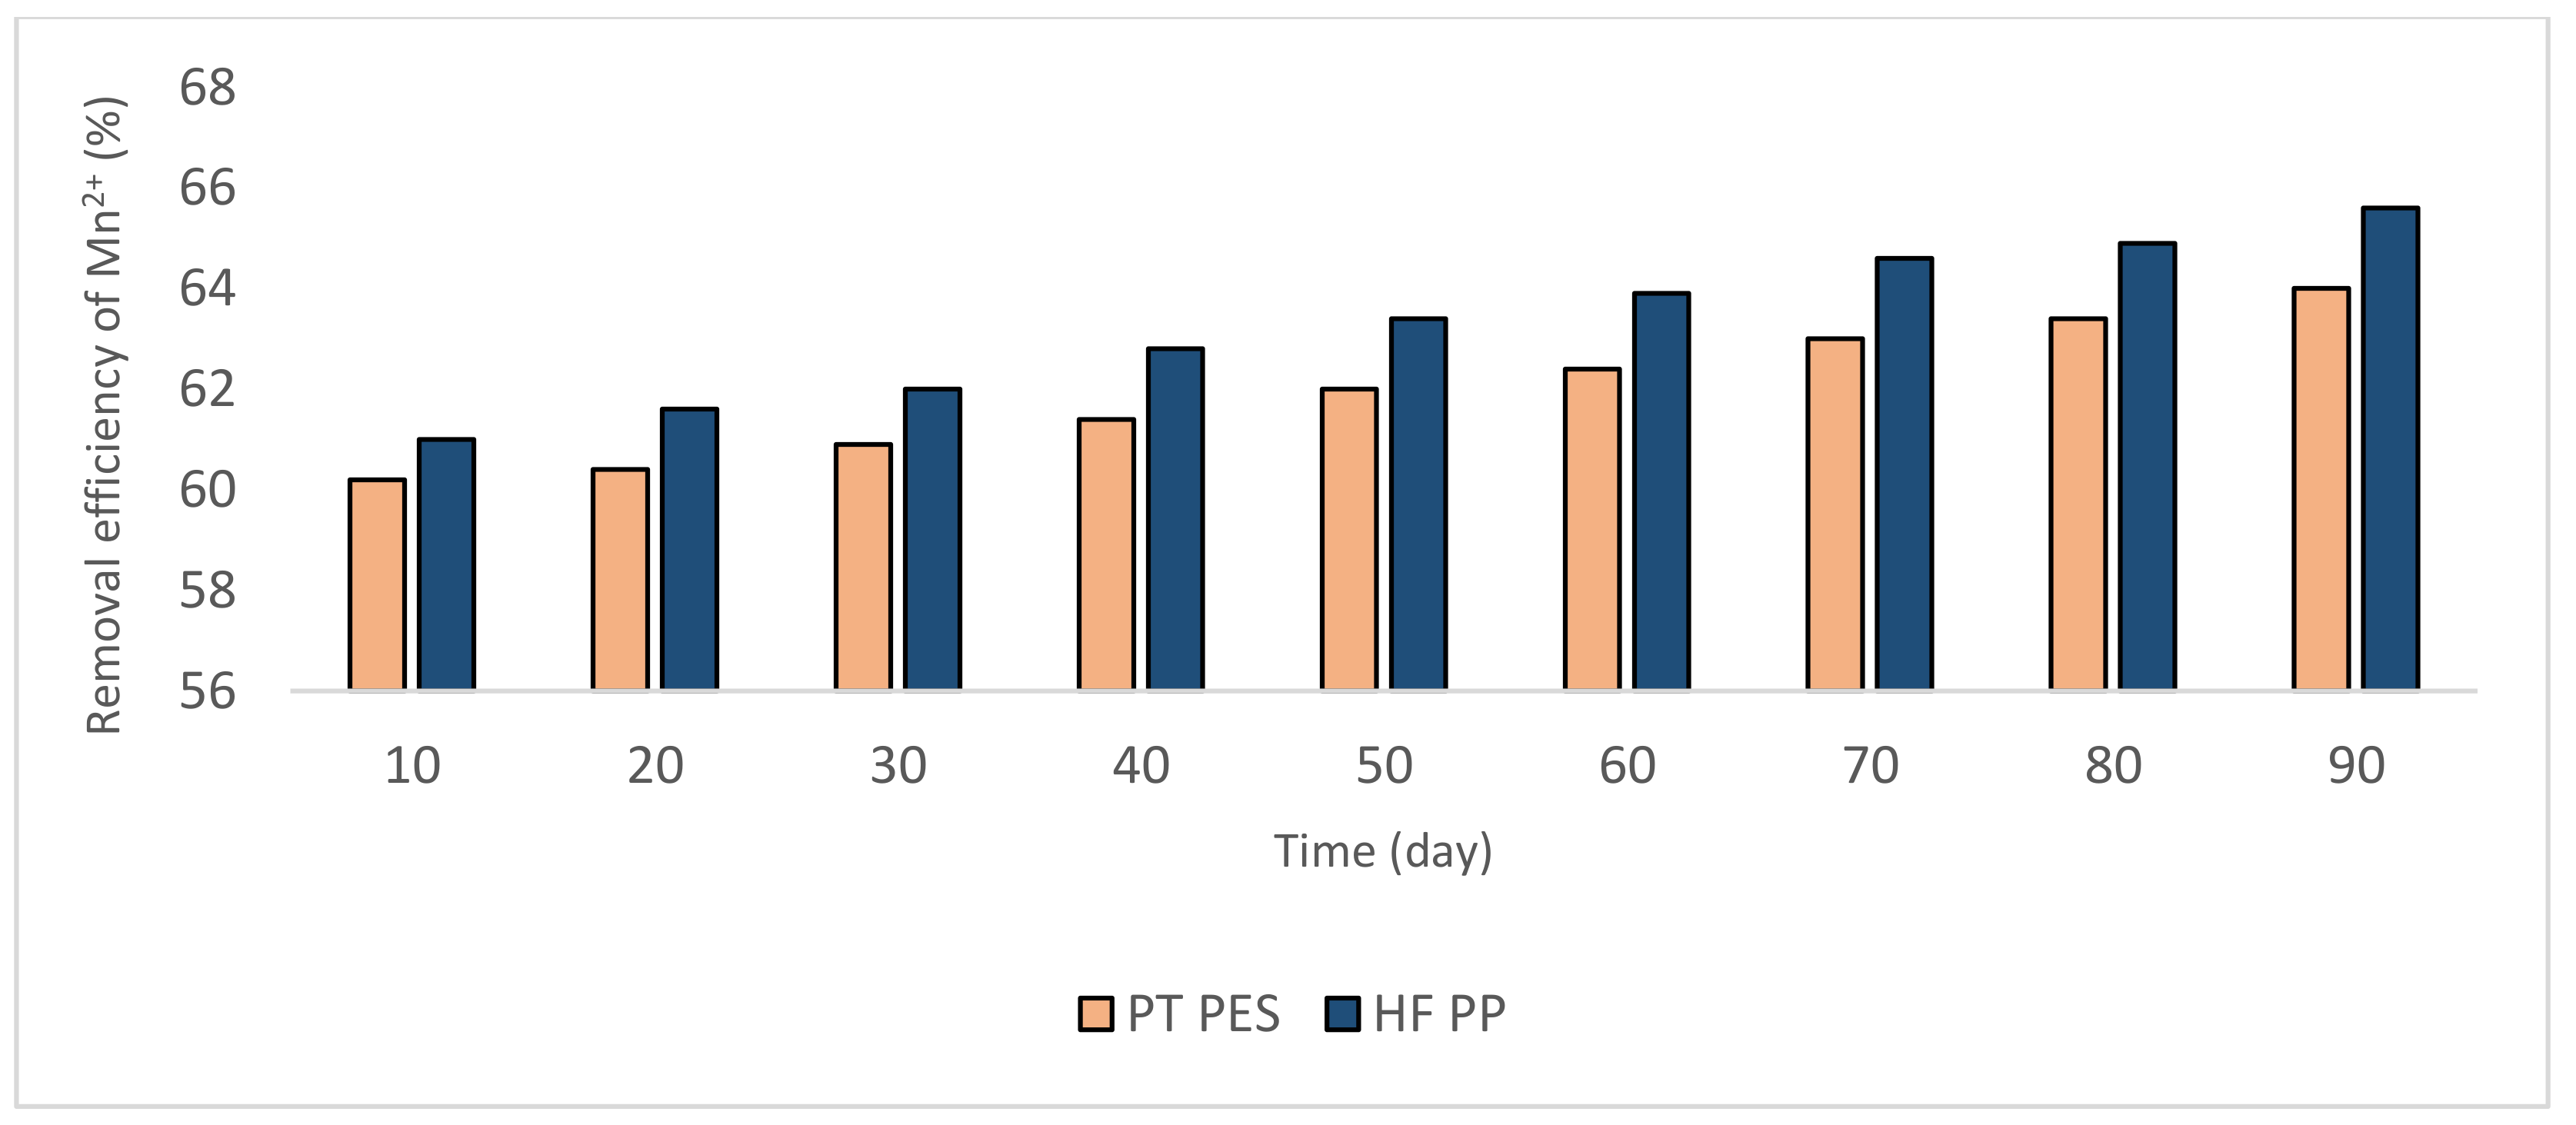
3.2.1. Removal of Fe2+ and Mn2+
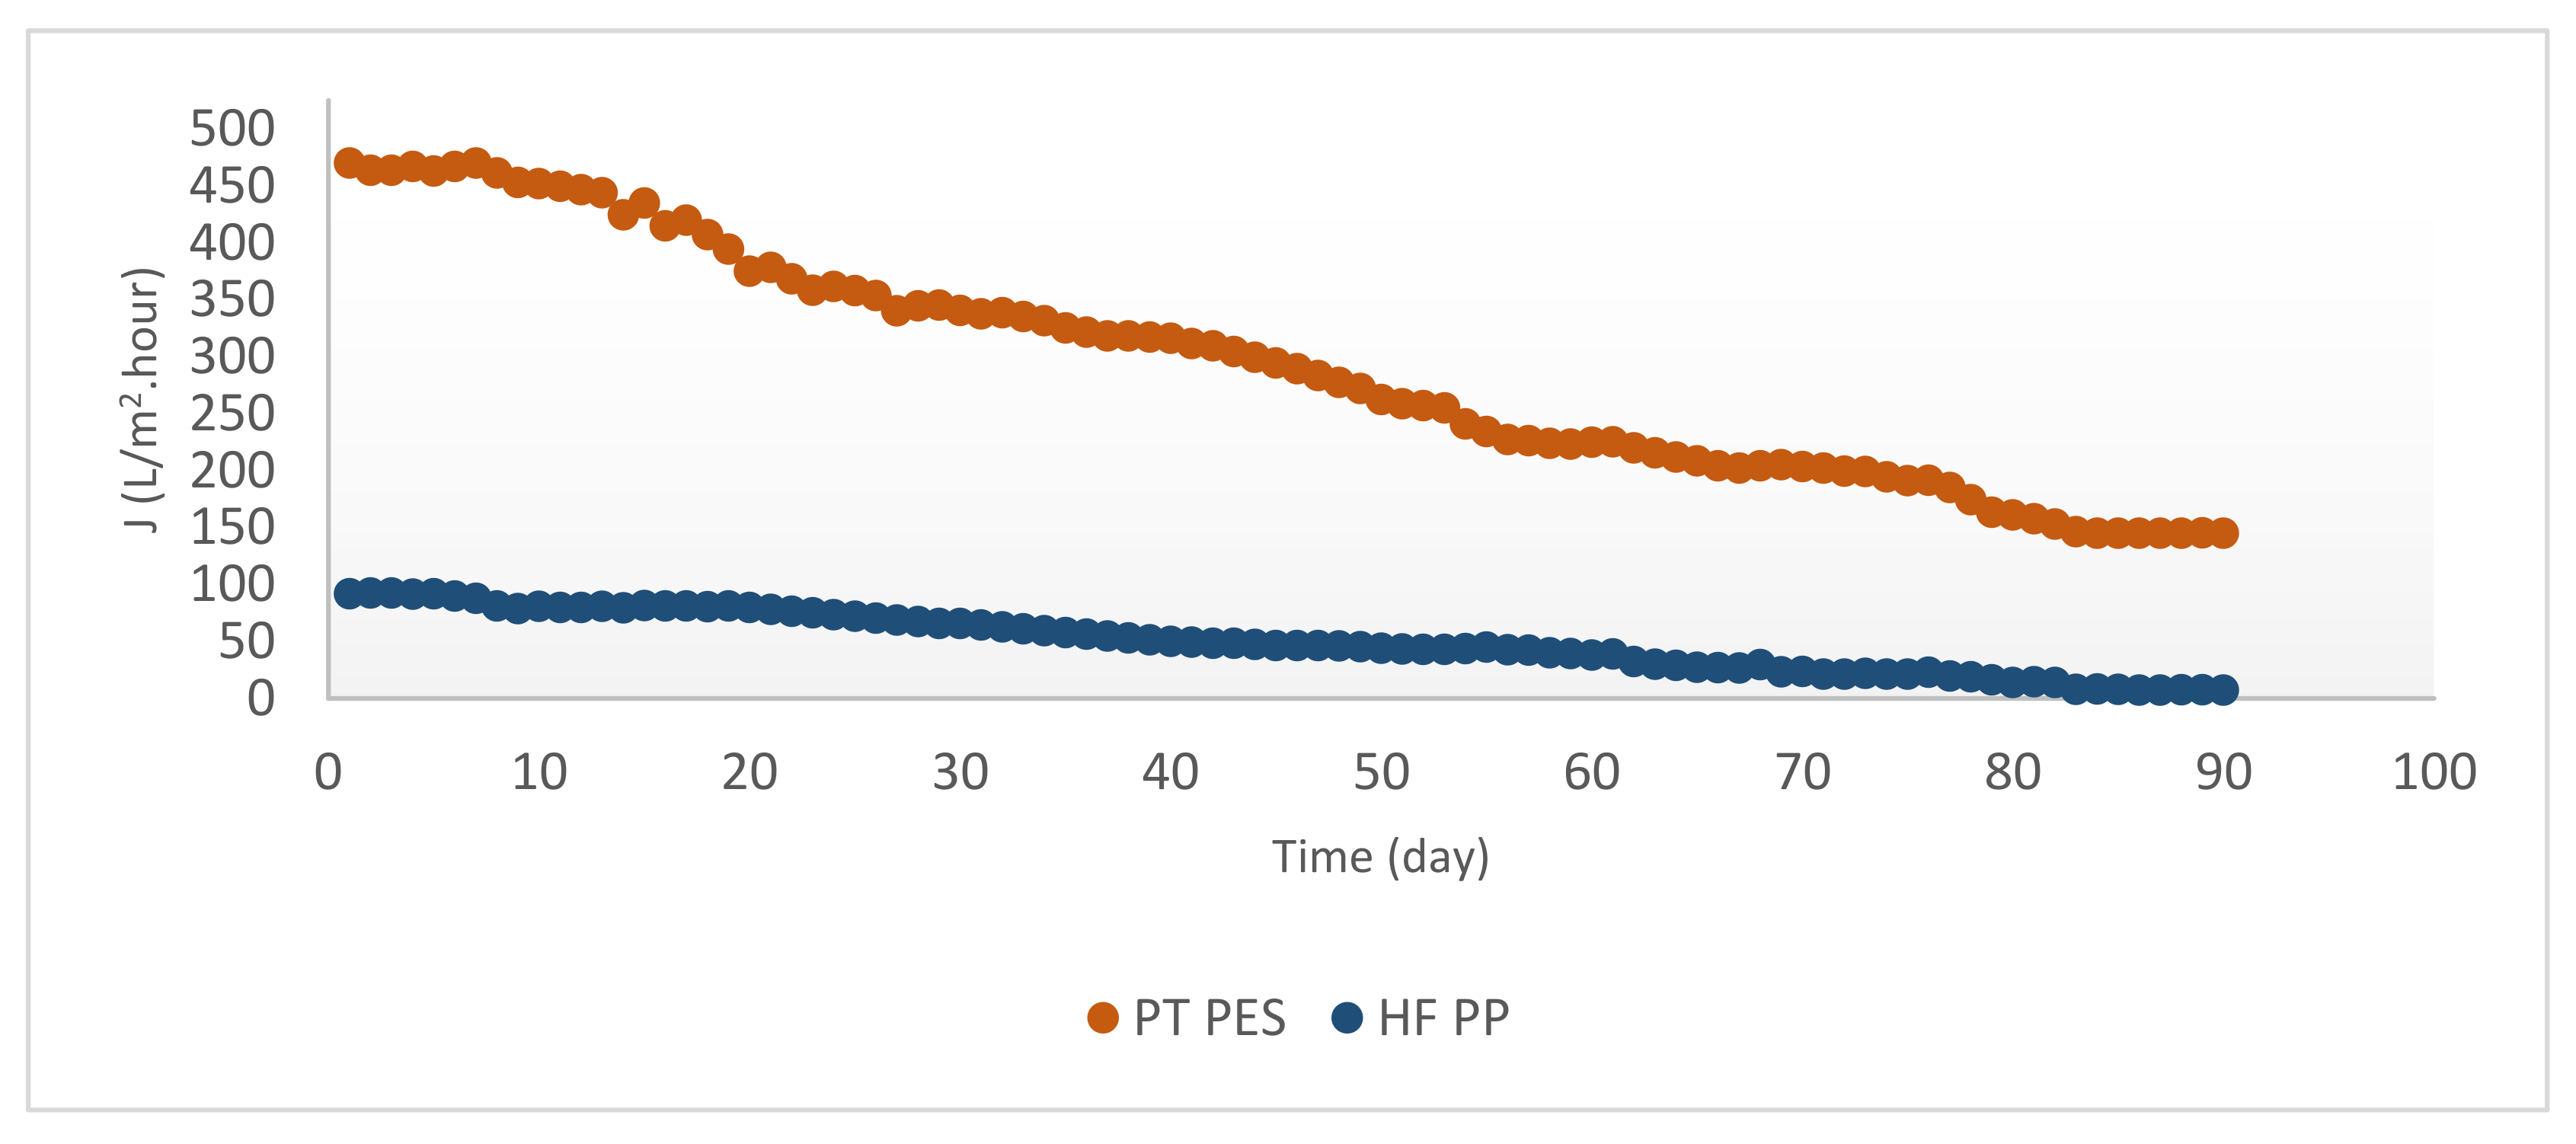
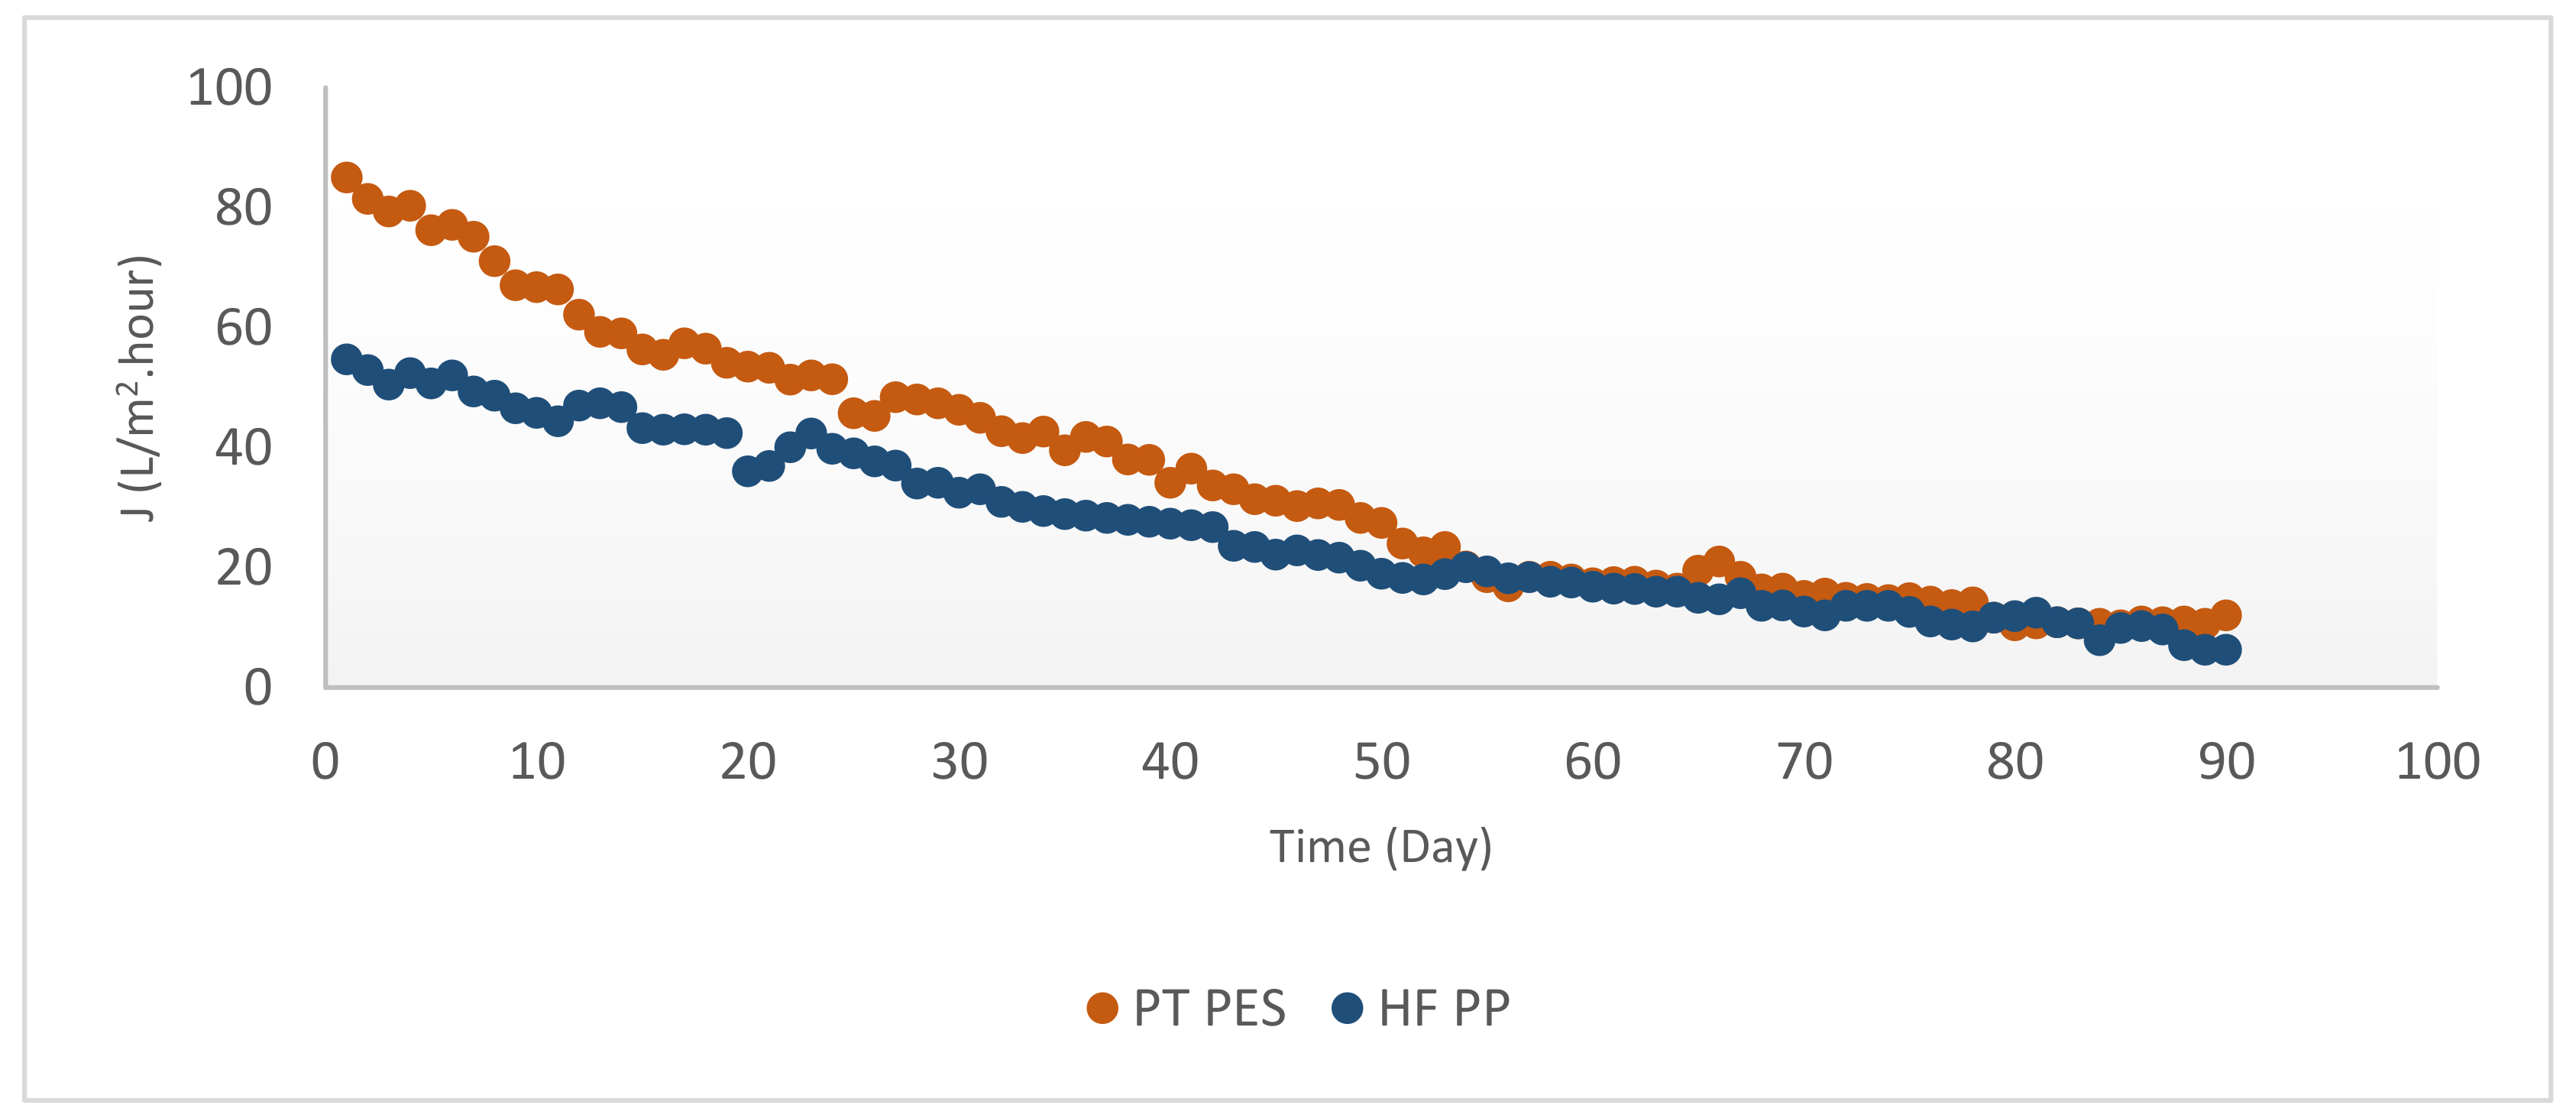
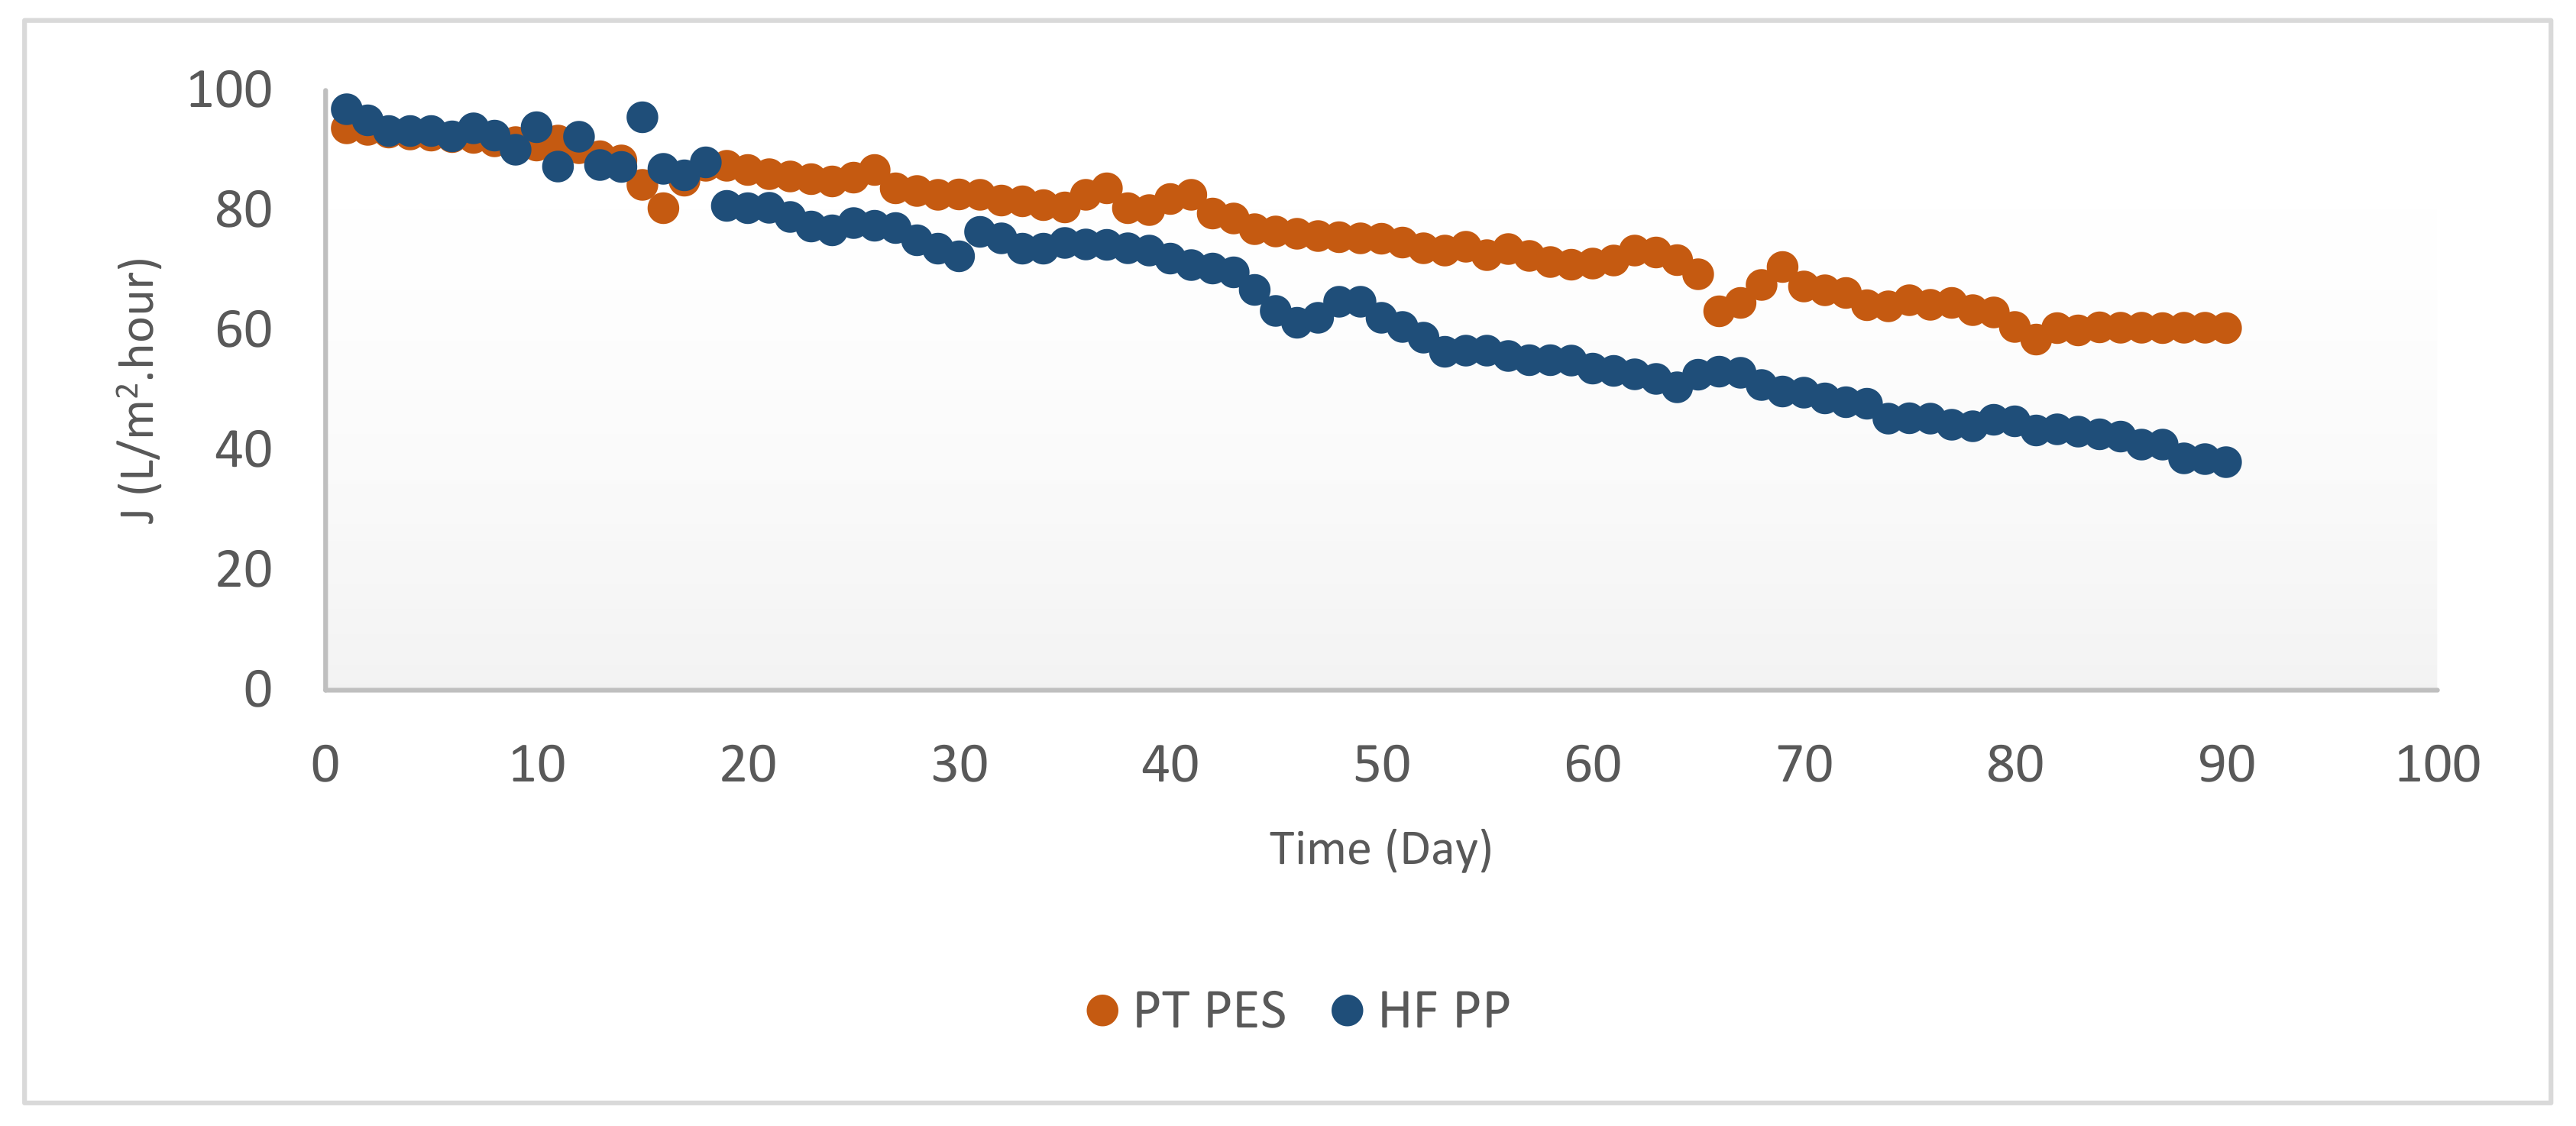
3.2.2. Membrane Flux
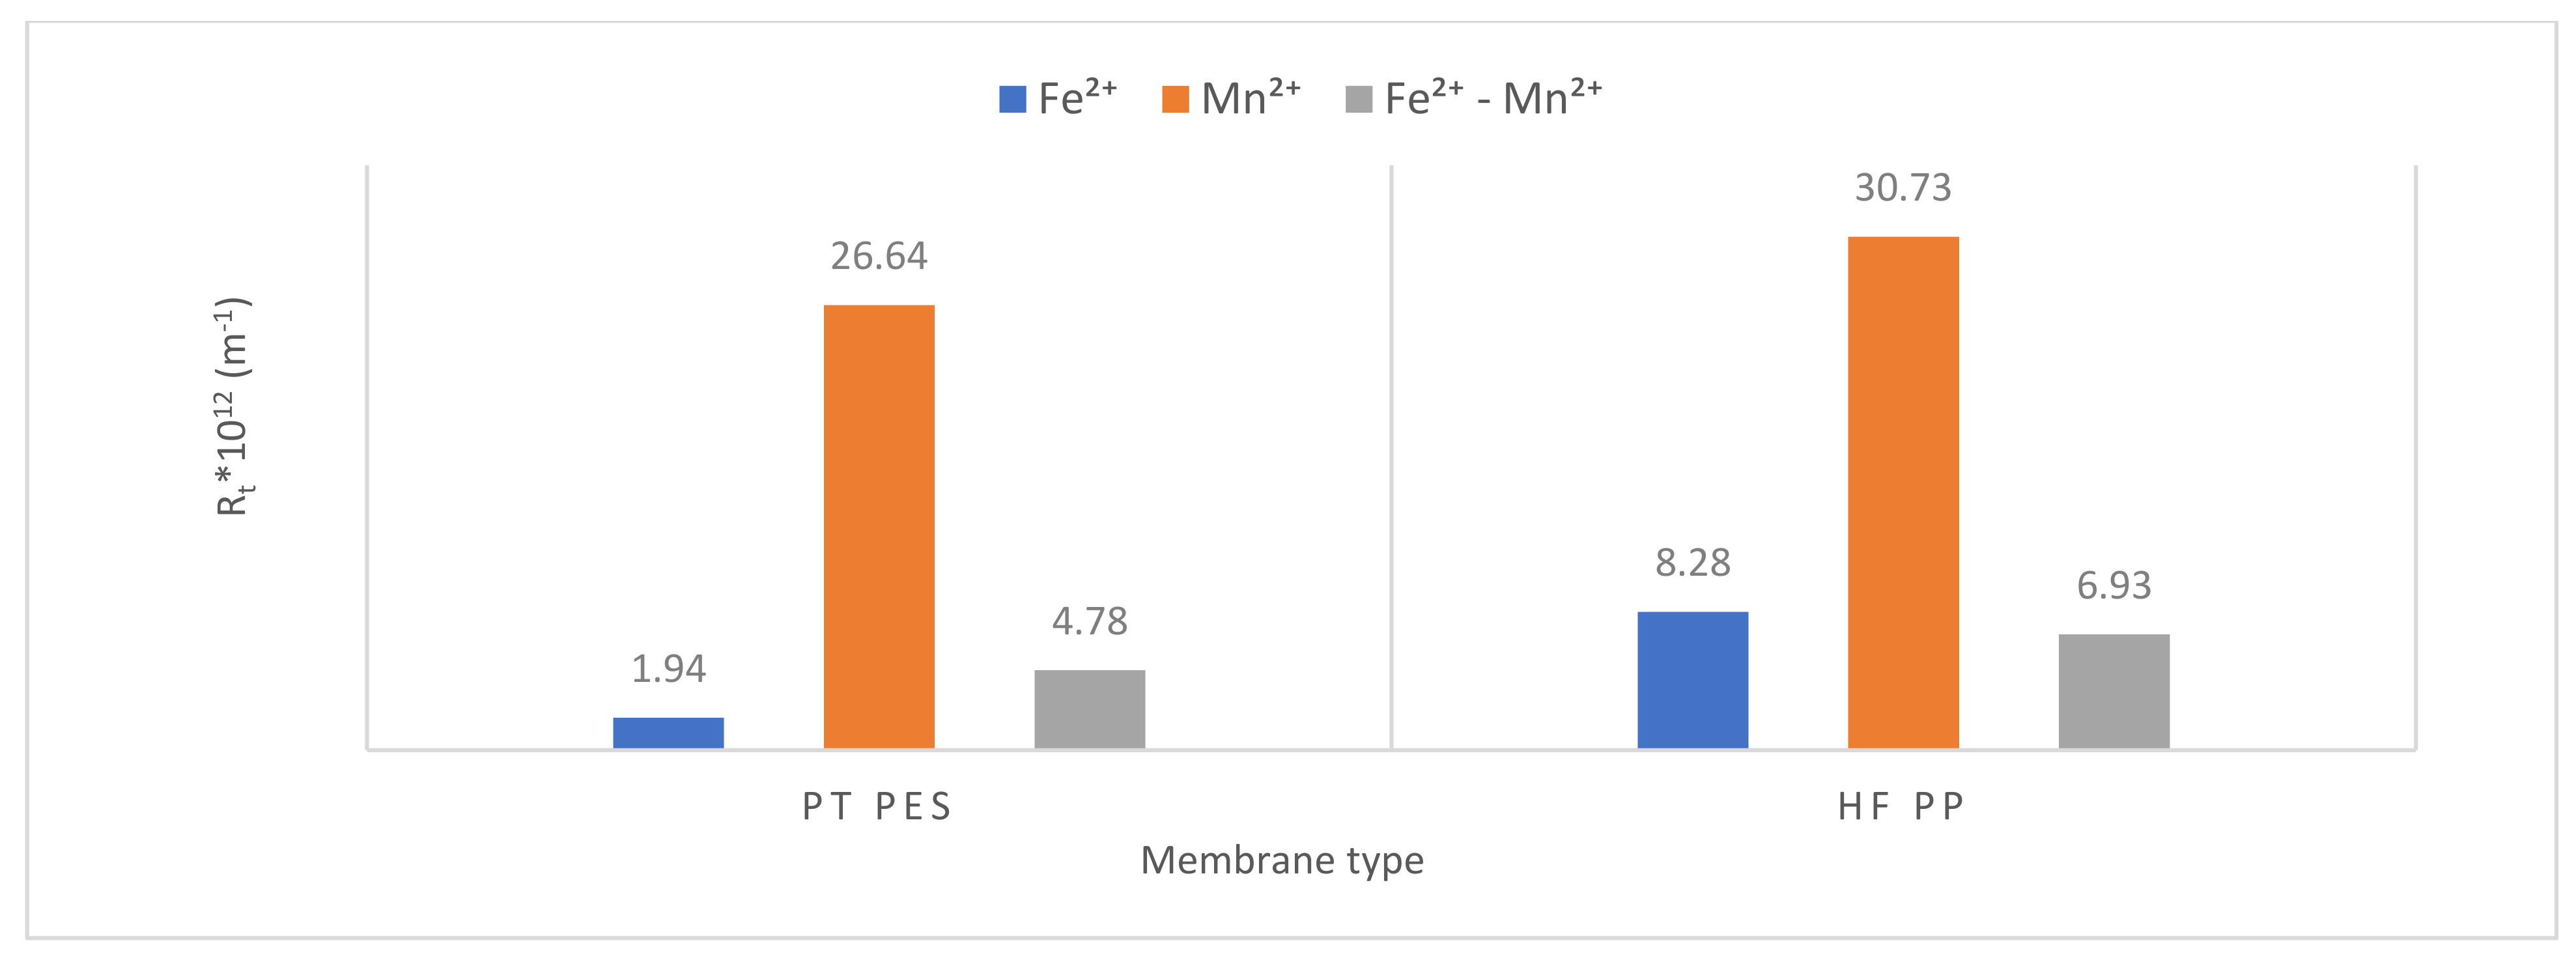
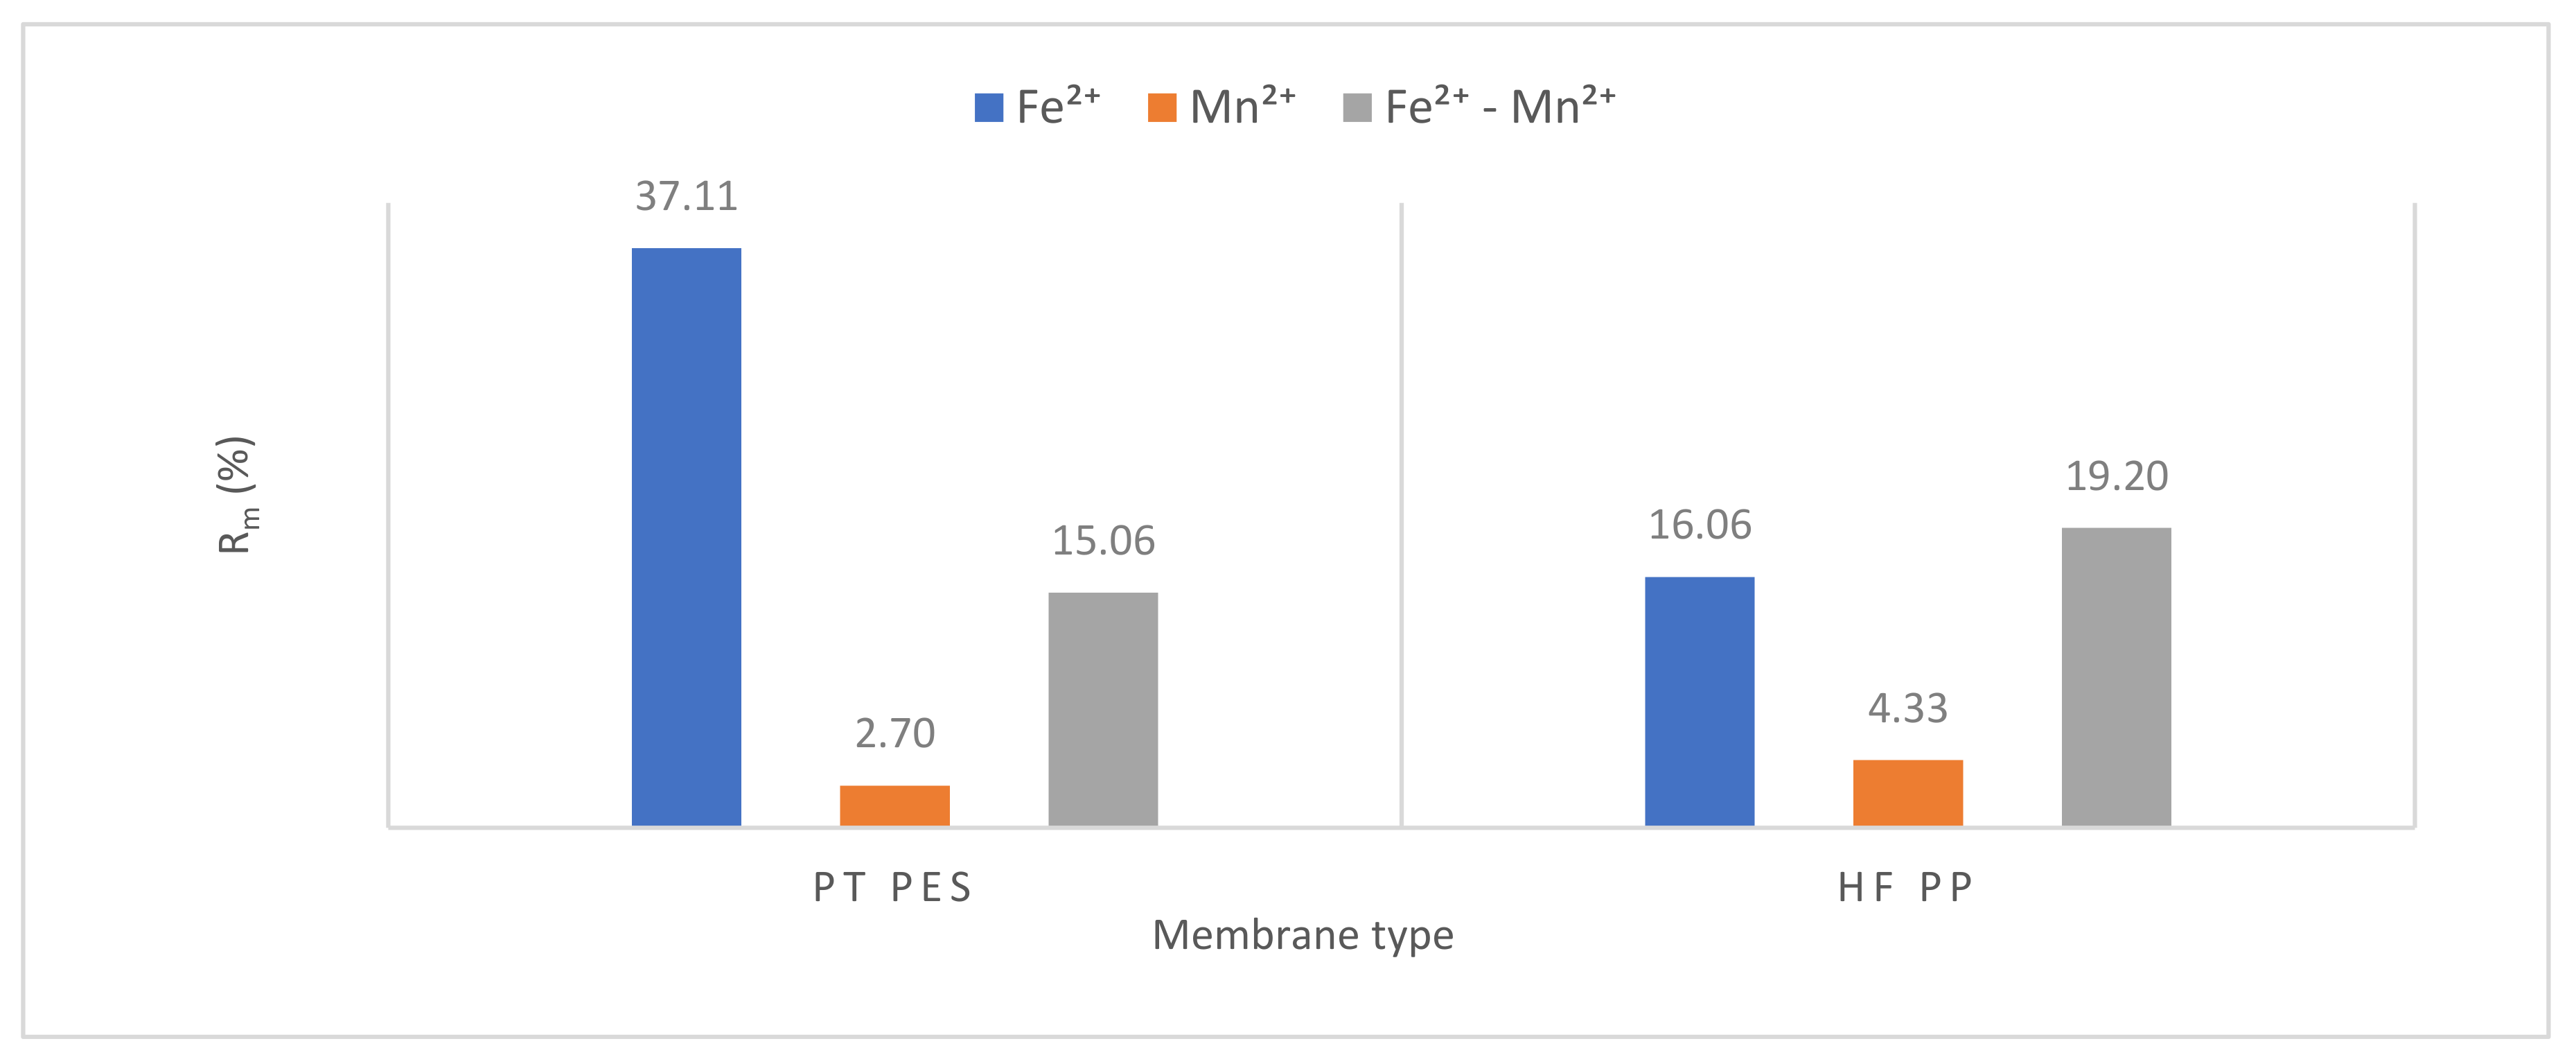
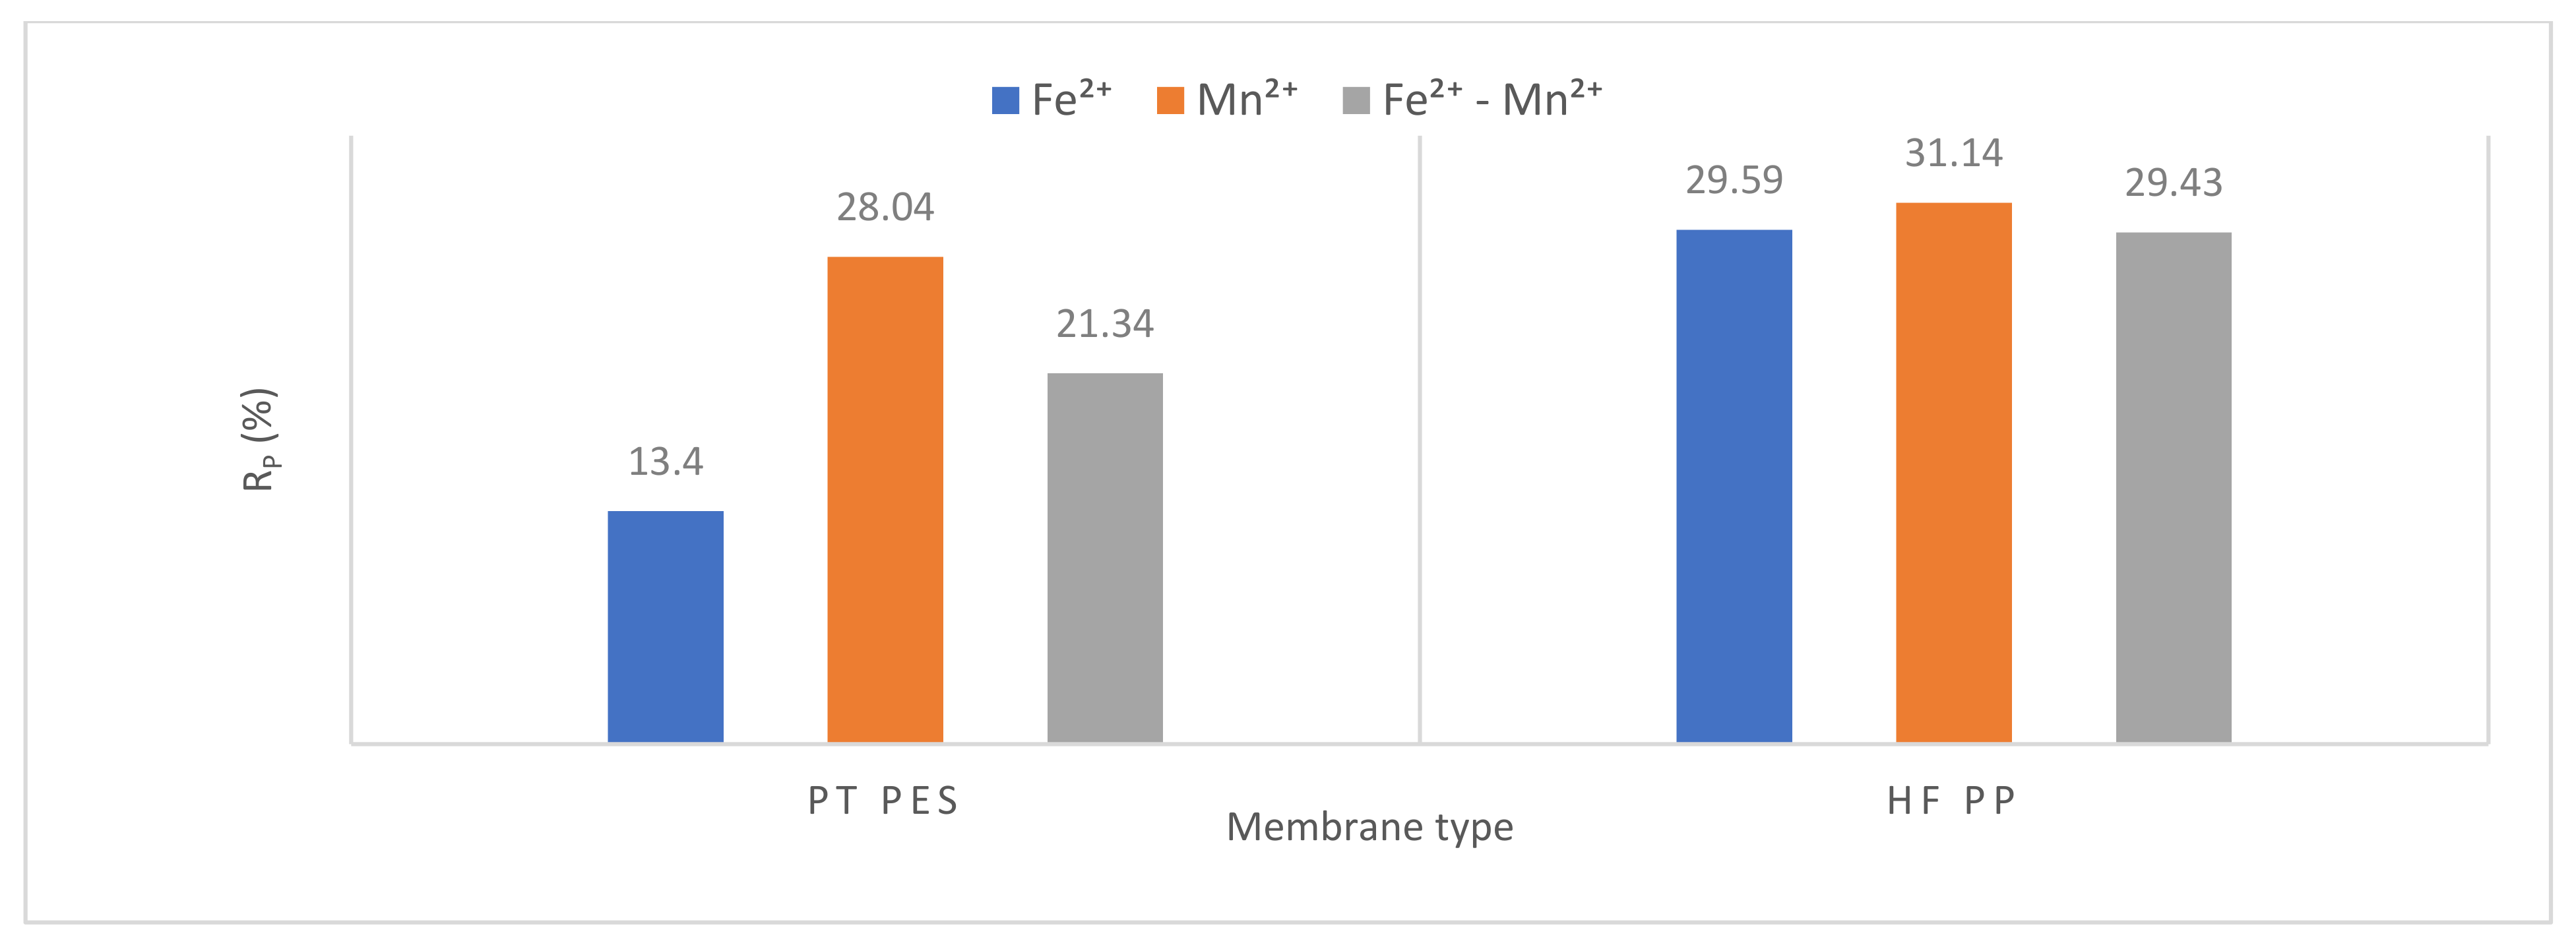
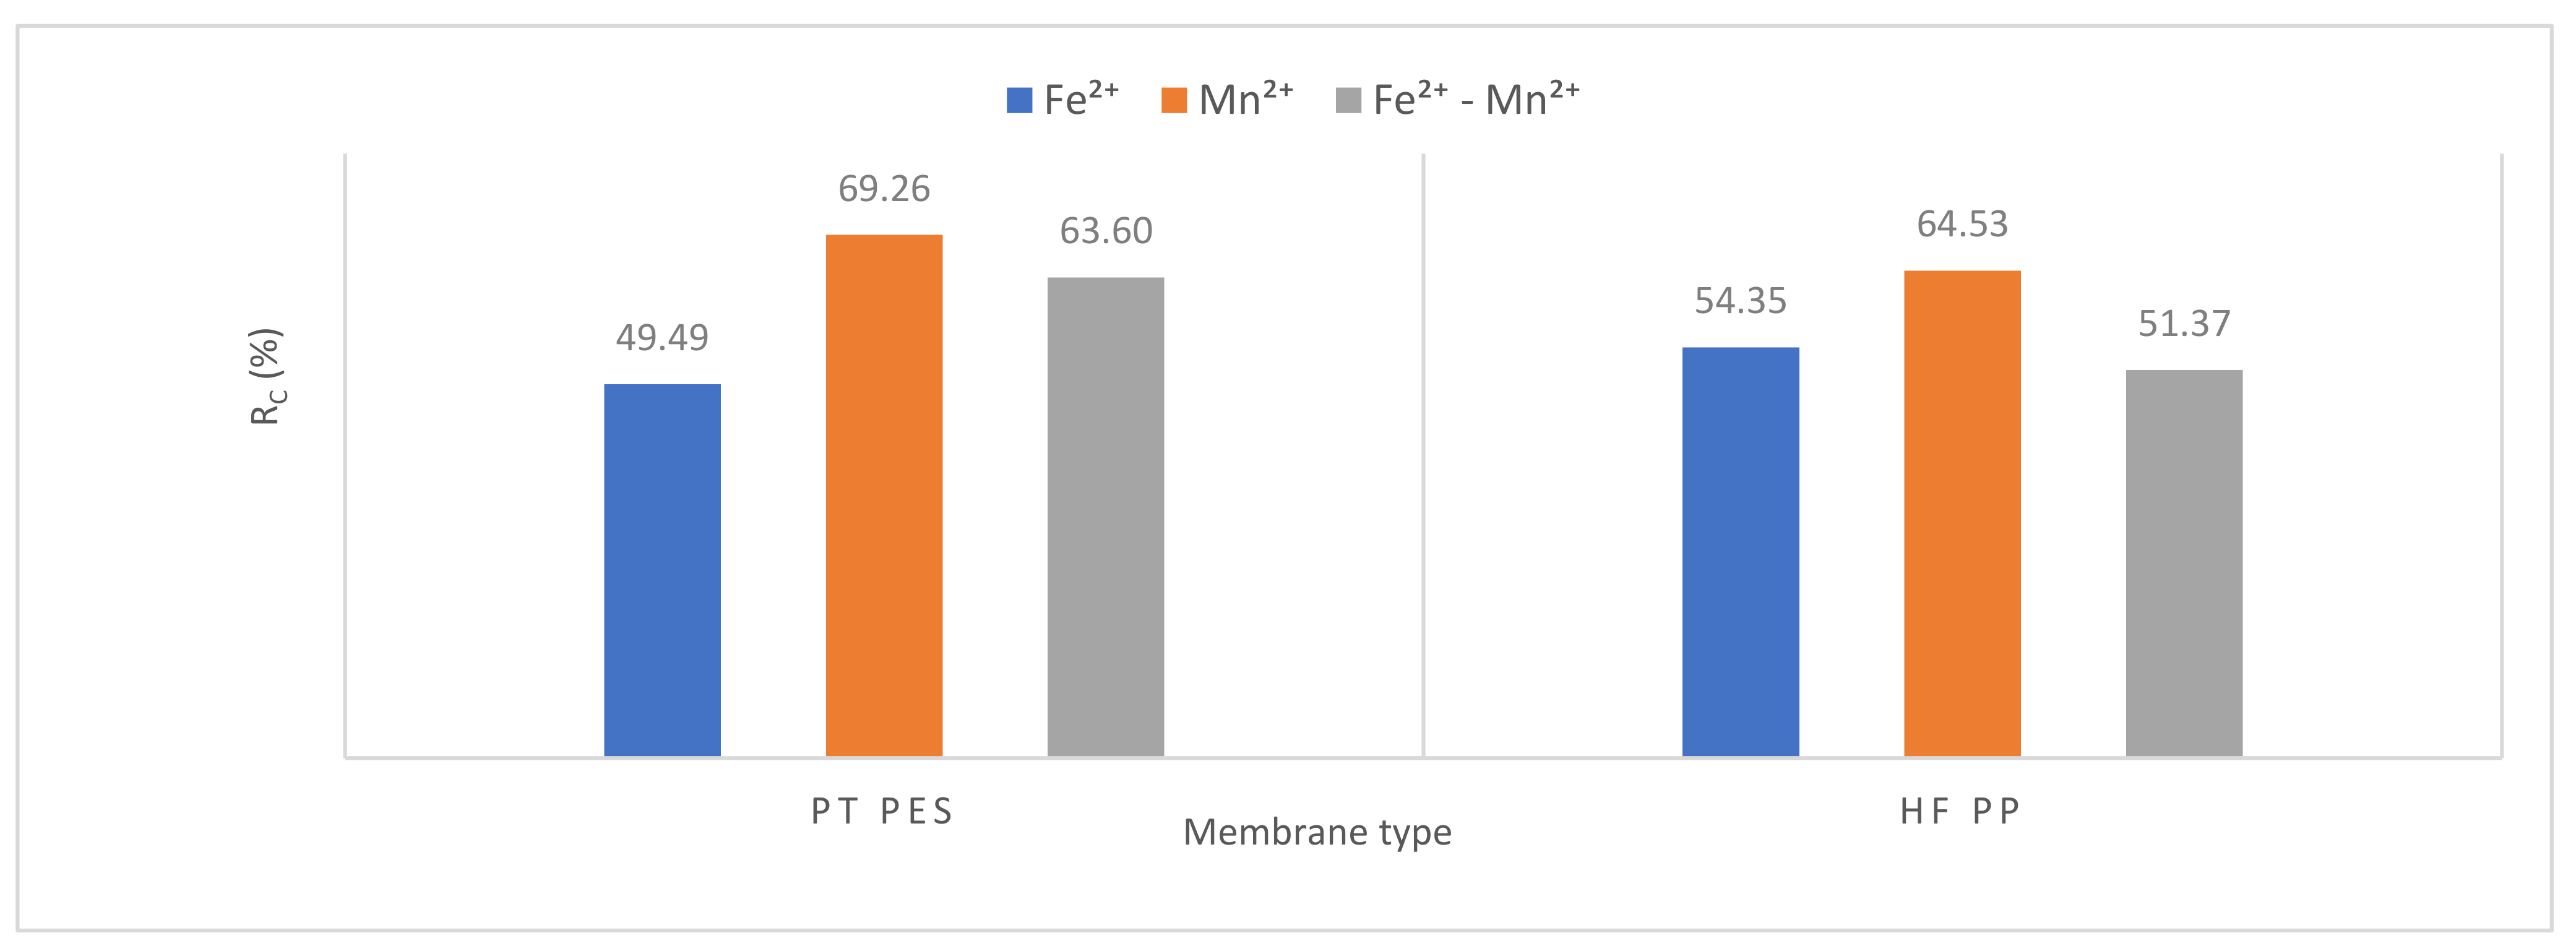
3.2.3. Membrane Resistance
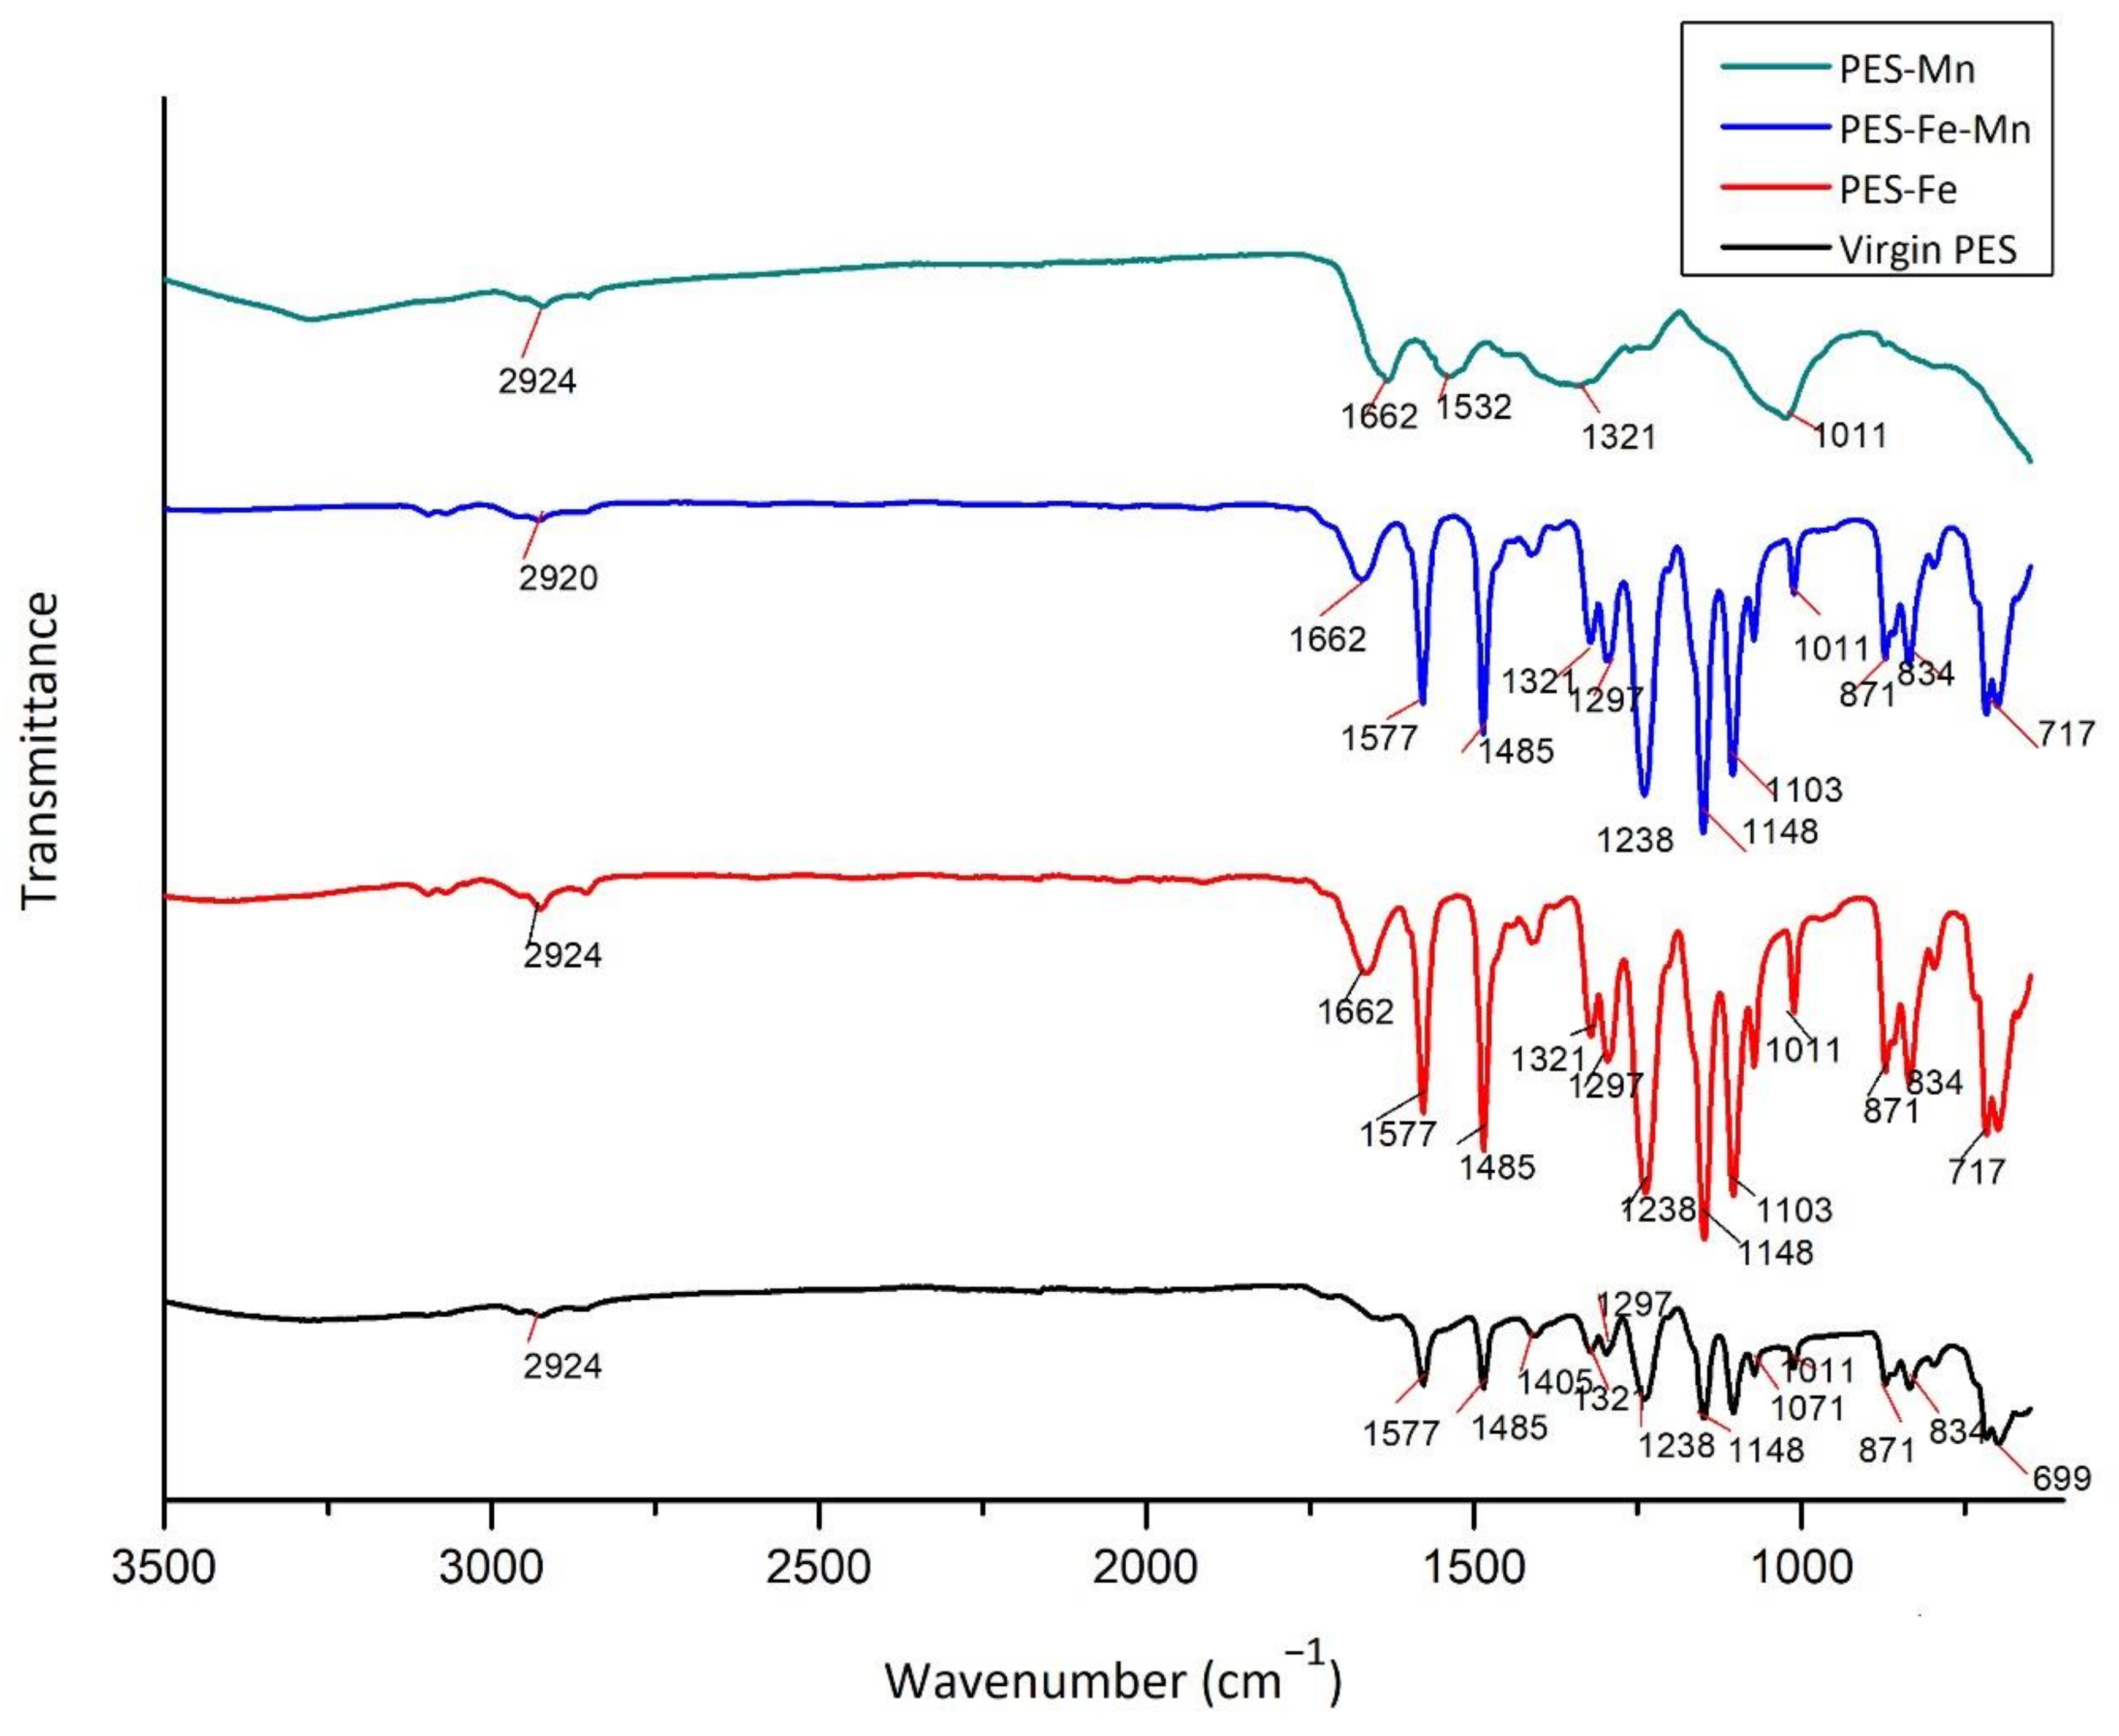
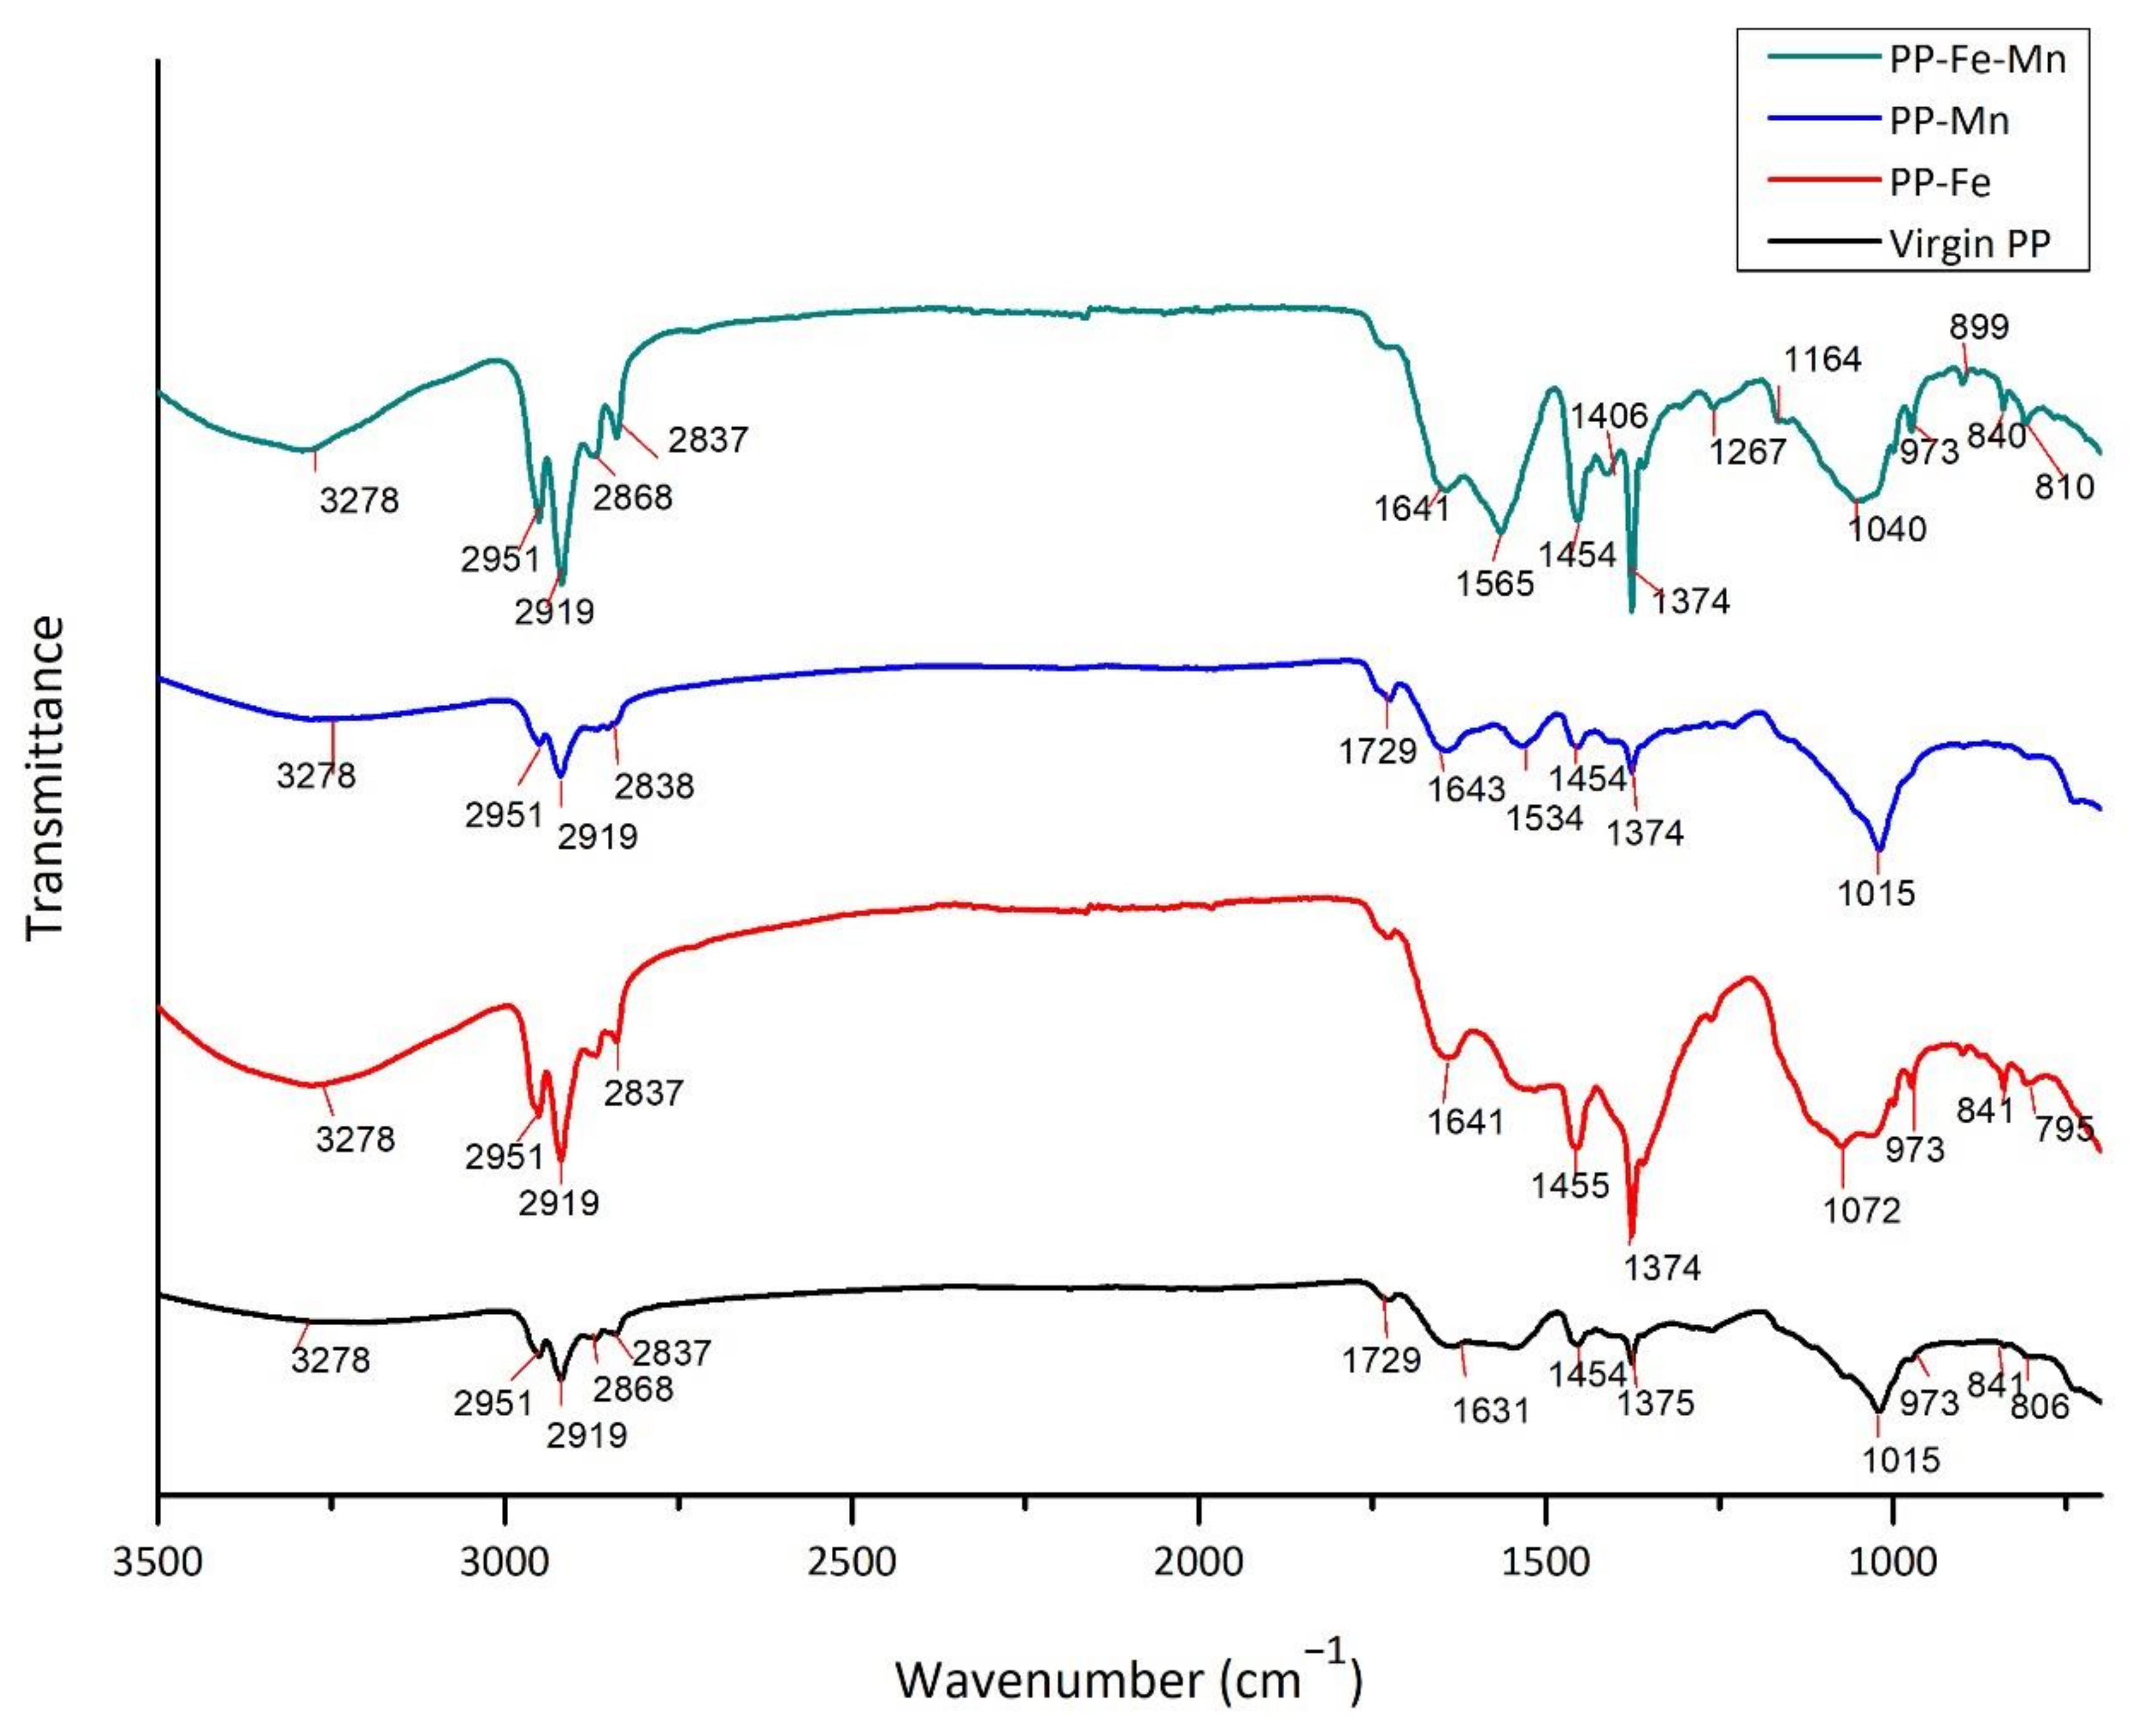
3.3. FT/IR Analysis
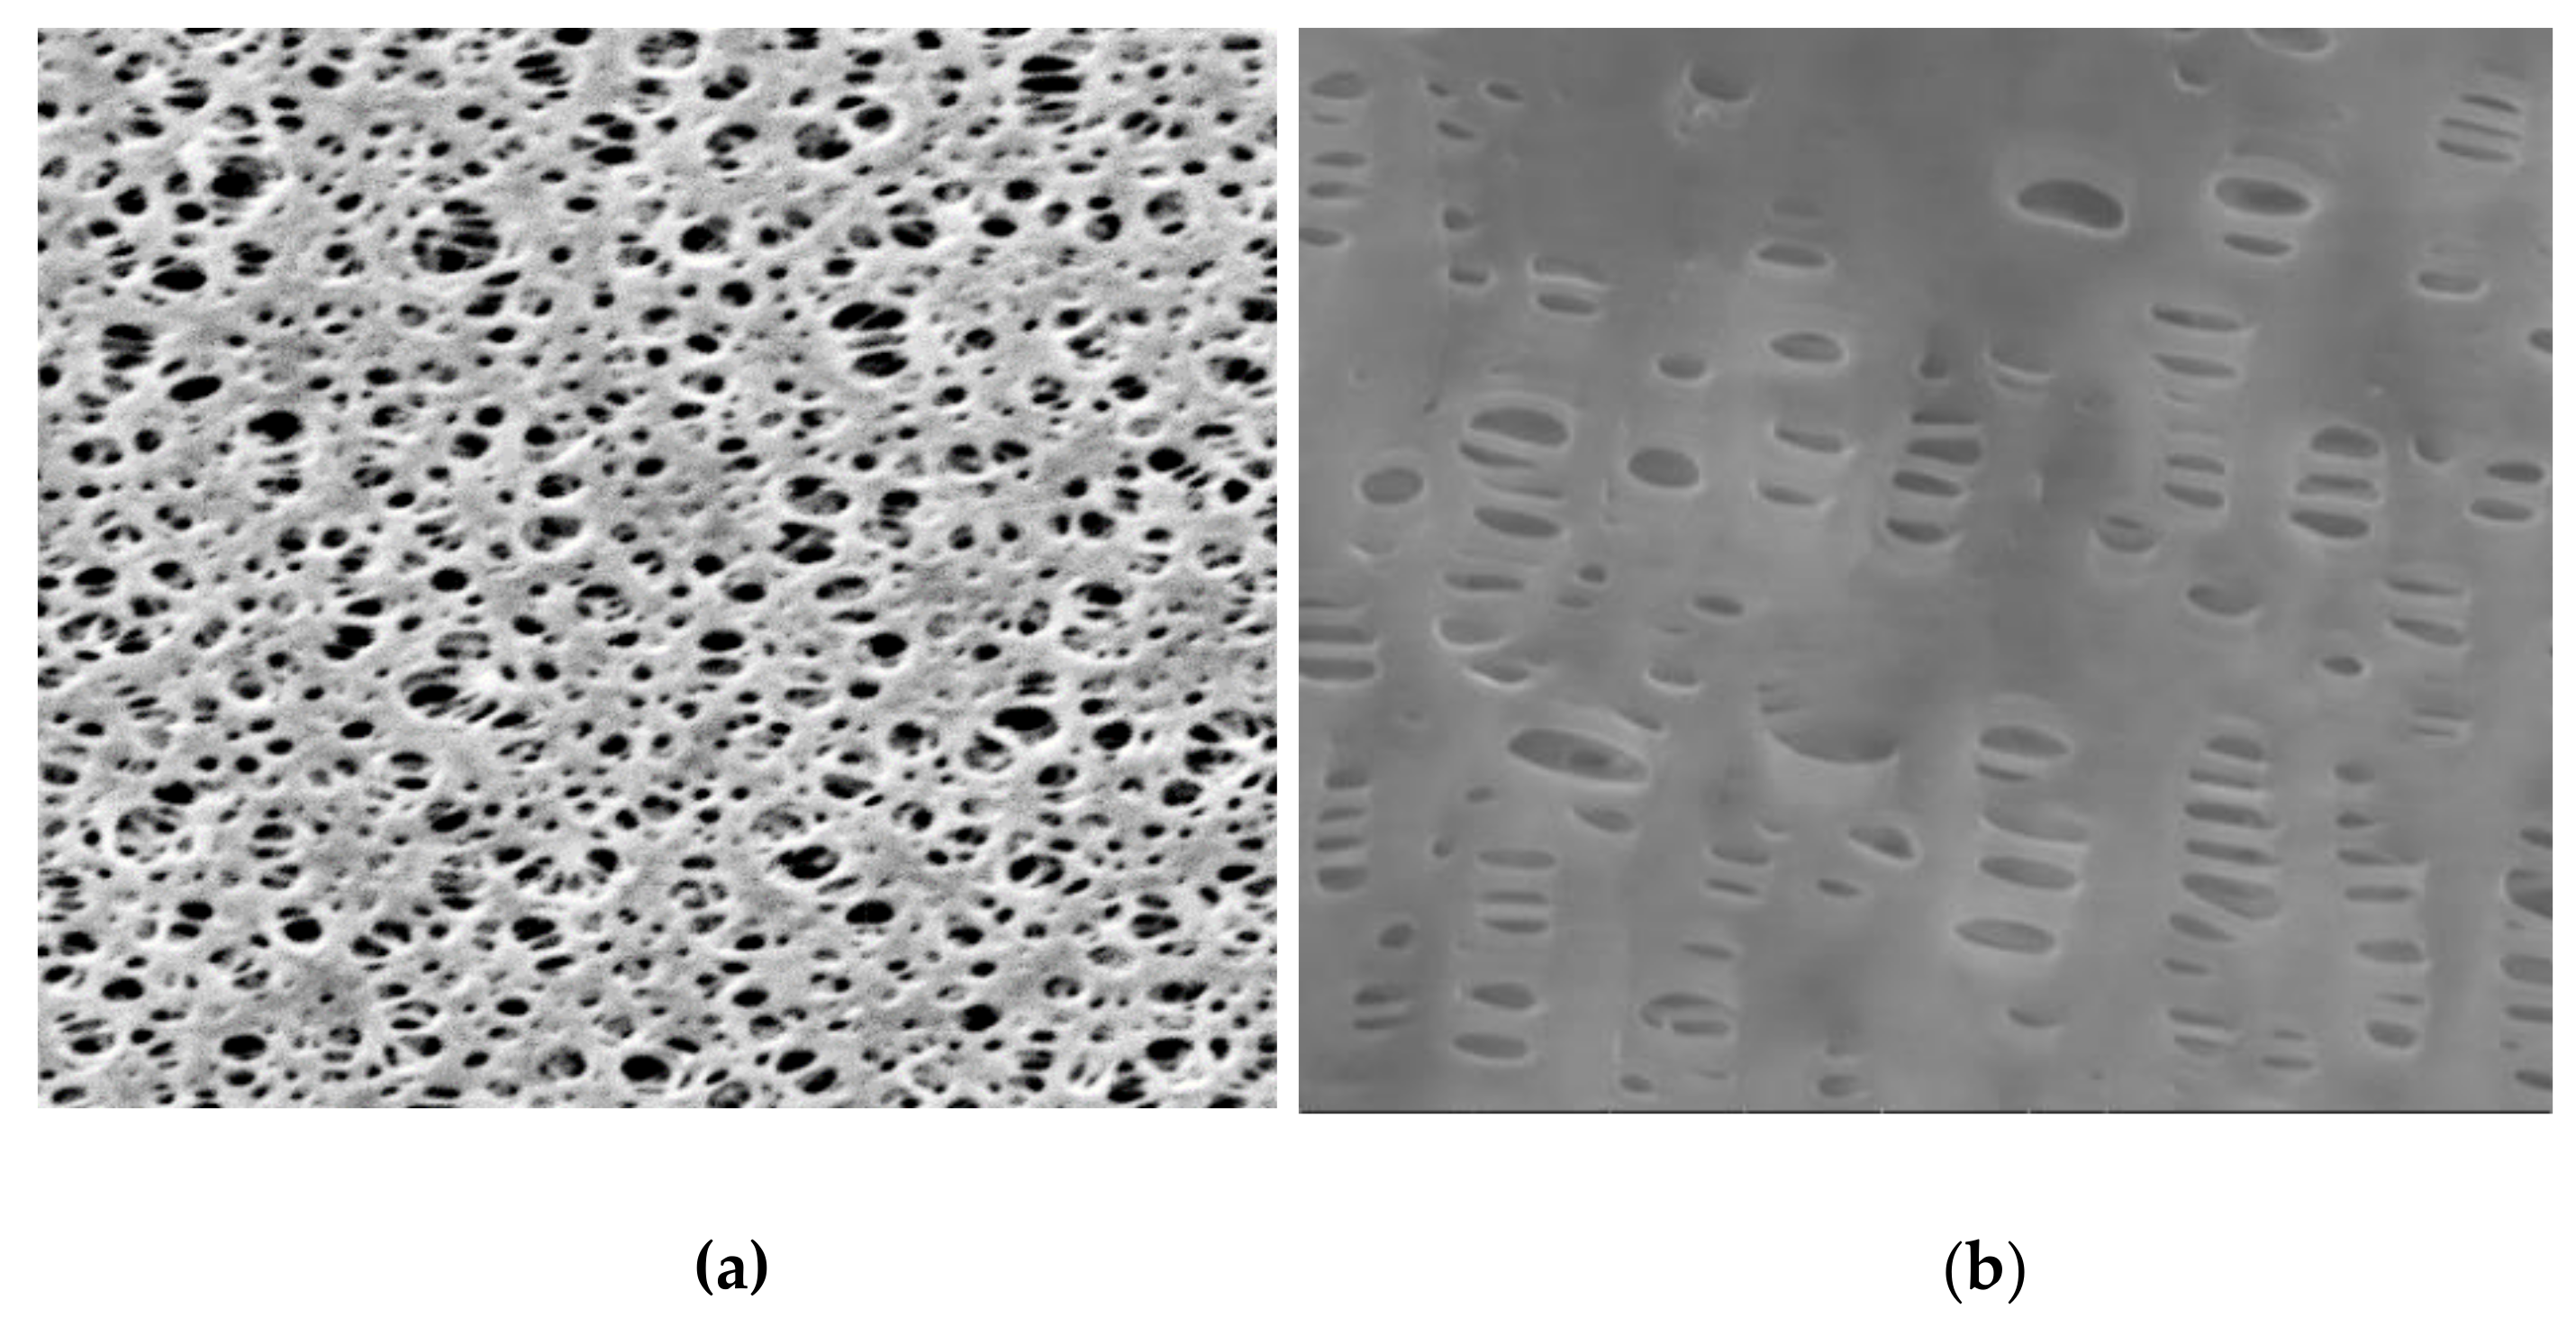
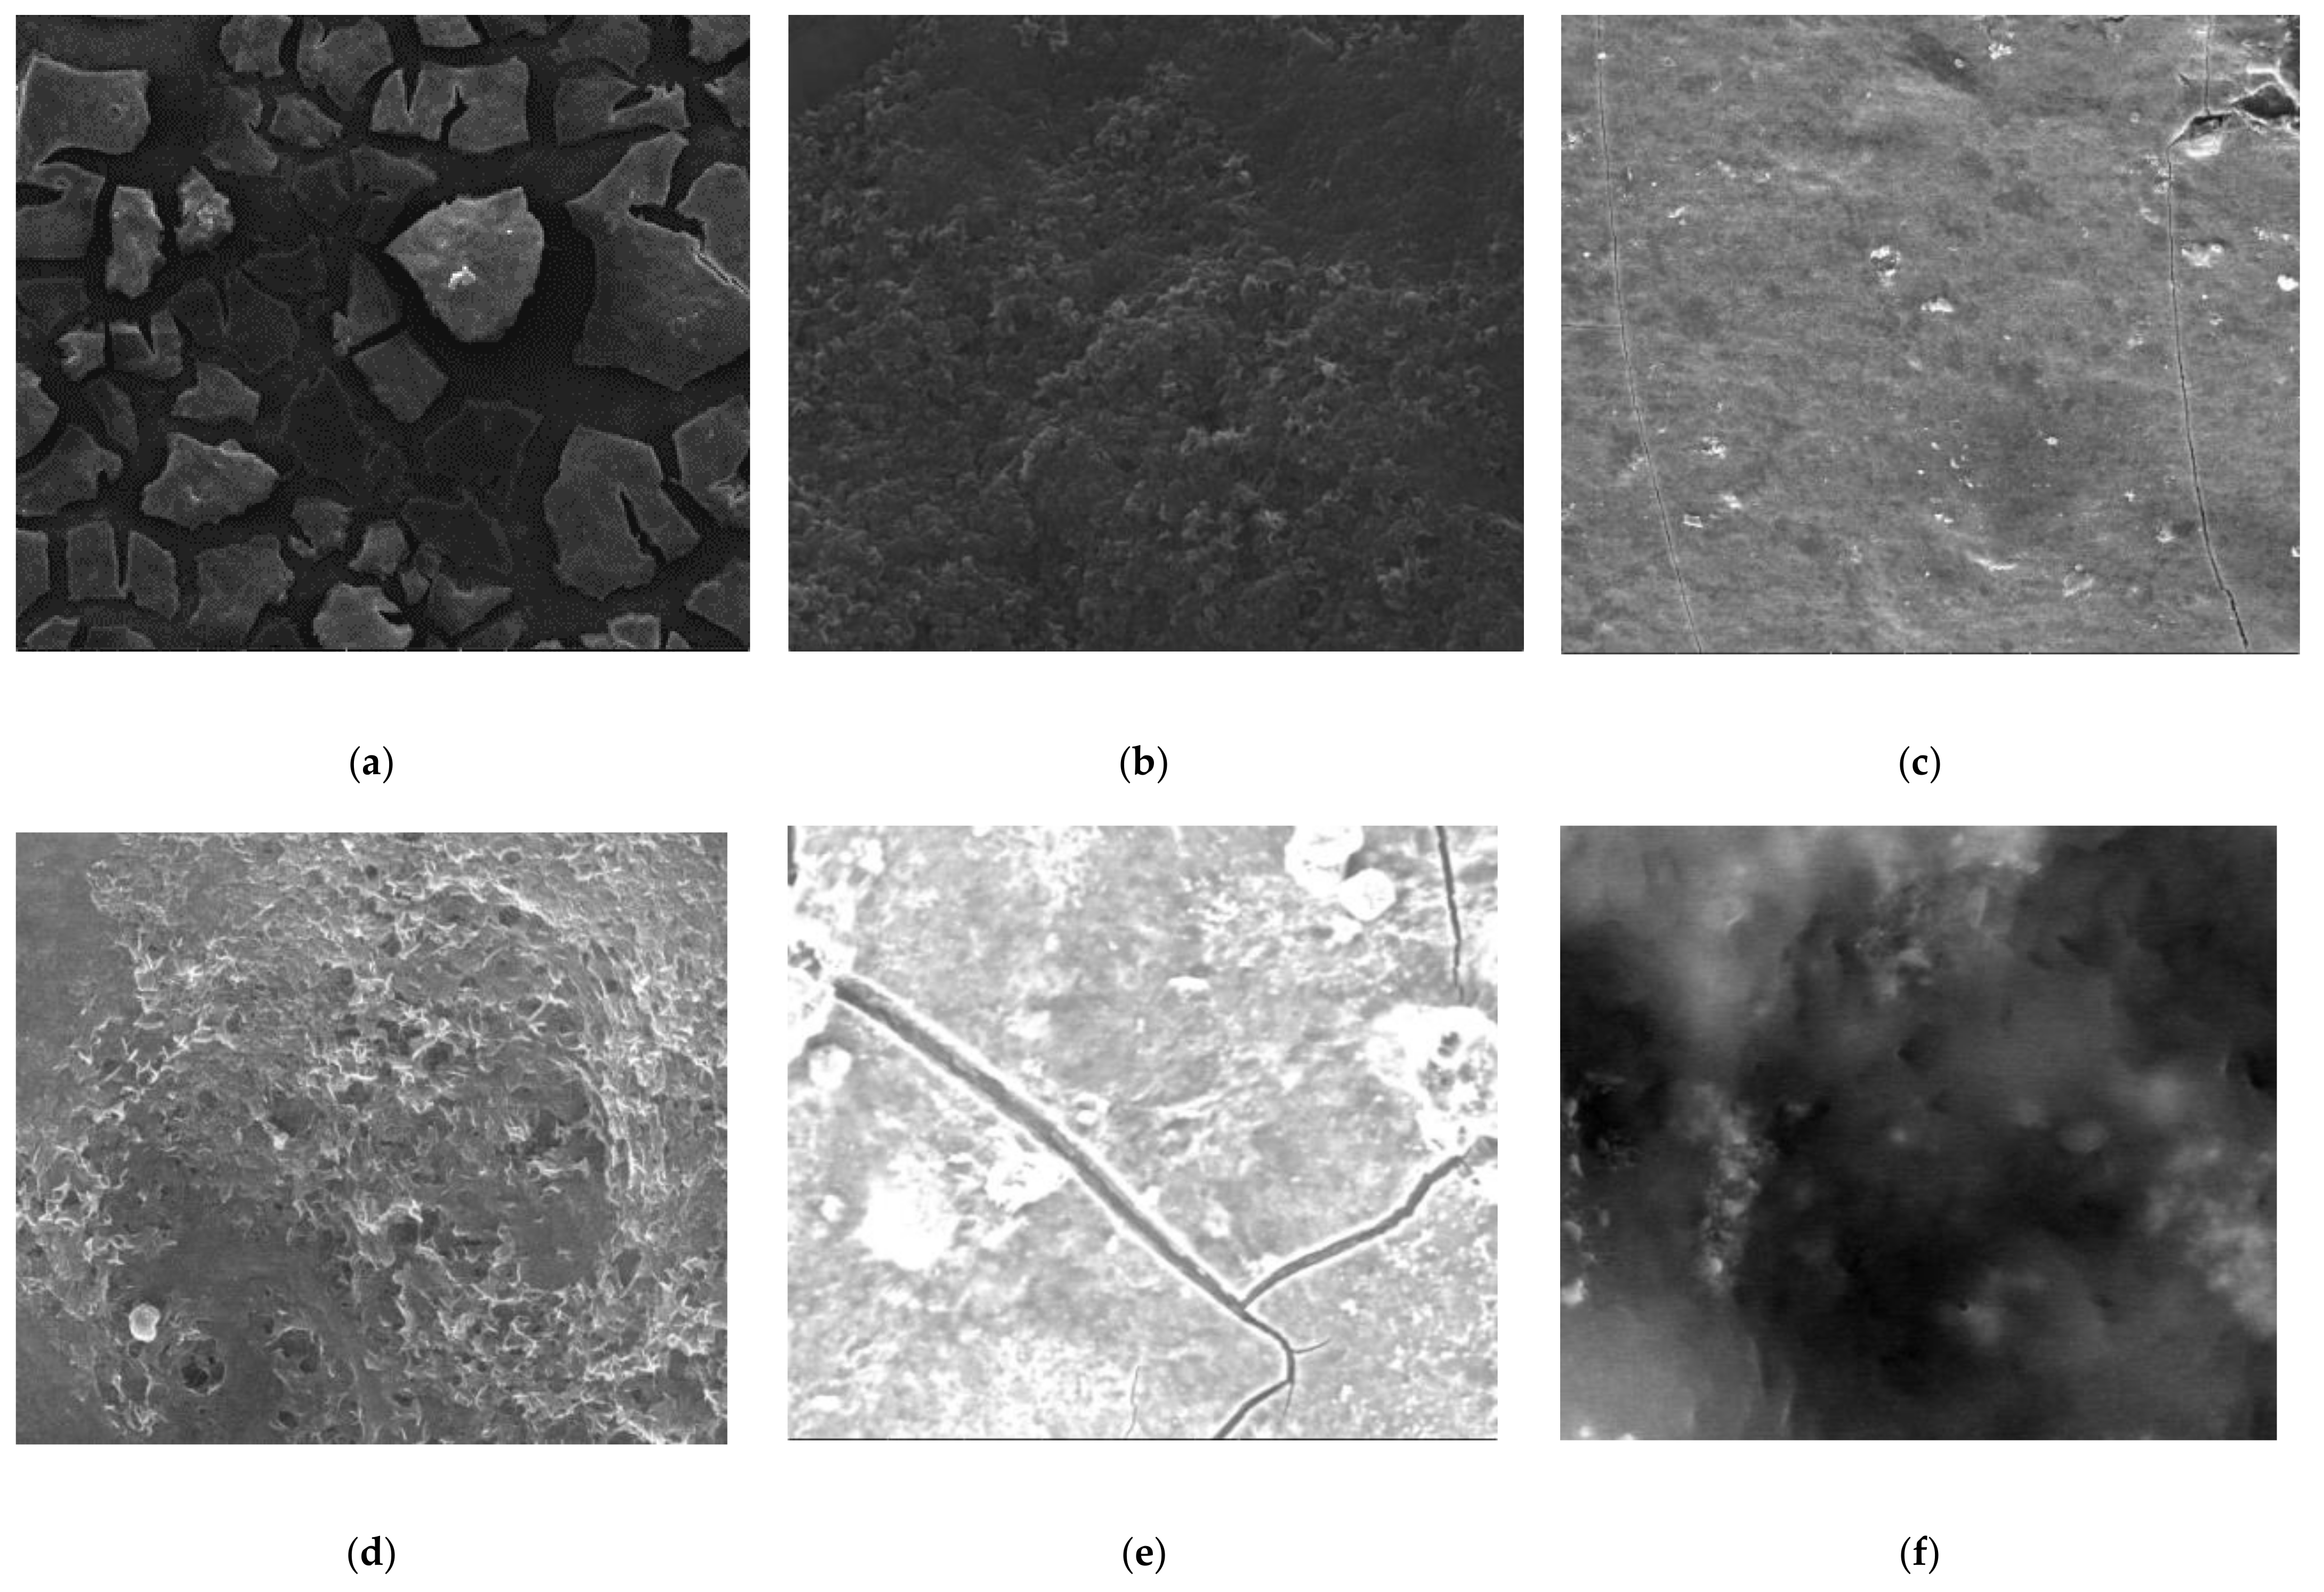
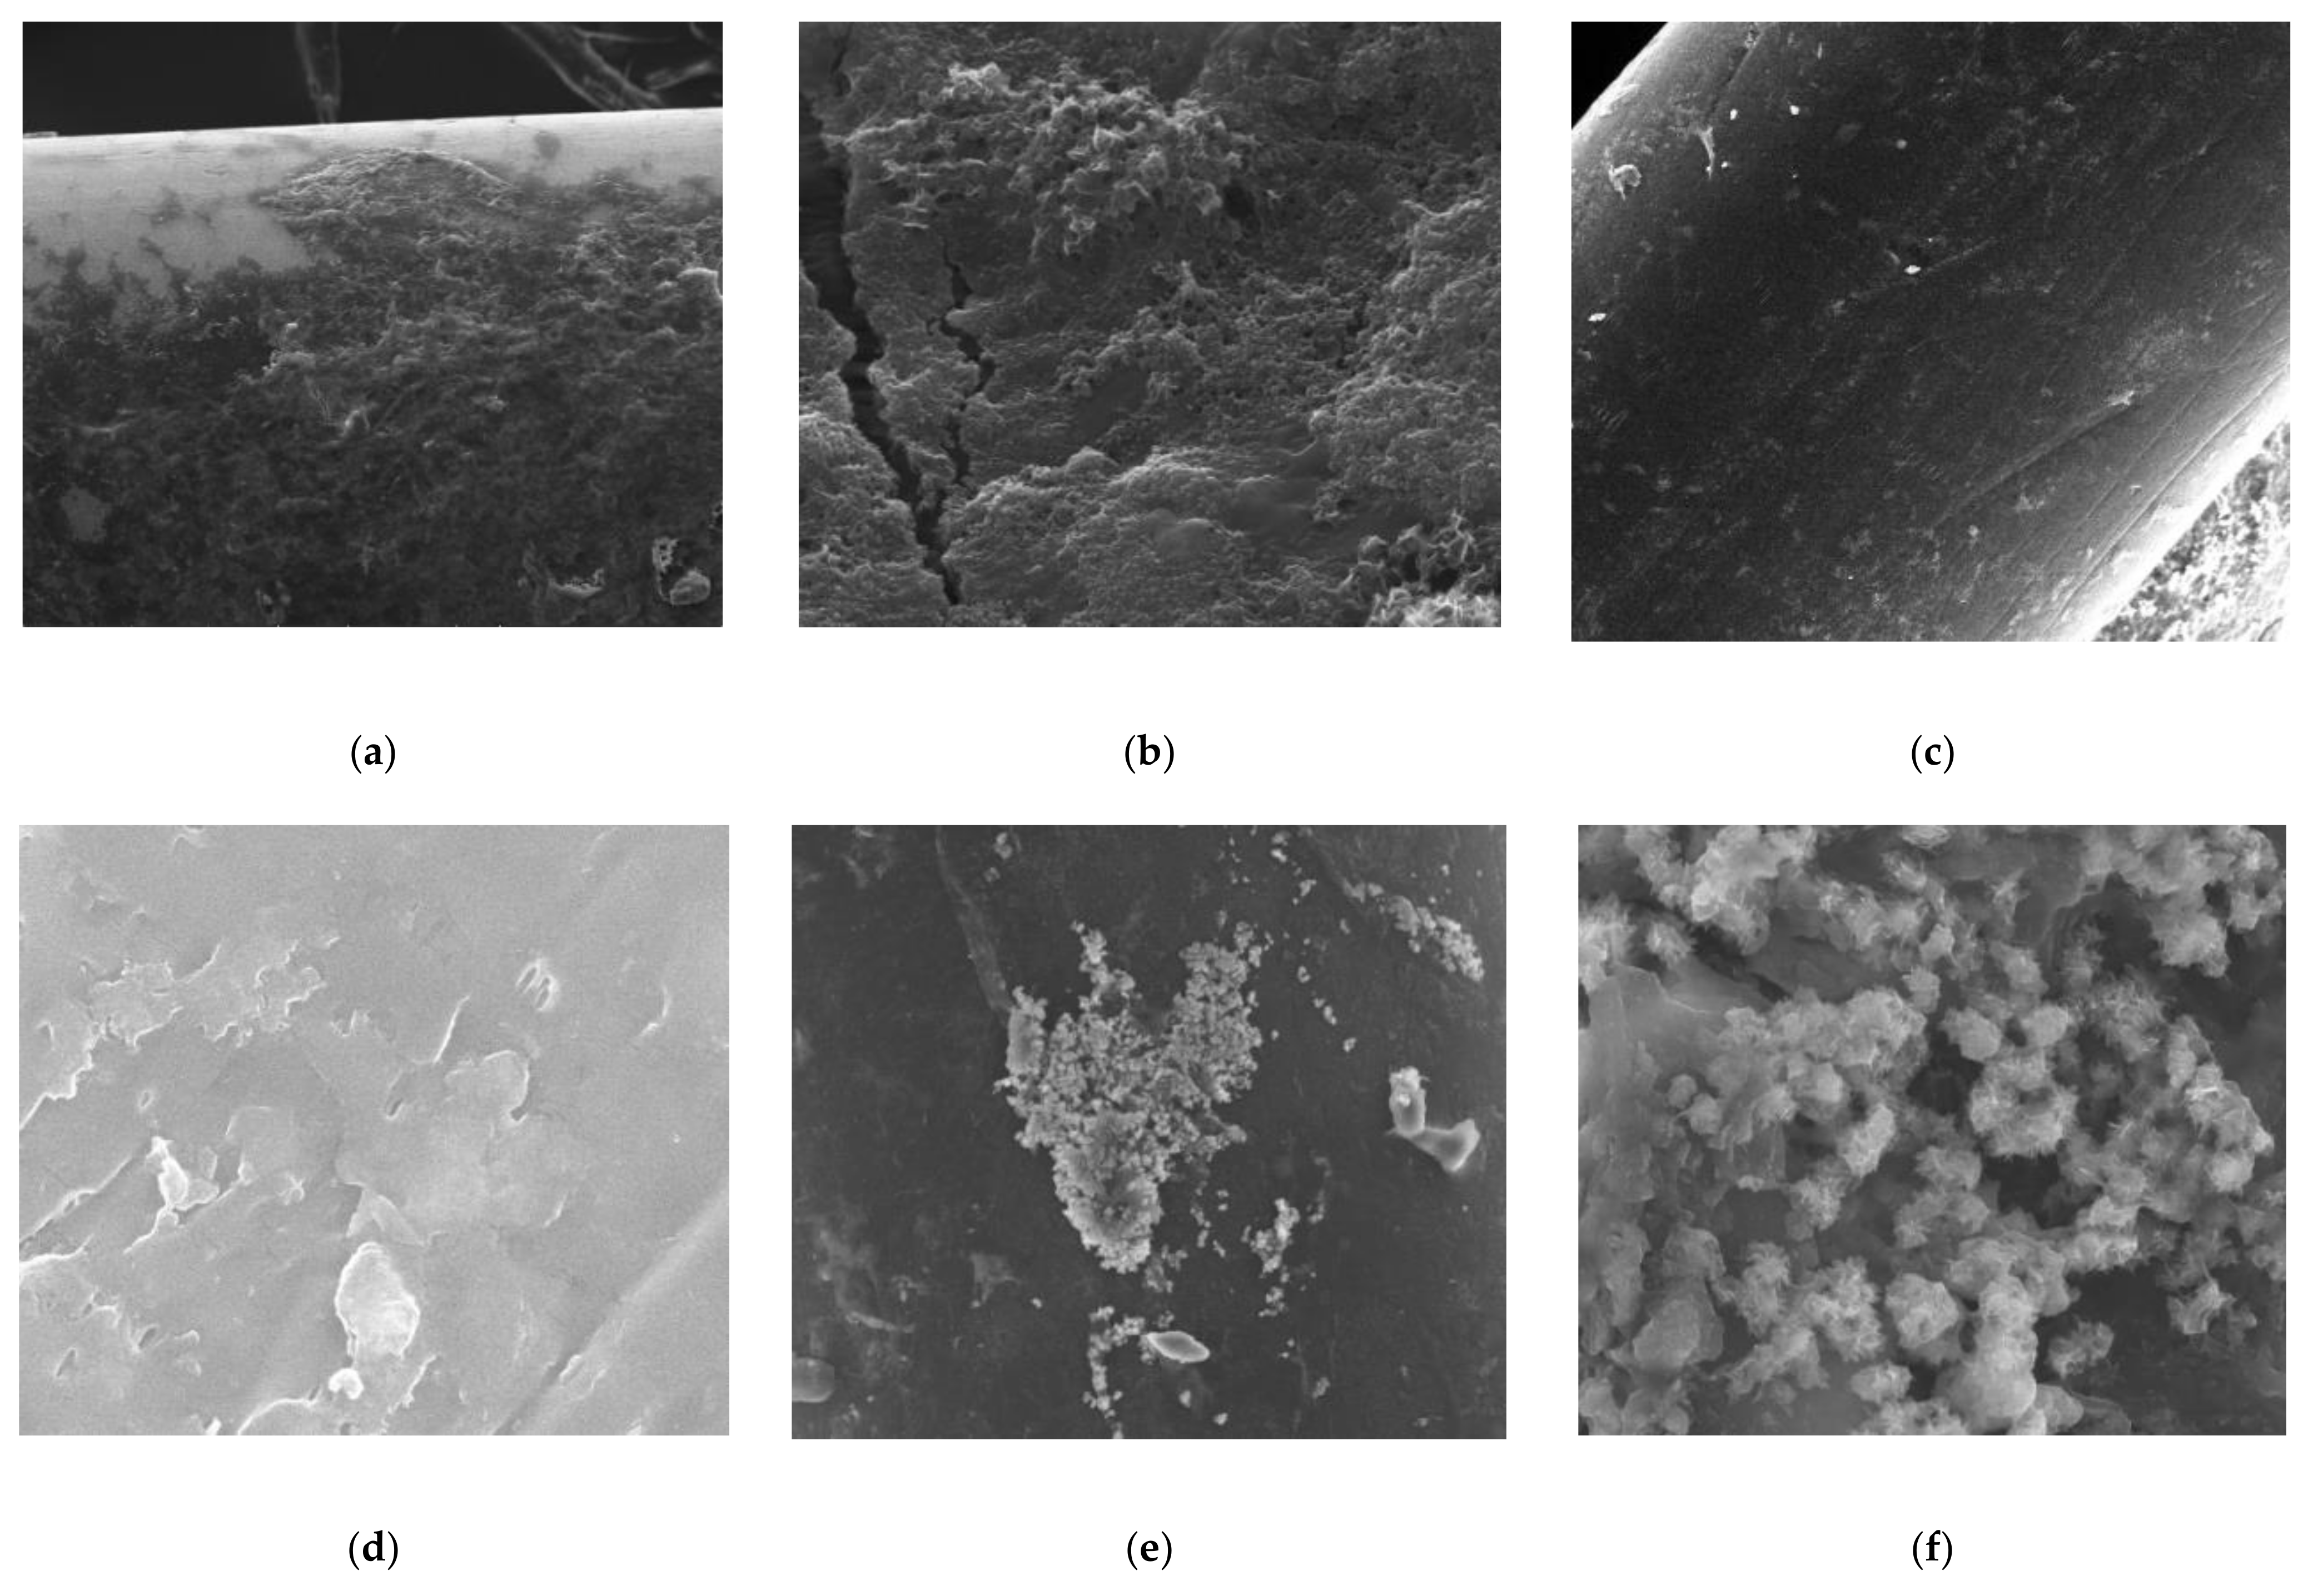
3.4. SEM Analysis
4. Conclusions
Author Contributions
Funding
Institutional Review Board Statement
Informed Consent Statement
Data Availability Statement
Acknowledgments
Conflicts of Interest
References
- Patil, D.S.; Chavan, S.M.; Oubagaranadin, J.U.K. A review of technologies for manganese removal from wastewaters. J. Environ. Chem. Eng. 2016, 4, 468–487. [Google Scholar] [CrossRef]
- Pedersen, H.D.; Postma, D.J.; Jakobsen, R.; Larsen, O. Fast transformation of iron oxyhydroxides by the catalytic action of aqueous Fe(II). Geochim. Cosmochim. Acta 2005, 69, 3967–3977. [Google Scholar] [CrossRef]
- Tufekci, N.; Celik, S.O. The effects of some inorganic and organic species on oxidation with atmospheric oxygen of manganese in natural water. Pol. J. Environ. Stud. 2011, 20, 201–207. [Google Scholar]
- Gumus, S.A.; Acar, T.O.; Demİrkol, G.T.; Durak, S.G.; Tufekcİ, N. Removal of iron in the presence of humic acid, sulphate and nitrate from drinking water by atmospheric oxygen. Fresenius Environ. Bull. 2019, 28, 846–851. [Google Scholar]
- Choo, K.H.; Lee, H.; Choi, S.J. Iron and manganese removal and membrane fouling during UF in conjunction with prechlorination for drinking water treatment. J. Memb. Sci. 2005, 267, 18–26. [Google Scholar] [CrossRef]
- Okura, T.; Goto, K. Oxidation of ferrous iron in natural water. J. Chem. Soc. Jpn. 1955, 58, 239–241. [Google Scholar]
- O’Connor, J. Iron and Manganese. In Water Quality and Treatment; Mc Graw-Hill: New York, NY, USA, 1971. [Google Scholar]
- Takai, T. Studies on the mechanisms of catalytic deferrization (2). J. Jpn. Water Work. Assoc. 1973, 466, 22–23. [Google Scholar]
- Andersen Dewey, R.; Row Donald, D.; Sindelar Gary, E. Iron and Manganese Studies of Nebraska Water Supplies on JSTOR. J. Am. Water Works Assoc. 1973, 65, 635–641. [Google Scholar] [CrossRef]
- Coughlin, R.W.; Matsui, I. Catalytic oxidation of aqueous Mn(II). J. Catal. 1976, 41, 108–123. [Google Scholar] [CrossRef]
- Sung, W. Catalytic Effects of The Y-FeOOH (Lepidocrocite) Surface on the Oxygenation Removal Kinetics of Fe(II) and Mn(II); Keck Laboratories of Environmental Engineering Science Division of Engineering and Applied Science California Institute of Technology: Pasadena, CA, USA, 1980. [Google Scholar]
- Davies, S.H.R.; Morgan, J.J. Manganese(II) oxidation kinetics on metal oxide surfaces. J. Colloid Interface Sci. 1989, 129, 63–77. [Google Scholar] [CrossRef]
- Tüfekci, N.; Sarikaya, H.Z. Catalytic effects of high Fe(III) concentrations on Fe(II) oxidation. Water Sci. Technol. 1996, 34, 389–396. [Google Scholar] [CrossRef]
- Aydin, S.; Tufekci, N.; Arayici, S.; Ozturk, I. Catalytic effects of high Mn(IV) concentrations on Mn(II) oxidation. Water Sci. Technol. 2000, 42, 387–392. [Google Scholar] [CrossRef]
- Ormanci, T.; Turkoglu Demirkol, G.; Aydın, I.M.; Tufekci, N. An experimental study on manganese(II) removal with manganese dioxide recycling. Desalination Water Treat. 2013, 51, 2225–2230. [Google Scholar] [CrossRef]
- Güneş Durak, S.; Köseoǧlu Imer, D.Y.; Türkoǧlu Demirkol, G.; Ormanci, T.; Armaǧan, B.; Tüfekci, N. Influence of ageing on the catalytic activity of MnO2 sludge for oxidation of Mn(II). Desalin. Water Treat. 2013, 51, 5692–5700. [Google Scholar] [CrossRef]
- Celik, S.O. Effect of NOM on the Removal of Fe(II) and Mn(II) and Advanced Treatment with Immersed Membrane System; Istanbul University: Istanbul, Turkey, 2011. [Google Scholar]
- Ormancı, T. Treatment of Fe(II) and Mn(II) in the Drinking Water with Fulvic Asid by Submerged Membrane System; Istanbul University: Istanbul, Turkey, 2011. [Google Scholar]
- Türkoğlu Demirkol, G. The effects of some organic compounds on the catalytic properties of MnO2 and Mn 2+ oxidation in drinking water. Fresenius Environ. Bull. 2019, 28, 569–573. [Google Scholar]
- Cheng, Q. Competitive mechanism of ammonia, iron and manganese for dissolved oxygen using pilot-scale biofilter at different dissolved oxygen concentrations. Water Sci. Technol. Water Supply 2016, 16, 766–774. [Google Scholar] [CrossRef]
- Štembal, T.; Markić, M.; Ribičić, N.; Briški, F.; Sipos, L. Removal of ammonia, iron and manganese from groundwaters of northern Croatia-pilot plant studies. Process Biochem. 2005, 1, 327–335. [Google Scholar] [CrossRef]
- Kan, C.-C.; Wan, M.-W.; Chen, W.-H.; Phatai, P.; Wittayakun, J.; Li, K.-F. The preliminary study of iron and manganese removal from groundwater by NaOCl oxidation and MF filtration | Request PDF. Sustain. Environ. Res. 2012, 22, 25–30. [Google Scholar]
- Yu, W.; Brown, M.; Graham, N.J.D. Prevention of PVDF ultrafiltration membrane fouling by coating MnO2 nanoparticles with ozonation. Sci. Rep. 2016, 6, 1–12. [Google Scholar] [CrossRef] [Green Version]
- Gouzinis, A.; Kosmidis, N.; Vayenas, D.V.; Lyberatos, G. Removal of Mn and simultaneous removal of NH3, Fe and Mn from potable water using a trickling filter. Water Res. 1998, 32, 2442–2450. [Google Scholar] [CrossRef]
- Tamura, H.; Goto, K.; Yotsuyanagi, T.; Nagayama, M. Spectrophotometric determination of iron(II) with 1,10-phenanthroline in the presence of large amounts of iron(III). Talanta 1974, 21, 314–318. [Google Scholar] [CrossRef]
- Chen, G.E.; Li, J.F.; Xu, Z.L.; Yu, L.Y. Preparation of Micro-Porous Polyethersulphone Hollow Fibre Membranes Using Non-Solvent Vapour-Induced Phase Seperation. Iran. Polym. J. 2010, 19, 863–873. [Google Scholar]
- Loh, C.H.; Wang, R.; Shi, L.; Fane, A.G. Fabrication of high performance polyethersulfone UF hollow fiber membranes using amphiphilic Pluronic block copolymers as pore-forming additives. J. Memb. Sci. 2011, 380, 114–123. [Google Scholar] [CrossRef]
- Pang, D.X.; Lü, S.L.; Wei, X.Z.; Zhu, B.K.; Xu, Y.Y. Effect of coagulation bath temperature on the structure and performance of polyethersulfone hollow fiber membranes by dry/wet process. J. Clin. Rehabil. Tissue Eng. Res. 2008, 12, 5381–5384. [Google Scholar]
- Judd, S.; Judd, C. The MBR Book: Principles and Applications of Membrane Bioreactors in Water and Wastewater Treatment; Elsevier: Amsterdam, The Netherlands, 2011; ISBN 0080465102. [Google Scholar]
- Koyuncu, İ.; Sengur, R.; Turken, T.; Guclu, S.; Pasaoglu, M.E. Advances in water treatment by microfiltration, ultrafiltration, and nanofiltration. In Advances in Membrane Technologies for Water Treatment-Materials, Processes and Applications; Basile, A., Cassano, A., Rastogi, N., Eds.; Woodhead Publishing: Oxford, UK, 2015; pp. 83–128. ISBN 9781845699697. [Google Scholar]
- APHA; AWWA; WEF. Standard Methods for the Examination of Water and Wastewater; American Public Health Association: Washington, DC, USA, 2012; p. 541. ISBN 9780875532356. [Google Scholar]
- Kasim, N.; Wahab Mohammad, A.; Rozaimah Sheikh Abdullah, S. Iron and Manganase Removal by Nanofiltration and Ultrafiltration Membranes: Influence of pH Adjustment. Malays. J. Anal. Sci. 2017, 21, 149–158. [Google Scholar] [CrossRef]
- Stumm, W.; Lee, G.F. The chemistry of aqueous iron. Schweiz. Z. Hydrol. 1960, 22, 295–319. [Google Scholar] [CrossRef]
- Zelmanov, G.; Semiat, R. Iron (Fe+3) oxide/hydroxide nanoparticles-based agglomerates suspension as adsorbent for chromium (Cr+6) removal from water and recovery. Sep. Purif. Technol. 2011, 2, 330–337. [Google Scholar] [CrossRef]
- Capponi, F.; Sartori, M.; Souza, M.L.; Rubio, J. Modified column flotation of adsorbing iron hydroxide colloidal precipitates. Int. J. Miner. Process. 2006, 79, 167–173. [Google Scholar] [CrossRef]
- Dashtban Kenari, S.L.; Barbeau, B. Understanding ultrafiltration fouling of ceramic and polymeric membranes caused by oxidized iron and manganese in water treatment. J. Memb. Sci. 2016, 516, 1–12. [Google Scholar] [CrossRef]
- Aguiar, A.O.; Duarte, R.A.; Ladeira, A.C.Q. The application of MnO2 in the removal of manganese from acid mine water. Water Air. Soil Pollut. 2013, 224, 1–8. [Google Scholar] [CrossRef]
- Bodík, I.; Blšťáková, A.; Dančová, L.; Sedláček, S. Comparison of Flat-Sheet and Hollow-Fiber Membrane Modules in Municipal Wastewater Treatment. Pol. J. Environ. Stud. 2009, 18, 331–340. [Google Scholar]
- Maximous, N.; Nakhla, G.; Wan, W. Comparative assessment of hydrophobic and hydrophilic membrane fouling in wastewater applications. J. Memb. Sci. 2009, 339, 93–99. [Google Scholar] [CrossRef]
- Dereli, R.K.; Urban, D.R.; Heffernan, B.; Jordan, J.A.; Ewing, J.; Rosenberger, G.T.; Dunaev, T.I. Performance evaluation of a pilot-scale anaerobic membrane bioreactor (AnMBR) treating ethanol thin stillage. Environ. Technol. 2012, 33, 1511–1516. [Google Scholar] [CrossRef]
- Choo, K.-H.; Kang, I.-J.; Yoon, S.-H.; Park, H.; Kim, J.-H.; Adiya, S.; Lee, C.-H. Approaches to membrane fouling control in anaerobic membrane bioreactors. Water Sci. Technol. 2000, 41, 363–371. [Google Scholar] [CrossRef]
- Chang, I.S.; Lee, C.H. Membrane filtration characteristics in membrane-coupled activated sludge system—The effect of physiological states of activated sludge on membrane fouling. Desalination 1998, 120, 221–233. [Google Scholar] [CrossRef]
- Stephenson, T.; Judd, S.; Jefferson, B.; Brindle, K. Membrane Bioreactors for Wastewater Treatment. J. Memb. Sci. 2001, 194, 145–146. [Google Scholar] [CrossRef]
- Dizge, N. The Investigation of Fouling Characteristics of Microfiltration Membranes Depending on Membrane Type and Pore Size in Conventional Activated Sludge System; Gebze High Technology Institute: Kocaeli, Turkey, 2011. [Google Scholar]
- Belfer, S.; Fainchtain, R.; Purinson, Y.; Kedem, O. Surface characterization by FTIR-ATR spectroscopy of polyethersulfone membranes-unmodified, modified and protein fouled. J. Memb. Sci. 2000, 172, 113–124. [Google Scholar] [CrossRef]
- Rabiller-Baudry, M.; le Maux, M.; Chaufer, B.; Begoin, L. Characterisation of cleaned and fouled membrane by ATR—FTIR and EDX analysis coupled with SEM: Application to UF of skimmed milk with a PES membrane. Desalination 2002, 146, 123–128. [Google Scholar] [CrossRef]
- Türkoğlu Demirkol, G. Membrane Surface Modification by Using Plasma Techniques and Application to Membrane Bioreactors; Istanbul University: Istanbul, Turkey, 2014. [Google Scholar]
- Howe, K.J.; Ishida, K.P.; Clark, M.M. Use of ATR/FTIR spectrometry to study fouling of microfiltration membranes by natural waters. Desalination 2002, 147, 251–255. [Google Scholar] [CrossRef]
- Tüfekci, M.; Durak, S.G.; Pir, İ.; Acar, T.O.; Demirkol, G.T.; Tüfekci, N. Manufacturing, Characterisation and Mechanical Analysis of Polyacrylonitrile Membranes. Polymers 2020, 12, 2378. [Google Scholar] [CrossRef]
- Acarer, S.; Pir, İ.; Tüfekci, M.; Demirkol, G.T.; Tüfekci, N. Manufacturing and Characterisation of Polymeric Membranes for Water Treatment and Numerical Investigation of Mechanics of Nanocomposite Membranes. Polymers 2021, 13, 1661. [Google Scholar] [CrossRef] [PubMed]
- Bae, B.; Chun, B.H.; Kim, D. Surface characterization of microporous polypropylene membranes modified by plasma treatment. Polymer 2001, 42, 7879–7885. [Google Scholar] [CrossRef]
- Gryta, M.; Tomaszewska, M.; Grzechulska, J.; Morawski, A.W. Membrane distillation of NaCl solution containing natural organic matter. J. Memb. Sci. 2001, 181, 279–287. [Google Scholar] [CrossRef]
- Gryta, M.; Grzechulska-Damszel, J.; Markowska, A.; Karakulski, K. The influence of polypropylene degradation on the membrane wettability during membrane distillation. J. Memb. Sci. 2009, 326, 493–502. [Google Scholar] [CrossRef]
- Farsani, R.E.; Raissi, S.; Shokuhfar, A.; Sedghi, A. FT-IR Study of Stabilized PAN Fibers for Fabrication of Carbon Fibers. World Acad. Sci. Eng. Technol. 2009, 3, 430–433. Available online: http://waset.org/publications/447 (accessed on 2 September 2021).
- Yamamura, H.; Kimura, K.; Watanabe, Y. Mechanism involved in the evolution of physically irreversible fouling in microfiltration and ultrafiltration membranes used for drinking water treatment. Environ. Sci. Technol. 2007, 41, 6789–6794. [Google Scholar] [CrossRef] [PubMed]
- Tufekci, M.; Gunes-Durak, S.; Ormanci-Acar, T.; Tufekci, N. Effects of geometry and PVP addition on mechanical behavior of PEI membranes for use in wastewater treatment. J. Appl. Polym. Sci. 2019, 136, 47073. [Google Scholar] [CrossRef]


| HF PP | PT PES | |
|---|---|---|
| Membrane type | Hollow Fiber-P5 | Flat-MP005 |
| Surface area, cm2 | 1.168 | 16 |
| Membrane material | Polypropylene | Polyethersulfone |
| Pore size | 0.1 μm × 0.5 μm | 0.05 μm |
| Characteristic flux | 216 L/m2·h | - |
| Pure water flux | - | 400 L/m2·h |
| OD/ID | 240/310 μm | - |
| Bursting press | >5.5 bar | - |
| Crash pressure | >3.5 bar | - |
| Temperature | - | 95 °C |
| pH | - | 0–14 |
| pH | Fe2+ (mg/L) | MnO2 (mg/L) | Fe(OH)3 (mg/L) | k/kcat (min–1) | Time (min) |
|---|---|---|---|---|---|
| 6.5 | 3 | 0 | 0 | 0.038 | 79 |
| 6.5 | 3 | 5 | 0 | 0.041 | 73 |
| 6.5 | 3 | 25 | 0 | 0.051 | 59 |
| 6.5 | 3 | 50 | 0 | 0.08 | 36 |
| 6.5 | 3 | 0 | 5 | 0.05 | 60 |
| 6.5 | 3 | 0 | 25 | 0.063 | 47 |
| 6.5 | 3 | 0 | 50 | 0.107 | 27 |
| pH | Mn2+ (mg/L) | MnO2 (mg/L) | Fe(OH)3 (mg/L) | k/kcat (min−1) | Time (min.) |
|---|---|---|---|---|---|
| 9.2 | 3 | 0 | 0 | 0.0169 | 177 |
| 9.2 | 3 | 5 | 0 | 0.0194 | 150 |
| 9.2 | 3 | 25 | 0 | 0.0265 | 113 |
| 9.2 | 3 | 50 | 0 | 0.0272 | 110 |
| 9.2 | 3 | 0 | 5 | 0.0195 | 134 |
| 9.2 | 3 | 0 | 25 | 0.0269 | 111 |
| 9.2 | 3 | 0 | 50 | 0.0392 | 76 |
| Membrane Type | JW | Fe2+ (90 Days) | Mn2+ (90 Days) | Fe2+-Mn2+ (90 Days) | |||
|---|---|---|---|---|---|---|---|
| Jd | J0 | Jd | J0 | Jd | J0 | ||
| PT PES | 400 | 148.57 | 470.00 | 10.81 | 84.96 | 60.22 | 93.69 |
| HF PP | 216 | 9.48 | 91.79 | 9.37 | 54.70 | 41.53 | 96.85 |
| Membrane Type | (Fe2+) | (Mn2+) | (Fe2+-Mn2+) | |||||||||
|---|---|---|---|---|---|---|---|---|---|---|---|---|
| Rt ×1012 | Rm ×1012 (%) | Rp ×1012 (%) | Rc ×1012 (%) | Rt ×1012 | Rm ×1012 (%) | Rp ×1012 (%) | Rc ×1012 (%) | Rt ×1012 | Rm ×1012 (%) | Rp ×1012 (%) | Rc ×1012 (%) | |
| PT PES | 1.94 | 0.72 37.11 | 0.26 13.40 | 0.96 49.49 | 26.64 | 0.72 2.70 | 7.47 28.04 | 18.45 69.26 | 4.78 | 0.72 15.06 | 1.02 21.34 | 3.04 63.60 |
| HFPP | 8.28 | 1.33 16.06 | 2.45 29.59 | 4.50 54.35 | 30.73 | 1.33 4.33 | 9.57 31.14 | 19.83 64.53 | 6.93 | 1.33 19.20 | 2.04 29.43 | 3.56 51.37 |
Publisher’s Note: MDPI stays neutral with regard to jurisdictional claims in published maps and institutional affiliations. |
© 2021 by the authors. Licensee MDPI, Basel, Switzerland. This article is an open access article distributed under the terms and conditions of the Creative Commons Attribution (CC BY) license (https://creativecommons.org/licenses/by/4.0/).
Share and Cite
Türkoğlu Demirkol, G.; Çelik, S.Ö.; Güneş Durak, S.; Acarer, S.; Çetin, E.; Akarçay Demir, S.; Tüfekci, N. Effects of Fe(OH)3 and MnO2 Flocs on Iron/Manganese Removal and Fouling in Aerated Submerged Membrane Systems. Polymers 2021, 13, 3201. https://doi.org/10.3390/polym13193201
Türkoğlu Demirkol G, Çelik SÖ, Güneş Durak S, Acarer S, Çetin E, Akarçay Demir S, Tüfekci N. Effects of Fe(OH)3 and MnO2 Flocs on Iron/Manganese Removal and Fouling in Aerated Submerged Membrane Systems. Polymers. 2021; 13(19):3201. https://doi.org/10.3390/polym13193201
Chicago/Turabian StyleTürkoğlu Demirkol, Güler, Suna Özden Çelik, Sevgi Güneş Durak, Seren Acarer, Ender Çetin, Sultan Akarçay Demir, and Neşe Tüfekci. 2021. "Effects of Fe(OH)3 and MnO2 Flocs on Iron/Manganese Removal and Fouling in Aerated Submerged Membrane Systems" Polymers 13, no. 19: 3201. https://doi.org/10.3390/polym13193201