Article

Enhancement of Flame Retardancy and Mechanical Properties of Polylactic Acid with a Biodegradable Fire-Retardant Filler System Based on Bamboo Charcoal

1
Zhejiang Provincial Collaborative Innovation Center for Bamboo Resources and High-Efficiency Utilization, College of Chemistry and Materials Engineering, Zhejiang A&F University, Hangzhou 311300, China
2
Department of Wood Science, Faculty of Forestry, University of British Columbia, 2900-2424 Main Mall, Vancouver, BC V6T 1Z4, Canada
*
Authors to whom correspondence should be addressed.
These authors contributed equally to this work.
Polymers 2021, 13(13), 2167; https://doi.org/10.3390/polym13132167
Submission received: 7 June 2021 / Revised: 27 June 2021 / Accepted: 27 June 2021 / Published: 30 June 2021
(This article belongs to the Special Issue Advances in Wood Composites IV)

Abstract

:
A cooperative flame-retardant system based on natural intumescent-grafted bamboo charcoal (BC) and chitosan (CS) was developed for polylactic acid (PLA) with improved flame retardancy and minimal decline in strength properties. Chitosan (CS) as an adhesion promoter improved the interfacial compatibility between graft-modified bamboo charcoal (BC-m) and PLA leading to enhanced tensile properties by 11.11% and 8.42%, respectively for tensile strength and modulus. At 3 wt.% CS and 30 wt.% BC-m, the crystallinity of the composite increased to 38.92%, or 43 times that of pure PLA (0.9%). CS promotes the reorganization of the internal crystal structure. Thermogravimetric analysis showed significantly improved material retention of PLA composites in nitrogen and air atmosphere. Residue rate for 5 wt.% CS and 30 wt.% BC-m was 29.42% which is 55.1% higher than the theoretical value of 18.97%. Flammability tests (limiting oxygen index-LOI and UL-94) indicated significantly improved flame retardancy and evidence of cooperation between CS and BC-m, with calculated cooperative effectiveness index(Ce) >1. From CONE tests, the peak heat release rate (pHRR) and total heat release (THR) were reduced by 26.9% and 30.5%, respectively, for 3% CS + 20% BC-m in PLA compared with adding 20% BC-m alone. Analysis of carbon residue morphology, chemical elements and structure suggest CS and BC-m form a more stable char containing pyrophosphate. This char provides heat insulation to inhibit complete polymer pyrolysis, resulting in improved flame retardancy of PLA composites. Optimal mix may be recommended at 20% BC-m + 3% CS to balance compatibility, composite strength properties and flame retardance.

1. Introduction

Universal dependence on petroleum-based plastics has created enormous land and sea pollution problems prompting research and development of new bio-based and biodegradable polymers [1,2]. Polylactic acid (PLA) is an example, with excellent mechanical properties, high processability, and potential for regeneration and biodegradability [3,4], and is today widely used in packaging, the medical industry, and 3D printing [5,6,7,8]. However, its inherent biodegradability and fermented biomass-derived carbon-hydrogen composition give PLA low heat and melt resistance when burned [9,10,11], causing flame spread due to melting and dripping [12]. For this reason, PLA does not meet the UL-94 V-1 rating or higher required to mitigate fire hazard, limiting its applications [13].
Various strategies have been proposed to improve the flame retardancy of PLA [14,15]. Previous work by authors include modification with aluminum hypophosphite (AHP) [16,17] and bamboo charcoal (BC) [18]. The flame-retardant performance was improved, but mechanical properties decreased and combustion produced toxic phosphene gas (PH3). While BC+AHP was effective in PLA, it is not commercially viable as a “green” packaging material. Renewable, bio-based, non- or low-toxic and low-smoke intumescent flame retardants (IFR) are being developed [7,19]. Biomass materials, such as starch, lignin, chitosan (CS), and sodium alginate [20,21], have been investigated as flame-retardant charring agents in polymers. A new bio-based flame retardant (defined as LHP) containing hydroxyapatite and lignocellulose in a ratio of LHP to APP of 1:3 at 10 wt.% addition is effective [14]. The peak heat release value in cone calorimeter combustion (CONE) tests decreased from 365 kW/m2 to 250 kW/m2. Beta-cyclodextrin (β–CD) and poly (propylene glycol) (PPG) have been used to improve the flame retardancy of PLA with ammonium polyphosphate (APP) and melamine (MA) [22]. A limiting oxygen index (LOI) of 34 vol% and a UL-94 V-0 vertical flame test rating were both achieved. Besides, the addition of 1–5 wt.% starch was also used to further increase the LOI to 30.6% and improve the anti-dripping properties of PLA-based foams [23]. However, these additives require a high loading for efficacy which significantly reduces the mechanical properties of the materials [24,25].
Chitosan (CS), the fully or partially deacetylated form of chitin, is one of the very few natural polymers that has a primary amino group along its main chain [26]. It has excellent biocompatibility, film-forming properties, and different viscosity states, and is therefore used as the reinforcing phase in polymer composites [27,28,29]. CS on its own has little flame retardancy with a carbohydrate structure that does not promote carbonization; however, its matrix can be modified with inorganic nanofillers to give unique properties. For example, adding halloysite can significantly raise the ignition temperature to around 150 °C, although a large number of active layers are needed [30,31]. Though the flame retardancy of CS can be increased by the formation of a carbon layer in the presence of phosphoric acid [21,32,33], phosphorylated chitosan (CS-P) often displays poor thermal stability, which limits its application in many polymers [34]. However CS in different states may be used to form a cooperative system with a char-forming intumescent graft-modified BC, developed by Zhang et al. (2021) [18]. BC has a very high specific surface area and a rich, irregular pore structure that is effectively graft modified with phosphorous and nitrogen compounds to produce an effective flame retardant that mixes well with PLA. The objective of this work was to develop and test a non-toxic, more effective, and biodegradable flame-retardant system based on combining BC-m with CS with minimal negative impacts on the mechanical properties of polylactic acid.

2. Materials and Methods

2.1. Materials

PLA resin was purchased from Cargill Dow Inc (4032D, Nature Works Co. Ltd., Blair, NE, USA) with a density of 1.24 g/cm3 and melting point of 160 °C. The glass transition temperature and the crystallization peak temperature of the polymer are 57.8 °C and 150–170 °C, respectively. BC was supplied by Zhejiang Anji Huasen Bamboo Charcoal Products Co., Ltd. (Zhejiang, China). The product was carbonized at 700 to 800 °C and ground to 100 to 250 mesh particle size. CS was supplied by Macklin Biochemical Co., Ltd., (Shanghai, China), with viscosity of 200–400 mPa.s.
Chemical reagents used for graft modification of BC were: hydrogen peroxide (H2O2) at 30% conc. (Yonghua Chemical Reagent Co., Ltd., Jiangsu, China), phosphoric acid (PA) at 85% conc. and urea at 99% purity (both from Sinopharm Chemical Reagent Co., Ltd., Shanghai, China), and ammonium hydroxide solution at 3% conc. and 0.91 g/mL density at 20 °C (Macklin Biochemical Co., Ltd., Shanghai, China).

2.2. Preparation

2.2.1. Grafting Modification of BC

As described in previous work [18], two batches of 30% conc. aqueous H2O2 solution were used to treat BC (which was thoroughly washed and dried) in succession. Using a BC to H2O2 of 1:3, the BC was treated for 8 h. After filtration, H2O2 was added again, followed by 1 h of microwave irradiation at 200 W, and oven drying at 90 °C overnight to produce a treated BC intermediate termed “BC-o”.
The BC-o powder was reacted with PA at 85% conc. using a 1:1 ratio to BC-o and stirring at 80 °C for 30 min, then gradually heated further to 100 °C and maintained for 1 h. Urea dispersed in deionized water was added for a PA:urea ratio of 1:1.8, with 3% ammonia used to adjust the pH of the mixture to between 8 and 10. The mixture was heated slowly to 120 °C for 30 min and then gradually increased to 160 °C, which was then cured in an oven at 200 °C for 6 h. The hardened foam, termed “BC-m”, was ground to 150–250 mesh and washed several times with a hot ethanol solution and dried at 90 °C for 2 h.

2.2.2. Preparation of Flame-Retardant PLA Composites

PLA, CS, and BC-m powders were dried at 80 °C overnight. A twin-roll mixing mill (XK-160, Wuhan, China) was used to compound them together at 180 °C. The screw was run at 30 rpm. Different mix ratios of PLA, CS, and BC-m (shown in Table 1) were prepared.
The compounded, extruded mixes were cut into pellets and re-mixed in the mill until a visually good dispersion was achieved. The compounded pellets were hot-pressed (180 °C) into sheets with under 10 MPa pressure for 10 min for combustion performance tests. Pellets were also injection molded into splines at 175 °C and 6 MPa pressure, which were used for mechanical tests of tensile and flexural properties. A schematic diagram of the preparation and testing processes is shown in Figure 1.

2.3. Measurement and Characterization

2.3.1. Characterization of PLA Composites

The fracture surface morphology of PLA and the blends with BC-m and CS were observed by a scanning electron microscope (SEM; TM3030, Hitachi, Japan) at an accelerating voltage of 15 kV. Samples were conductive coated by gold sputter coating for 90 s at a current of 15 mA to get a conductive layer.
An X-ray diffractometer (XRD6000, Shimadzu Co., Ltd., Kyoto, Japan) was used to detect changes in the crystal structure. The profiles were analyzed by Cu Kα (0.15406 nm) radiation under a tube voltage of 40 kV. The tube current was set at 30 mA, and the scanning range was 3°–40° (2θ) at a rate of 2°/min.
Differential scanning calorimetry (DSC) tests were conducted using DSC-500B (YANJIN Scientific Instrument Co., Ltd., Shanghai, China) under nitrogen at a flow rate of 50 mL/min. Samples of 5 mg were weighed and sealed in a tared aluminum pan with an empty pan used as the reference. Samples were first heated from 25 to 220 °C at a rate of 10 °C/min−1, kept for 5 min to eliminate the thermal history, then cooled down to 25 °C at a rate of 10 °C/min. The second heating curve was recorded at a heating rate of 10 °C/min, showing the melting process. Crystallinity (Xc) was estimated according to Equation (1),
X c ( % ) = H C H 0 · X PLA   ×   100 %
where H C refers to the crystallization enthalpy; H 0 refers to the enthalpy value during 100% crystallization of PLA, which is 93.6 J/g [35]; XPLA refers to the weight ratio of PLA in the FPLA composite blends.

2.3.2. Mechanical Properties

The mechanical properties (tensile strength and modulus, MOR, MOE) of the composites were tested using a microcomputer-controlled electronic universal testing machine (CMT610, MTS Industrial System (China) Co., Ltd., Shanghai, China) according to the Chinese National Testing Standard GB/T 1040-2006 (for tensile properties) and GB/T 9341-2008 (for flexural properties). For the tensile test, the width and thickness of the narrow stress zone in specimens were 5 and 2 mm, respectively. The gauge length was set to 60 mm and loading speed was 2 mm/min. The flexural test specimen dimensions were 80 × 10 × 4 mm3 with load span of 60 mm and loading speed of 2 mm/min.

2.3.3. Thermal Behavior

Thermal gravimetric analysis (TGA) was carried out using a thermo-gravimetric analyzer (F1, NETZSCH Co., Ltd., Selbu, Germany) under nitrogen and air atmosphere. Approximately 5–10 mg of material was weighed and assayed in an aluminum crucible and tested over a temperature range of 50 to 700 °C with a heating rate of 10 °C/min under a gas flow of 20 mL/min. An empty crucible was used as a reference.

2.3.4. Combustion Properties Tests

The limiting oxygen index (LOI), expressed as vol.% minimum concentration of oxygen required to initiate combustion, was measured using a JF-3 oxygen index meter (Jiangning Analysis Instrument Company, Nanjing, Jiangsu, China) according to ISO 4589-2:2017 [36]. The dimensions of the test specimens were 100 ×10 × 4 mm3.
The Underwriters Laboratory (UL-94) vertical flame test was carried out using a 5402-type vertical burn test instrument (Suzhou Yangyi Woerqi Detection Technology Co., Ltd., Nanjing, Jiangsu, China) with specimens measuring 130 ×13 × 3 mm3. The test parameters and ratings are defined in ATSM D3801-10 [37].
Cone calorimeter combustion (CONE) tests were carried out using a cone calorimeter (FTT0007, Fire Testing Technology Co., Ltd., East Grinstead, UK) according to ISO 5660-1 [38]. The specimen measuring 100 × 100 × 4 mm3 was placed horizontally in a bed of aluminum foil and was heated under the combustion hood in which the predetermined test height was 25 cm. Using an external heat flux of 35 kW/m2, the material was ignited and the relevant combustion performance indices recorded until combustion was complete. Combustion indices are the average of 3 test specimens per group.

2.3.5. Residue Analysis

All remaining carbonized residues from the CONE tests were collected and imaged to further analyze the surface morphology using a scanning electron microscope (SEM) at an accelerating voltage of 15 kV. Specimens were sputter coated with 24 ct gold for 90 s at a current of 15 mA.
Fourier transform infrared spectroscopy (FTIR) was used to detect the changes in chemical groups and structure of the residues using a Nicolet 6700FT-IR spectrophotometer with KBr slice. The transmission mode was used and the wave number range was set from 400 cm−1 to 4000 cm−1.
X-ray photoelectron spectroscopy (XPS) was used to investigate the residual element contents of samples. This was carried out using a Thermo ScientificTM K-AlphaTM+ spectrometer (Thermo Fisher, Scientific Inc, Waltham, MA, USA) equipped with a monochromatic Al Kα X-ray source (1486.6 eV) operating at 100 W. Samples were analyzed under vacuum (p < 10−8 mbar) with a pass energy of 150 eV (survey scans) or 25 eV (high-resolution scans). All peaks were calibrated with C1s peak binding energy at 284.8 eV for adventitious carbon. The experimental peaks were fitted using Avantage software.

3. Results

3.1. Characterization of PLA and FPLA Composites

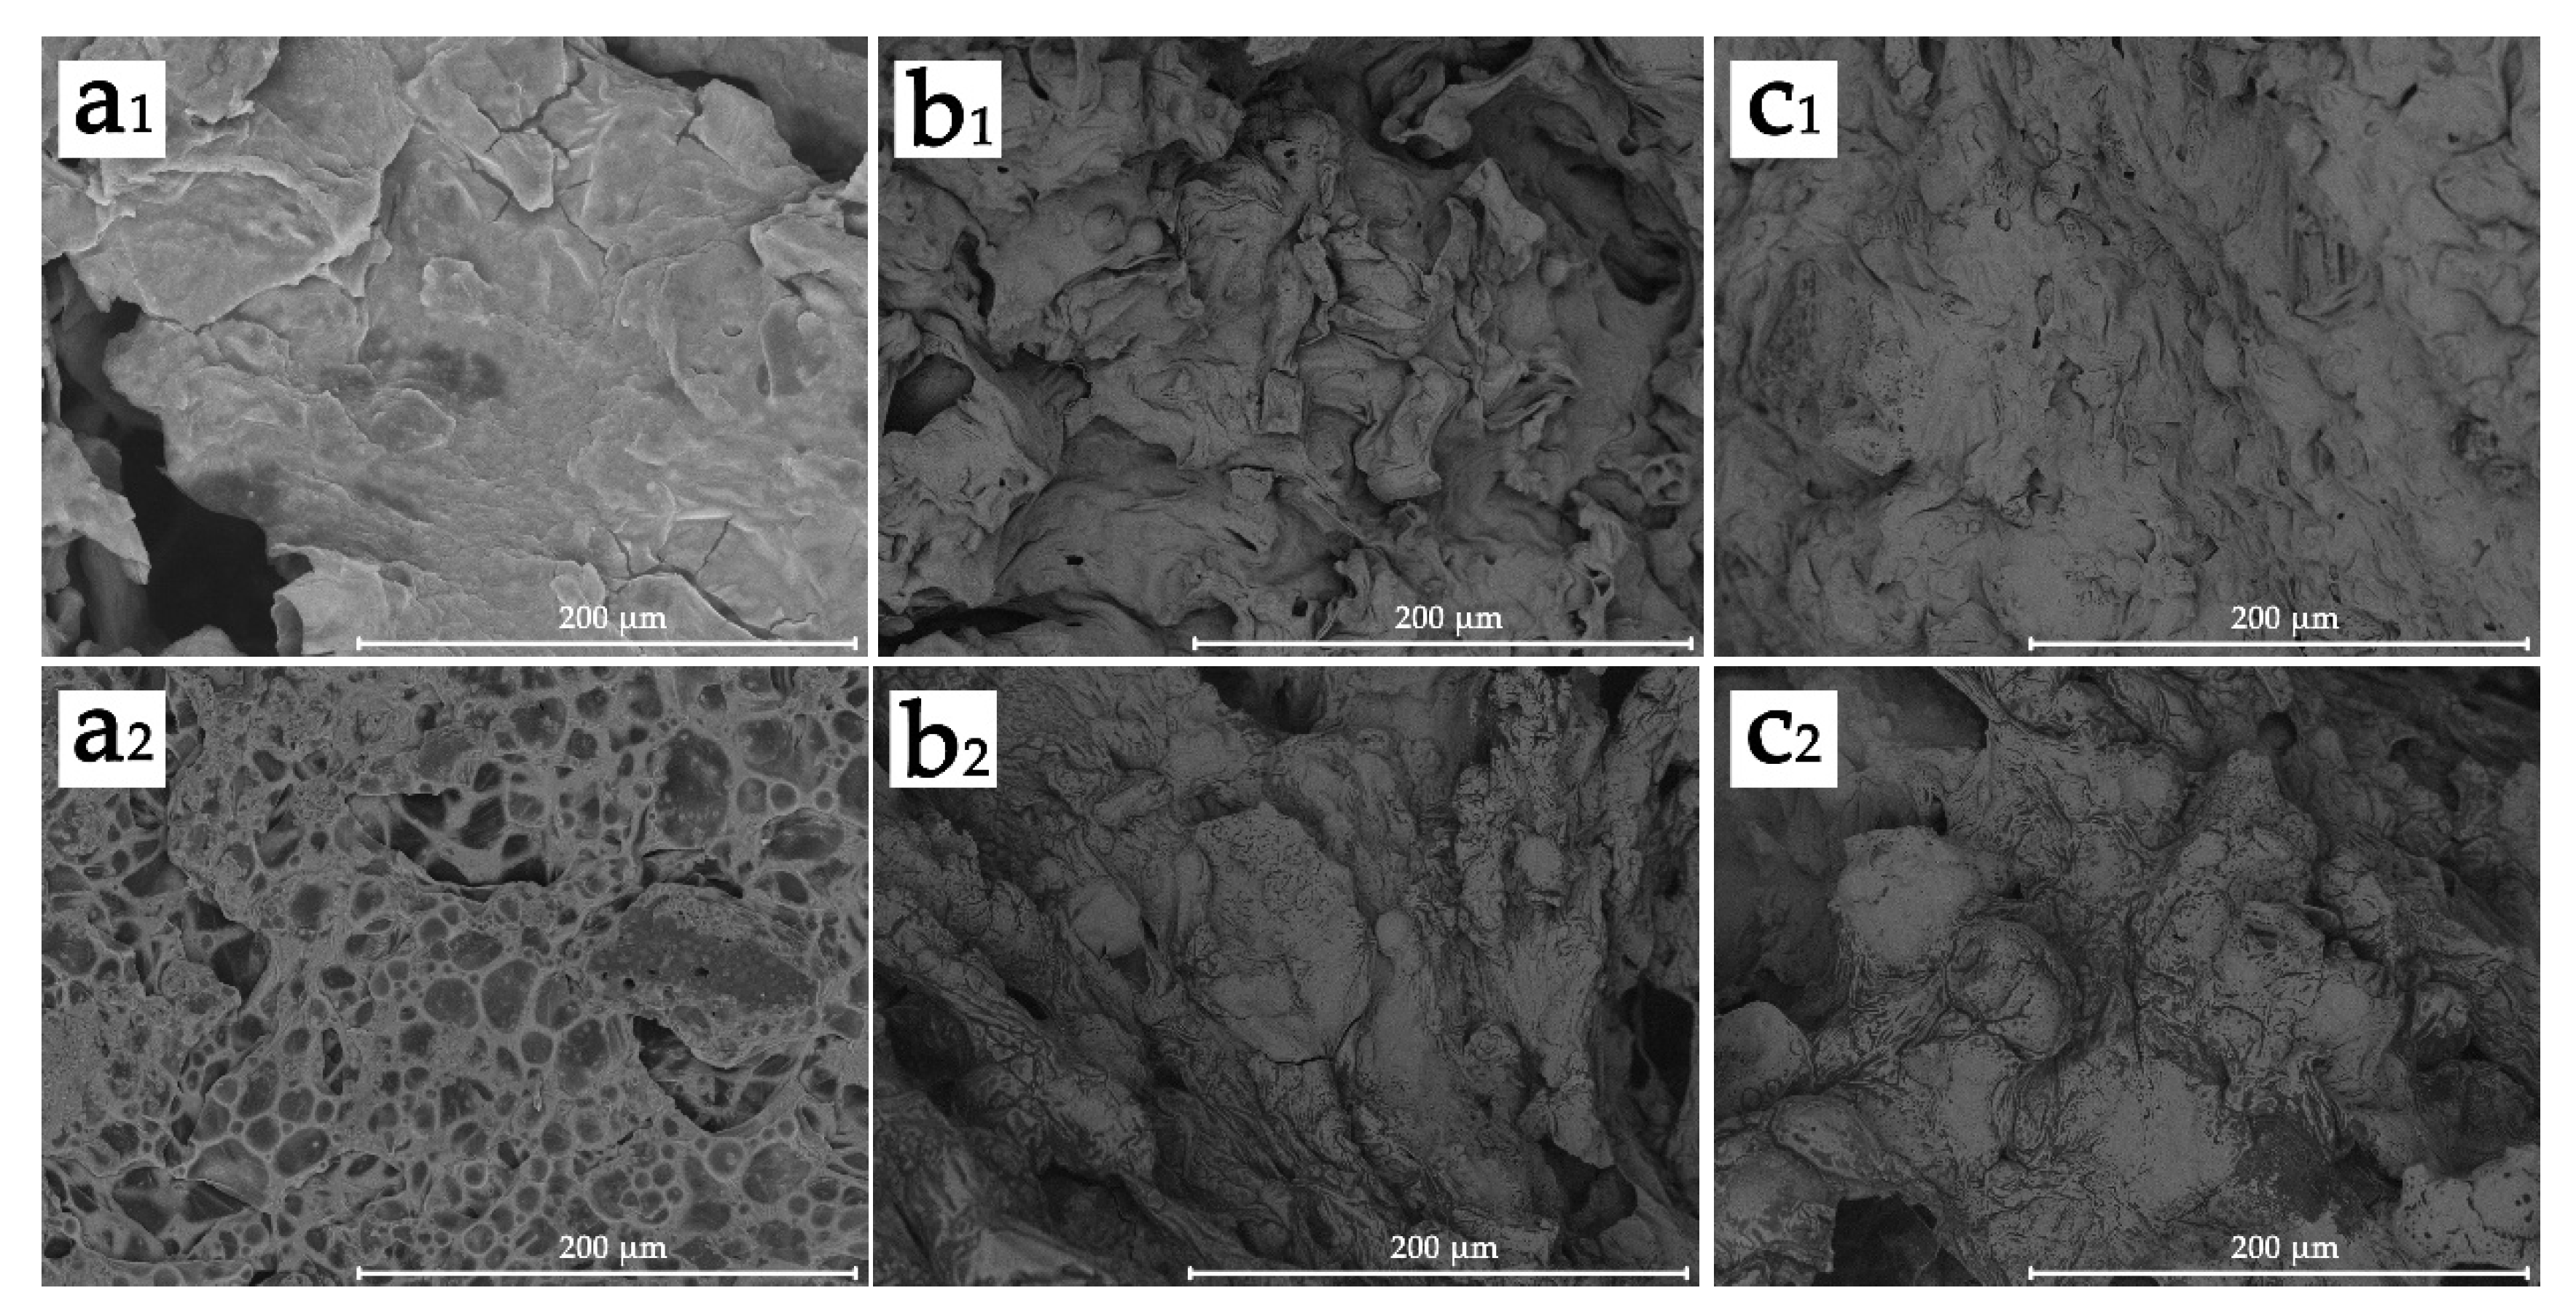
3.1.1. Micromorphology and Dispersibility

The surface morphology of BC and BC-m are shown in Figure 2. The original pore structure of the bamboo tissue can be clearly seen on the surface of BC particles (Figure 2a), while the surface of BC-m became amorphous (Figure 2b). There was little difference in particle size of BC before and after modification, which was mainly between 50 and 100 μm.
To investigate the dispersion in PLA, observation under SEM at low magnification (120×) was performed and the corresponding images are shown in Figure 3. Figure 3a1–3a3 show the fracture surface morphology with different BC-m addition levels indicating uniform distribution of BC-m in the polymer. At higher levels of BC-m (30%), the localized agglomeration of particles was evident (Figure 3a2) leading to a weak polymer-filler interface. The typical particle size of BC-m at the fracture surface was also analyzed, with results shown in Figure 4. A smaller particle size (mostly 20–26 μm) was observed due to cyclic extrusion of the screw during the melt compounding process.
The addition of CS (Figure 3b1,b2) improved the interfacial bonding, whereby no obvious delamination could be observed compared to if BC-m was added on its own. CS appears to facilitate BC-m dispersal and bonding with the PLA by acting as an interfacial adhesive.

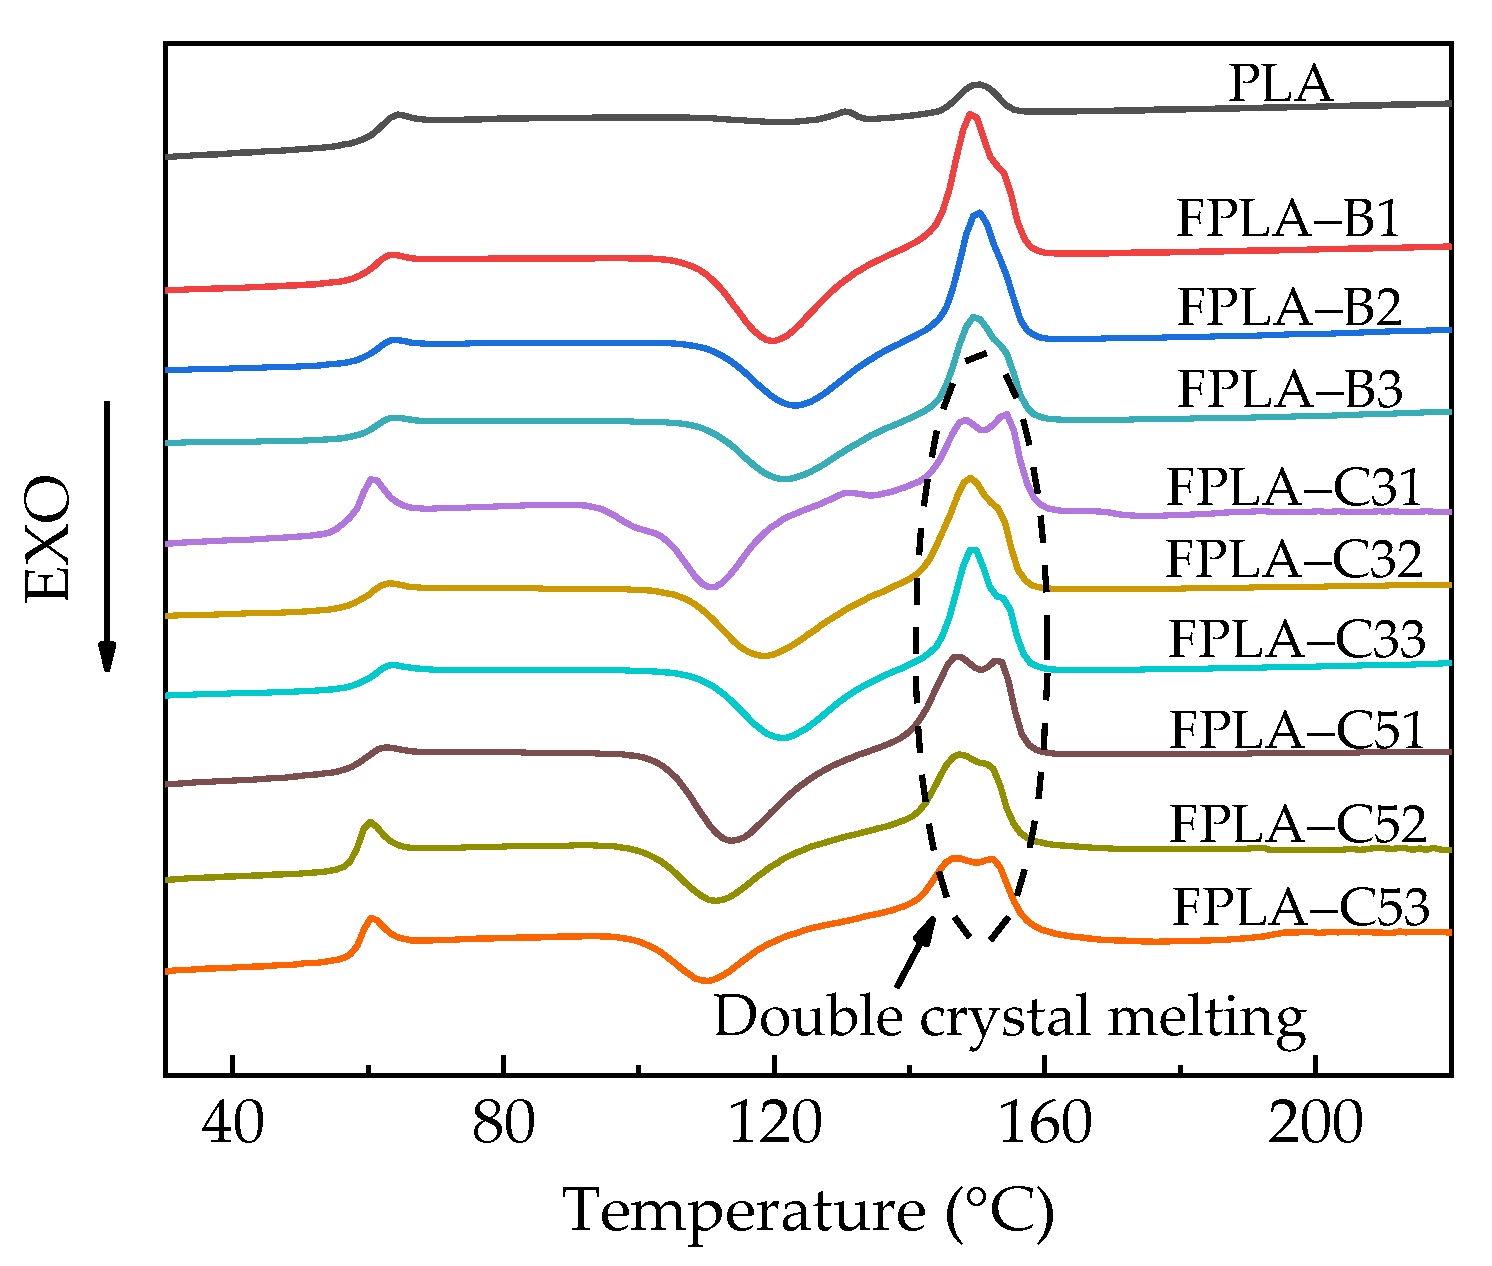
3.1.2. Thermal Properties

To investigate the thermodynamic properties of PLA and its blends, differential scanning calorimetry (DSC) was carried out with heat flow curves shown in Figure 5. Key data, such as glass transition temperature (Tg), cold crystallization temperature (Tcc), crystallization enthalpy (ΔHc), melting temperature (Tm), and melting enthalpy (ΔHm) are summarized in Table 2.
From Table 2, the Tg values decreased with the addition of BC and CS, likely caused by increased plasticization of the polymer [35,39]. At a particular level of BC-m (e.g., 20% as bold highlighted) Tg values were minimally affected by CS level but Xc increased. Higher molecular mobility also means that more energy is needed to achieve crystallization while weakening the capacity for non-isothermal crystallization [30,39], leading to an increase in Tcc by 15.1 °C at most. The nucleation by the fillers contributed greatly to the improvement of Xc. With the increasing addition of BC and CS, the Xc of composites increased from 0.9% to over 29%, the highest being FPLA-C33 with Xc = 38.92%, or 43 times that of pure PLA. The improvement of crystallization behavior also means that the thermal stability of the composite may be enhanced. Double melt crystallization peaks appeared with the addition of CS (Figure 5), especially at 3 wt.%, which may be attributed to incomplete cold crystallization at low temperatures resulting in the melting and recrystallization of α phase [17]. Equally, a slight decrease in Tm was observed with increase of CS content, as melting involves the same molecular movement condition [39]. The crystallization results suggest CS may play an important bridging role between BC-m and PLA by reducing the thickness and volume of the crystalline polymer interface [17].

3.1.3. X-ray Diffraction Analysis

X-ray diffraction was used to detect the differences in crystalline structure between PLA and FPLA composites (Figure 6). Only a broad diffraction peak for crystallinity in pure PLA at 16.7° was recorded, assigned to the α-phase crystallite [40,41]. Generally, the crystallization of pure PLA occurs too slowly to register any significant crystallinity, especially under the non-isothermal conditions encountered during extrusion and injection molding [41]. In contrast, a sharp crystallization peak at 16.7° appeared in FPLA-CS, consistent with DSC results. With the addition of BC-m and chitosan in different ratios, several new diffraction peaks at 2θ = 18.3°, 20.9°, 23.6°, 24.5°, and 28.8° appeared in the XRD curve. As reported previously, the peak at 2θ = 20.9° belongs to the graphitized structure of BC [17], and the 2θ = 24.5° and 28.8°corresponds to the β-form crystal structure [42]. The peak values of all FPLA materials increased and became sharp at 16.7°, which indicates the crystallinity index of PLA increased [43]. New peaks at 2θ = 18.3° and 23.6° suggest reorganization of the crystal structure [44].

3.2. Mechanical Properties

Figure 7 shows the tensile and flexural properties of the composites with different BC-m and CS addition levels, while the detailed data are listed in Table 3.
As noted in previous work [18], the tensile strength of FPLA-B composites decreases with increased BC-m addition, with a 11.09% decrease at 30 wt.% BC-m. Adding CS significantly improved the tensile properties as seen in Figure 7a,b and in Table 3 bold values of FPLA-B composites. CS at 5 wt.% produced the largest increases: 11.11% in tensile strength and 8.42% in tensile modulus. Flexural properties were less changed by CS addition (Figure 7c,d, Table 3). Typical stress-strain curves for CS-added FPLA-Cs are shown in Figure 7e,f. Note the elongation at break is more sensitive to the compatibilization effect in multicomponent blends compared with other mechanical properties [45]. Adding 20 wt.% BC-m and 3 wt.% or 5 wt.% CS produced a more ductile composite with elongation at the break reaching 6.94% and 7.08%, respectively, which is 2.20% and 8.59% higher than that of 10% BC-m added with same content of CS.
CS particles with medium viscosity are dispersed in advance forming a flexible membrane locally under the action of pressure and temperature and effectively promoting the interfacial bonding between the filler and matrix, as indicated through observation of fracture morphology and higher composite strength and the modulus results. The enhancement is limited to low doses of CS as it is strongly hydrophilic due to –OH and –NH2 groups along the chain [46], whereas PLA is strongly hydrophobic [47,48]. As CS loading increases, the extent of interfacial zones with different affinities leads to a weakening in interfacial adhesion and interaction [28].

3.3. Thermal Degradation Behavior

3.3.1. TG in N2

Selected TG and DTG curves of PLA, PLA/20BC-m, PLA/20BC-m/3CS, and PLA/20BC-m/5CS in nitrogen atmosphere are shown in Figure 8, and corresponding data for all mixes are shown in Table 4. The onset degradation temperature of samples is defined as the temperature at 5% weight loss (T−5%), and Tmax. is the temperature at the maximum rate of rate of mass loss.
Typical TG and DTG spectra for the constituents CS, BC, and BC-m under nitrogen (N2) atmosphere are shown in Figure 8a,b. CS started to thermally decompose at 103 °C. Rpeak occurred at 255 °C and the final carbon residue at 700 °C was 40.60%. In contrast, BC showed excellent thermal stability with almost no significant mass loss during pyrolysis. Rpeak was 0.32% at 295 °C and the final carbon residue was 93.39%. BC-m underwent rapid mass loss of its graft products at 382 °C and with a final carbon residue of 82.47%. The grafted phosphorous and nitrogen compounds on BC-m reduced the relative mass of pure BC in the filler by 10.94%.
Data for FPLA composites are shown in Figure 8c,d and Table 3, with notable contrasts for 20%BC-m with or without CS in bold highlight. FPLA composites were characterized by one Tmax and T-5% values were lower than for pure PLA, especially with CS addition. This is related to the early thermal decomposition of BC-m graft products in keeping with thermal degradation of IFRs [49,50] and contributing to its flame retardancy. The residue mass (RM) values of all FPLA were higher than pure PLA (0.60%) at 700 °C. The RM values of CS-added materials at the same level of BC-m content were higher again, suggesting a cooperative effect. This is evidenced by the RM being higher than the theoretical value for BC-m composites above 20% BC-m. The RM of FPLA-C52 (20%BC-m+5%CS) for example, was 29.42%, i.e., 55.1% higher than its theoretical value of 18.97%. BC-m decomposition produces phosphoric acid (PA) which accelerates the degradation of PLA in cooperation with higher content of CS further reducing T-5% and earlier char formation, potentially providing enhanced combustion resistance [21,33,34]. Note the increase in RM is limited at low (3%) CS addition level.

3.3.2. TG in Air

TG results in air are given in Figure 9 and Table 5.
Compared with nitrogen atmosphere, T-5% values increased that with 5 wt.% CS and T-5% values of FPLA-C51, FPLA-C52, and FPLA-C53 increased by 12 °C, 7 °C, and 3 °C, respectively. All values for Rpeak of the FPLA composites rose as well, while corresponding Tmax values decreased. Oxygen promotes the pyrolysis process of PLA by oxidizing the molecular chains [10], intensifying the pyrolysis reaction and promoting the formation of the carbonized char layer, resulting in earlier inhibition of mass loss. TGA results in air still indicate adding BC-m and CS as a cooperative system is effective in promoting the early formation of char residue but note here the much smaller difference between CS levels when added to a base level of 20%BC-m (bold in Table 5).

3.4. Combustion Characterization

3.4.1. LOI and UL-94

Flammability indices for PLA and FPLA composites (LOI and UL-94 tests) are summarized in Table 6 with contrasts for CS level with 20%BC-m in bold. Images of PLA and FPLA-C composites after the LOI tests are shown in Figure 10.
Pure PLA burns very easily and exhibited obvious melt dripping (Figure 10a) with a LOI of 20.7 vol%. CS has little flame retardancy if added alone; LOI values were increased slightly to 21.5 vol% and 21.7 vol%, respectively. Our previous findings [18] showed that with 20 and 30 wt.% addition of BC-m, LOI increased to 29.2 vol% and 32.1 vol%, respectively, and melt dripping was completely suppressed, achieving a UL-94 V-0 rating. However, 10 wt.% BC-m was insufficient to prevent melting [18]. With co- addition of CS, the expansion phenomenon at the burning tip became more obvious, as seen in Figure 10d,g. CS addition further increased the LOI of 20% BC-m from 29.2% vol% to 31.3 vol% and 32.4 vol% for the 3% and 5% CS addition, respectively.
The possible cooperative effect of adding BC-m and CS in combination was further explored using the Lewin and Weil concept of cooperative effectiveness (Ce) [51], calculated as follows [52]:
Ce = {(Fp)[fr+s] − (Fp)P}/{(Fp)fr − Fp)P) + ((Fp)s − (Fp)P}
where (Fp)P is the flame-retardant property of the polymer alone, (Fp)fr is the polymer containing BC-m, (Fp)s is the polymer with CS, and (Fp)[fr+s] is the polymer with cooperative filler system (BC-m+CS). Cooperative behavior of the additives is considered to occur with the combination of BC-m and CS if Ce > 1. Since the LOI values are usually used to evaluate combustion intensity and directly correspond with UL-94 and cone calorimetry indices, LOI values were used for Fp in Equation (2) [16,52]. Ce values were above 1 for BC-m+CS composites (Table 6) suggesting a cooperative effect. Overall, 20 wt.% BC-m with 5% CS was the most effective, in accord with the TGA results under N2 atmosphere.

3.4.2. Cone Calorimeter (CONE) Results

The appearance of char residues aids interpretation of CONE data [53]. Examples of chars from PLA and FPLA-C composites (at baseline 20% BC-m addition) after CONE tests are shown in Figure 11. With CS addition, the ‘puffiness’ of the char increased, as seen in Figure 11c2,d2. Key parameters include the heat release rate (HRR), total heat release (THR), total smoke release (TSR), residue mass (RM), and average effective heat of combustion (aEHC); with data for all samples given in Table 7. Selected curves for PLA, PLA+20%BC-m and this baseline with CS addition are shown for easier visual comparison in Figure 12.
HRR curves of selected samples are shown in Figure 12a, which a main factor indicating fire spread risk [54]. Contrasted CONE indices for PLA, PLA+20%BC-m and this baseline plus 3 or 5% CS addition are in bold in Table 7. The heat release of all specimens mainly occurred between 100 and 300 s. Peak heat release rate (pHRR) of pure PLA reached 435.58 kW/m2 and was reduced by just 4.01% when 10 wt.% BC-m was added [18]. Even at low BC-m addition, CS can be effective. From Table 7, co-adding 3 wt.% CS to this mix reduced pHRR to 216.33 kW/m2, a decrease of 50.34%. Adding 5 wt.% CS did not further limit heat release; in fact, for PLA/20%BC-m, adding 5 wt.% CS increased pHRR to 156.45 kW/m2 from 146.97 kW/m2 for 3% CS. CS addition significantly reduced THR and aEHC indices compared with PLA and PLA/20%BC-m (Figure 12b).
From Table 7 and Figure 12a,b pHRR and THR for the baseline PLA+20%BC-m were further reduced by CS addition, particularly 3%. For example pHRR was reduced by almost 27% by adding 3%CS to the baseline PLA+20% BC-m. Note from Figure 12c CS addition curtailed TSR after about 250s compared with adding BC-m on its own. It seems likely that the cooperation of CS and BC-m accelerates the development of expanded char and greater amounts of non-flammable gases with heating, producing a greater peak mass loss rate (pMLR) and TSR. The char barrier is effective and works by blocking heat and oxygen, as shown in the reductions in pHRR and THR [55] when CS was added to all levels of BC-m addition.

3.5. Residue Analysis

3.5.1. Morphology of Residue Surfaces and Inner Layers

The char residue on the outer and inner surface of FPLA-B and FPLA-C composites after CONE tests was analyzed by SEM, and the results are shown in Figure 13. When CS was not added, there was a dense char on the surface of the residue but with cavities (Figure 13a1), allowing heat and oxygen through. Adding CS helped produce a more continuous layer of char, as reflecting in the improved CONE test indices. Images of the internal char layer revealed changed morphology of the char layer. From previous work [18], PLA/BC-m, especially at 30% addition formed a distinct filled-pore structure shown in Figure 13a2. With CS addition the char was denser and well consolidated without bubbles, as shown in Figure 13b2,c2. An enhanced barrier role appears to be achieved through the cooperative effect of CS and incombustible gases and acids produced by the thermal decomposition of BC-m. Adding BC-m to PLA causes pyrophosphate products to fill the pores in the char produced by gases generated during the thermal degradation of BC-m graft products [18]. As combustion progresses, flame suppression transitions to the condensed phase protective mechanism.

3.5.2. Structure and Composition

In order to elucidate differences in the char residue structure, the residues of PLA, FPLA-B3, FPLA-C33, and FPLA-C53 (maximum level of BC-m addition) were analyzed by FTIR, with results shown in Figure 14a. The typical characteristic peaks of PLA at 1630 cm−1, 1760 cm−1, 2846 cm−1, and 2920 cm−1 were identified, corresponding to C=C, C=O, and symmetrical and asymmetrical stretching of –CH2– groups, respectively [56,57]. Adding BC-m and CS together produced significantly different spectra compared with PLA, with new absorption peaks at 996 cm−1, 1080 cm−1, and 1168 cm−1 in FPLA-C33 and FPLA-C53. These correspond to the stretching vibration of P=O, P–O–C, and P–O–P [56,58] from the graft products on BC-m, indicating pyrophosphates that contribute to the formation of char residue [56].
To further investigate the chemical element components of the char residues after CONE testing, XPS was performed with the corresponding spectra shown in Figure 14b. C and O contents exceeded 35%, making up the majority of the residue. C content increased with greater CS addition.
Specific spectra are shown in Figure 15 for elements on the surface of the carbon residue of FPLA-C53. From Figure 15a, the binding energy (BE) at 284.1 eV and 286.8 eV for C 1s peaks was assigned to C–C or C=C groups in aliphatic and aromatic fragments, or C–O in P–O–C groups, respectively, while the signal at 533.1 eV in Figure 15b corresponds to –O– in P–O–C [59]. The peak at 134.7 eV of the P 2p spectra in Figure 15c and 401.2 eV of N 1s spectra in Figure 15d correspond to the P–O–P bond and the C–N or C=N in the triazine structures, respectively [16,59,60]. Theoretically, the content of elemental C in FPLA-C33 and FPLA-C53 should be increased by 3% and 5% above that of the 30%BC-m addition, whereas the actual C values in the residue of these composites were 41.62% and 44.02%, respectively. A higher percentage of elemental C means that more organic matter in the composite remained after combustion testing. The results add further evidence that CS behaves cooperatively with BC-m dispersed in the PLA matrix leading to the formation of a denser and more stable expanded char layer structure containing P and N reflected in the detection of C–O–P, P–O–P, and C–N.

4. Conclusions

(1)
Co-adding 3 or 5 wt.% CS with BC-m to PLA enhanced tensile properties of PLA. CS is an interfacial adhesion promoter which improves the interfacial compatibility between BC-m and PLA. Adding 3 wt.% CS and 30 wt.% BC-m increased the crystallinity to 38.92% or 43 times that of pure PLA (0.9%). The internal crystal structure was reorganized by CS addition and the crystallinity index was increased.
(2)
TGA showed early thermal degradation of CS-added PLA/BC-m composites and enhanced residue mass. In nitrogen atmosphere co-adding 5 wt.% CS and 20 wt.% BC-m, the corresponding residue (29.4%) was 55.1% higher than the theoretical value (18.97%).
(3)
Co-adding 5 wt.% CS and 30 wt.% BC-m, increased LOI to 33.6 vol%; 4.7% higher than adding BC-m alone. UL-94 V-0 rating at low BC-m addition (10 wt.%) was improved correspondingly. Cooperative effectiveness analysis (Ce) on LOI results suggest that active cooperation between CS and BC-m improves the flame retardancy of PLA/BC-m composites.
(4)
CONE results showed very effective further combustion suppression with just 3% CS co-addition to the effective baseline of 20% or more BC-m addition. For example peak heat release rate (pHRR) was reduced by almost 27% for 3% CS + 20% BC-m, and total heat release (THR) was reduced by 30.5%. Analysis of char morphology, chemical elements, and structure reveals that CS and BC-m form a denser, more stable carbonized layer that is effective in heat and oxygen insulation, resulting in improved flame retardancy of PLA composites.
(5)
A mix of just 20 wt.% BC-m + 3 wt.% CS may be a viable flame-retardant system that meets the requirements for a non-toxic, strong and biodegradable PLA packaging product.

Author Contributions

The initial conceptualization and methodology of this project were conceived and originated by W.Z. and W.L., providing resources as well. Experiments were performed by L.Z., W.C. and W.L. and the data curation management was done by L.Z., W.C. and L.L., who completed the data curation. The original draft was written by W.L. and L.Z. with help of K.S. and N.Y. The manuscript was reviewed and edited by W.Z., K.S. and C.D. The supervision and project administration were performed by W.Z., W.L. and L.Z. The funding acquisition was supported by W.Z. and C.D. All authors have read and agreed to the published version of the manuscript.

Funding

This research was supported by key development projects of Zhejiang Province (2018C02008) and by Natural Sciences and Engineering Research Council of Canada (NSERC) through a Discovery Grant.

Institutional Review Board Statement

Not applicable.

Informed Consent Statement

Not applicable.

Data Availability Statement

The processed data required to reproduce these findings cannot be shared at this time since the data also contribute to part of an ongoing study.

Acknowledgments

The authors would like to acknowledge the Zhejiang Natural Science Foundation for the financial support of this research and the Zhejiang Academy of Forestry for the technical assistance. Financial support from Natural Sciences and Engineering Research Council of Canada (NSERC) through a discovery grant is also gratefully acknowledged.

Conflicts of Interest

The authors declare no conflict of interest.

References

  1. Zhou, X.; Li, J.; Wu, Y. Synergistic effect of aluminum hypophosphite and intumescent flame-retardants in polylactide. Polym. Adv. Technol. 2015, 26, 255–265. [Google Scholar] [CrossRef]
  2. Gu, L.; Qiu, J.; Qiu, C.; Yao, Y.; Sakai, E.; Yang, L. Mechanical properties and degrading behaviors of aluminum hypophosphite-poly (Lactic Acid) (PLA) nanocomposites. Polym. Plast. Technol. Mater. 2019, 58, 126–138. [Google Scholar] [CrossRef]
  3. Nurul Fazita, M.R.; Jayaraman, K.; Bhattacharyya, D.; Mohamad Haafiz, M.K.; Saurabh, C.K.; Hussin, M.H.; HPS, A.K. Green composites made of bamboo fabric and poly (lactic) acid for packaging applications—A review. Materials 2016, 9, 435. [Google Scholar] [CrossRef] [PubMed]
  4. Hwang, S.W.; Shim, J.K.; Selke, S.E.; Soto-Valdez, H.; Matuana, L.; Rubino, M.; Auras, R. Poly (L-lactic acid) with added α-tocopherol and resveratrol: Optical, physical, thermal and mechanical properties. Polym. Int. 2012, 61, 418–425. [Google Scholar] [CrossRef]
  5. Armentano, I.; Bitinis, N.; Fortunati, E.; Mattioli, S.; Rescignano, N.; Verdejo, R.; Lopez-Manchadob, M.A.; Kenny, J.M. Multifunctional nanostructured PLA materials for packaging and tissue engineering. Prog. Polym. Sci. 2013, 38, 1720–1747. [Google Scholar] [CrossRef] [Green Version]
  6. Graupner, N.; Herrmann, A.S.; Müssig, J. Natural and man-made cellulose fibre-reinforced poly (lactic acid)(PLA) composites: An overview about mechanical characteristics and application areas. Compos. Part A Appl. Sci. Manuf. 2009, 40, 810–821. [Google Scholar] [CrossRef]
  7. Zhan, J.; Liu, X.; Cao, C. Synergistic effect of OZrP on the combustion properties and thermal degradation behavior of intumescent flame retardant polylactide. In IOP Conference Series: Materials Science and Engineering; IOP: London, UK, 2020; Volume 740, p. 012070. [Google Scholar]
  8. Senatov, F.S.; Niaza, K.V.; Zadorozhnyy, M.Y.; Maksimkin, A.V.; Kaloshkin, S.D.; Estrin, Y.Z. Mechanical properties and shape memory effect of 3D-printed PLA-based porous scaffolds. J. Mech. Behav. Biomed. Mater. 2016, 57, 139–148. [Google Scholar] [CrossRef]
  9. Li, S.; Yuan, H.; Yu, T.; Yuan, W.; Ren, J. Flame-retardancy and anti-dripping effects of intumescent flame-retardant incorporating montmorillonite on poly(lactic acid). Polym. Adv. Technol. 2009, 20, 1114–1120. [Google Scholar] [CrossRef]
  10. Tang, G.; Wang, X.; Xing, W.; Zhang, P.; Wang, B.; Hong, N.; Yang, W.; Hu, Y.; Song, L. Thermal degradation and flame retardance of biobased polylactide composites based on aluminum hypophosphite. Ind. Eng. Chem. Res. 2012, 51, 12009–12016. [Google Scholar] [CrossRef]
  11. Laoutid, F.; Bonnaud, L.; Alexandre, M.; Lopez-Cuesta, J.M.; Dubois, P. New prospects in flame-retardant polymer materials: From fundamentals to nanocomposites. Mater. Sci. Eng. R Rep. 2009, 63, 100–125. [Google Scholar] [CrossRef]
  12. Li, L.; Mao, X.; Ju, R.; Chen, Y.; Qian, L. Synergistic effect of organo-montmorillonite on intumescent flame-retardant PLA. Ferroelectrics 2018, 527, 25–36. [Google Scholar] [CrossRef]
  13. Gu, L.; Qiu, J.; Yao, Y.; Sakai, E.; Yang, L. Functionalized MWCNTs modified flame retardant PLA nanocomposites and cold rolling process for improving mechanical properties. Compos. Sci. Technol. 2018, 161, 39–49. [Google Scholar] [CrossRef]
  14. Vahabi, H.; Shabanian, M.; Aryanasab, F.; Mangin, R.; Laoutid, F.; Saeb, M.R. Inclusion of modified lignocellulose and nano-hydroxyapatite in development of new bio-based adjuvant flame retardant for poly (lactic acid). Thermochim. Acta 2018, 666, 51–59. [Google Scholar] [CrossRef]
  15. Shabanian, M.; Hajibeygi, M.; Hedayati, K.; Khaleghi, M.; Khonakdar, H.A. New ternary PLA/organoclay-hydrogel nanocomposites: Design, preparation and study on thermal, combustion and mechanical properties. Mater. Des. 2016, 110, 811–820. [Google Scholar] [CrossRef]
  16. Wang, S.; Zhang, L.; Semple, K.; Zhang, M.; Zhang, W.; Dai, C. Development of biodegradable flame-retardant bamboo charcoal composites, Part I: Thermal and elemental analyses. Polymers 2020, 12, 2217. [Google Scholar] [CrossRef]
  17. Wang, S.; Zhang, L.; Semple, K.; Zhang, M.; Zhang, W.; Dai, C. Development of biodegradable flame-retardant bamboo charcoal composites, Part II: Thermal degradation, gas phase, and elemental analyses. Polymers 2020, 12, 2238. [Google Scholar] [CrossRef] [PubMed]
  18. Zhang, L.; Chai, W.; Li, W.; Kate Semple k Yin, N.; Zhang, W.; Dai, C. Intumescent-Grafted Bamboo Charcoal: A Natural Nontoxic Fire-Retardant Filler for Polylactic Acid (PLA) Composites; ACS OMEGA: Washington, DC, USA, 2021; in press. [Google Scholar]
  19. Feng, C.; Liang, M.; Jiang, J.; Huang, J.; Liu, H. Flame retardant properties and mechanism of an efficient intumescent flame retardant PLA composites. Polym. Adv. Technol. 2016, 27, 693–700. [Google Scholar] [CrossRef]
  20. Zhang, T.; Yan, H.; Shen, L.; Fang, Z.; Zhang, X.; Wang, J.; Zhang, B. Chitosan/phytic acid polyelectrolyte complex: A green and renewable intumescent flame retardant system for ethylene–vinyl acetate copolymer. Ind. Eng. Chem. Res. 2014, 53, 19199–19207. [Google Scholar] [CrossRef]
  21. Shi, X.; Jiang, S.; Hu, Y.; Peng, X.; Yang, H.; Qian, X. Phosphorylated chitosan-cobalt complex: A novel green flame retardant for polylactic acid. Polym. Adv. Technol. 2018, 29, 860–866. [Google Scholar] [CrossRef]
  22. Wang, X.; Xing, W.; Wang, B.; Wen, P.; Song, L.; Hu, Y.; Zhang, P. Comparative study on the effect of beta-cyclodextrin and polypseudorotaxane as carbon sources on the thermalstability and flame-retardance of polylactic acid. Ind. Eng. Chem. Res. 2013, 52, 3287–3294. [Google Scholar] [CrossRef]
  23. Wang, J.; Ren, Q.; Zheng, W.; Zhai, W. Improved flame-retardant properties of poly(lactic acid) foams using starch as a natural charring agent. Ind. Eng. Chem. Res. 2014, 53, 1422–1430. [Google Scholar] [CrossRef]
  24. Zhang, R.; Xiao, X.; Tai, Q.; Huang, H.; Hu, Y. Modification of lignin and its application as char agent in intumescent flame-retardant poly(lactic acid). Polym. Eng. Sci. 2012, 52, 2620–2626. [Google Scholar] [CrossRef]
  25. Réti, C.; Casetta, M.; Duquesne, S.; Bourbigot, S.; Delobel, R. Flammability properties of intumescent PLA including starch and lignin. Polym. Adv. Technol. 2008, 19, 628–635. [Google Scholar] [CrossRef]
  26. Costes, L.; Laoutid, F.; Brohez, S.; Dubois, P. Bio-based flame retardants: When nature meets fire protection. Mater. Sci. Eng. R Rep. 2017, 117, 1–25. [Google Scholar] [CrossRef]
  27. Amri, F.; Husseinsyah, S.; Hussin, K. Mechanical, morphological and thermal properties of chitosan filled polypropylene composites: The effect of binary modifying agents. Compos. Part A Appl. Sci. Manuf. 2013, 46, 89–95. [Google Scholar] [CrossRef]
  28. Thakur, V.K.; Thakur, M.K. Recent advances in graft copolymerization and applications of chitosan: A review. ACS Sustain. Chem. Eng. 2014, 2, 2637–2652. [Google Scholar] [CrossRef]
  29. Chen, C.; Gu, X.; Jin, X.; Sun, J.; Zhang, S. The effect of chitosan on the flammability and thermal stability of polylactic acid/ammonium polyphosphate biocomposites. Carbohydr. Polym. 2017, 157, 1586–1593. [Google Scholar] [CrossRef]
  30. Bertolino, V.; Cavallaro, G.; Milioto, S.; Lazzara, G. Polysaccharides/Halloysite nanotubes for smart bionanocomposite materials. Carbohydr. Polym. 2020, 245, 116502. [Google Scholar] [CrossRef] [PubMed]
  31. Cavallaro, G.; Micciulla, S.; Chiappisi, L.; Lazzara, G. Chitosan-based smart hybrid materials: A physico-chemical perspective. J. Mater. Chem. B 2021, 9, 597–611. [Google Scholar] [CrossRef] [PubMed]
  32. Hu, S.; Song, L.; Pan, H.; Hu, Y. Thermal properties and combustion behaviors of chitosan based flame retardant combining phosphorus and nickel. Ind. Eng. Chem. Res. 2012, 51, 3663–3669. [Google Scholar] [CrossRef]
  33. Fang, F.; Zhang, X.; Meng, Y.; Gu, Z.; Bao, C.; Ding, X.; Li, S.; Chen, X.; Tian, X. Intumescent flame retardant coatings on cotton fabric of chitosan and ammonium polyphosphate via layer-by-layer assembly. Surf. Coat. Technol. 2015, 262, 9–14. [Google Scholar] [CrossRef]
  34. Hu, S.; Song, L.; Pan, H.; Hu, Y.; Gong, X. Thermal properties and combustion behaviors of flame retarded epoxy acrylate with a chitosan based flame retardant containing phosphorus and acrylate structure. J. Anal. Appl. Pyrolysis 2012, 97, 109–115. [Google Scholar] [CrossRef]
  35. Qian, S.; Sheng, K.; Yao, W.; Yu, H. Poly (lactic acid) biocomposites reinforced with ultrafine bamboo-char: Morphology, mechanical, thermal, and water absorption properties. J. Appl. Polym. Sci. 2016, 133, 43425. [Google Scholar] [CrossRef]
  36. Standard Test Method for Plastics-Determination of Burning Behaviour by Oxygen Index; ISO 4589-2; ISO: Geneva, Switzerland, 2017.
  37. Standard Test Method for Measuring the Comparative Burning Characteristics of Solid Plastics in A Vertical Position; ATSM D3801-10; ASTM: Philadelphia, PA, USA, 2020.
  38. Reaction to Fire Tests-Heat Release, Smoke Production and Mass Loss Rate; ISO 5660-1; ISO: Geneva, Switzerland, 2015.
  39. Ho, M.P.; Lau, K.T.; Wang, H.; Hui, D. Improvement on the properties of polylactic acid (PLA) using bamboo charcoal particles. Compos. Part B Eng. 2015, 81, 14–25. [Google Scholar] [CrossRef]
  40. Halász, K.; Csóka, L. Plasticized biodegradable poly (lactic acid) based composites containing cellulose in micro-and nanosize. J. Eng. 2013, 329379. [Google Scholar] [CrossRef] [Green Version]
  41. Zhai, W.; Ko, Y.; Zhu, W.; Wong, A.; Park, C.B. A study of the crystallization, melting, and foaming behaviors of polylactic acid in compressed CO2. Int. J. Mol. Sci. 2009, 10, 5381–5397. [Google Scholar] [CrossRef] [PubMed]
  42. Yasuniwa, M.; Tsubakihara, S.; Iura, K.; Ono, Y.; Dan, Y.; Takahashi, K. Crystallization behavior of poly (L-lactic acid). Polymer 2006, 47, 7554–7563. [Google Scholar] [CrossRef]
  43. Spiridon, I.; Paduraru, O.M.; Zaltariov, M.F.; Darie, R.N. Influence of keratin on polylactic acid/chitosan composite properties. Behavior upon accelerated weathering. Ind. Eng. Chem. Res. 2013, 52, 9822–9833. [Google Scholar] [CrossRef]
  44. Mihai, M.; Huneault, M.A.; Favis, B.D. Crystallinity development in cellular poly (lactic acid) in the presence of supercritical carbon dioxide. J. Appl. Polym. Sci. 2009, 113, 2920–2932. [Google Scholar] [CrossRef] [Green Version]
  45. Bian, Y.; Han, C.; Han, L.; Lin, H.; Zhang, H.; Bian, J.; Dong, L. Toughening mechanism behind intriguing stress–strain curves in tensile tests of highly enhanced compatibilization of biodegradable poly (lactic acid)/poly (3-hydroxybutyrate-co-4-hydroxybutyrate) blends. RSC Adv. 2014, 4, 41722–41733. [Google Scholar] [CrossRef]
  46. Zhang, Y.Z.; Su, B.; Ramakrishna, S.; Lim, C.T. Chitosan nanofibers from an easily electrospinnable UHMWPEO-doped chitosan solution system. Biomacromolecules 2008, 9, 136–141. [Google Scholar] [CrossRef]
  47. Boonyeun, N.; Rujiravanit, R.; Saito, N. Deposition of carbon–tungsten carbide on coir pulp to improve its compatibility with polylactic acid. Cellulose 2021, 28, 4119–4136. [Google Scholar] [CrossRef]
  48. Husseinsyah, S.; Amri, F.; Husin, K.; Ismail, H. Mechanical and thermal properties of chitosan-filled polypropylene composites: The effect of acrylic acid. J. Vinyl Addit. Technol. 2011, 17, 125–131. [Google Scholar] [CrossRef]
  49. Shukor, F.; Hassan, A.; Islam, M.S.; Mokhtar, M.; Hasan, M. Effect of ammonium polyphosphate on flame-retardancy, thermal stability and mechanical properties of alkali treated kenaf fiber filled PLA biocomposites. Mater. Des. 2014, 54, 425–429. [Google Scholar] [CrossRef]
  50. Jing, J.; Zhang, Y.; Tang, X.; Zhou, Y.; Li, X.; Kandola, B.K.; Fang, Z. Layer by layer deposition of polyethylenimine and bio-based polyphosphate on ammonium polyphosphate: A novel hybrid for simultaneously improving the flame-retardancy and toughness of polylactic acid. Polymer 2017, 108, 361–371. [Google Scholar] [CrossRef]
  51. Lewin, M.; Weil, E.D. Mechanisms and modes of action in flame retardancy of polymers. Fire Retard. Mater. 2001, 1, 31–68. [Google Scholar]
  52. Horrocks, A.R.; Smart, G.; Nazaré, S.; Kandola, B.; Price, D. Quantification of zinc hydroxystannate** and stannate** synergies in halogen-containing flame-retardant polymeric formulations. J. Fire Sci. 2010, 28, 217–248. [Google Scholar] [CrossRef]
  53. Schartel, B.; Bartholmai, M.; Knoll, U. Some comments on the use of cone calorimeter data. Polym. Degrad. Stab. 2005, 88, 540–547. [Google Scholar] [CrossRef]
  54. Kim, H.; Kim, D.W.; Vasagar, V.; Ha, H.; Nazarenko, S.; Ellison, C.J. Polydopamine-graphene oxide flame retardant nanocoatings applied via an aqueous liquid crystalline scaffold. Adv. Funct. Mater. 2018, 28, 1803172. [Google Scholar] [CrossRef]
  55. Hassan, M.; Nour, M.; Abdelmonem, Y.; Makhlouf, G.; Abdelkhalik, A. Synergistic effect of chitosan-based flame retardant and modified clay on the flammability properties of LLDPE. Polym. Degrad. Stab. 2016, 133, 8–15. [Google Scholar] [CrossRef]
  56. Yin, W.; Chen, L.; Lu, F.; Song, P.; Dai, J.; Meng, L. Mechanically robust, flame-retardant poly (lactic acid) biocomposites via combining cellulose nanofibers and ammonium polyphosphate. ACS Omega 2018, 3, 5615–5626. [Google Scholar] [CrossRef]
  57. Tang, G.; Zhang, R.; Wang, X.; Wang, B.; Song, L.; Hu, Y.; Gong, X. Enhancement of flame retardant performance of bio-based polylactic acid composites with the incorporation of aluminum hypophosphite and expanded graphite. J. Macromol. Sci. Part A 2013, 50, 255–269. [Google Scholar] [CrossRef]
  58. Yu, Y.; Song, P.A.; Jin, C.; Fu, S.; Zhao, L.; Wu, Q.; Ye, J. Catalytic effects of nickel (cobalt or zinc) acetates on thermal and flammability properties of polypropylene-modified lignin composites. Ind. Eng. Chem. Res. 2012, 51, 12367–12374. [Google Scholar] [CrossRef]
  59. Xu, B.; Ma, W.; Shao, L.; Qian, L.; Qiu, Y. Enhancement of an organic–metallic hybrid charring agent on flame retardancy of ethylene-vinyl acetate copolymer. R. Soc. Open Sci. 2019, 6, 181413. [Google Scholar] [CrossRef] [PubMed] [Green Version]
  60. Prabhakar, M.N.; Raghavendra, G.M.; Vijaykumar, B.V.D.; Patil, K.; Seo, J.; Jung-il, S. Synthesis of a novel compound based on chitosan and ammonium polyphosphate for flame retardancy applications. Cellulose 2019, 26, 8801–8812. [Google Scholar] [CrossRef]
Figure 1. Schematic diagram of composite preparation and testing.
Polymers 13 02167 g001
Figure 2. SEM images of surface morphology: (a) BC and (b) BC-m.
Polymers 13 02167 g002
Figure 3. SEM images of fracture surface morphology: (a1) FPLA-B1, (a2) FPLA-B2, (a3) FPLA-B3, (b1) FPLA-C31, (b2) FPLA-C32, (b3) FPLA-C33, (c1) FPLA-C51, (c2) FPLA-C52, and (c3) FPLA-C53.
Polymers 13 02167 g003
Figure 4. Typical particle size distribution of BC-m particles on fracture surface.
Polymers 13 02167 g004
Figure 5. Heat flow curves of PLA and its blends.
Polymers 13 02167 g005
Figure 6. Diffraction patterns of PLA and FPLA composites.
Polymers 13 02167 g006
Figure 7. Average mechanical properties of FPLA-B and FPLA-C composites: (a) tensile strength, (b) tensile modulus, (c) flexural strength, and (d) flexural modulus; as well as typical tensile stress-strain curves of a selected sample: (e) FPLA-B composites and (f) FPLA-C composites.
Polymers 13 02167 g007
Figure 8. Typical TGA (a,c) and DTG (b,d) curves of CS, BC; BC-m, PLA, and FPLA composites in N2.
Polymers 13 02167 g008
Figure 9. TGA (a) and DTG (b) curves of FPLA composites in air.
Polymers 13 02167 g009
Figure 10. Digital images of PLA and FPLA composites after LOI tests: (a) pure PLA; (b) 3CS/10BC-m/87PLA; (c) 3CS/20BC-m/77PLA; (d) 3CS/30BC-m/67PLA; (e) 5CS/10BC-m/85PLA; (f) 5CS/20BC-m/75PLA; (g) 5CS/30BC-m/65PLA.
Polymers 13 02167 g010
Figure 11. Images of carbon residues of PLA and FPLA composites after CONE tests: (a1,a2) PLA, (b1,b2) FPLA-B2, (c1,c2) FPLA-C32, and (d1,d2) FPLA-C52.
Polymers 13 02167 g011
Figure 12. Typical CONE test results of PLA and FPLA composites: (a) HRR, (b) THR, (c) TSR, and (d) mass.
Polymers 13 02167 g012
Figure 13. SEM images of residues on outer surface ((a1): FPLA-B3; (b1): FPLA-C33; (c1): FPLA-C53) and internal surface ((a2): FPLA-B3; (b2): FPLA-C33; (c2): FPLA-C53) from FPLA composites after cone tests.
Polymers 13 02167 g013
Figure 14. (a) FTIR curves and (b) XPS spectra of the residue char for PLA, FPLA-B3, FPLA-C33, and FPLA-53.
Polymers 13 02167 g014
Figure 15. Spectra for char residues of FPLA-C53: (a) C 1s, (b) O 1s, (c) P 2p, and (d) N 1s.
Polymers 13 02167 g015
Table 1. Formulations for PLA and its blends.
Scheme 100Composition (wt.%)
PLABC-mCS
PLA10000
FPLA-C39703
FPLA-C59505
FPLA-B190100
FPLA-B280200
FPLA-B370300
FPLA-C3187103
FPLA-C3277203
FPLA-C3367303
FPLA-C5185105
FPLA-C5275205
FPLA-C5365305
Table 2. DSC indices for PLA and FPLA composites.
SampleTg (°C)Tcc (°C)Tm1 (°C)Tm2 (°C)ΔHc (J/g)ΔHm (J/g)Xc (%)
PLA59.1108.1150.8-0.844.060.90
FPLA-B158.1119.8149.2-27.3927.7732.51
FPLA-B258.4123.2150.1-22.2722.8729.74
FPLA-B358.7121.6149.7-21.2620.7132.45
FPLA-C3156.9110.8148.2154.227.1920.9833.39
FPLA-C3257.1118.4149.0-25.6324.4435.56
FPLA-C3358.1121.1149.3-24.4123.3638.92
FPLA-C5157.1114.0147.2152.930.4328.838.25
FPLA-C5257.2120.4148.7154.025.9125.1836.91
FPLA-C5357.6112.1145.1152.618.9918.1631.21
Table 3. Mechanical properties of the FPLA-B and FPLA-C composites.
SampleTensile Strength (MPa)Tensile Modulus (MPa)Flexural Strength (MPa)Flexural Modulus (GPa)
a PLA58.12 ± 1.76774.24 ± 33.4395.76 ± 0.803.73 ± 0.17
a FPLA-B155.91 ± 2.23917.06 ± 77.7484.15 ± 2.183.75 ± 0.08
a FPLA-B251.94 ± 1.77941.15 ±141.3387.01 ± 1.903.81 ± 0.32
a FPLA-B349.71 ± 0.88995.70 ± 112.2081.77 ± 1.654.28 ± 0.34
FPLA-C3157.40 ± 1.83955.02 ± 56.0385.95 ± 2.843.78 ± 0.21
FPLA-C3255.84 ± 0.67985.16 ± 42.7587.70 ± 2.944.10 ± 0.19
FPLA-C3353.56 ± 1.021026.41 ± 27.4189.37 ± 3.943.94 ± 0.12
FPLA-C5158.00 ± 1.61976.00 ± 47.3089.40 ± 2.683.81 ± 0.19
FPLA-C5257.71 ± 1.571020.43 ± 41.1487.55 ± 3.903.96 ± 0.38
FPLA-C5353.54 ± 1.77999.86 ± 32.4490.12 ± 3.873.95 ± 0.14
Notes: a Reprinted with permission from ref [18]. Copyright 2021 American Chemical Society. Copyright Liang Zhang, Weisheng Chai, Wenzhu Li, Kate Semple, Ningning Yin, Wenbiao Zhang, Chunping Dai.
Table 4. TGA data of PLA and FPLA composites in N2.
SamplesT-5% (°C)Rpeak/Tmax (%·min−1/°C)Residue Mass (%)
700 (°C)
BC4840.32/29593.39
BC-m3732.66/38282.47
CS1031.92/25540.60
PLA3435.72/3820.60
a FPLA-B133425.33/3858.64
a FPLA-B233120.94/38321.81
a FPLA-B333119.52/38029.83
FPLA-C3131622.24/3658.97
FPLA-C3231421.14/36224.92
FPLA-C3331118.81/35929.56
FPLA-C5131223.46/3659.64
FPLA-C5230619.55/36029.42
FPLA-C5330418.65/35632.74
Notes: a Reprinted with permission from ref [18]. Copyright 2021 American Chemical Society. Copyright Liang Zhang, Weisheng Chai, Wenzhu Li, Kate Semple, Ningning Yin, Wenbiao Zhang, Chunping Dai.
Table 5. TGA data of FPLA composites under air condition.
SamplesT-5% (°C)Rpeak/Tmax (%·min−1/°C)Residue Mass (%)
700 (°C)
FPLA-C3131738.48/3633.01
FPLA-C3231436.57/3626.99
FPLA-C3331125.30/35810.48
FPLA-C5132439.14/3604.30
FPLA-C5231337.76/3608.10
FPLA-C5330722.90/35510.70
Table 6. LOI and UL-94 results of PLA and FPLA composites.
SamplesLOI ± 0.2 (vol%)UL-94Ce
a t1 (s)/t2 (s)DrippingRating
PLA20.7b TBYesc NR-
FPLA-C321.5TBYesNR-
FPLA-C521.7TBYesNR-
d FPLA-B128.05.6/2.3YesV-2-
d FPLA-B229.22.1/1.1NoV-0-
d FPLA-B332.11.2/1.4NoV-0-
FPLA-C3129.04.7/2.0NoV-11.02
FPLA-C3231.31.9/1.1NoV-01.14
FPLA-C3333.01.2/1.3NoV-01.01
FPLA-C5129.24.6/2.1NoV-11.02
FPLA-C5232.41.8/1.2NoV-01.23
FPLA-C5333.61.0/1.0NoV-01.04
a average combustion times after the first and second applications of the flame; b TB = totally burnt down to clamp; c No rating; d Reprinted with permission from ref [18]. Copyright 2021 American Chemical Society. Copyright Liang Zhang, Weisheng Chai, Wenzhu Li, Kate Semple, Ningning Yin, Wenbiao Zhang, Chunping Dai.
Table 7. a Cone calorimeter results for each sample at 35 kW/m2.
SamplesTTI (s)pHRR (kW/m2)THR (MJ/m2)pMLR (g/s)aEHC (MJ/kg)RM (%)
PLA56435.5886.060.6016.372.29
b FPLA-B134418.1168.640.5116.156.45
b FPLA-B233201.0253.480.4815.0818.99
b FPLA-B331181.6141.100.3514.5247.71
FPLA-C3137216.3354.190.6712.288.36
FPLA-C3235146.9737.170.6112.0423.17
FPLA-C3334123.3829.000.3711.0135.99
FPLA-C5136268.5642.040.5212.688.22
FPLA-C5237156.8538.790.7411.6726.26
FPLA-C5334125.4925.650.5310.6638.18
Notes: a TTI, time to ignition, ±2 s; pHRR, peak heat release rate, ±15 kW/m2; pMLR, peak mass loss rate, ±0.05 g/s; aEHC, average effective heat of combustion within 180 s, ±2 MJ/kg; b Reprinted with permission from ref [18]. Copyright 2021 American Chemical Society. Copyright Liang Zhang, Weisheng Chai, Wenzhu Li, Kate Semple, Ningning Yin, Wenbiao Zhang, Chunping Dai.
Publisher’s Note: MDPI stays neutral with regard to jurisdictional claims in published maps and institutional affiliations.

