1. Introduction
In recent decades, energy derived from fossil fuels has become harmful to the climate and its sources are decreasing with time [
1]; that is why electric vehicles are expected to replace vehicles in which gasoline is used as an energy source. To overcome that deprivation of this energy in the future, batteries are considered to be one of the significant methods of storing energy that is being produced by different sources. Lithium-ion batteries have proven to be very profitable, and they are used in many electronic gadgets [
2]. Moreover, they are also not used in various electric sources, such as mobile phones, laptops, and cameras, but are widely used as energy storage systems in electric vehicles due to their high capacity, low self-discharge, long life, high energy density, and low climatic effect characteristics. In some conditions, lithium batteries have also proven to be the cause of thermal runaway, mechanical abuse, and release of toxic gases [
2,
3,
4,
5]. Thus, interest in lithium-ion batteries from researchers has increased in recent years [
6,
7,
8,
9,
10,
11]. Electrochemical technologies are particularly significant in present society, and it is an exciting time for researchers that are active in this sector [
12]. This is a vital topic for research for electric vehicles, specifically when considering the massive operational range that electric vehicles would be subjected to [
13,
14,
15].
Sony Ericson established the first battery in 1991, and a lithium-ion battery was later commercially introduced [
16,
17]. Since then, millions of cells are in the market with their different specifications [
18,
19,
20]. For many years, customer’s demand and best purposes have persisted in maintaining more extended battery running time. To meet customer’s needs, producers have appropriately responded to increase battery performance by changing the cell’s chemistry, which directly affects its memory loss and high electric density. Different li-ion cells include various types of materials, and the material containing titanium [
21,
22,
23], silicon, and graphite oxide for the negative electrode, LiMOy, in which oxides, manganese oxide (MOy), cobalt oxide, and ferrous phosphate, etc. can be used as a metal oxide [
24]. Direct contact between electrodes can cause a short circuit. A separator is used for this type of short circuit to make a cell safe [
25,
26,
27]. A separator is made of different materials, such as polypropylene, for a lithium polymer cell. Still, in the lithium-ion cell, SEI (Solid Electrolyte Interphase) usually consists of Li
2O (Lithium Oxide) [
28,
29], LiF (Lithium Fluoride) [
30], Li
2CO
3 (Lithium Carbonate) [
31], and polyolefin [
32,
33,
34]. The electrolyte depicted in this study consists of a conductive salt, e.g., lithium hexafluorophosphate (LiPF6), and a solvent dimethyl carbonate (DMC), and ethylene carbonate (EC), diethyl carbonate (EC), or ethyl methyl carbonate (EMC) [
35]. The use of metallic lithium leads to safety hazards [
36] and low cycle efficiency due to lithium’s reactivity with ordinary liquid electrolytes [
37]. The energy density of a lithium-ion battery is higher than other battery sources. In the pouch/prismatic cells, one thing that is more common is that the electrodes/separator assembly is not wrapped in its mount. The length to thickness ratio, rather than the actual dimensions, is the thing that matters; the prismatic battery is regarded as an-isotropic multi-layered thick plate [
38,
39,
40].
There is a need to overcome these internal short circuits due to mechanical failure which is due to accidents, according to the International Energy Agency [
40,
41,
42,
43]. Unfortunately, manufacturers could not provide the reasons and mechanisms of internal structural failure. Detailed computational modeling of the battery can explain the origins of failure, mechanisms of failure, and their implications to the battery pack design; thus, it can provide suitable enhancements in format [
44]. Some previous studies are improving their mechanical and electrical performance by changing their material structures [
45]. As a result, this led to battery-pack designs in EV (Electric Vehicle). Battery protection was examined [
46]. Researchers observed changes by applying different loading conditions on lithium-ion battery cells, and they investigated the effects on cells while using the load in various conditions [
47,
48,
49]. Suppose that an accident or mishap occurs in an electric vehicle. In that case, it can also harm the battery pack by intruding on external objects, which can lead to the mechanical deformation of lithium-ion cells. These external objects can occur from various directions, e.g., in-plane loading, which can compress the cell’s narrow border, and out-of-plane indentation, which can punch a vast surface of pouch cell perpendicularly [
50,
51,
52]. Electricity, thermal, and mechanical integrities are the three main factors that are mutually related to battery protection [
53,
54]. Crash experiments of an EV provide a lesson from where it was once found that, instead of minor intrusion into a battery pack, a disastrous result was produced [
55,
56,
57]. However, its overcharging also includes one of the most severe safety issues for applications of lithium-ion batteries [
30,
58]. Analysis of outcomes from quasi-static loading states on the reaction of the cell and most of the primary research and modeling work were done [
58,
59,
60].
Several quasi-static indentation tests were carried out on lithium-ion pouch cells. These indentation tests were prompted at the onset of the internal short circuit. The location of fracture occurs before catastrophic failure of the entire pouch cell with unusual local damage, and accretion appears precisely on the layers. The transient breach occurs in the higher portion of the covered layers, the main force drops, and the synchronous strike of an inner short circuit occurs within the sac cell, while the down part of the pouch cell comprehensively stays. During the indentation tests process, for lithium pouch cells, the common structural unyielding increases at first before its final drop, and it then enters a stagnant condition. After the curvature point, a load of indentation makes the viscid forces stronger. It aggravates the separator into constituent layers and the particles of graphite de-coat from the anode [
61]. The overall performance of the lithium-ion battery can be understood when researchers also investigated the status of mechanical stress on a lithium-ion battery, which is mainly caused by external stress. A variety of different mechanical models have been established to investigate the effects on lithium-ion battery packs by applying mechanical loads, which is one of the prominent reasons for the internal short circuit [
62,
63]. A collective numerical, analytical, and experimental approach was performed to develop a new cell failure model and to understand the primary mechanism of failure. As soon as the large format pouch cells were subjected to indentation leading to failure, an examination of failure regions demonstrated a fracture surface angle to the battery plane [
64,
65]. The research combined both experimental and computational studies [
66,
67]. Dynamic finite element simulations were performed to study pouch cells’ mechanical behavior, such as internal interfacial behavior, loading, and boundary conditions, which shows a direct interaction between cell boundaries and impactor leading to the significant change in the residual velocity [
68,
69].
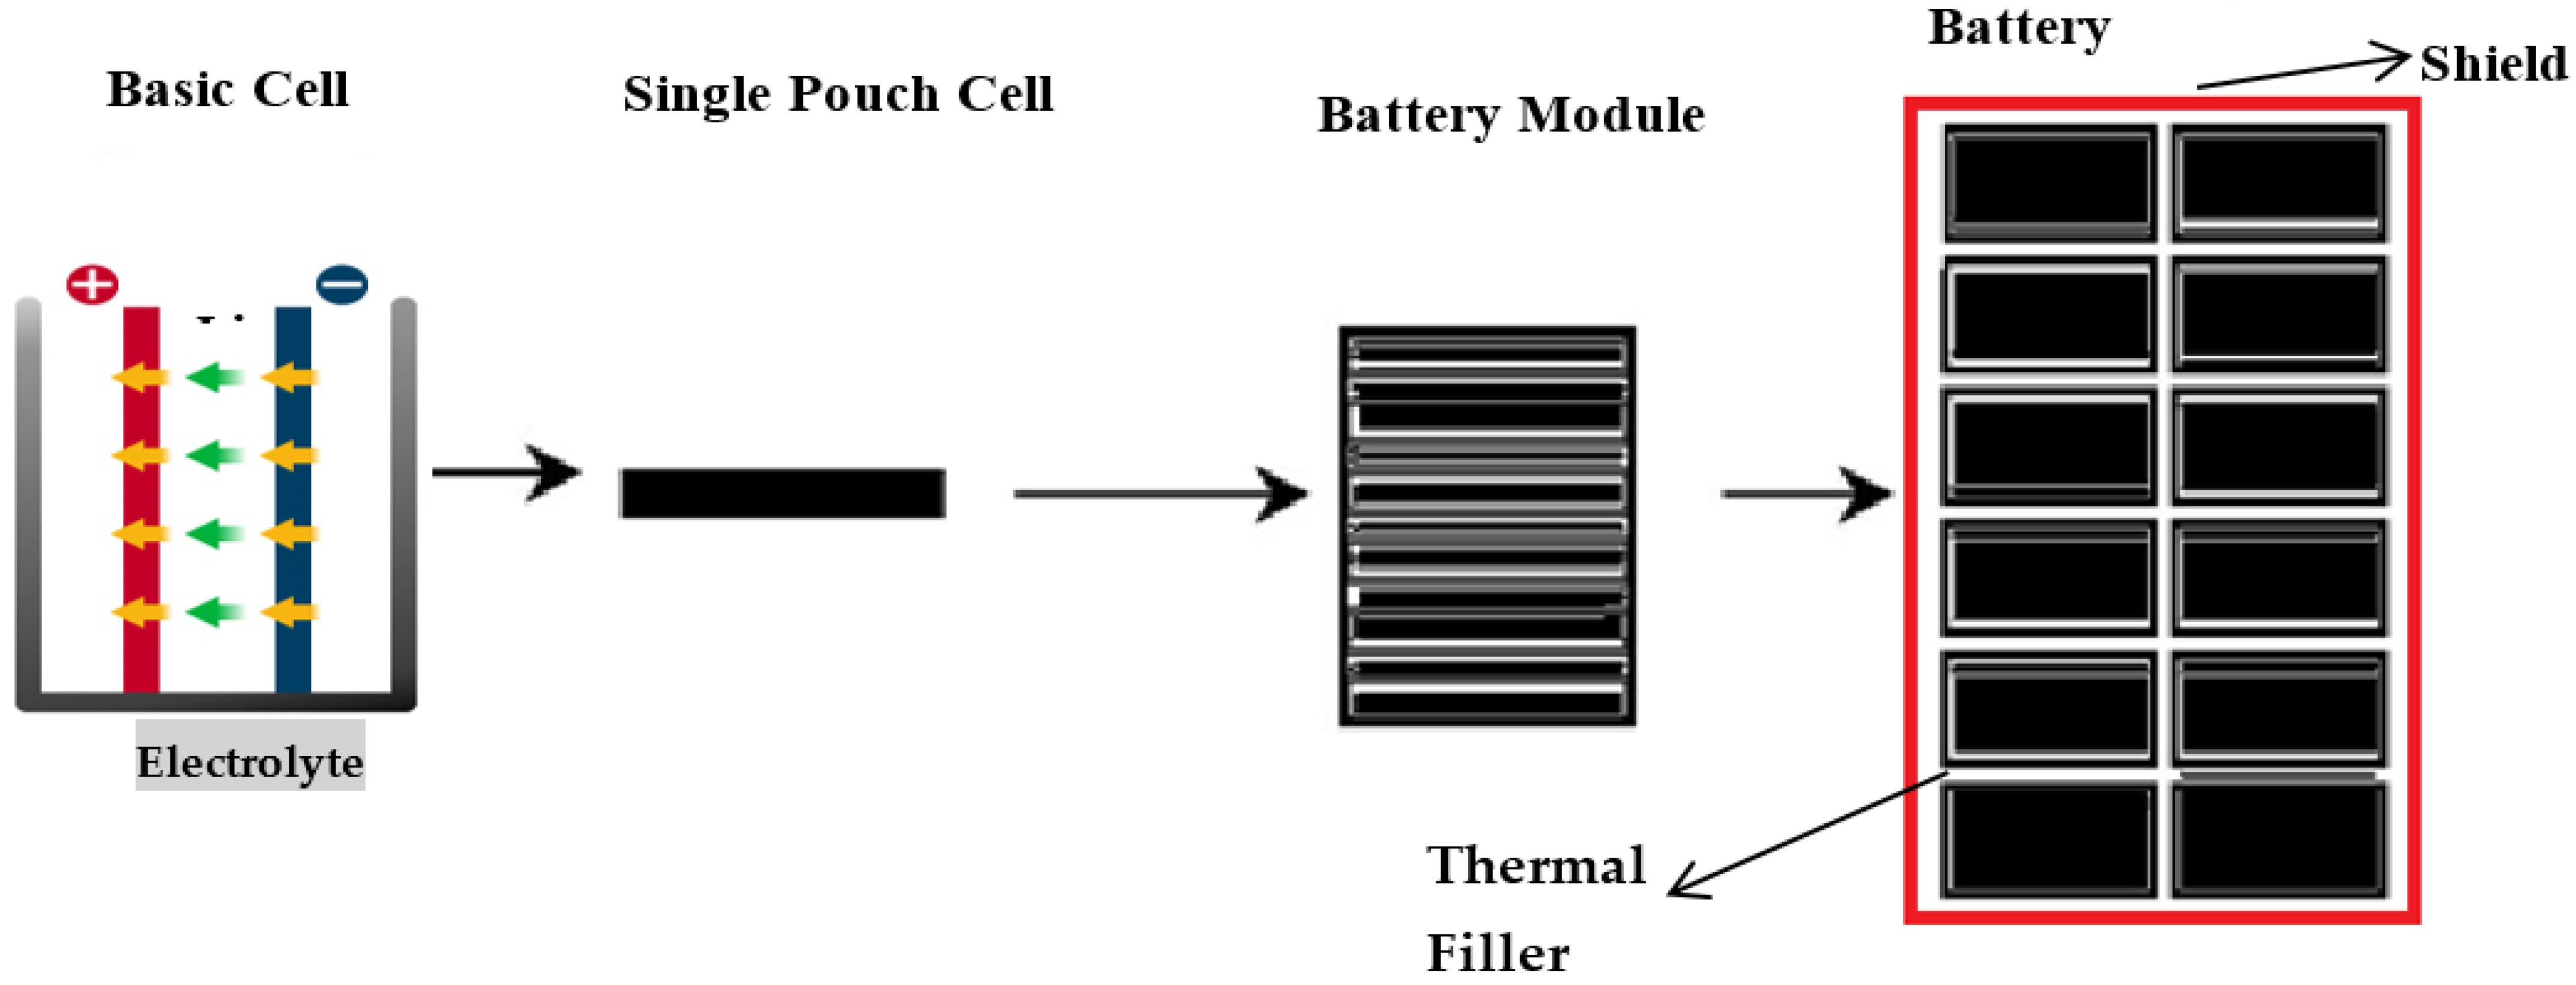
This research will focus on complete cell indentation tests on a specific model of high-energy pouch lithium-ion cells to facilitate the exploration of buckling response under various confinement levels. It also focuses on determining the effects on electrolytes while applying a different type of load by changing the punch size and punch position with the other soc. It will help to identify a model for battery cells when different mechanical loads are applied to it. Taking some measures can improve the application of lithium-ion batteries in different technologies. These measures can include strengthening the batteries’ walls, the storage chambers, material strength, compartment ventilation for fire suppression, and ingress and egress points. This indicates that cell battery model will help to build blocks for developing a battery pack model, as shown in
Figure 1. It is a homogenized form of the battery cell where all five distinctive materials are smudged into one homogenized medium in the battery pack. Theoretically, even though provisional imperfections or modal patterns may be added, such a homogenized model will not simulate realistic buckling patterns because the battery’s actual configuration is anisotropic.
The comprehensive computational modeling will offer valuable information in the allocation to close the design feedback loop, leading to a robust design overall and providing the best solution.
3. Results
3.1. Testing Results of Punch Indentation
Observing previous cells’ tests revealed no leakage or pretension of the pouch cells due to short circuit chemical reactions, and there will be no gas formation because it can cause an explosion. Nevertheless, a, b, c, d reveal the observational test results following the completion of all testing, as shown in
Figure 5.
For the initial tests of cells 1, 2, and 3, 4, as shown in
Figure 5, both load and voltage are graphs of a displacement function. The voltage drops when a short circuit occurs in any of the indentation tests.
Figure 6,
Figure 7,
Figure 8 and
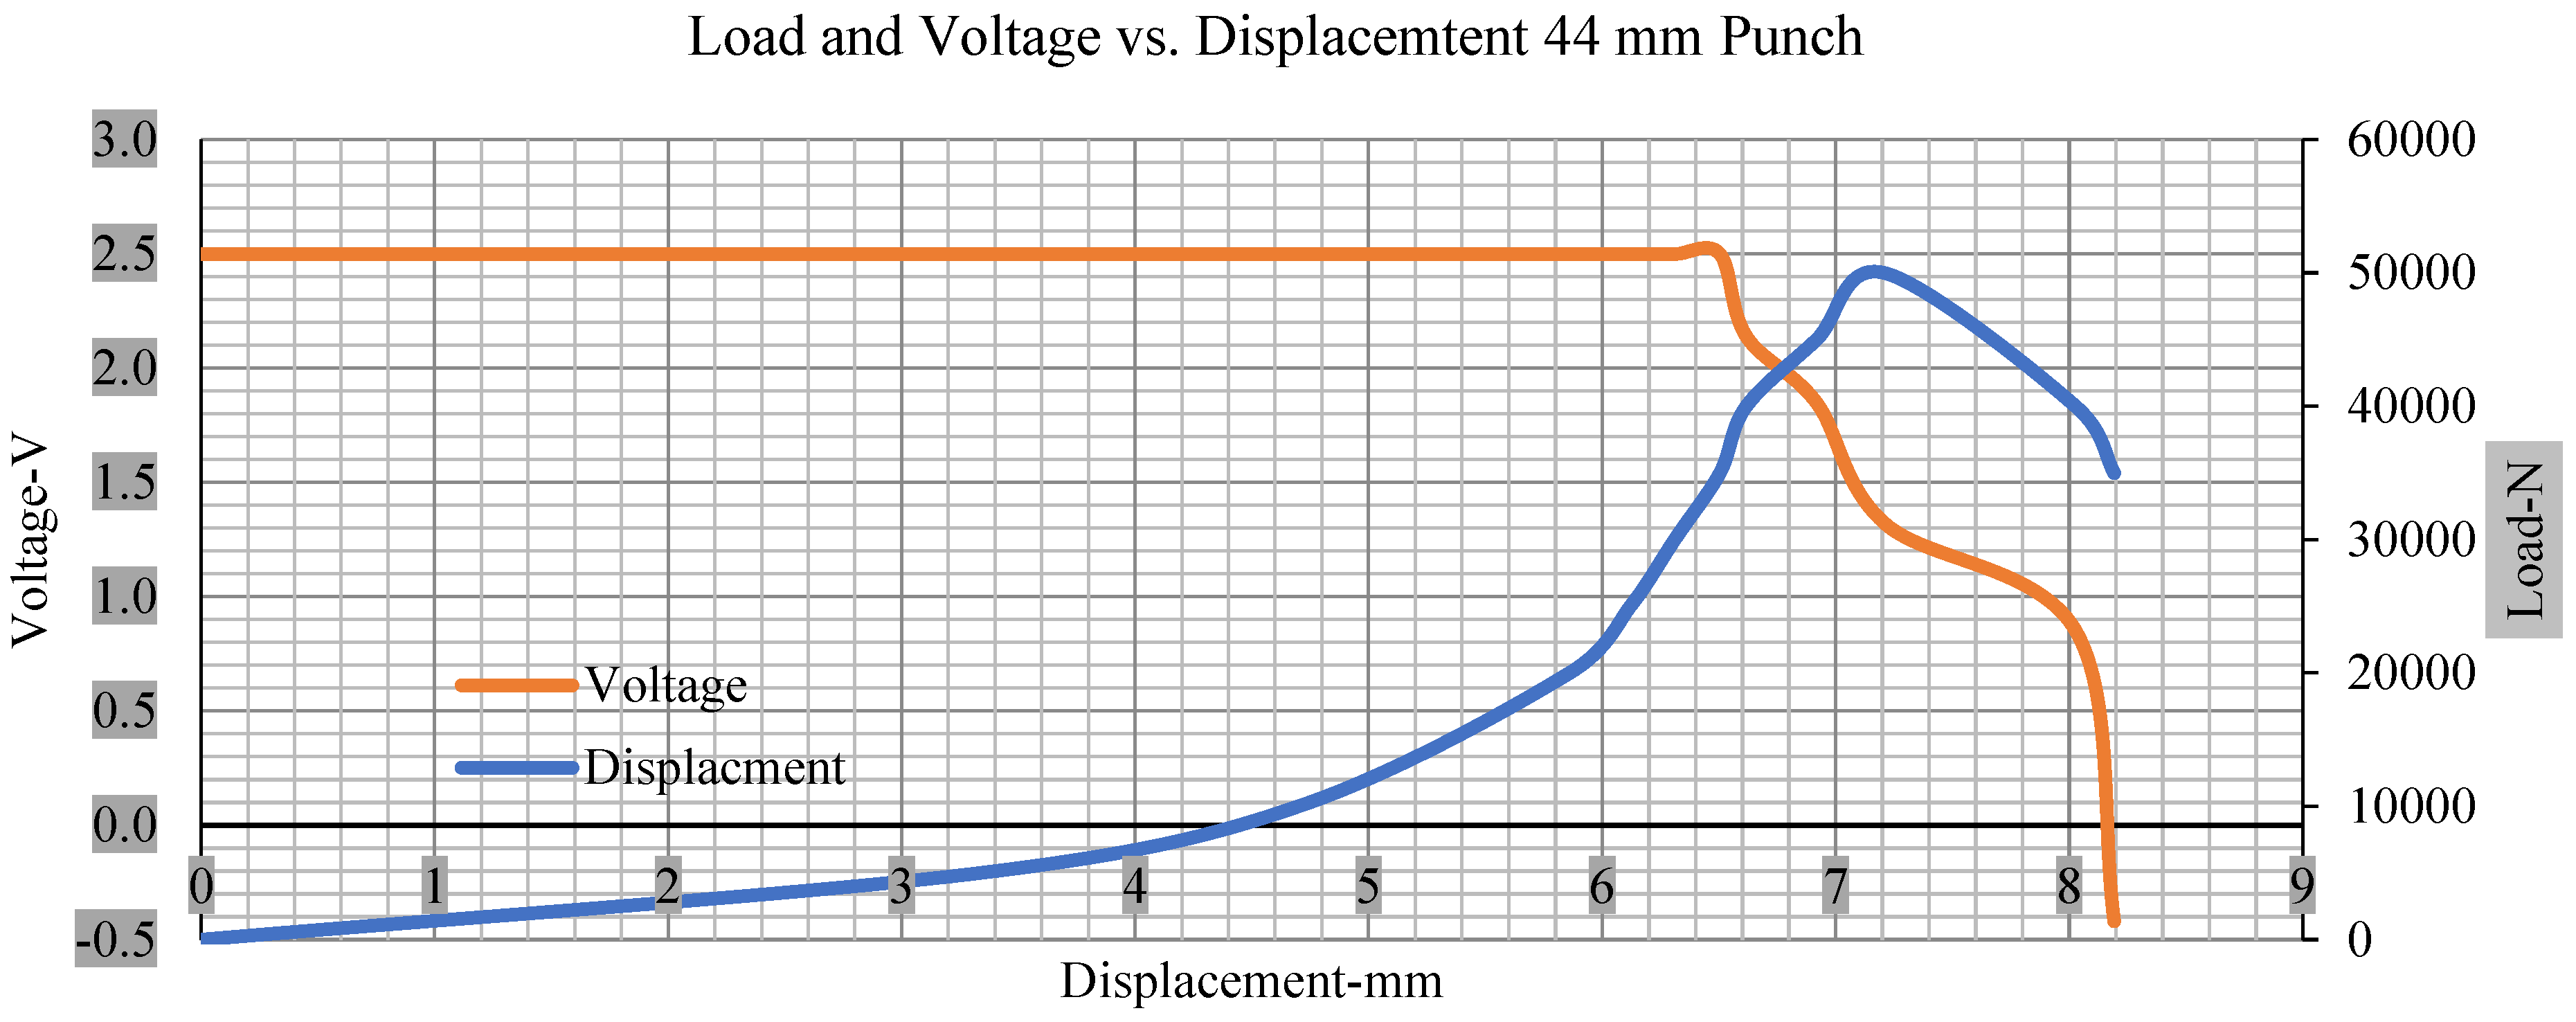
Figure 9 show each cell with greater than 10% soc. It is understood that the onset of a short circuit is directly connected with the cell’s mechanical failure. Test data also revealed, with an increase in punch radius, the beginning of electric short circuit successively occurred later, starting at time = 180 s, time = 260 s, time = 289 s, and time = 304 s or small, medium, large, and a flat cylindrical punch sizes, respectively. A hemispherical punch with 44 mm size did not produce any short circuit or drop in voltage until 5 kN, as shown in
Figure 9.
Figure 6,
Figure 7,
Figure 8,
Figure 9,
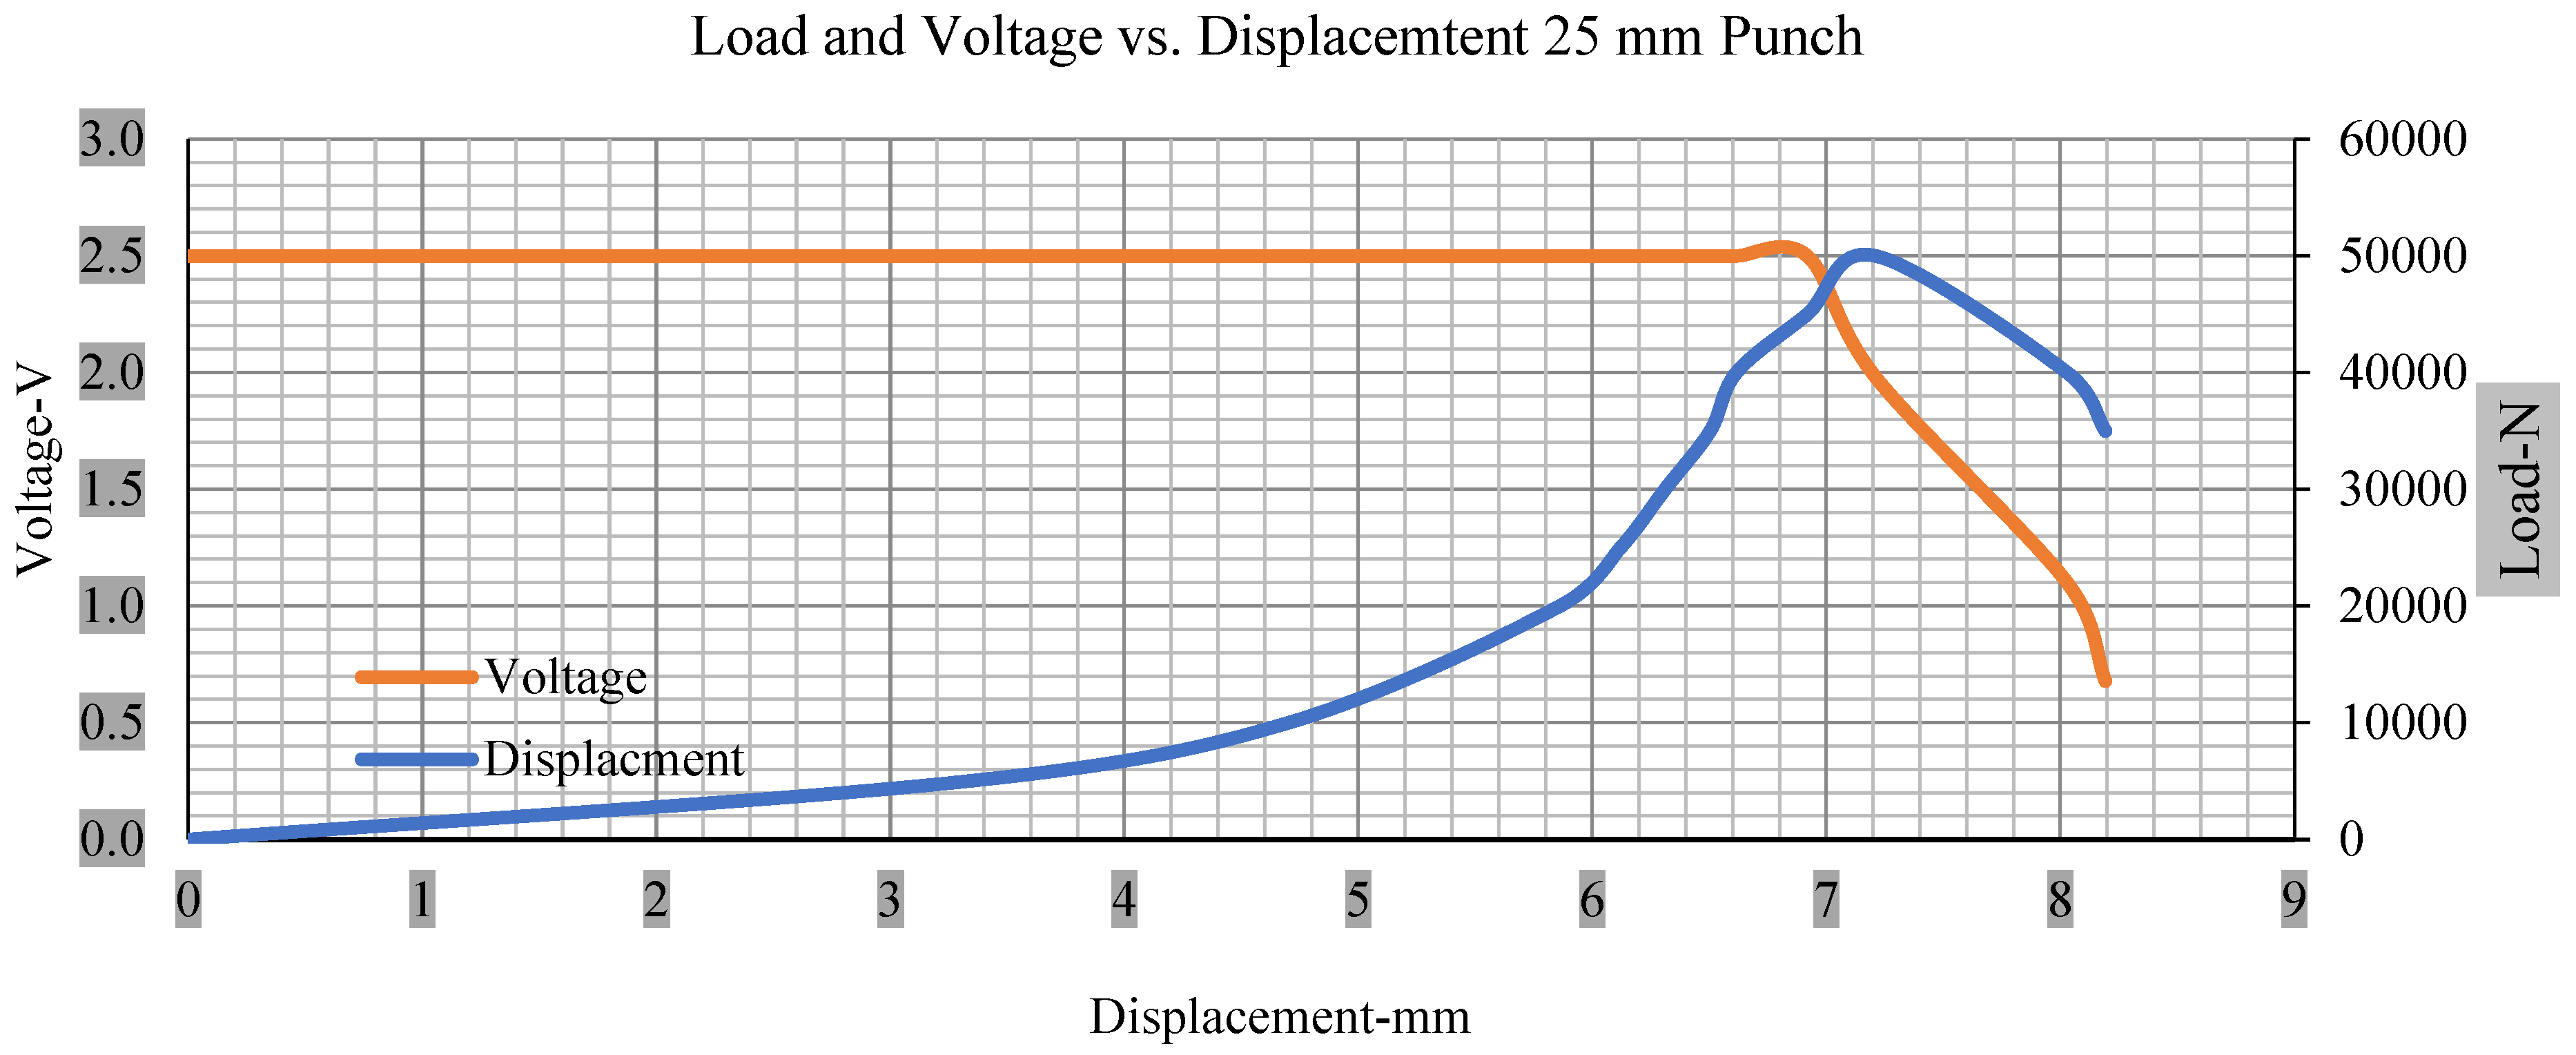
Figure 10,
Figure 11,
Figure 12 and
Figure 13 shows that the voltage drop is at the point of a short circuit in all tests. It can be determined that the cut-off voltage of all punches starts from 2.5, but the drops in voltage displacement and peak loads are different for both cells for all punch types in both soc conditions. However, a drop-in voltage of small punch with size 12 mm, medium punch with size 28 mm, 44 mm, and flat cylindrical punch with size 25 mm goes on an ending of 1.90, 0.65, −0.42, and 0.75. Nevertheless, a large punch with a size of 44 mm shows −0.42 voltages at 50 kN load when the load is removed back from the cell, as shown in
Figure 9 for greater than 10% soc.
Thus, the values for less than 10% soc drop in the voltage of small, medium punch, large punch, and flat cylindrical punch are 1.98, 1.01, 0.81, and 0.68. A drop in voltage rebound is found after a preliminary drop for punch indentation for all cells, and then the voltage progressively lowered to 0 to −0.30 over 15 s.
As predicted, the cells trigger a voltage drop just under the large punch of 44 mm, as shown in
Figure 9 and the displacement graph, and it is considerably deeper and quicker than other punch indentations. The hassle is pushed through the basic geometry of a massive punch that is defined in terms of the tip’s central angle and radius. These findings measure the pattern that is expected in every other situation; those batteries can safely handle extra blunt object intrusion. For 44 mm punch with less than 10% soc, the displacements are 6.474 and 6.324, and, for the other two cells with greater than 10%, the soc displacements are 6.493 and 6.503, respectively, as shown in Figure 17.
This analysis measures the point between two of these similarities and variations. Moreover, an investigation has been performed in relation to how these materials’ properties can be changed when indentation moves from the middle to the corners of the cell. However, in these experiments, the indentation punch position has also been changed from the mid to corner, and the readings are shown for less and greater than 10% soc.
3.2. Effect of Electrolyte with the State of Charge
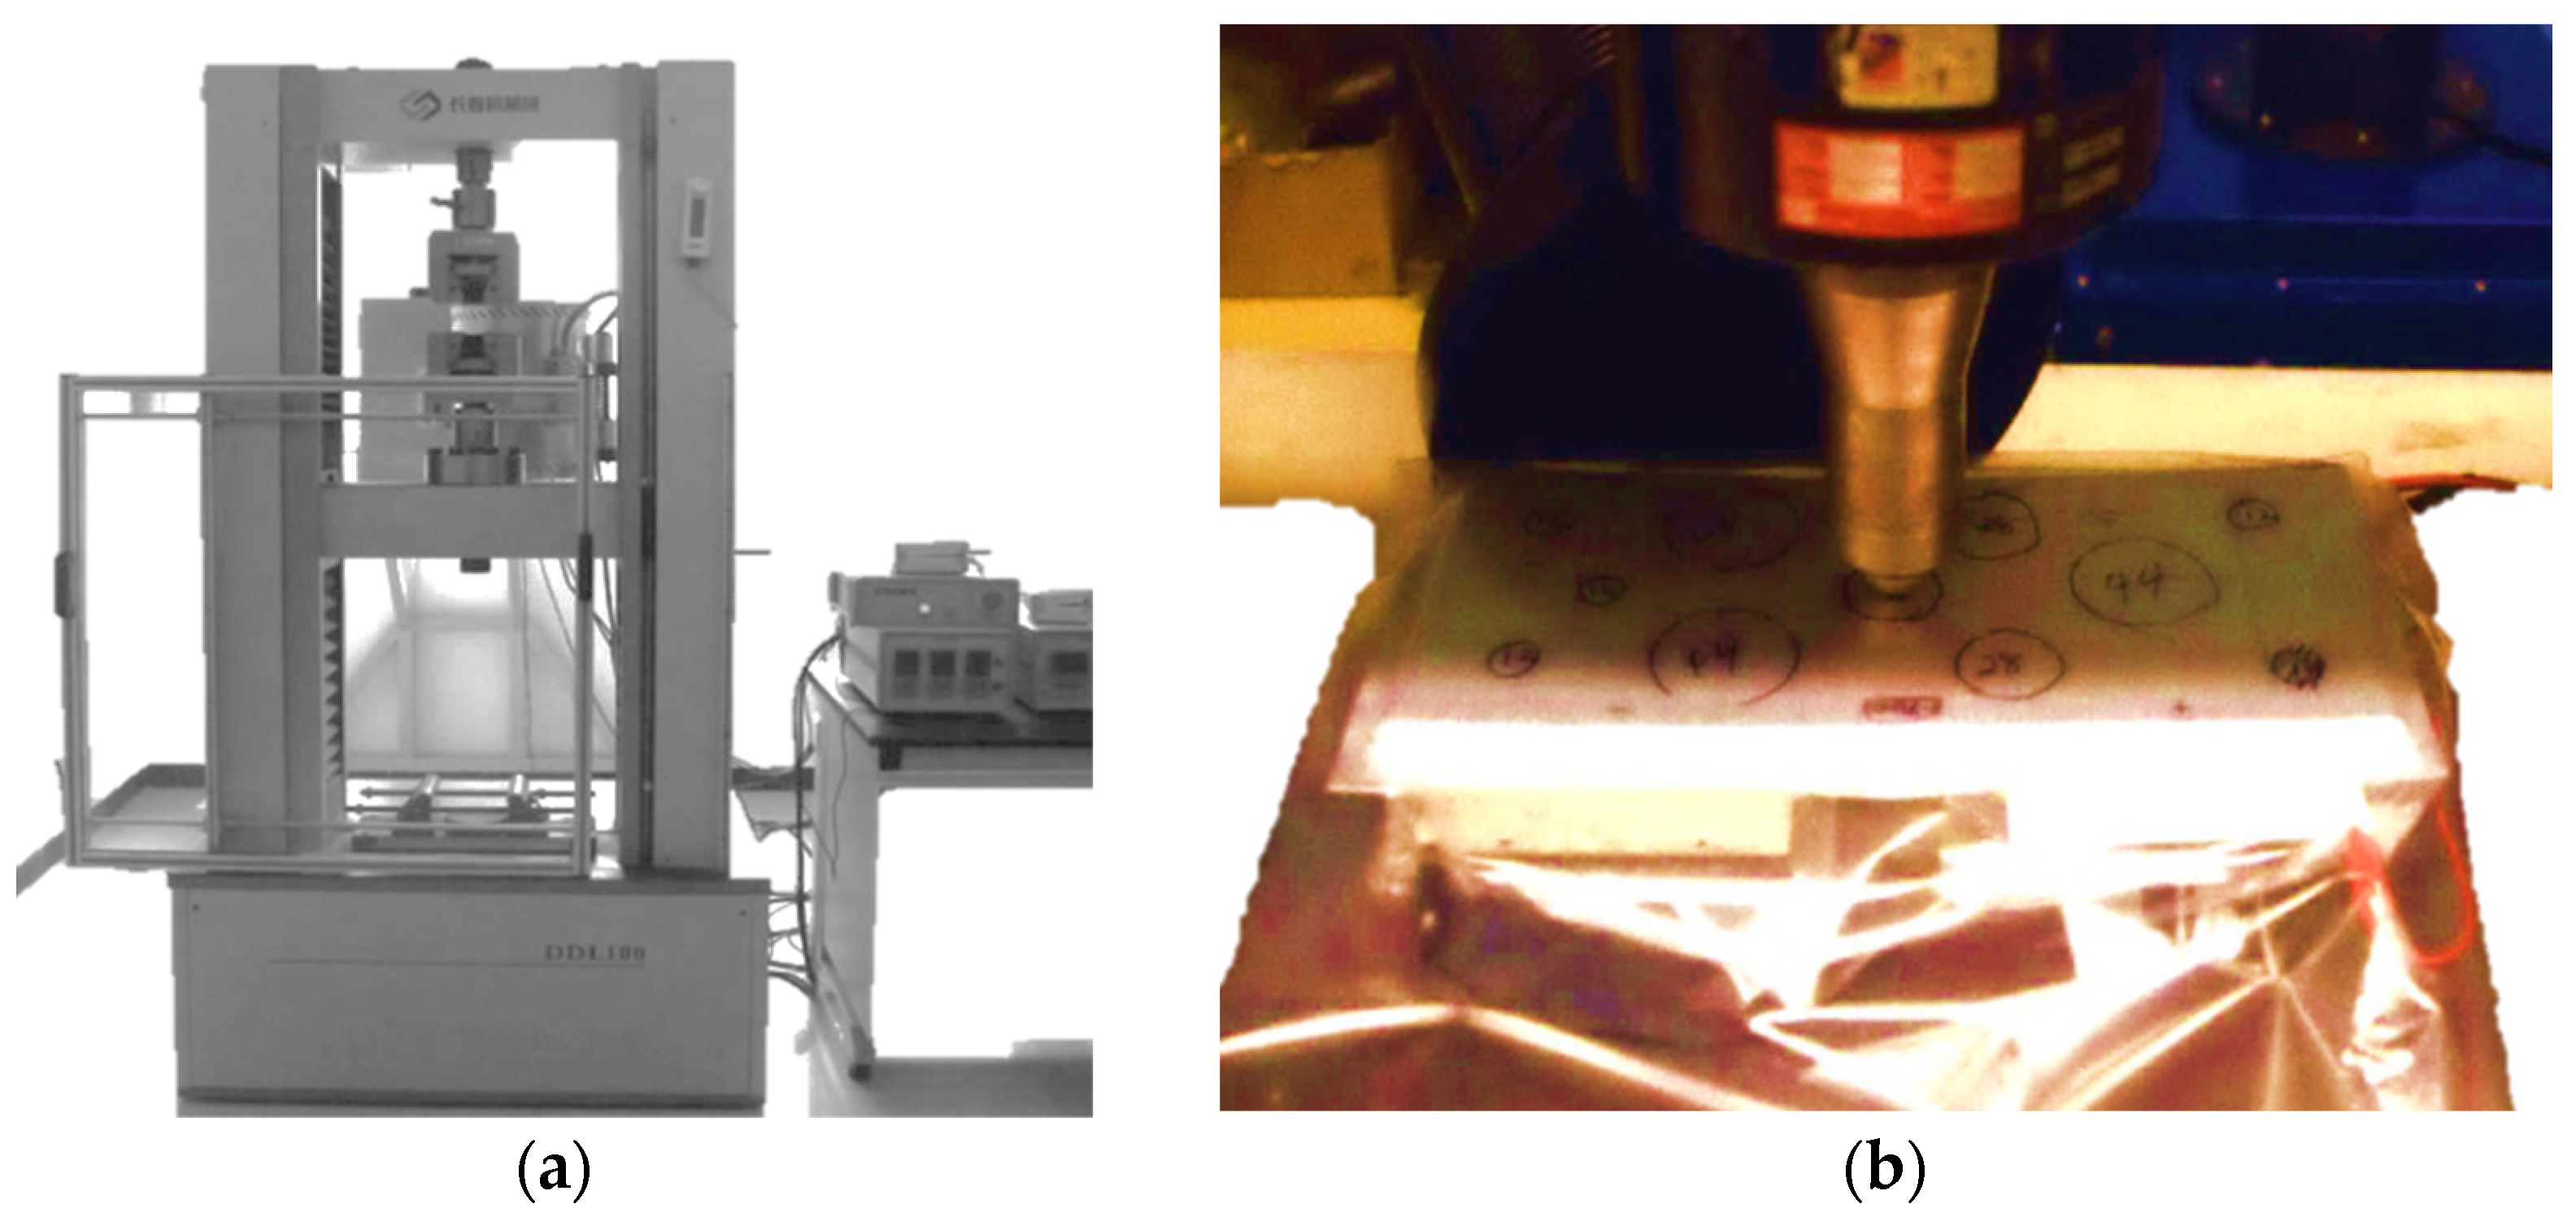
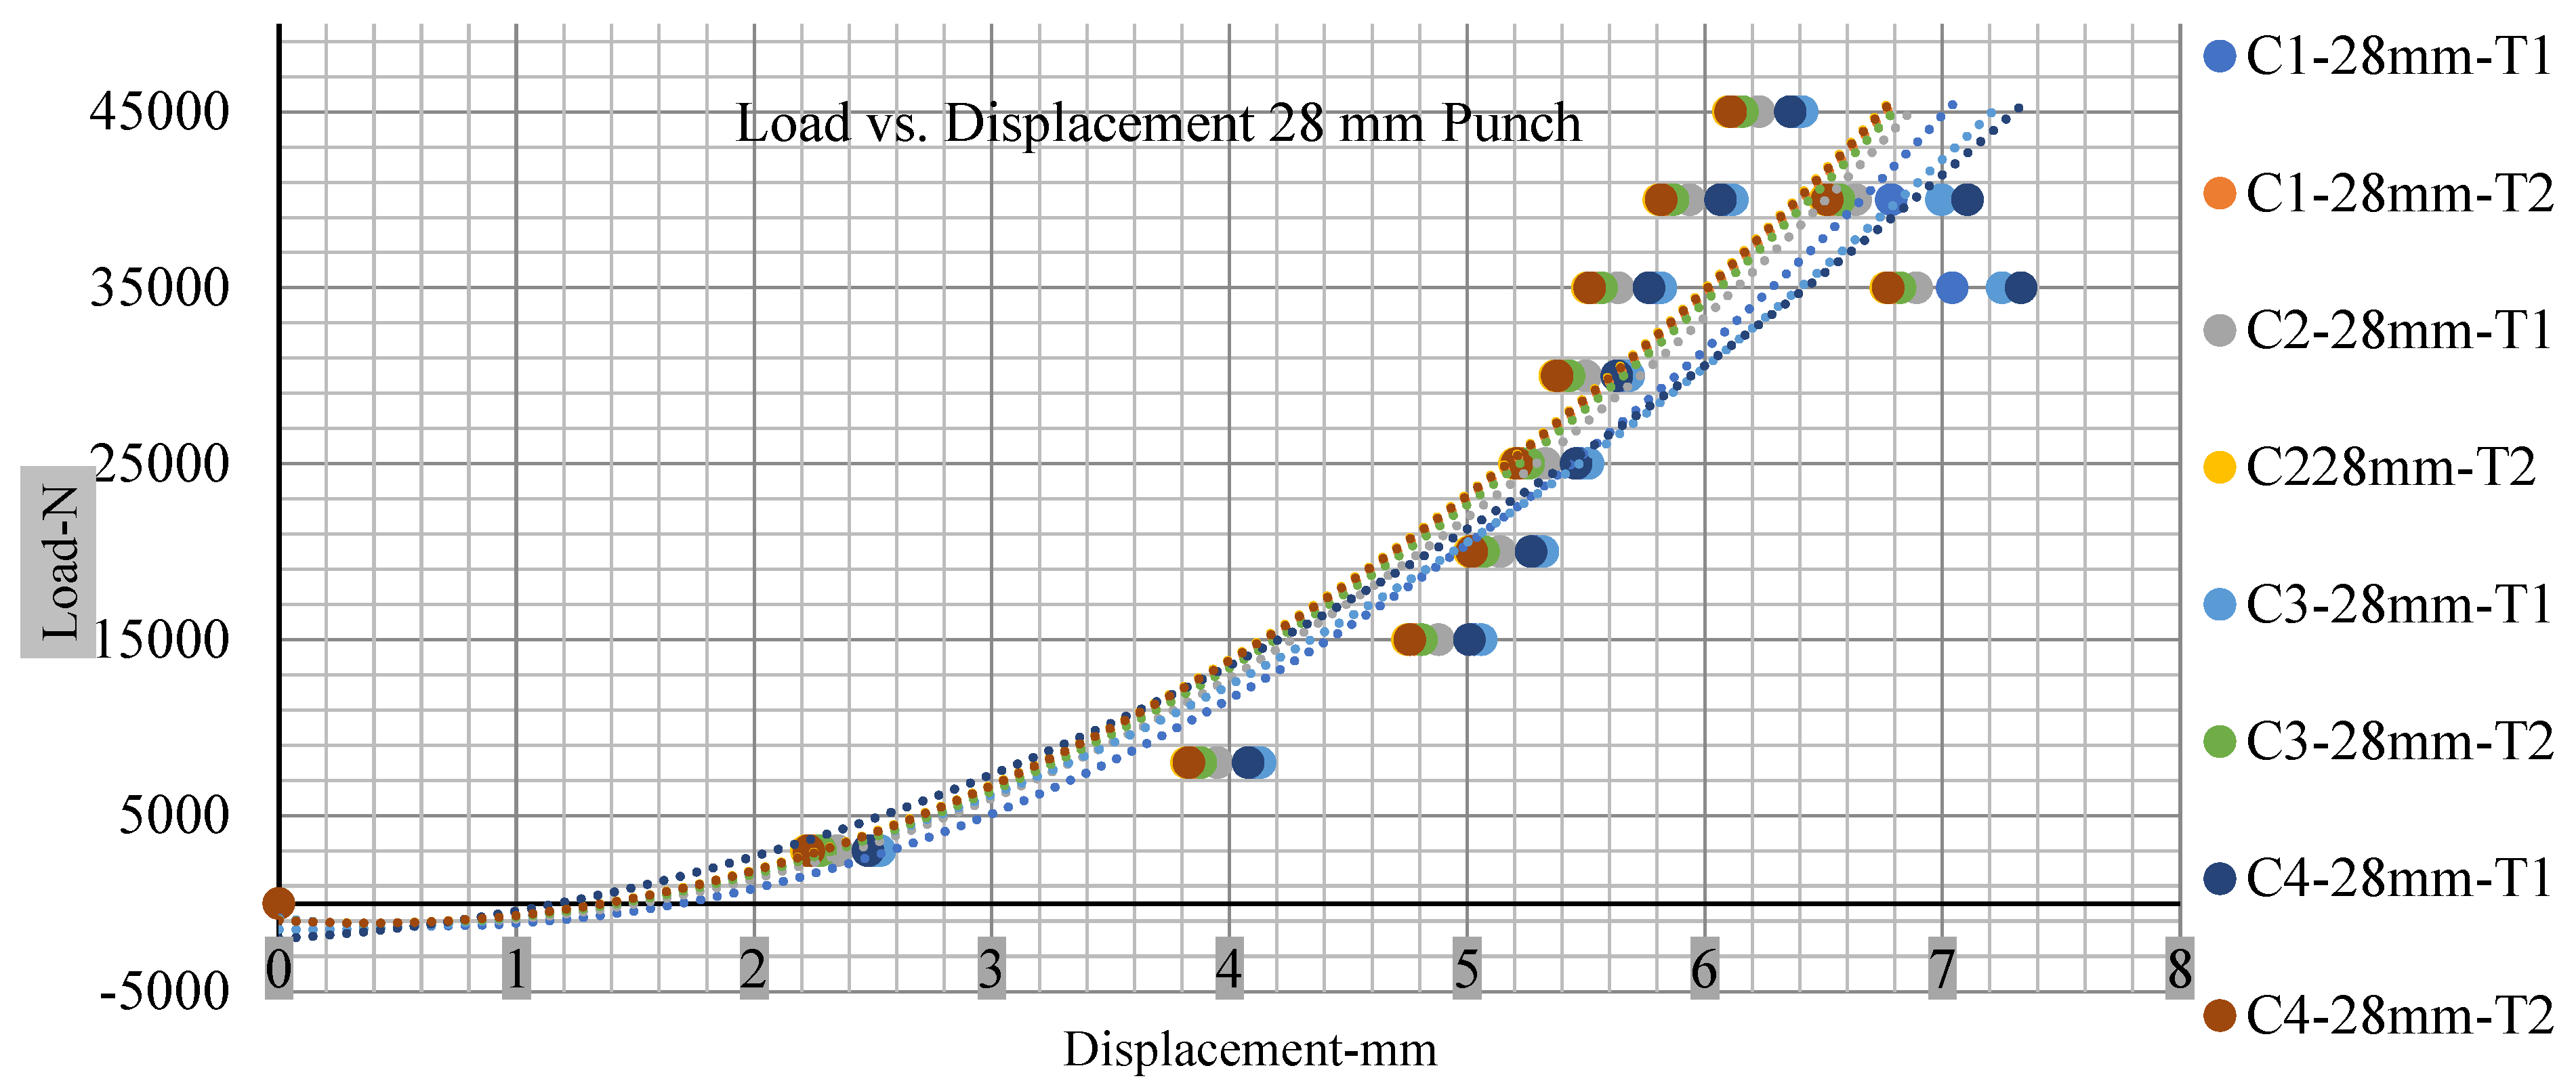
Different indentation tests have been performed on less than 10% state of charge cell to evaluate the electrolyte impact on lithium cells’ loading response. Tests were performed with more than 10% state of charge cell; all of the experiments have been conducted with 12 mm, 25 mm, 28 mm, and 44 mm diameter punch, and all the experiments have been completed at a rate of 1 mm/min. loading. All of the punch tests are performed twice, except for the punch with a 12 mm diameter. These tests have been performed on both soc cells. The cells with less than 10% soc have a much more rigid reaction and a high force level, being significantly more than 10% soc. In contrast, for the estimated force for the last two cells with less than 10% soc, with 28 mm punch, the displacements are 5.466 and 5.316, and, for the first two cells with greater than 10%, the soc displacements are 5.529 and 5.506, as shown in
Figure 14,
Figure 15,
Figure 16 and
Figure 17.
The short circuit onset is observed from the voltage decrease in the cell, which has greater than 10% soc; the punch with a 44 mm diameter starts from 2.14 and ends at −0.42, which clearly shows a high short circuit.
Thus, short circuit, punch displacements with greater than 10% SOC at onset are 2.952 mm, 3.712 mm, 5.529 mm, and 6.503 mm, and, similarly for less than 10% soc, 3.88 mm, 5.42 mm, 5.94 mm, and 6.92 mm for a small, medium, large, and a flat cylindrical punch. In less than 10% soc, the flat cylindrical punch has a diameter of 28 mm, in which the short circuit force initiates no drop in.
However, for a hemispherical punch with 44 mm diameter, the onset of the short circuit coincides with a load drop, and the resistance is measured, compression is reported, and a drop in resistance is shown from 900 to 0.
No calculation of the voltage drop is found for the cells with less than 10% soc, which causes a short circuit. However, the same patterns follow the cell’s homogenized reaction and become softer in the wet state. Comparing the onset contrast to a cell with less than 10% soc and loss is earlier when a cell with greater than 10% soc is tested.
3.3. Loading Positions with Different State of Charge
This experiment has been conducted to explore the impact of changing load positions on cells. For this purpose, two cells are manufactured with a soc less than 10%, and two cells are more than 10% soc to check the effects of a short circuit; on the other hand, during experiments, all of the cells are kept in two-gallon zip-lock bags [
70]. All of these cells are subjected to the punch indentation loads, and variations in the cells’ response have been examined. Tests are performed on lithium-ion cells with pouch cover. However, previous researches have demonstrated that not applying thin foil fused aluminum/polyester of pouch cover, under these loading conditions and not adding power or strength to the cell and calculated data of the cell explicitly represent the electrode/separator stack properties [
69].
The hemispherical punch loading has been extended to a pointed matrix, starting from the cell center and moving towards the corners, and then the findings are compared. The quasi-static is tested at a 1 mm/min. rate loading time, checking. Apart from this, the results are consistent with the experiments. For this purpose, indentation testing with four different types of diameters punches has been carried out. Several hemispherical and flat cylindrical punch experiments have been conducted equally on greater than 10% and less than 10% soc cells at different locations. Several punches have been made on four cells. The measurement is placed in the middle of the cell between 30 mm–55 mm from the long edge of the cell. These are punches with a different punch diameter, and the distance is different on all cells, between 50 mm–60 mm from the long edge in the second test, and 10–15 mm from the long edge in the third. A fourth is conducted on the corner of the cell. All of the tests are conducted in this measurement, but the sizes of punch are different, and variability has been established from the multiple experiments.
Figure 5a–d presents the coordinates of the punch. Some tests are in the middle, some are on the corner, and some are between the hub and center to check the maximal measurement of force with greater than 10% soc (with 44 mm punch diameter) regarding a crosshead of 7.21 mm, 50 kN. Some of the tests are performed with a hemispherical punch with a 44 mm diameter on the corner of the cell, and some are performed in the middle of the cell. The center of cell tests has a great deal of lower maximum power, which is predicted from the cell’s edge containing less substance than the middle of the cell.
Figure 18,
Figure 19,
Figure 20 and
Figure 21 show the peak load and deformation depth at short circuit versus all four cells and different punch diameters. It is fascinating to observe that the short circuit’s peak load should almost linearly grow high with an extended punch diameter. In this experiment, a punch diameter of 44 mm creates a large voltage drop with greater than 10% soc, as shown in the graph presented in
Figure 9. Nevertheless, the load increases with the increase in the punch’s diameter, as shown in
Figure 18,
Figure 19,
Figure 20 and
Figure 21, and high displacements are shown in
Figure 14,
Figure 15,
Figure 16 and
Figure 17. The peak loads and displacements differential between less than 10% soc and greater than 10% soc with hemispherical punches are applied. The hemispherical punch with 28 mm diameter shows maximum force measurements of 40–45 kN with lesser and greater than 10% soc. The 44 mm diameter punch shows 50 kN with lesser and greater than 10% soc.
Table A1,
Table A2,
Table A3 and
Table A4 (
Appendix A) show force-displacement readings.
This allows researchers to use a single cell for running several tests without the fear that the punch’s position would impact the results and only the punch diameter can change it. This study discusses which variables in similar experiments can be carefully regulated and left accessible for operator convenience.
Table A1,
Table A2,
Table A3 and
Table A4 (
Appendix A) the test readings on each cell.
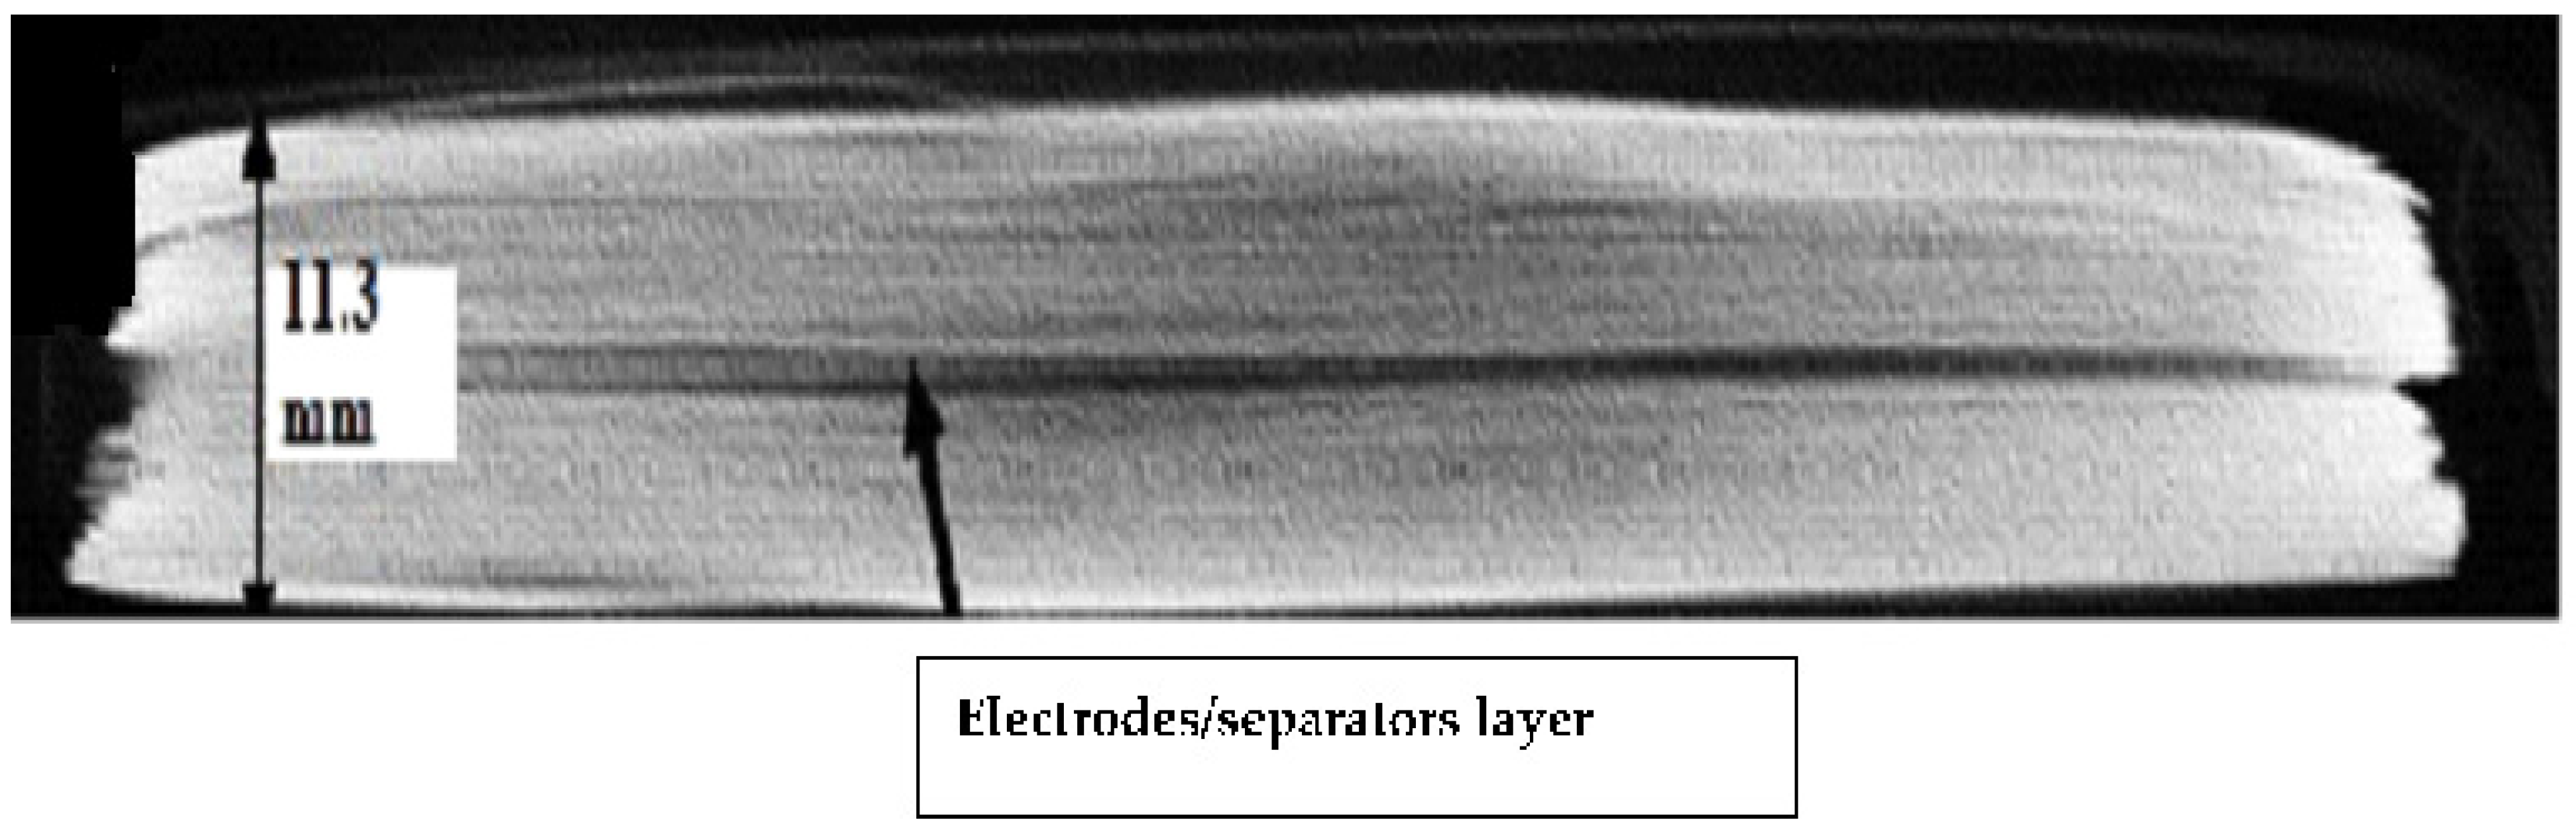
The involvement of electrolytes has been shown to have a direct effect on the cell’s reaction. When a load is applied to the cell, with an increasing load, electrolyte structure also changes because of this internal short circuit that changes the cell’s condition. In all indentation punch filling cases, the pouch cells with an electrolyte with less than 10% soc have soc in all types of diameters. Therefore, researchers should pay particular attention while testing a cell’s mechanical reaction. During the indentation process, the local deformation of each separator before the commencement of the short circuit is another indirect evidence of the fracture sequence. For this reason, separators between each of the four electrode pairs from the pouch cell subjected to 45 kN indentation were investigated using SEM, as shown in
Figure 22. The depletion of the thickness separator in the area just below the indenter (center) was compared to the area further out from the indenter (the margin area) as shown in
Figure 23.


