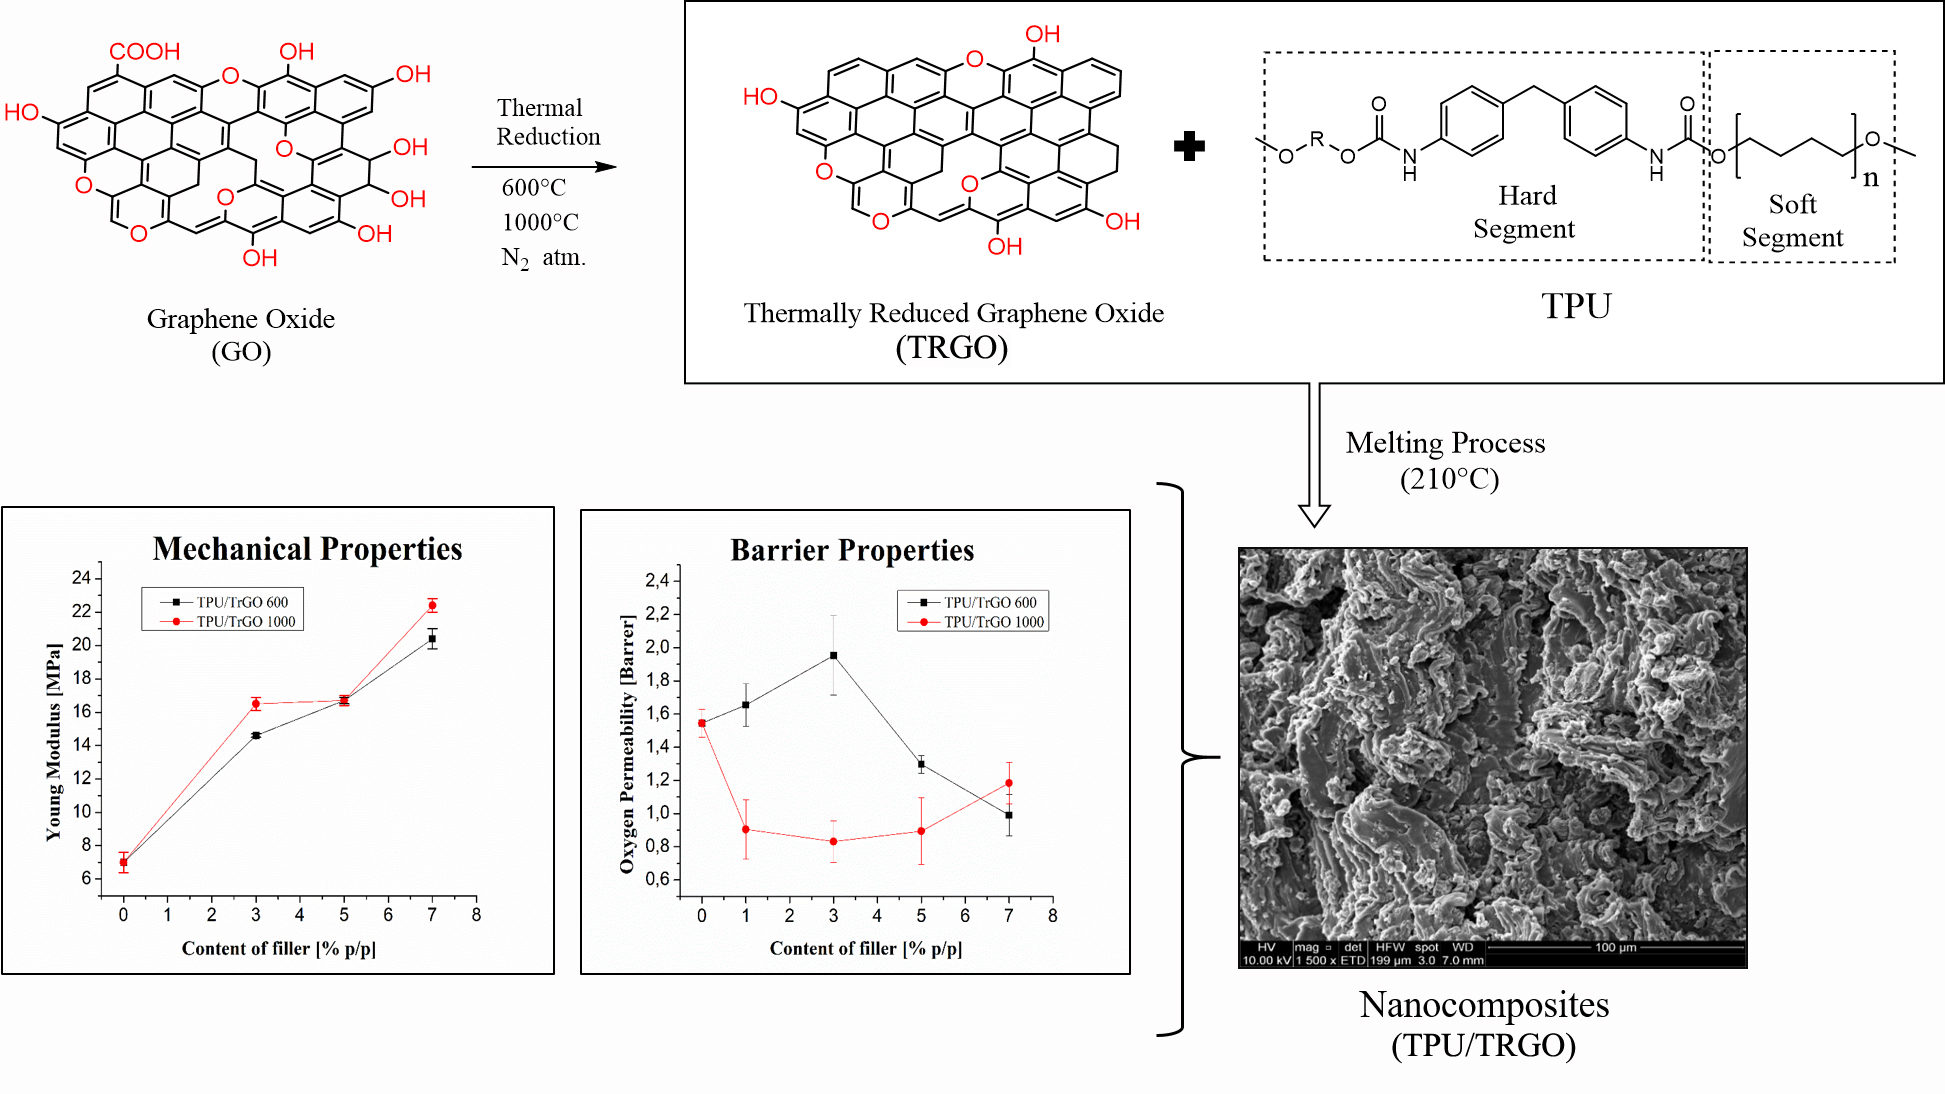
Thermally Reduced Graphene Oxide/Thermoplastic Polyurethane Nanocomposites: Mechanical and Barrier Properties

 and
and
Abstract
:
1. Introduction
2. Materials and Methods
2.1. Materials
2.2. Preparation of Graphene Oxide and Thermally Reduced Graphene Oxide
2.3. Preparation of Nanocomposites
2.4. Characterization of Carbon-Based Nanomaterials
2.5. Characterization of the Nanocomposites
3. Results and Discussion
3.1. Structure and Properties of Thermally Reduced Graphene Oxide
3.2. Structure and Properties of Thermally Reduced Graphene Oxide
4. Conclusions
Author Contributions
Funding
Data Availability Statement
Conflicts of Interest
References
- Lau, W.-J.; Emadzadeh, D.; Shahrin, S.; Goh, P.S.; Ismail, A.F. 9-Ultrafiltration Membranes Incorporated with Carbon-Based Nanomaterials for Antifouling Improvement and Heavy Metal Removal. In Carbon-Based Polymer Nanocomposites for Environmental and Energy Applications; Ismail, A.F., Goh, P.S., Eds.; Elsevier: Amsterdam, The Netherlands, 2018; pp. 217–232. ISBN 978-0-12-813574-7. [Google Scholar]
- Noamani, S.; Niroomand, S.; Rastgar, M.; Sadrzadeh, M. Carbon-based polymer nanocomposite membranes for oily wastewater treatment. NPJ Clean Water 2019, 2, 20. [Google Scholar] [CrossRef]
- Siwal, S.S.; Zhang, Q.; Devi, N.; Thakur, V.K. Carbon-Based Polymer Nanocomposite for High-Performance Energy Storage Applications. Polymers 2020, 12, 505. [Google Scholar] [CrossRef] [PubMed] [Green Version]
- Siqueira, J.R.; Oliveira, O.N. 9-Carbon-Based Nanomaterials. In Nanostructures; Da Róz, A.L., Ferreira, M., de Lima Leite, F., Oliveira, O.N.B.T.-N., Eds.; William Andrew Publishing: Norwich, NY, USA, 2017; pp. 233–249. ISBN 978-0-323-49782-4. [Google Scholar]
- Tiwari, S.K.; Verma, K.; Saren, P.; Oraon, R.; De Adhikari, A.; Nayak, G.C.; Kumar, V. Manipulating selective dispersion of reduced graphene oxide in polycarbonate/nylon 66 based blend nanocomposites for improved thermo-mechanical properties. RSC Adv. 2017, 7, 22145–22155. [Google Scholar] [CrossRef]
- Verdejo, R.; Bernal, M.M.; Romasanta, L.J.; Lopez-Manchado, M.A. Graphene filled polymer nanocomposites. J. Mater. Chem. 2011, 21, 3301–3310. [Google Scholar] [CrossRef] [Green Version]
- Martin-Gallego, M.; Bernal, M.M.; Hernandez, M.; Verdejo, R.; Lopez-Manchado, M.A. Comparison of filler percolation and mechanical properties in graphene and carbon nanotubes filled epoxy nanocomposites. Eur. Polym. J. 2013, 49, 1347–1353. [Google Scholar] [CrossRef] [Green Version]
- Shakir, M.F.; Khan, A.N.; Khan, R.; Javed, S.; Tariq, A.; Azeem, M.; Riaz, A.; Shafqat, A.; Cheema, H.M.; Akram, M.A.; et al. EMI shielding properties of polymer blends with inclusion of graphene nano platelets. Results Phys. 2019, 14, 102365. [Google Scholar] [CrossRef]
- Yadav, R.; Tirumali, M.; Wang, X.; Naebe, M.; Kandasubramanian, B. Polymer composite for antistatic application in aerospace. Def. Technol. 2020, 16, 107–118. [Google Scholar] [CrossRef]
- Tzounis, L.; Petousis, M.; Grammatikos, S.; Vidakis, N. 3D Printed Thermoelectric Polyurethane/Multiwalled Carbon Nanotube Nanocomposites: A Novel Approach towards the Fabrication of Flexible and Stretchable Organic Thermoelectrics. Materials 2020, 13, 2879. [Google Scholar] [CrossRef]
- Franta, I. Chapter 1—Introductory Part. In Elastomers and Rubber Compounding Materials; Franta, I., Ed.; Elsevier: Amsterdam, The Netherlands, 1989; Volume 1, pp. 19–30. ISSN 0922-5579. [Google Scholar]
- Aguilar-Bolados, H.; Yazdani-Pedram, M.; Verdejo, R. Thermal, electrical, and sensing properties of rubber nanocomposites. In High-Performance Elastomeric Materials Reinforced by Nano-Carbons; Valentini, L., Lopez-Manchado, M., Eds.; Elsevier: Amsterdam, The Netherlands, 2020; pp. 149–175. [Google Scholar] [CrossRef]
- Nozaki, S.; Masuda, S.; Kamitani, K.; Kojio, K.; Takahara, A.; Kuwamura, G.; Hasegawa, D.; Moorthi, K.; Mita, K.; Yamasaki, S. Superior Properties of Polyurethane Elastomers Synthesized with Aliphatic Diisocyanate Bearing a Symmetric Structure. Macromolecules 2017, 50, 1008–1015. [Google Scholar] [CrossRef]
- Aguilar Bolados, H.; Hernández-Santana, M.; Romasanta, L.J.; Yazdani-Pedram, M.; Quijada, R.; López-Manchado, M.A.; Verdejo, R. Electro-mechanical actuation performance of SEBS/PU blends. Polymer 2019, 171, 25–33. [Google Scholar] [CrossRef]
- Petrović, Z.S.; Ferguson, J. Polyurethane elastomers. Prog. Polym. Sci. 1991, 16, 695–836. [Google Scholar] [CrossRef]
- Sami, S.; Yildirim, E.; Yurtsever, M.; Yurtsever, E.; Yilgor, E.; Yilgor, I.; Wilkes, G.L. Understanding the influence of hydrogen bonding and diisocyanate symmetry on the morphology and properties of segmented polyurethanes and polyureas: Computational and experimental study. Polymer 2014, 55, 4563–4576. [Google Scholar] [CrossRef]
- Avilés, F.; Cauich-Rodríguez, J.V.; Toro-Estay, P.; Yazdani-Pedram, M.; Aguilar-Bolados, H. Improving Carbon Nanotube/Polymer Interactions in Nanocomposites. Carbon Nanotub. Polym. 2018, 83–115. [Google Scholar] [CrossRef]
- Botas, C.; Álvarez, P.; Blanco, P.; Granda, M.; Blanco, C.; Santamaría, R.; Romasanta, L.J.; Verdejo, R.; López-Manchado, M.A.; Menéndez, R. Graphene materials with different structures prepared from the same graphite by the Hummers and Brodie methods. Carbon N. Y. 2013, 65, 156–164. [Google Scholar] [CrossRef] [Green Version]
- Brodie, B.C. XIII. On the atomic weight of graphite. Philos. Trans. R. Soc. Lond. 1859, 149, 249–259. [Google Scholar] [CrossRef] [Green Version]
- Hummers, W.S.; Offeman, R.E. Preparation of Graphitic Oxide. J. Am. Chem. Soc. 1958, 80, 1339. [Google Scholar] [CrossRef]
- Marcano, D.C.; Kosynkin, D.V.; Berlin, J.M.; Sinitskii, A.; Sun, Z.; Slesarev, A.; Alemany, L.B.; Lu, W.; Tour, J.M. Improved Synthesis of Graphene Oxide. ACS Nano 2010, 4, 4806–4814. [Google Scholar] [CrossRef]
- Tabish, T.A.; Pranjol, M.Z.I.; Horsell, D.W.; Rahat, A.A.M.; Whatmore, J.L.; Winyard, P.G.; Zhang, S. Graphene Oxide-Based Targeting of Extracellular Cathepsin D and Cathepsin L As A Novel Anti-Metastatic Enzyme Cancer Therapy. Cancers 2019, 11, 319. [Google Scholar] [CrossRef] [Green Version]
- Aguilar-Bolados, H.; Lopez-Manchado, M.A.; Brasero, J.; Avilés, F.; Yazdani-Pedram, M. Effect of the morphology of thermally reduced graphite oxide on the mechanical and electrical properties of natural rubber nanocomposites. Compos. Part. B Eng. 2016, 87. [Google Scholar] [CrossRef]
- Gómez, M.; Díaz, A.; Reyes, P.; Yazdani-Pedram, M.; Bohrz Nachtigall, S.M.; Palza, H.; Quijada, R. Effect of thermally reduced graphene oxides obtained at different temperatures on the barrier and mechanical properties of polypropylene/TRGO and polyamide-6/TRGO nanocomposites. Polym. Compos. 2019, 40, E1746–E1756. [Google Scholar] [CrossRef]
- Aguilar-Bolados, H.; Contreras-Cid, A.; Yazdani-Pedram, M.; Acosta-Villavicencio, G.; Flores, M.; Fuentealba, P.; Neira-Carrillo, A.; Verdejo, R.; López-Manchado, M.A. Synthesis of fluorinated graphene oxide by using an easy one-pot deoxyfluorination reaction. J. Colloid Interface Sci. 2018. [Google Scholar] [CrossRef] [PubMed]
- Aguilar-Bolados, H.; Vargas-Astudillo, D.; Yazdani-Pedram, M.; Acosta-Villavicencio, G.; Fuentealba, P.; Contreras-Cid, A.; Verdejo, R.; López-Manchado, M.A. Facile and Scalable One-Step Method for Amination of Graphene Using Leuckart Reaction. Chem. Mater. 2017, 29. [Google Scholar] [CrossRef] [Green Version]
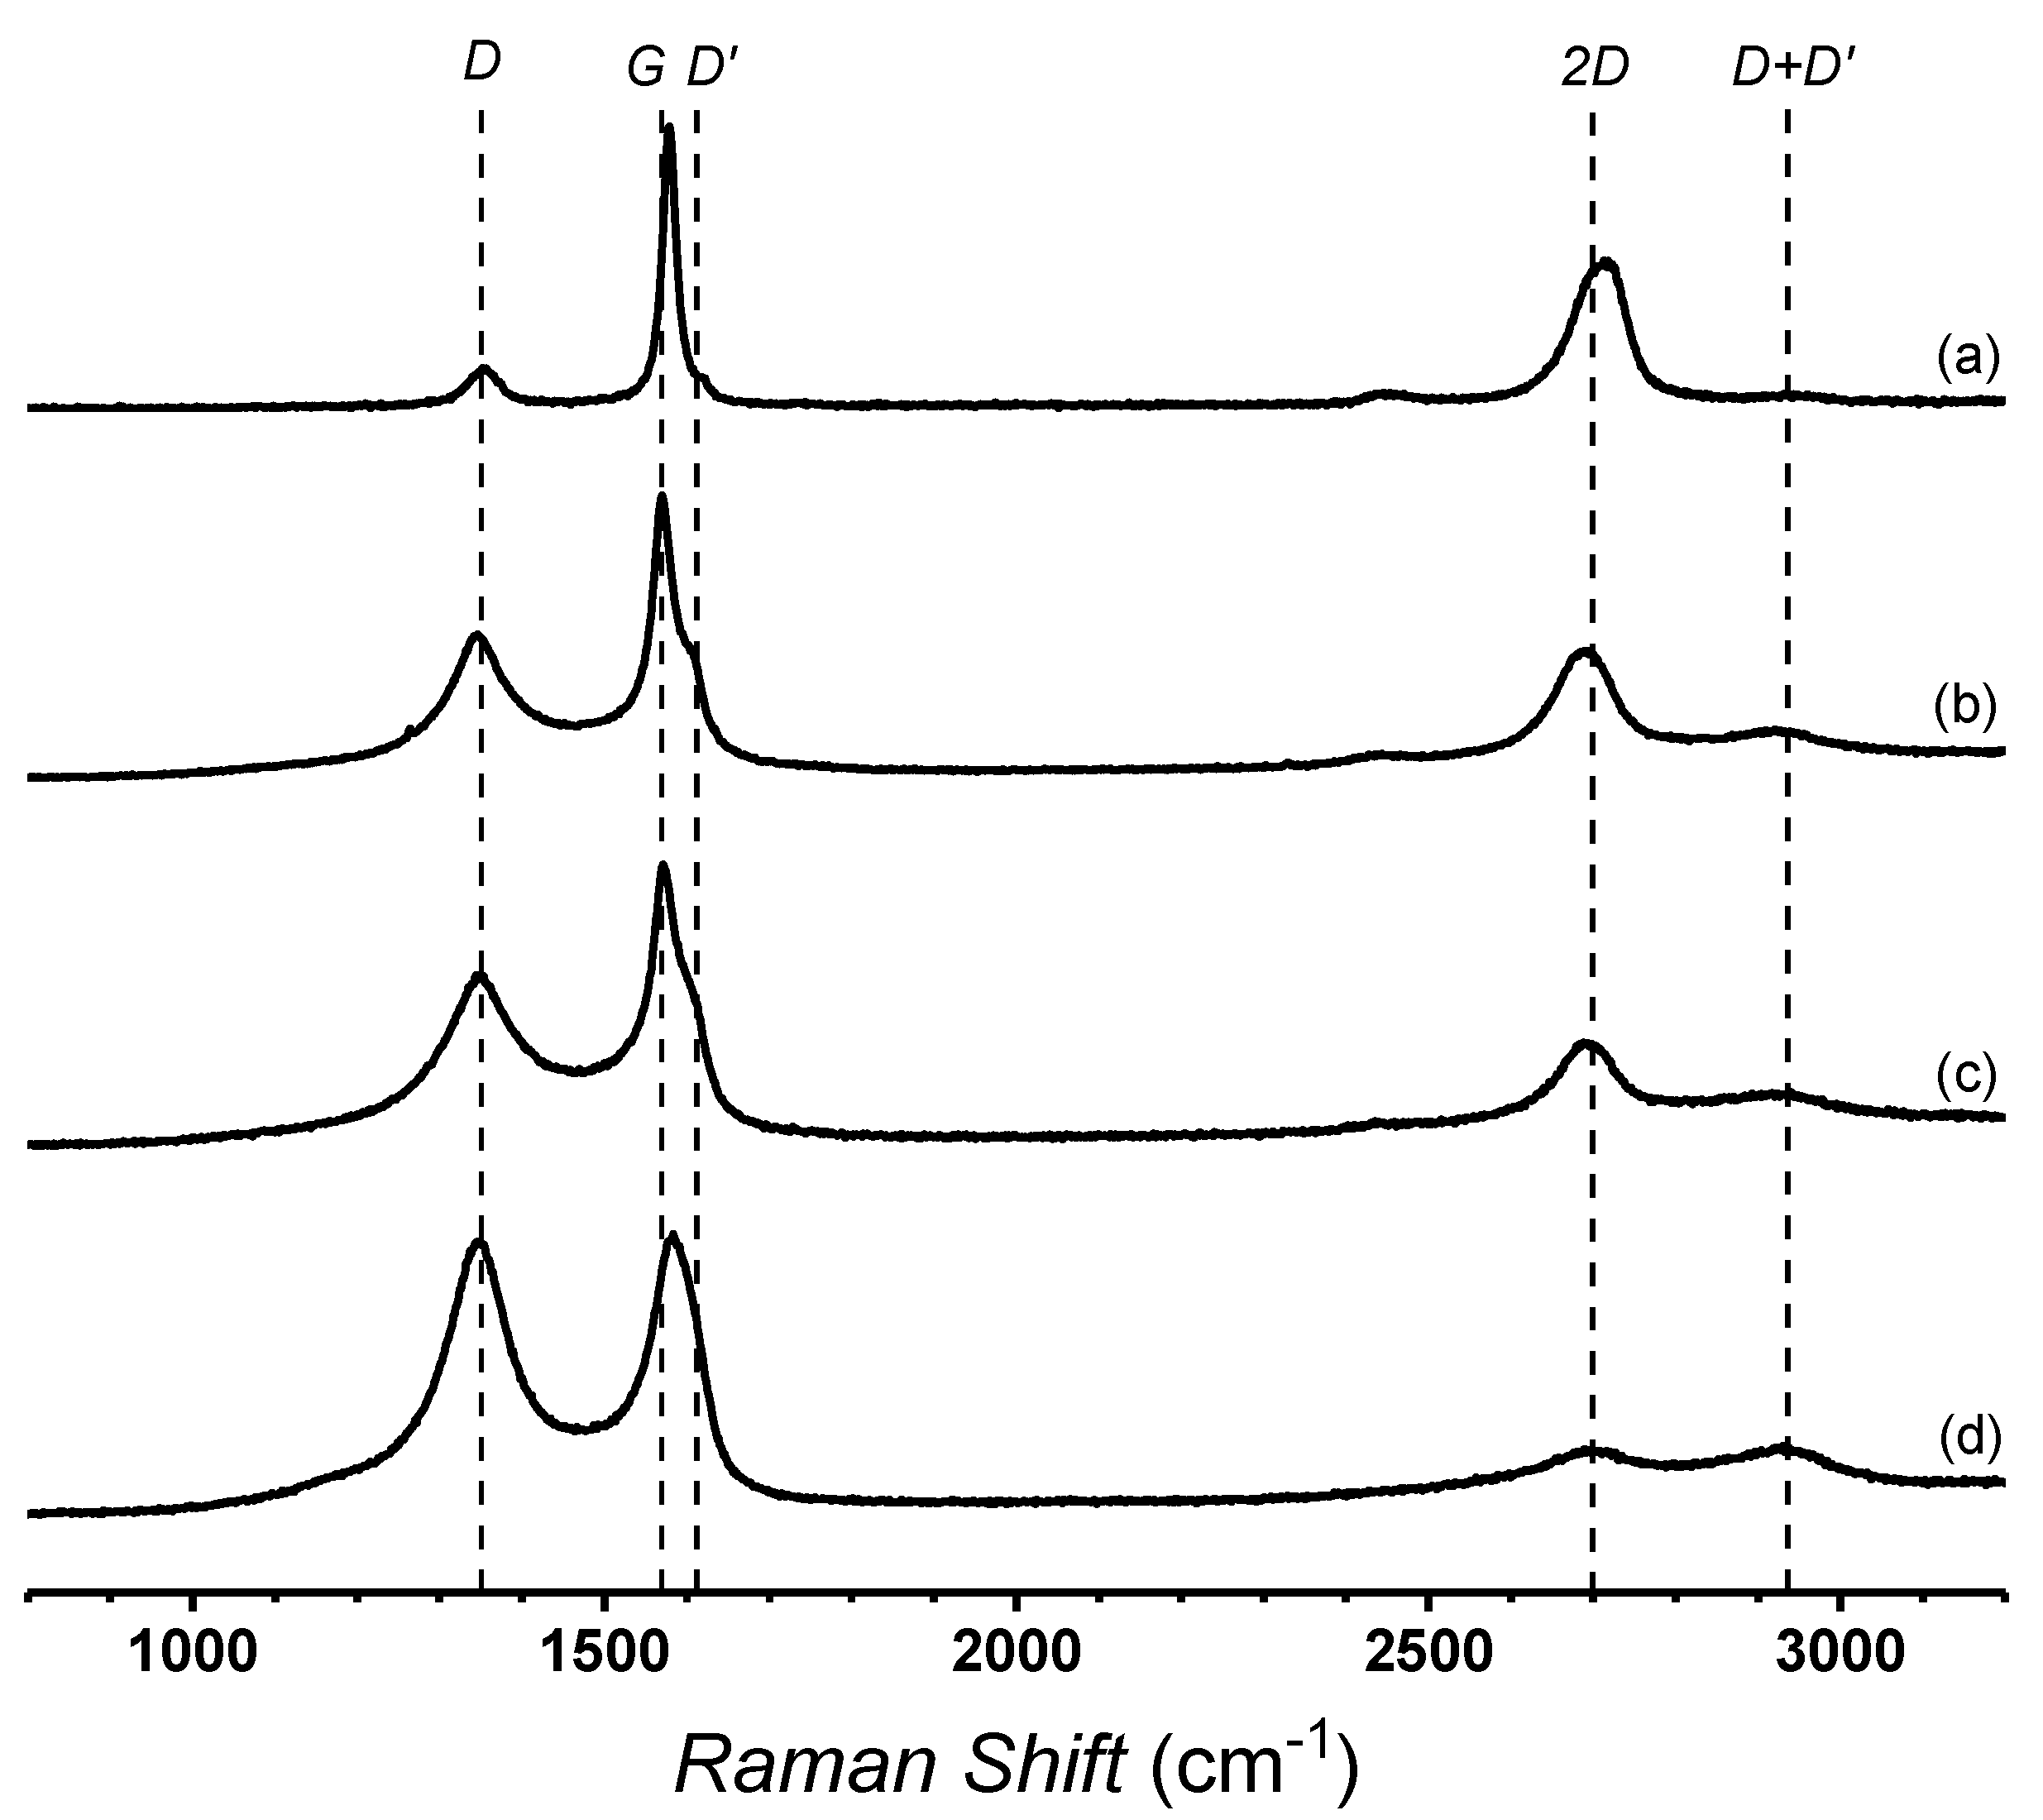
- Ferrari, A.C.; Basko, D.M. Raman spectroscopy as a versatile tool for studying the properties of graphene. Nat. Nanotechnol. 2013, 8, 235–246. [Google Scholar] [CrossRef] [PubMed] [Green Version]
- Liu, S.; Tian, M.; Yan, B.; Yao, Y.; Zhang, L.; Nishi, T.; Ning, N. High performance dielectric elastomers by partially reduced graphene oxide and disruption of hydrogen bonding of polyurethanes. Polymer 2015, 56, 375–384. [Google Scholar] [CrossRef]
- Cui, Y.; Kundalwal, S.I.; Kumar, S. Gas barrier performance of graphene/polymer nanocomposites. Carbon. N. Y. 2016, 98, 313–333. [Google Scholar] [CrossRef] [Green Version]


| Sample | Surface Area (m2/g) | Elemental Analysis | |||
|---|---|---|---|---|---|
| C (wt.%) | H (wt.%) | O (wt.%) | C/O Ratio | ||
| GO | 69 | 54.35 | 1.87 | 43.78 | 1.24 |
| TRGO600 | 304 | 83.84 | 0.32 | 15.84 | 5.32 |
| TRGO1000 | 266 | 90.75 | 0.38 | 8.87 | 10.38 |
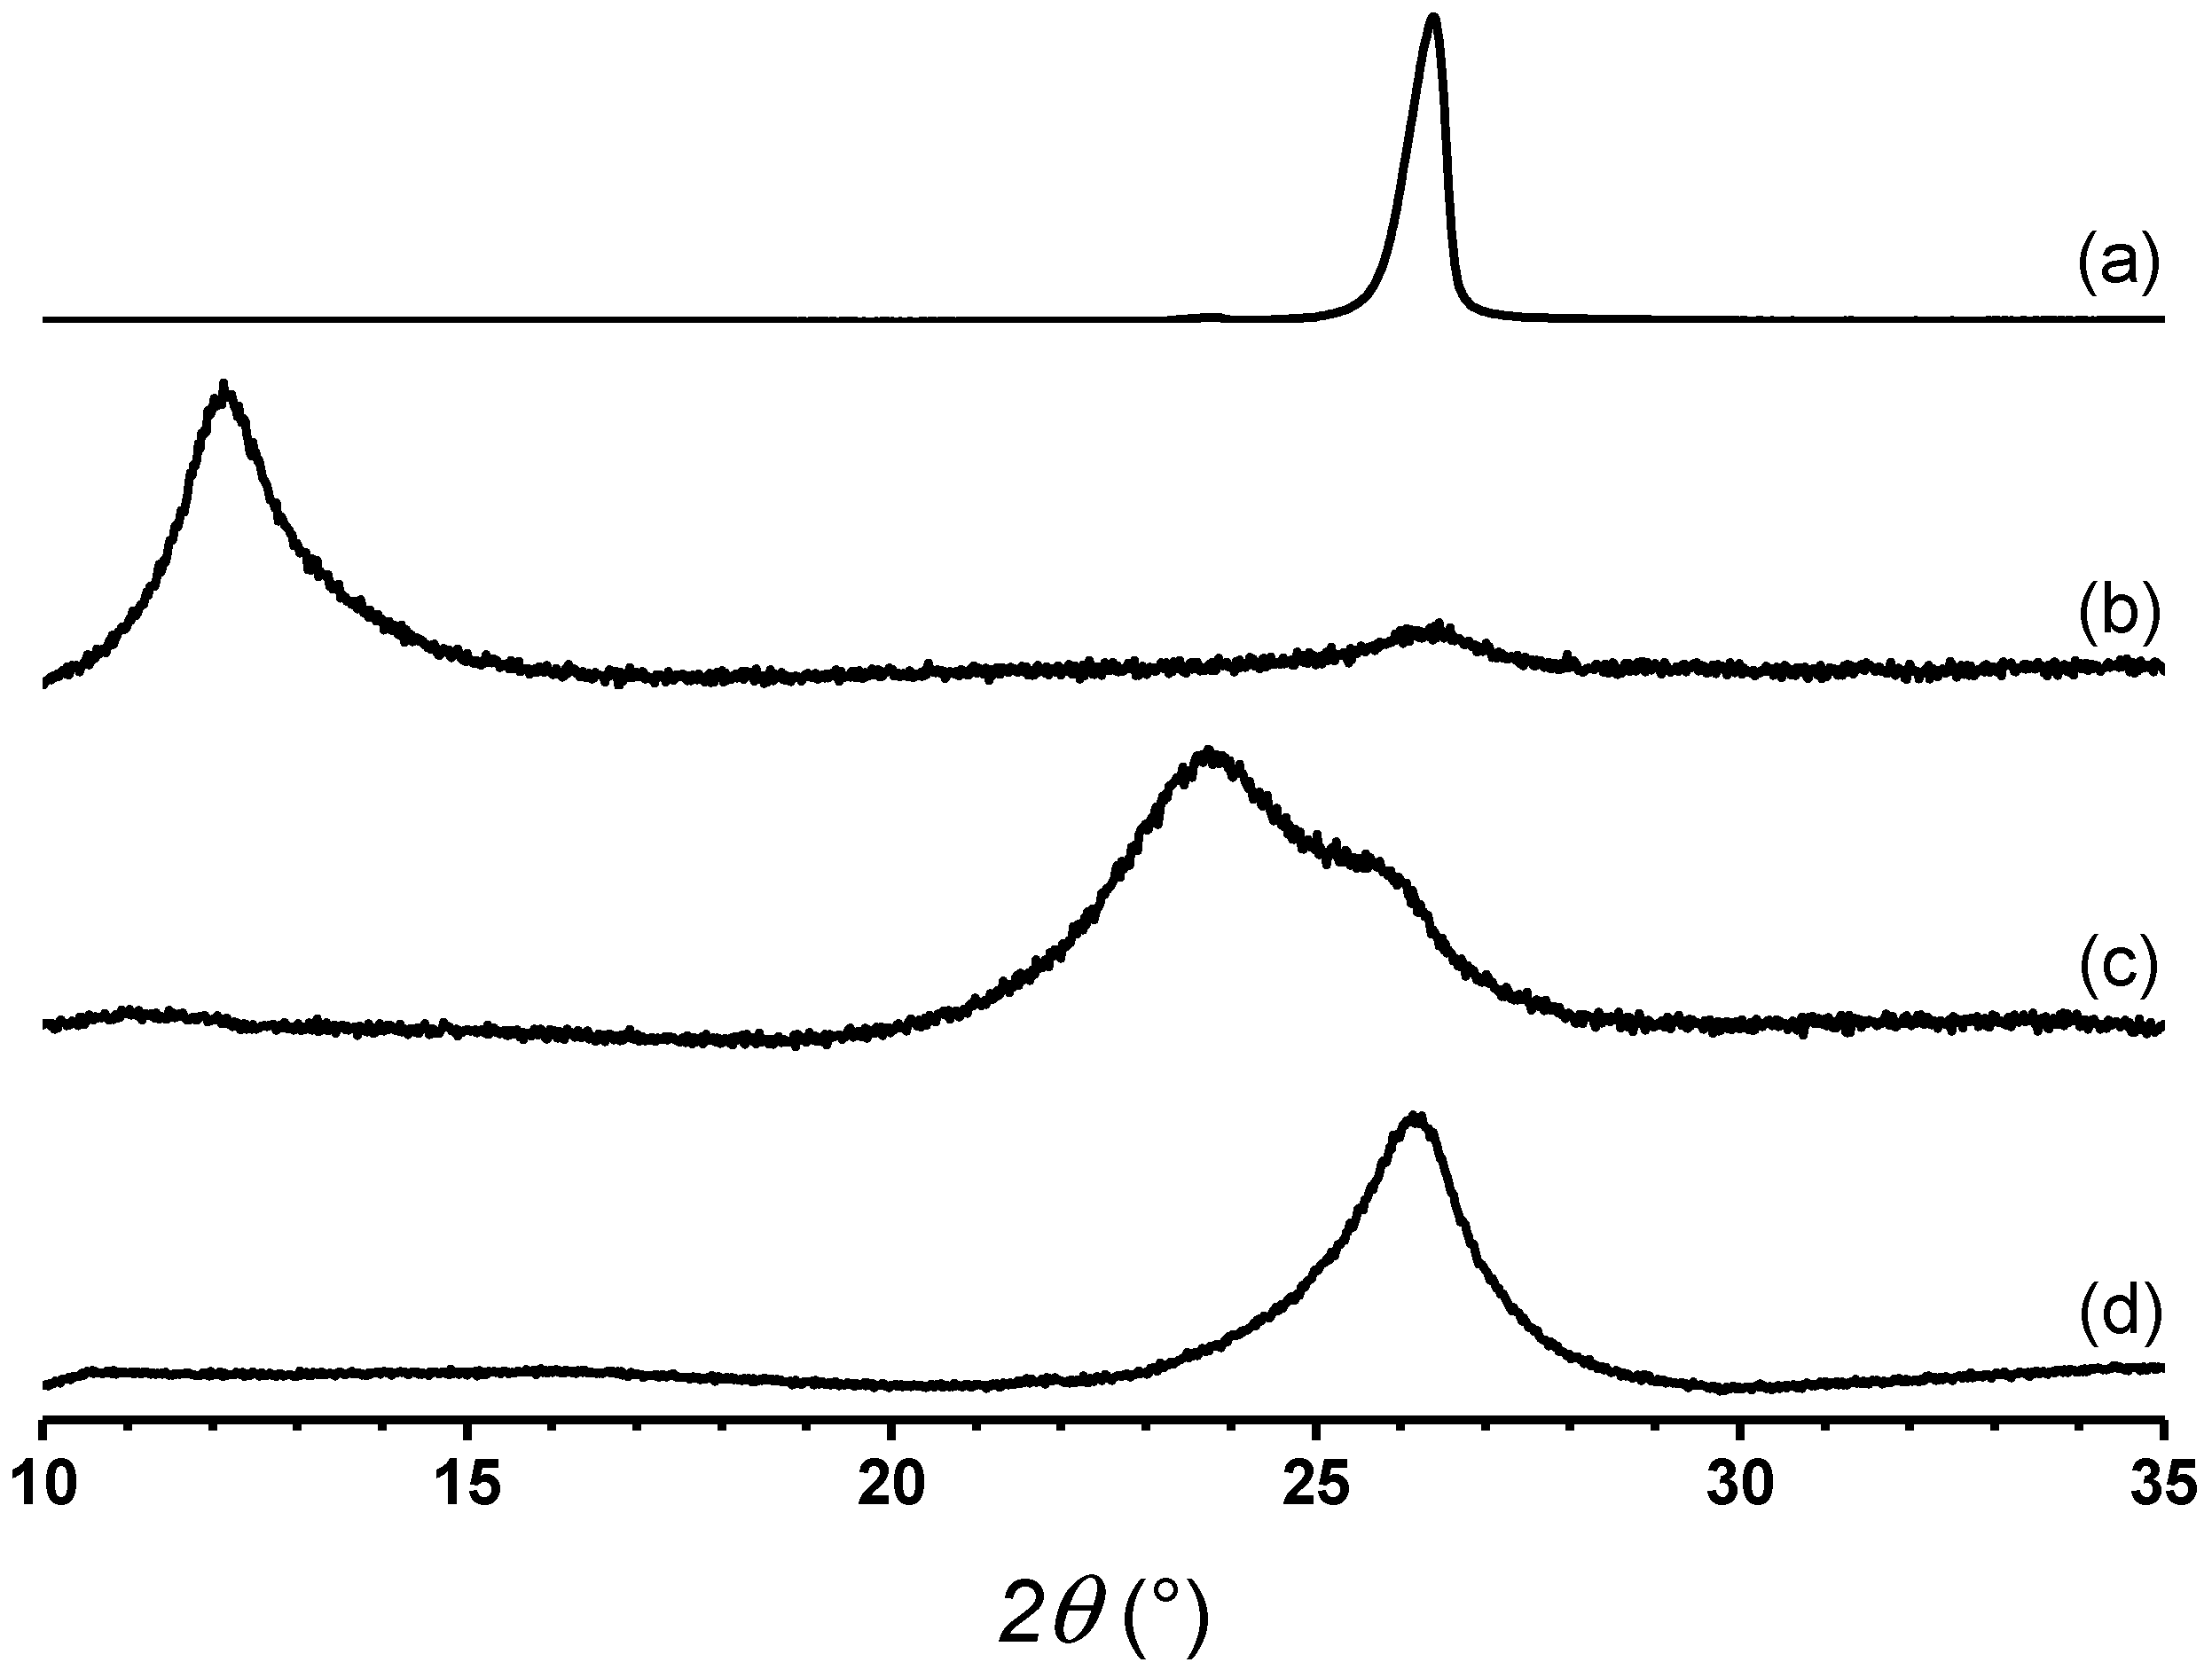
| Sample | X-ray Diffraction | Raman Spectroscopy | ||||||||
|---|---|---|---|---|---|---|---|---|---|---|
| 2θ (°) | d00l (nm) | D00l (nm) | NL | D | G | D’ | 2D | ID/IG | La (nm) | |
| Graphite | 26.3 | 0.338 | 18.61 | 56 | 1353 | 1578 | 1618 | 2708 | 0.132 | 128 |
| GO | 12.2 | 0.723 | 10.90 | 16 | 1350 | 1570 | 1608 | 2687 | 0.501 | 34 |
| TRGO600 | 25.1 | 0.355 | 3.472 | 11 | 1352 | 1574 | 1608 | 2668 | 0.631 | 27 |
| TRGO1000 | 26.0 | 0.342 | 4.100 | 13 | 1346 | 1583 | 1607 | 2681 | 1.006 | 17 |
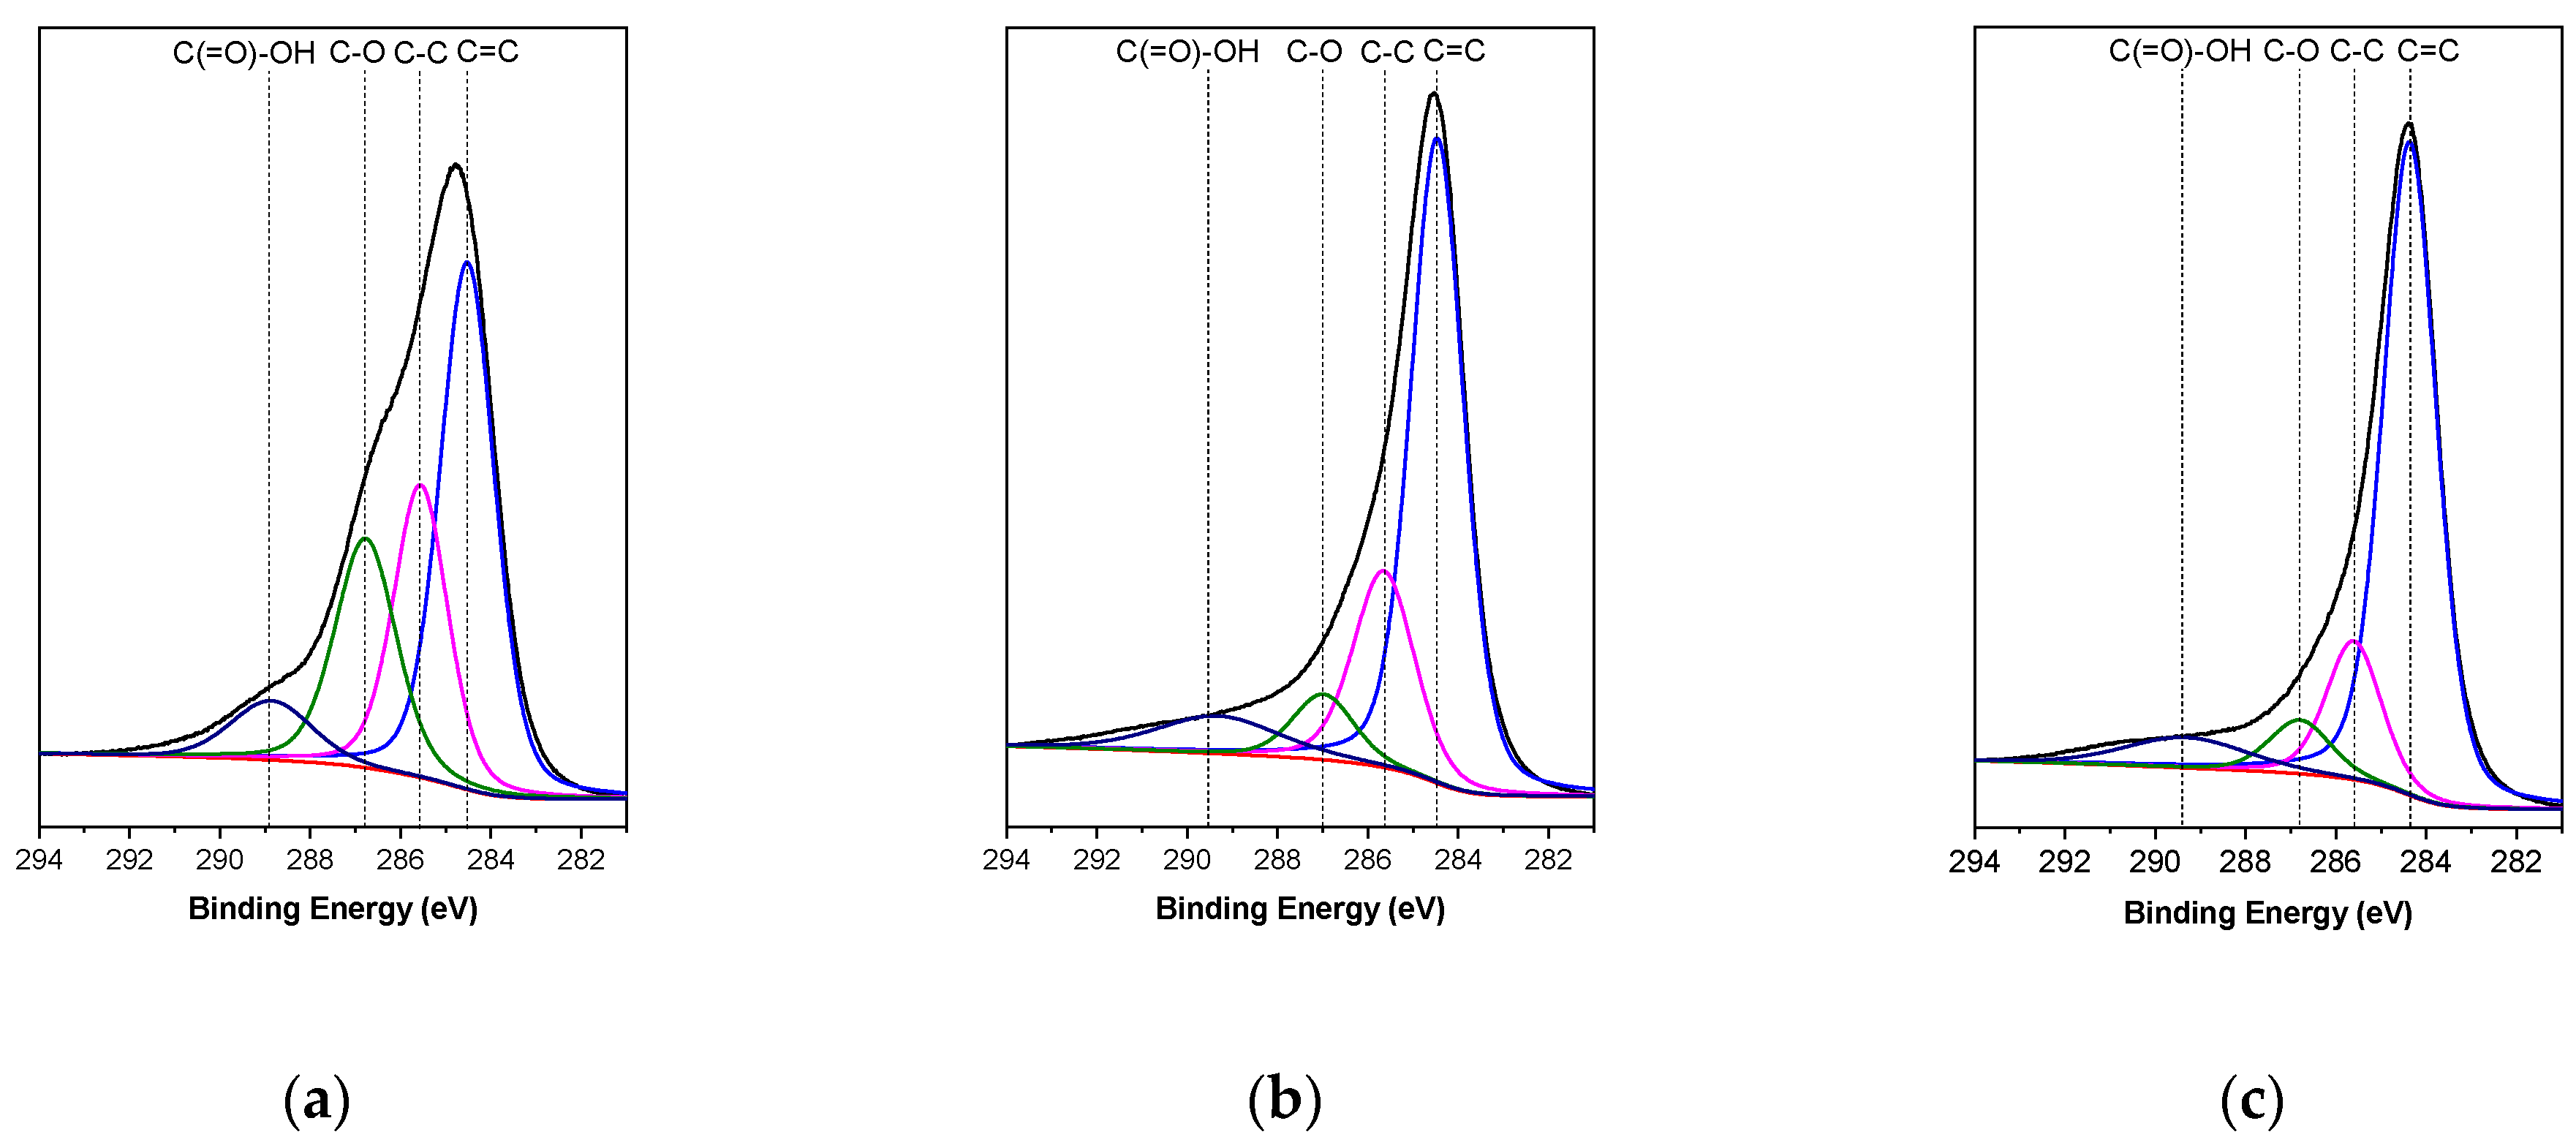
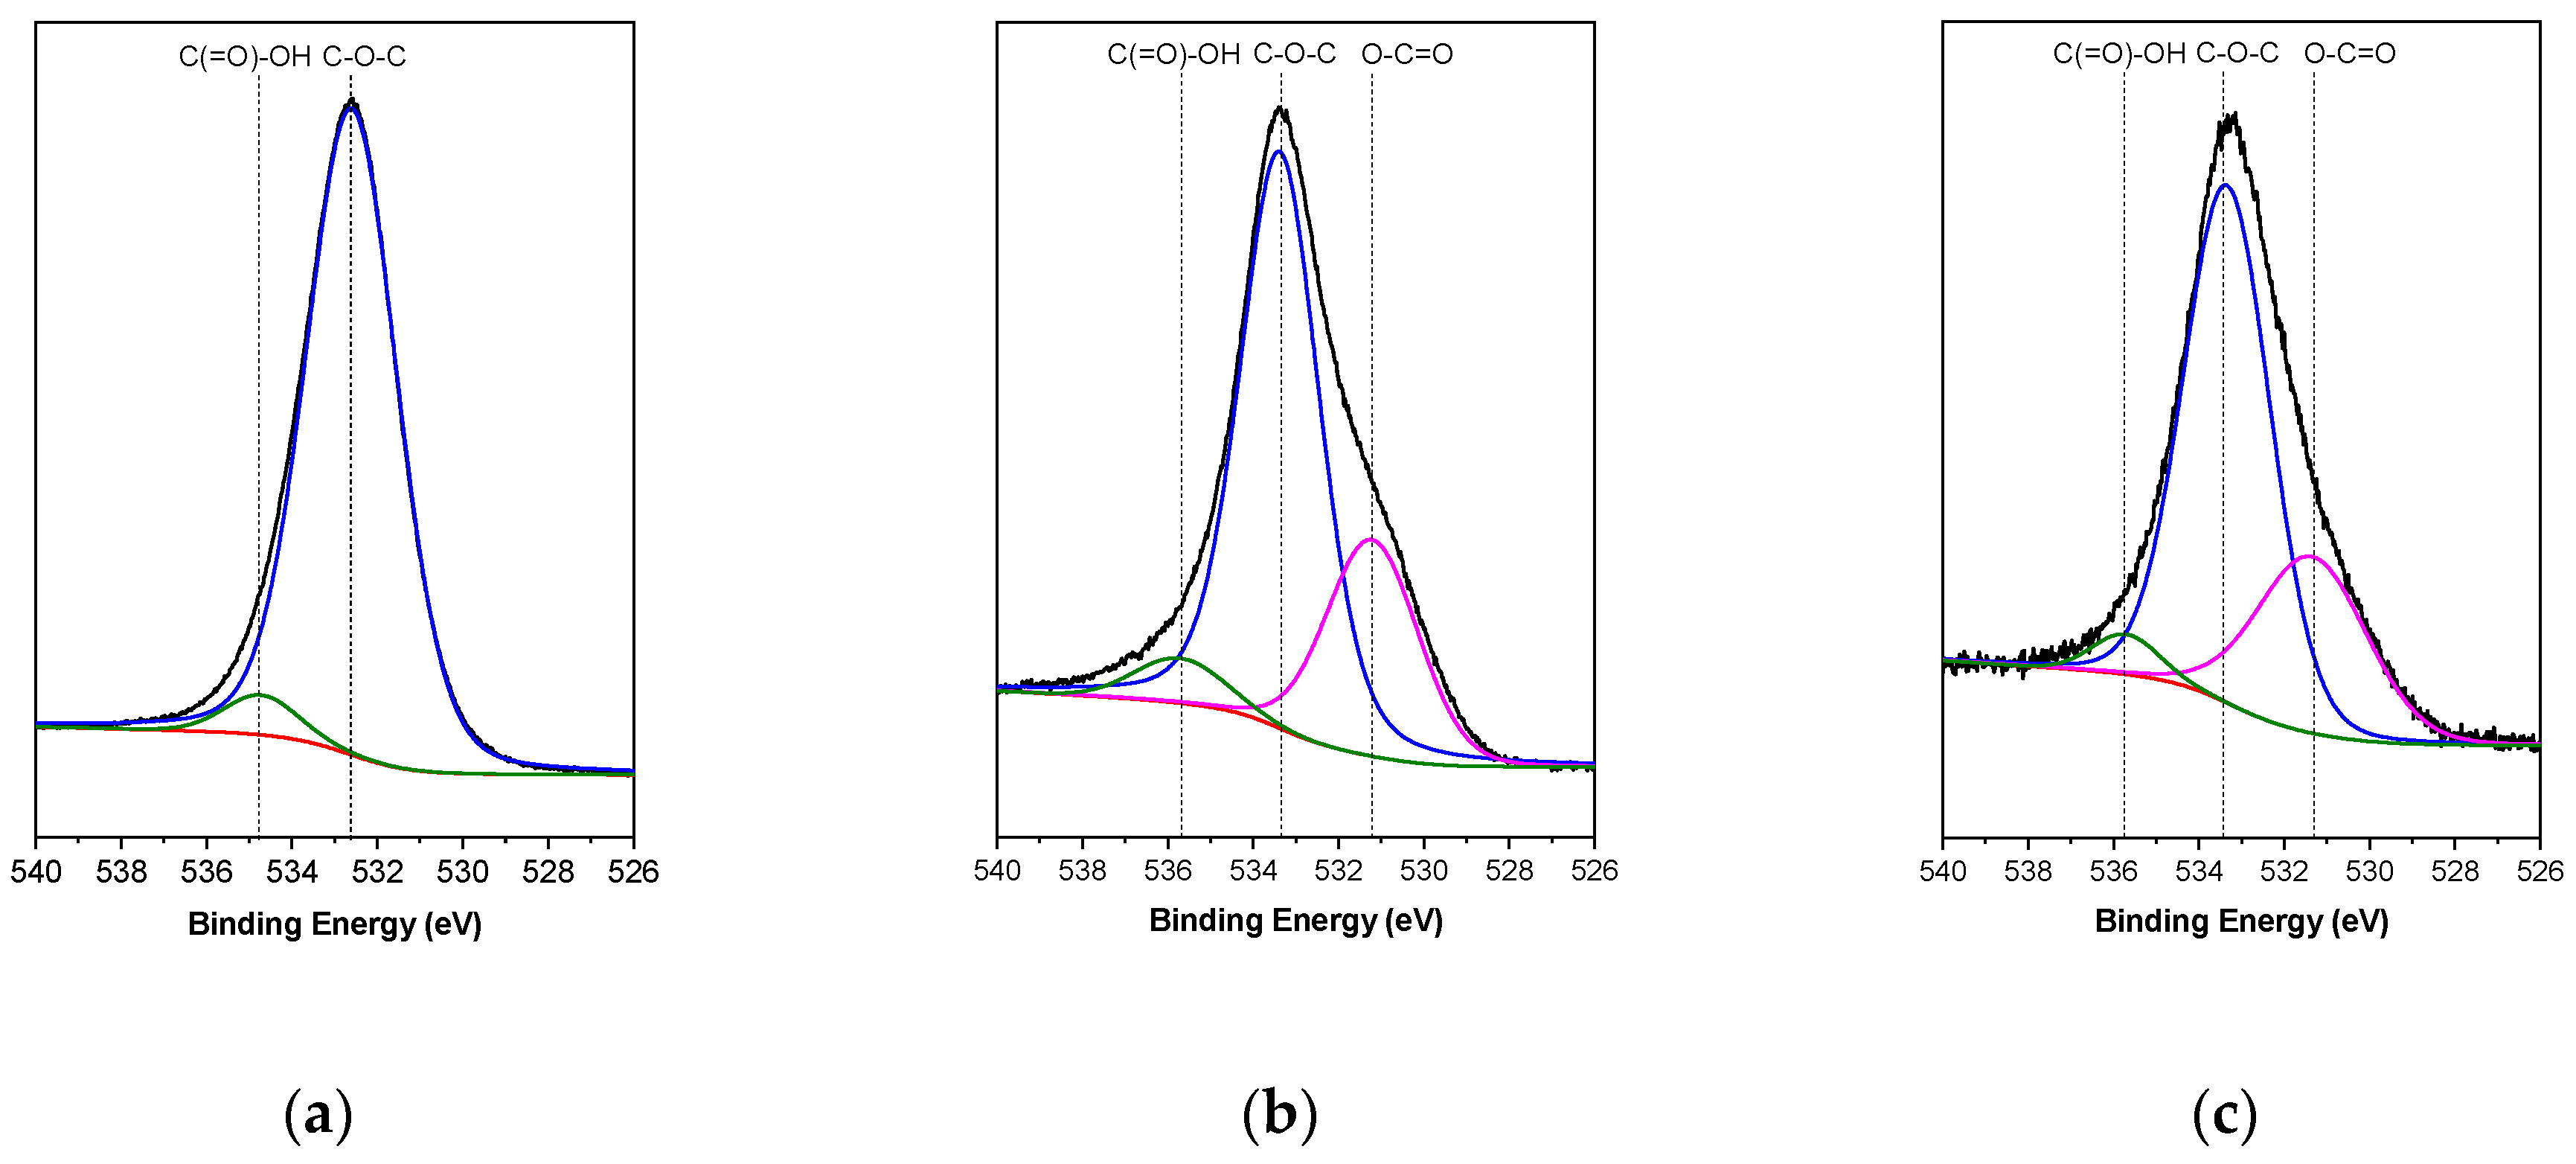
| Sample | Signal | Binding Energy (eV) | Assignment | Area (%) | Atomic Percentage(%) |
|---|---|---|---|---|---|
| GO | C1s | 284.52 | C=C (sp2) | 35.20 | 77.33 |
| 285.56 | C—C (sp3) | 19.40 | |||
| 286.77 | C—O | 17.16 | |||
| 288.86 | C(=O)—OH | 5.57 | |||
| O1s | 532.60 | C(=O)—OH | 21.63 | 22.67 | |
| 534.73 | C—O—C | 1.04 | |||
| TRGO600 | C1s | 284.46 | C=C (sp2) | 55.95 | 89.85 |
| 285.65 | C—C (sp3) | 19.68 | |||
| 286.99 | C—O | 6.57 | |||
| 289.32 | C(=O)—OH | 7.65 | |||
| O1s | 531.22 | O—C=O | 2.73 | 10.15 | |
| 533.38 | C—O—C | 6.89 | |||
| 535.72 | C(=O)—OH | 0.53 | |||
| TRGO1000 | C1s | 284.46 | C=C (sp2) | 66.97 | 94.83 |
| 285.65 | C—C (sp3) | 14.61 | |||
| 286.99 | C—O | 6.31 | |||
| 289.32 | C(=O)—OH | 6.94 | |||
| O1s | 531.22 | O—C=O | 1.49 | 5.17 | |
| 533.38 | C—O—C | 3.49 | |||
| 535.72 | C(=O)—OH | 0.19 |
| Content of Filler in TPU | Young Modulus (MPa) | Tensile Strength (MPa) | Elongation at Break (%) |
|---|---|---|---|
| 0 wt.% | 7.0 ± 0.6 | 47.6 ± 5.1 | 1235 ± 95 |
| TRGO600 1 wt.% | 22.3 ± 0.9 | 4.7 ± 1.0 | 64 ± 20 |
| TRGO600 3 wt.% | 14.6 ± 0.1 | 5.7 ± 0.4 | 235 ± 30 |
| TRGO600 5 wt.% | 16.7 ± 0.2 | 12.2 ± 0.5 | 405 ± 22 |
| TRGO600 7 wt.% | 20.4 ± 0.6 | 14.1 ± 1.4 | 378 ± 20 |
| TRGO1000 1 wt.% | 18.6 ± 2.2 | 6.0 ± 0.6 | 157 ± 23 |
| TRGO1000 3 wt.% | 16.5 ± 0.4 | 6.8 ± 0.5 | 385 ± 30 |
| TRGO1000 5 wt.% | 16.7 ± 0.3 | 7.1 ± 0.5 | 250 ± 20 |
| TRGO1000 7 wt.% | 22.4 ± 0.4 | 8.0 ± 1.8 | 287 ± 12 |
| Content of Filler in TPU | Permeability (Barrier) | Permeability Variation (%) |
|---|---|---|
| 0 wt.% | 1.54 ± 0.08 | 0 |
| TRGO600 1 wt.% | 1.65 ± 0.12 | +7.14 |
| TRGO600 3 wt.% | 1.95 ± 0.23 | +26.62 |
| TRGO600 5 wt.% | 1.29 ± 0.05 | −16.24 |
| TRGO600 7 wt.% | 0.99 ± 0.12 | −35.72 |
| TRGO1000 1 wt.% | 0.90 ± 0.17 | −41.56 |
| TRGO1000 3 wt.% | 0.83 ± 0.12 | −46.10 |
| TRGO1000 5 wt.% | 0.89 ± 0.20 | −42.20 |
| TRGO1000 7 wt.% | 1.18 ± 0.12 | −23.38 |
Publisher’s Note: MDPI stays neutral with regard to jurisdictional claims in published maps and institutional affiliations. |
© 2020 by the authors. Licensee MDPI, Basel, Switzerland. This article is an open access article distributed under the terms and conditions of the Creative Commons Attribution (CC BY) license (http://creativecommons.org/licenses/by/4.0/).
Share and Cite
Maldonado-Magnere, S.; Yazdani-Pedram, M.; Aguilar-Bolados, H.; Quijada, R. Thermally Reduced Graphene Oxide/Thermoplastic Polyurethane Nanocomposites: Mechanical and Barrier Properties. Polymers 2021, 13, 85. https://doi.org/10.3390/polym13010085
Maldonado-Magnere S, Yazdani-Pedram M, Aguilar-Bolados H, Quijada R. Thermally Reduced Graphene Oxide/Thermoplastic Polyurethane Nanocomposites: Mechanical and Barrier Properties. Polymers. 2021; 13(1):85. https://doi.org/10.3390/polym13010085
Chicago/Turabian StyleMaldonado-Magnere, Santiago, Mehrdad Yazdani-Pedram, Héctor Aguilar-Bolados, and Raul Quijada. 2021. "Thermally Reduced Graphene Oxide/Thermoplastic Polyurethane Nanocomposites: Mechanical and Barrier Properties" Polymers 13, no. 1: 85. https://doi.org/10.3390/polym13010085