1. Introduction
Polymer brushes consist of polymer chains densely grafted by one end to an interface [
1]. Interactions of proteins with such structures have been a subject of significant interest and investigation in colloid and polymer science for quite some time [
1,
2,
3,
4,
5,
6,
7]. In many cases polymer brushes are studied to control the protein adsorption onto surfaces [
8,
9]. This becomes more complex when the brush is composed of charged polymer chains, i.e., polyelectrolytes [
4,
10,
11,
12,
13,
14]. Surfaces modified with polyelectrolyte brushes have been frequently investigated as they are related to “smart” or stimuli responsive surface coatings [
15] and biosensors [
16]. Furthermore, polyelectrolyte brushes can be applied to prevent biofouling [
11]. It is known that proteins adsorbed and immobilized onto polyelectrolyte brushes can retain their conformation [
17] as well as their (enzymatic) activity [
18,
19]. Understanding protein adsorption to polyelectrolyte brushes is therefore obviously needed for nanotoxicology and nanomedicine [
20].
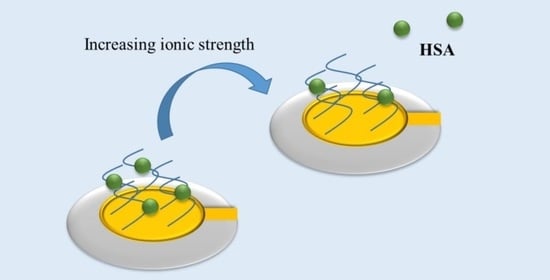
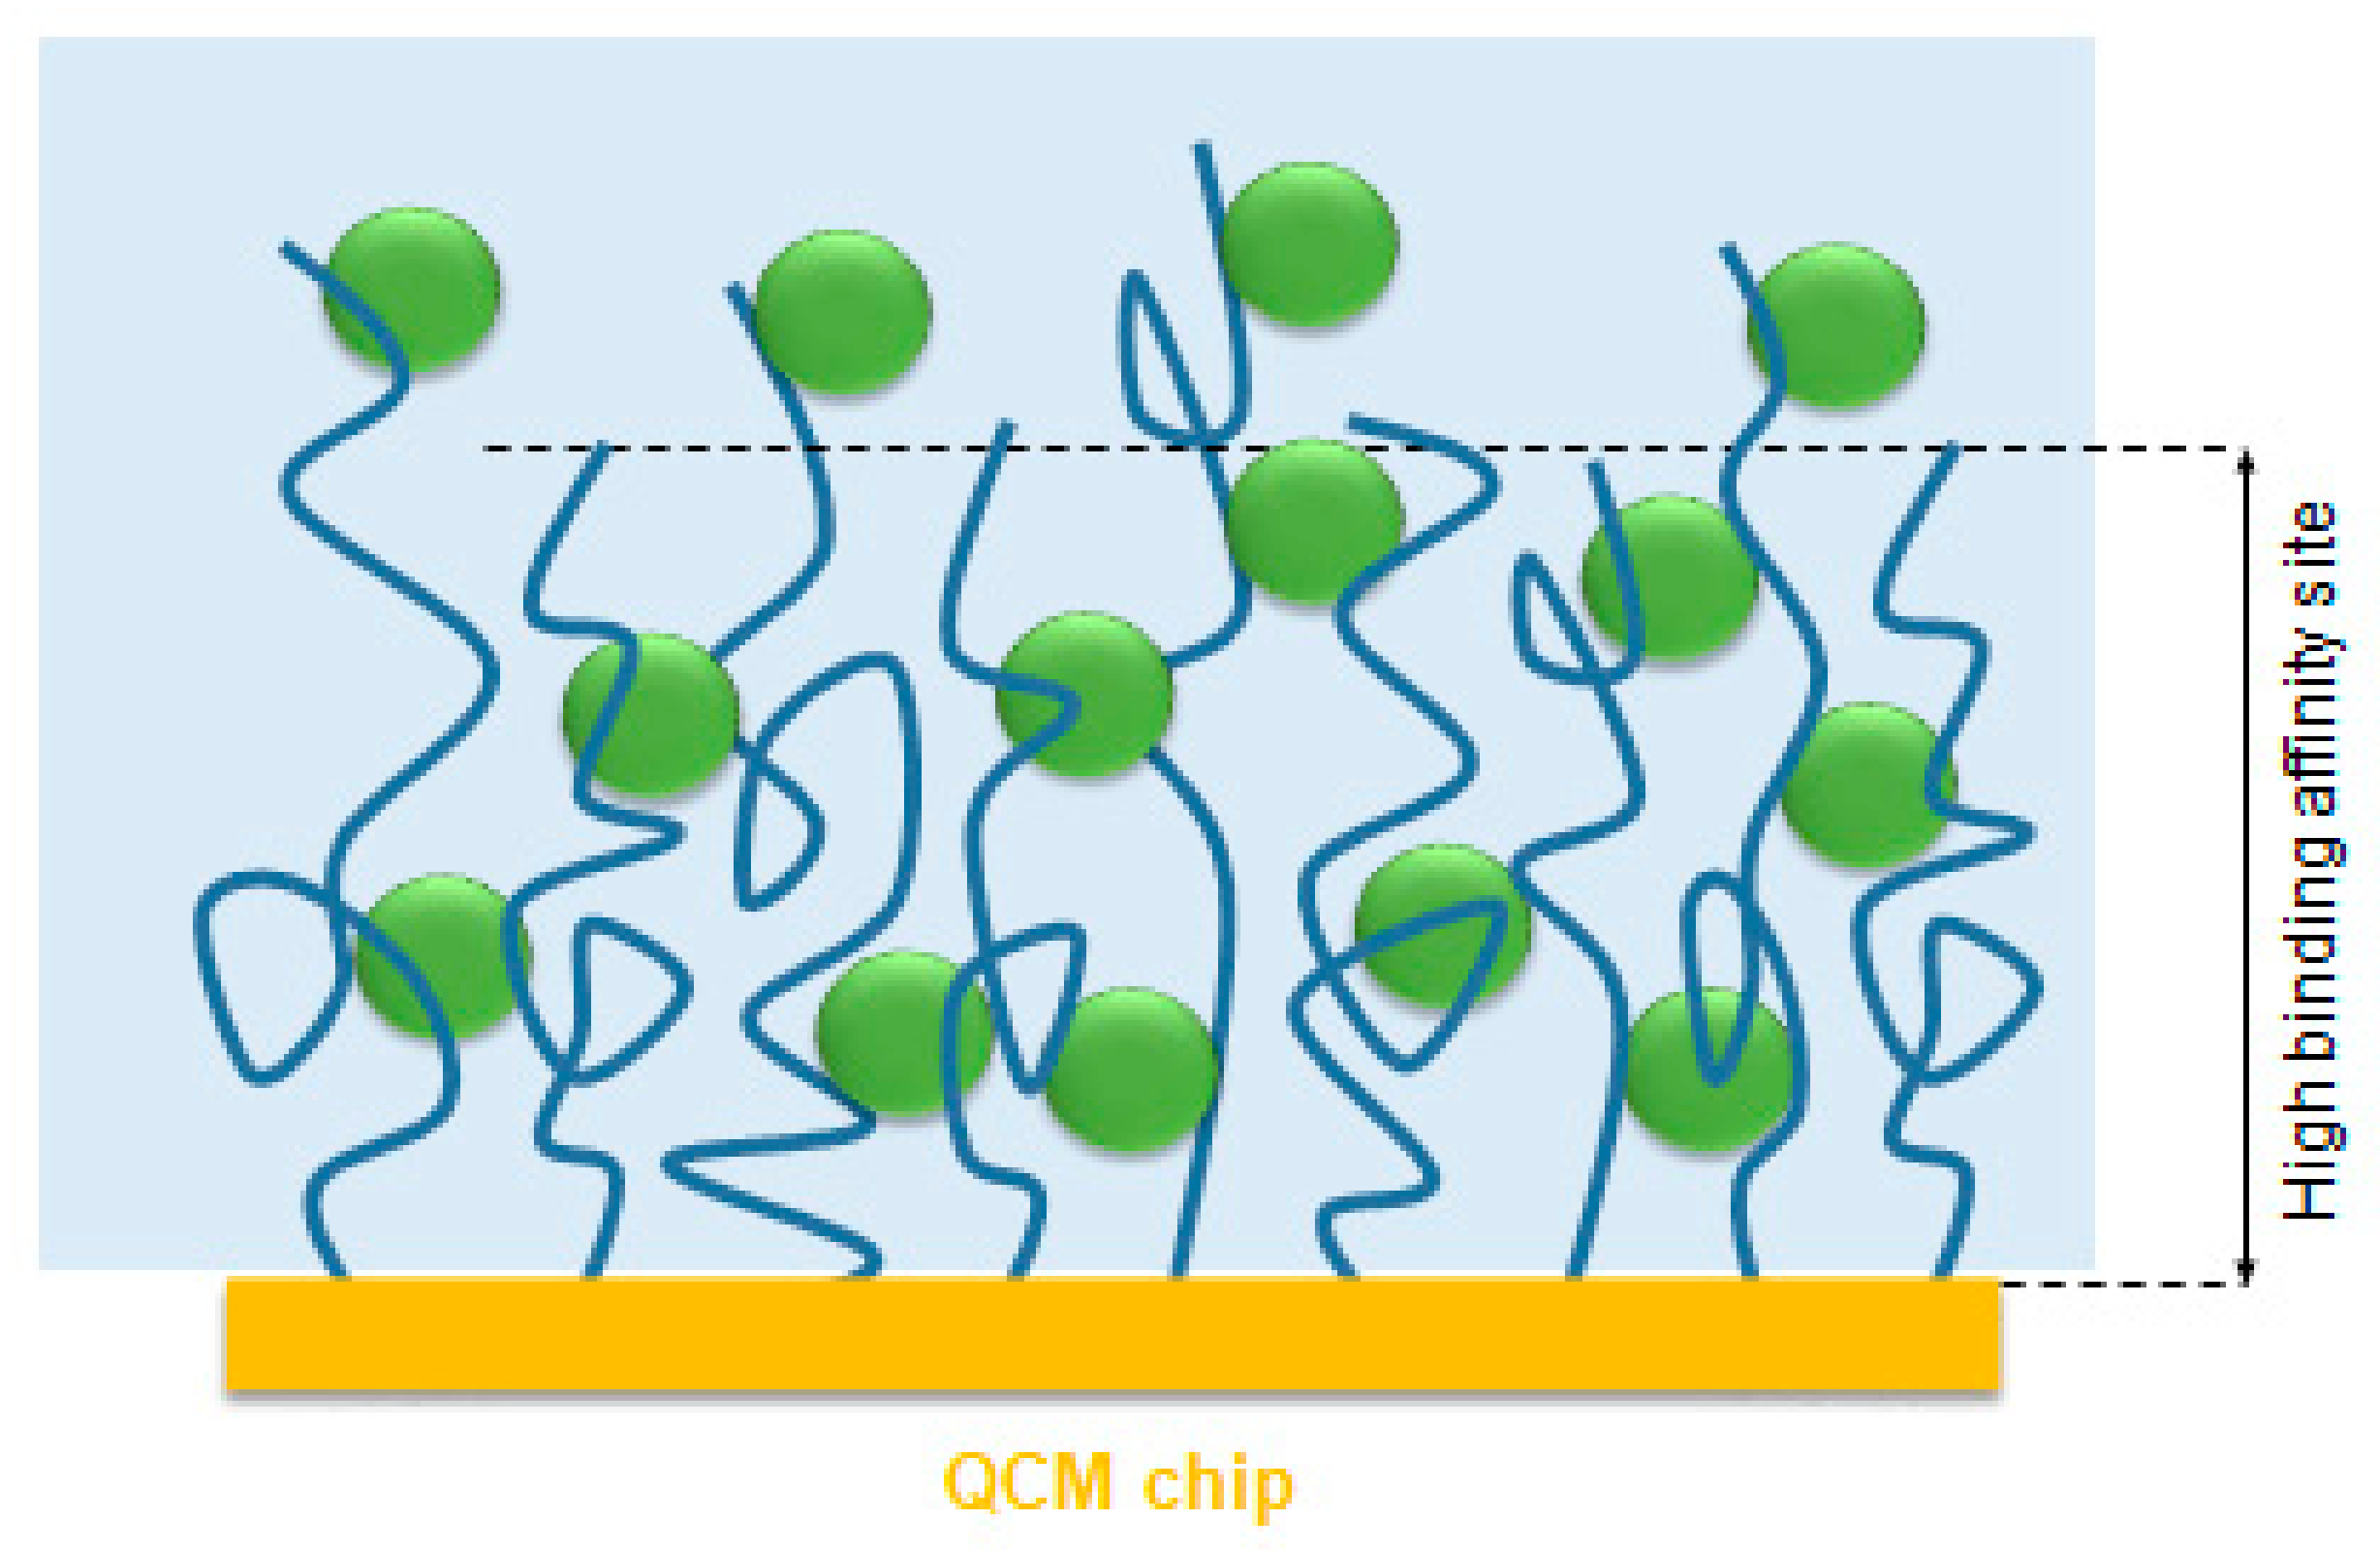
Proteins can be taken up or released from polyelectrolyte brushes depending on salt concentrations (see
Figure 1) [
21,
22]. This is due to the counterion release mechanism [
23] which is the main driving force for protein adsorption onto polyelectrolyte brushes [
4]. Here the charged patches on the surface of the protein may function as multivalent counterions for the polyelectrolyte chain thus releasing a number of its condensed counterions. The gain in entropy thus achieved is the major driving force for the adsorption of proteins to polyelectrolytes. Therefore the effective degree of ionization and the charge distribution in the polyelectrolyte brush ─which strongly depends on the salt concentration and pH of the solution [
24]—is crucial for protein adsorption.
The characterization of polyelectrolyte brushes and their stimulus response to changes in salt concentration and pH has been the focal point of a large number of articles. Thus, the effect of grafting density on brush conformation [
25,
26], the hysteretic memory of brushes [
24], the ion specific effects on brush conformation [
27] and the interactions with proteins [
11,
25,
28] have all been studied in detail. We recently showed that proteins can adsorb onto like-charged spherical polyelectrolyte brushes (SPBs) [
21,
29,
30]. Using FT-IR spectroscopy we established that the secondary structure of the adsorbed proteins was preserved [
17,
31]. Moreover, using small angle X-ray and neutron scattering (SAXS and SANS) we found that proteins are evenly distributed within the brush [
29]. By coupled spectroscopic ellipsometry and quartz-crystal microbalance with dissipation monitoring (QCM-D), Bittrich et al. studied the amount of buffer component coupled to a PAA brush in swelling and protein adsorption process [
32]. QCM-D is a technique that is sensitive to the mass change and the viscoelastic properties of an adsorbed layer [
33,
34]. Delcroix et al. studied the pH- and salt- dependent polymer conformation and protein adsorption on several polymer brushes [
35]. In particular, they defined a protocol for systematic polymer conformational change evaluation upon protein adsorption by QCM-D.
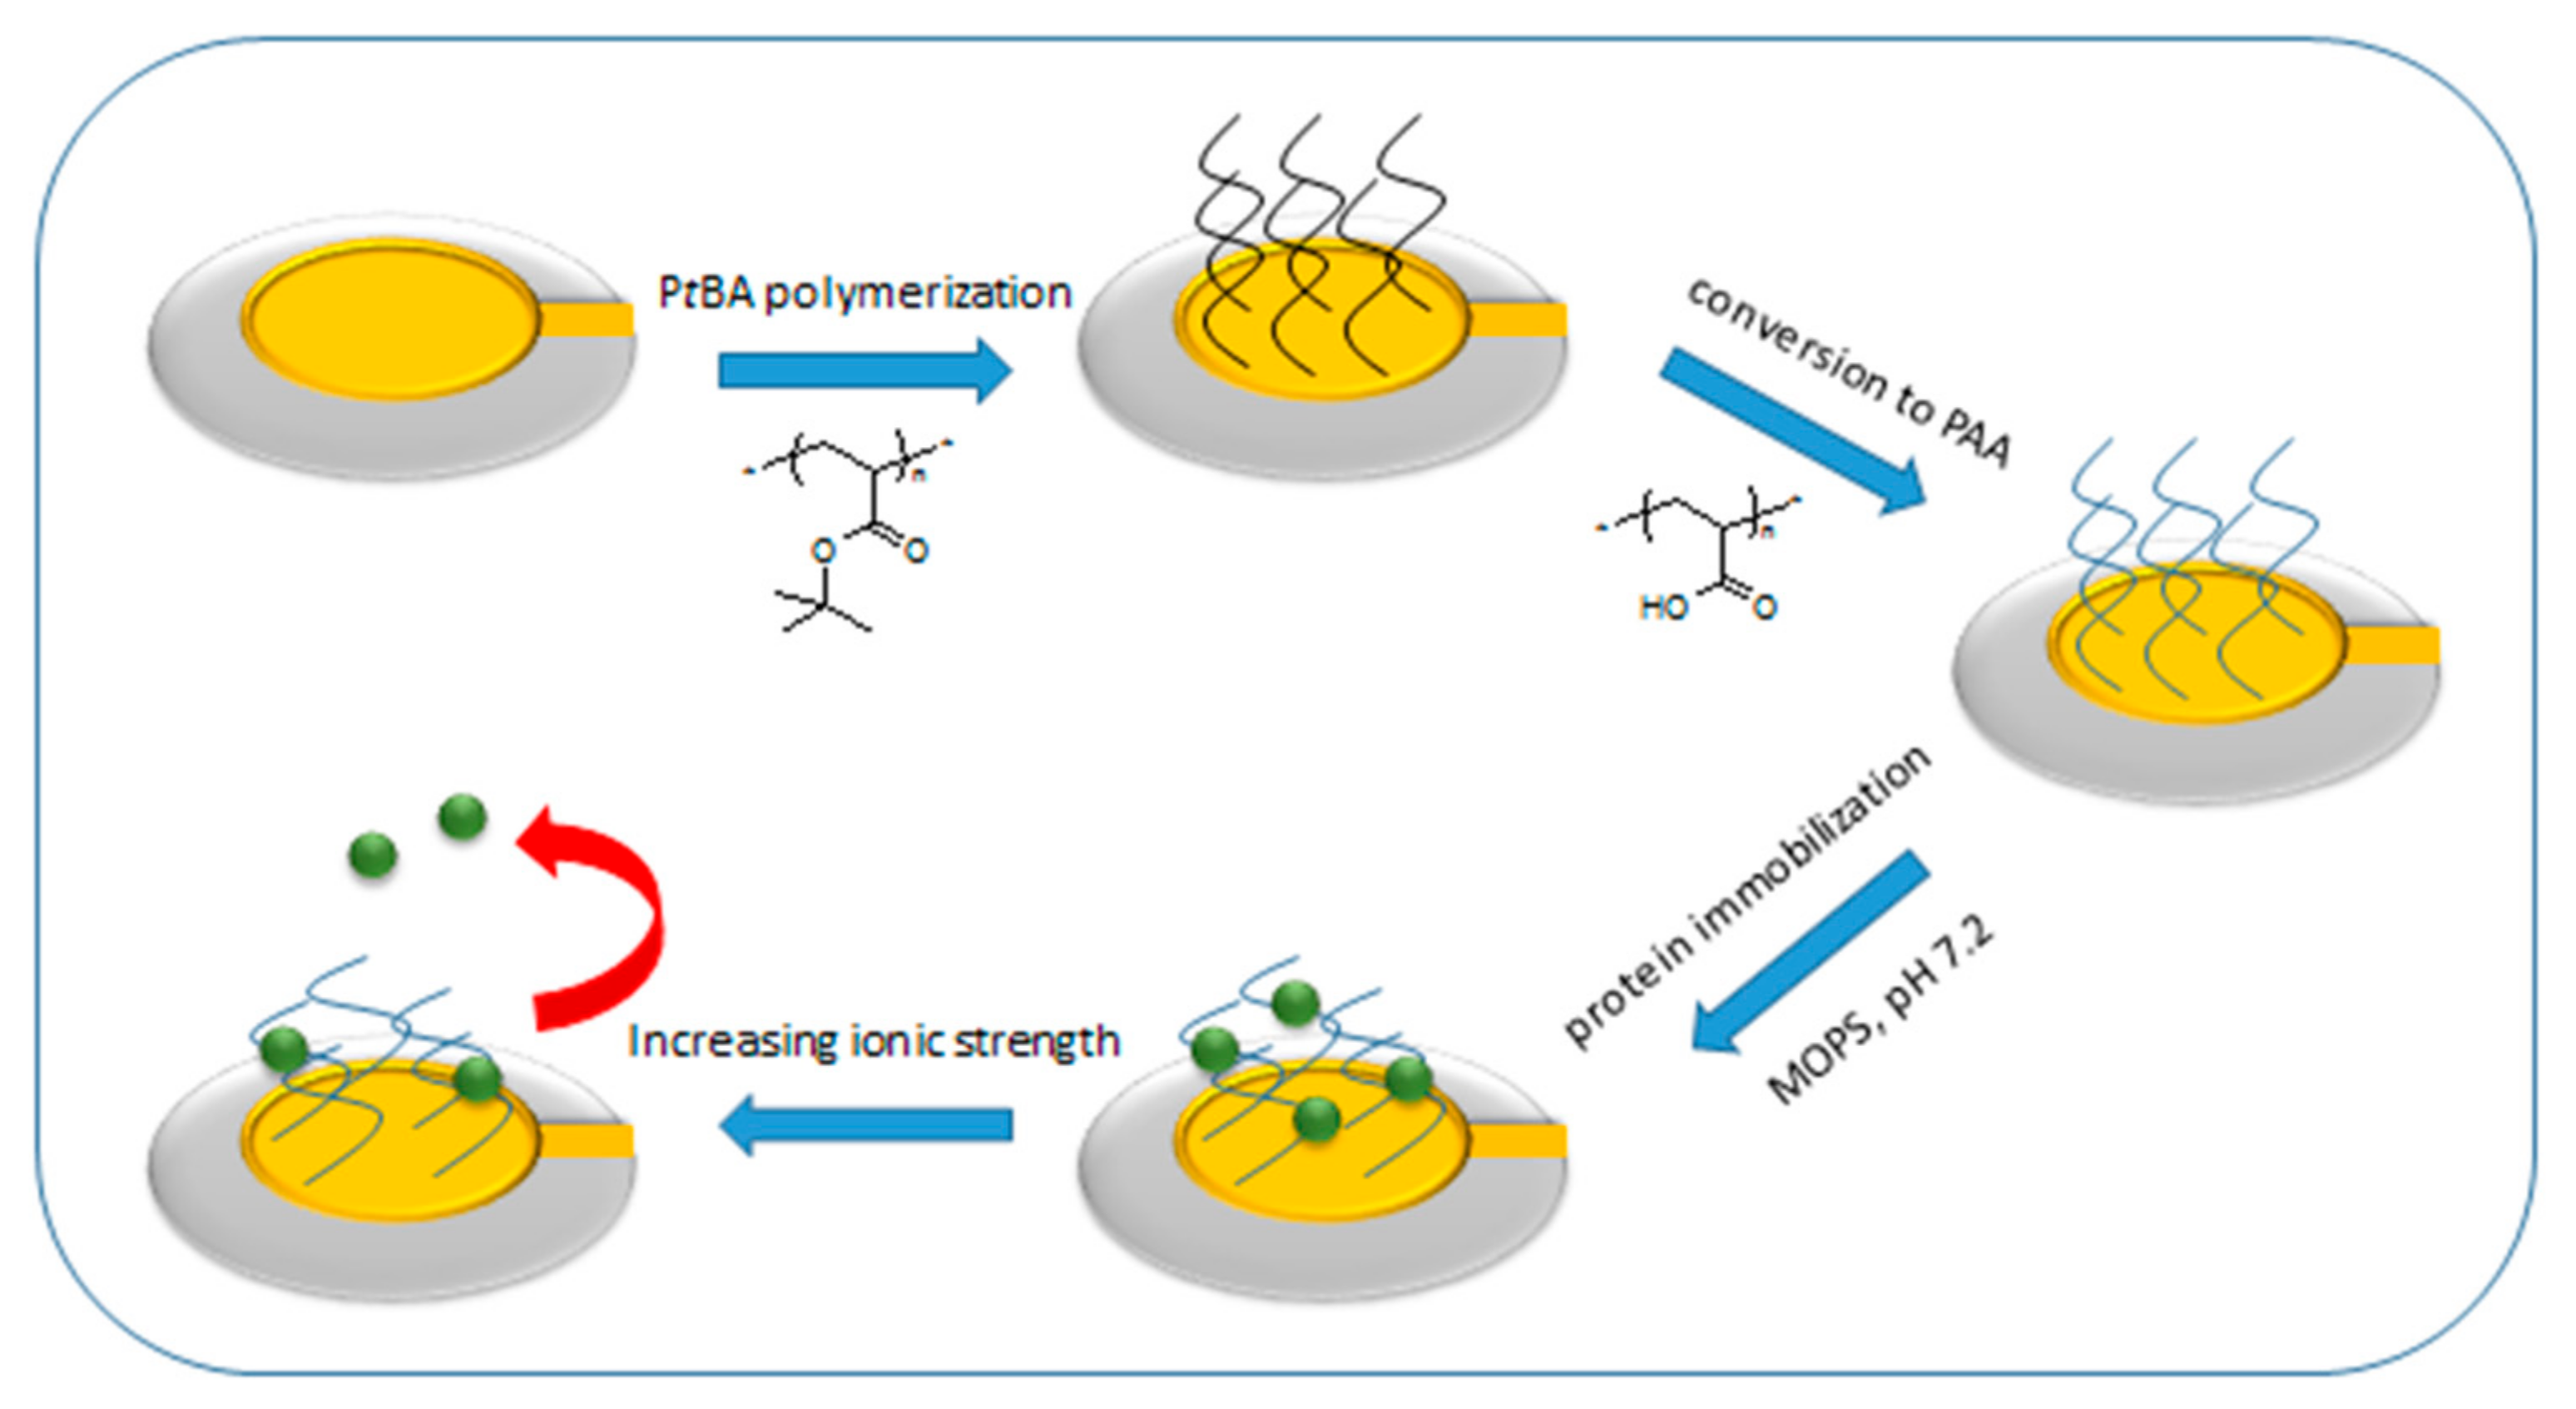
Here we present a QCM-D study of HSA adsorption onto a planar PAA brush that allows us a quantitative comparison with our recent calorimetric studies of the same problem [
30,
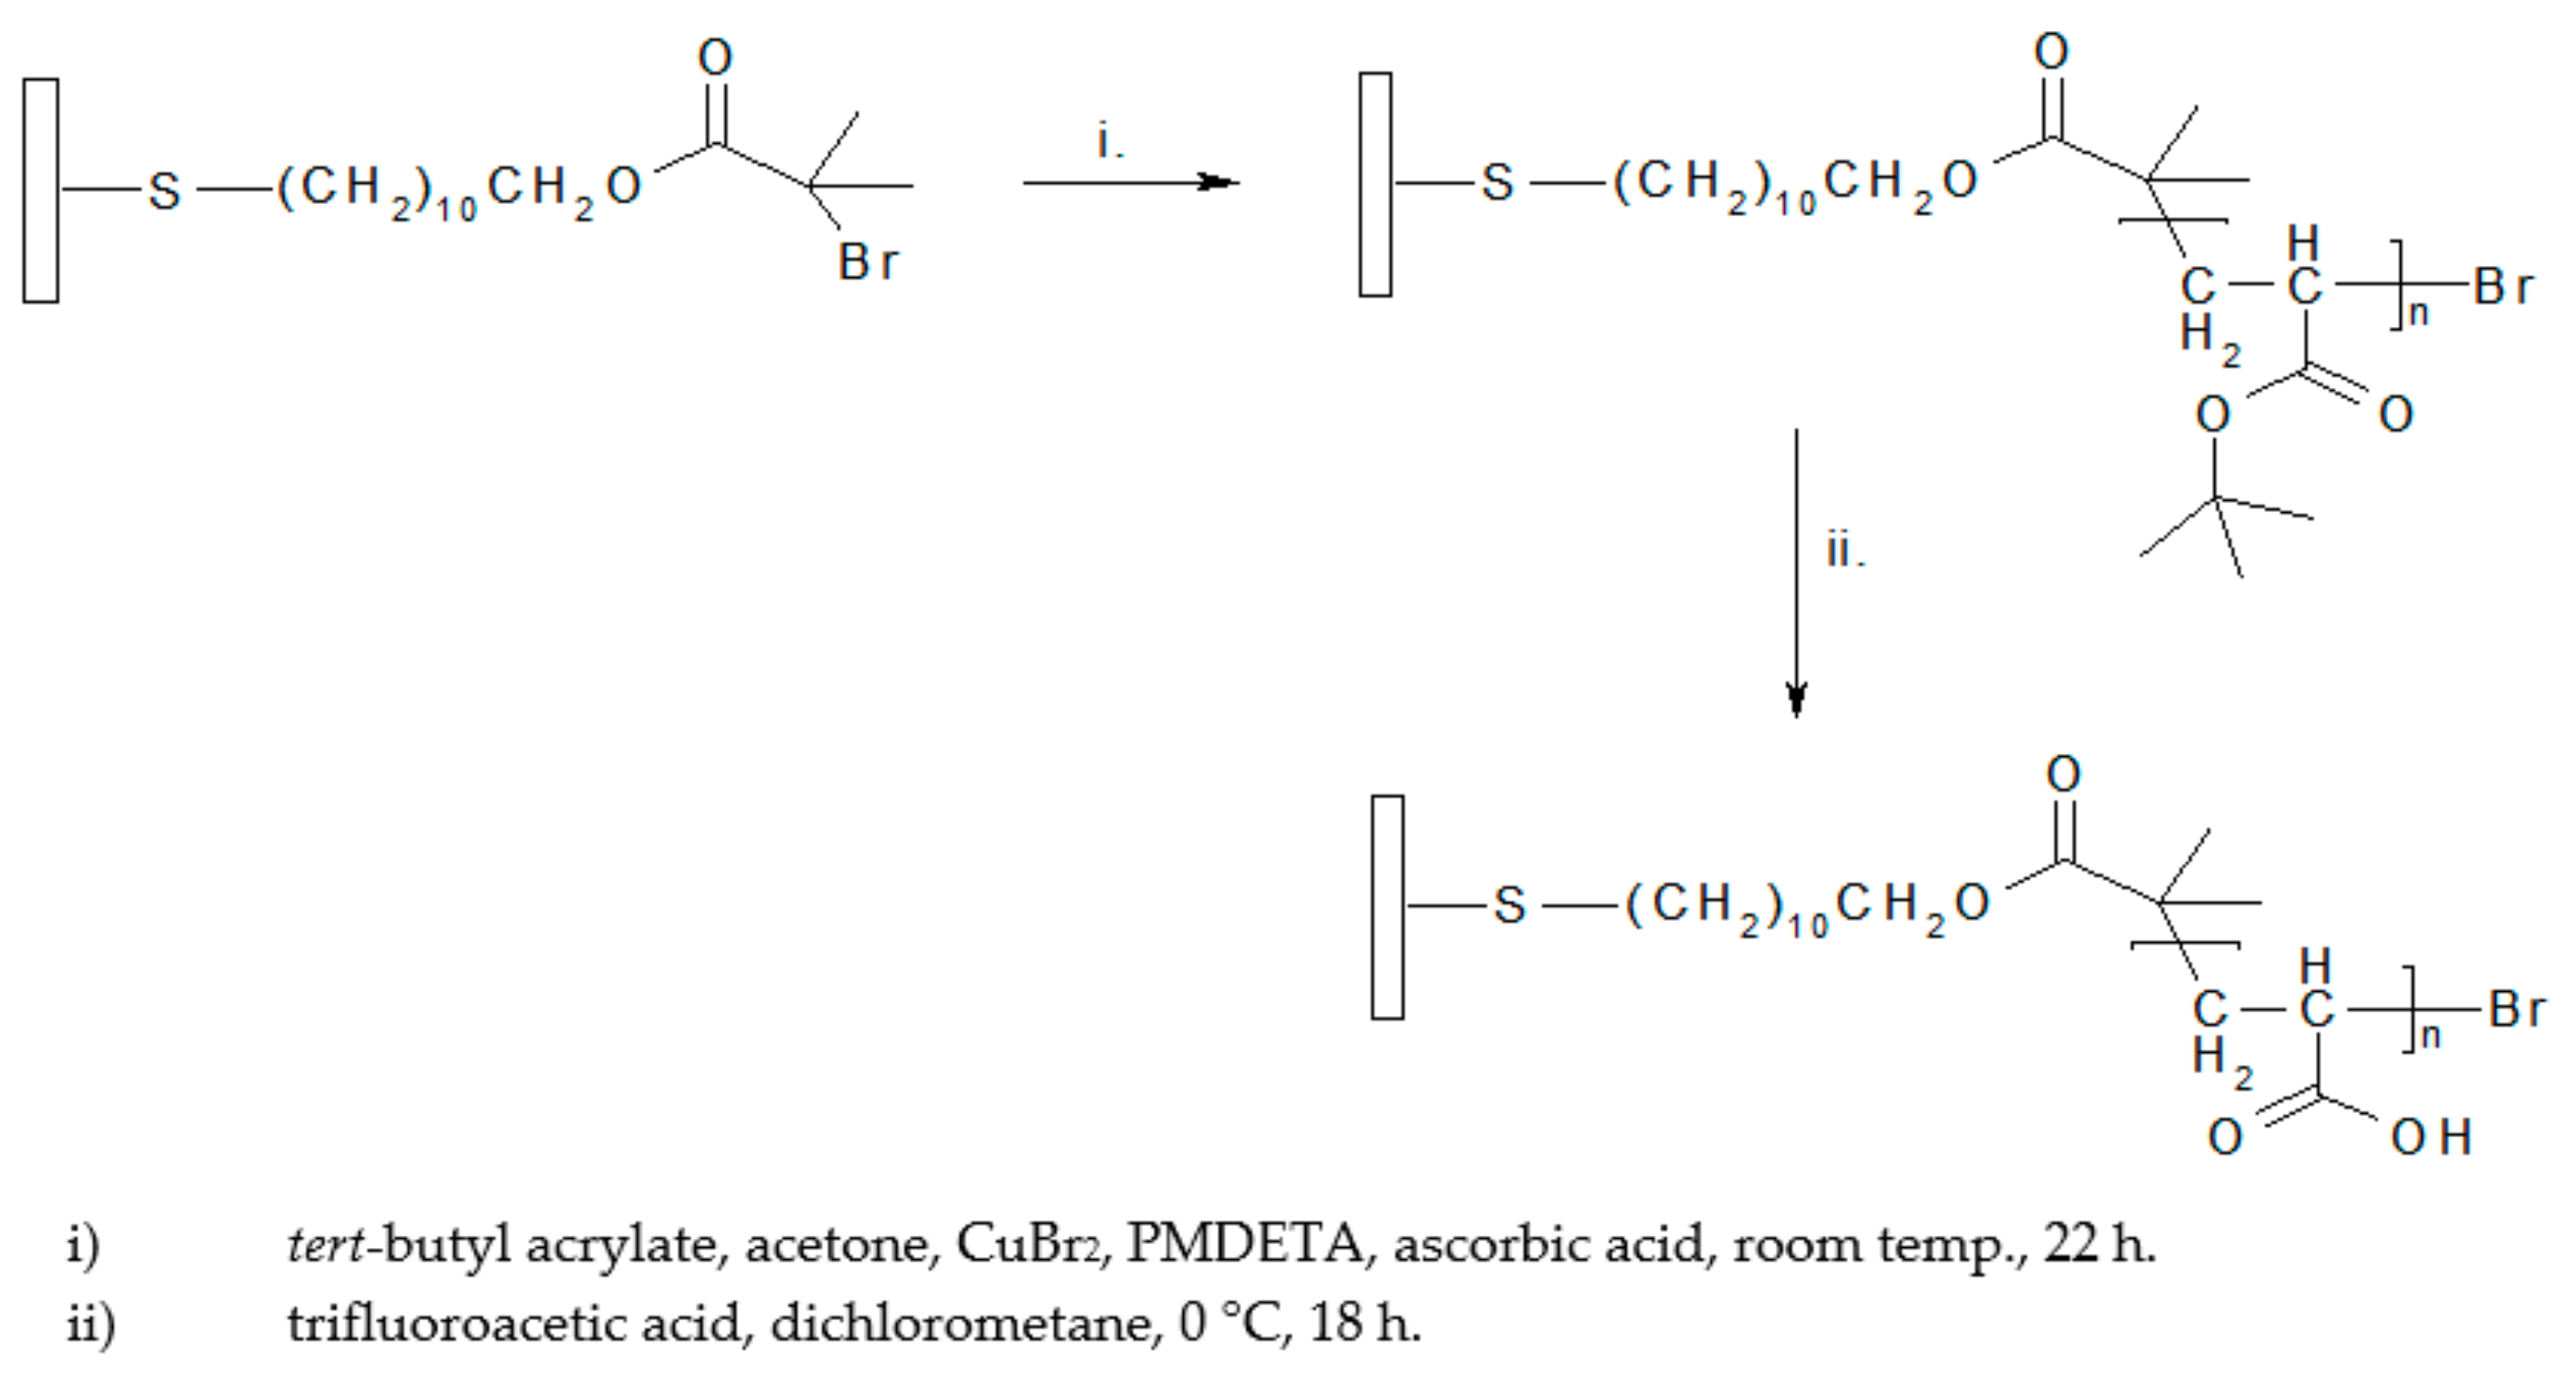
36]. In this way precise structural information can be combined with thermodynamic information. We synthesized the brush layer by atom transfer radical polymerization (ATRP) [
37,
38,
39]. The ATRP synthesis of PAA brushes consists of two steps, namely, the growth of P
tBA brush and its subsequent acidic hydrolysis into PAA brush [
40,
41,
42]. Surface-initiated ATRP (SI-ATRP) as a grafting from method for surface functionalization with polymer brushes was established recently by several groups [
43,
44]. Yadav et al. have grown P
tBA brushes from silicon wafers using SI-ATRP and converted them into PAA brushes by acid hydrolysis [
24]. Li et al. have grown mixed P
tBA/polystyrene (PS) brushes from silica particles using living radical polymerization techniques with subsequent hydrolysis of P
tBA towards PAA/PS brushes [
45]. Borisova et al. showed that PAA brushes can be grafted from gold QCM crystals by nitroxide-mediated radical polymerization (NMP) [
46]. Here we utilized an activator regenerated by electron transfer (ARGET) ATRP with the surface initiated procedure where an ATRP initiator is at first immobilized on the surface of a solid substrate [
47]. The ARGET ATRP enables to drive the polymerization reaction to high conversion [
48,
49].
Here we also used the QCM-D technique to study polyelectrolyte brush swelling and protein adsorption to verify the utility of our synthetic route in functionalization of QCM crystals (see
Figure 1). By analysis of QCM-D data based on thermodynamic study of a well-controlled model system [
30,
36] we present a comprehensive study on brush synthesis and its interaction with proteins.
The paper is organized as follows: in
Section 2 we present the materials and experimental methods used for the synthesis and characterization of PAA brush. We describe the conditions of the QCM-D experiments and we present a short description of the methods used for data analysis. In the last section we present our results along with discussion devoted to PAA brush conformation and its interaction with HSA as a function of ionic strength (I) and pH. The comparison with calorimetric studies [
30] allows us to analyze the QCM data on the basis of thermodynamic studies.
2. Materials and Methods
2.1. Materials
tert-Butyl acrylate (98%, Aldrich, Darmstadt, Germany) was destabilized by passing through a column of activated basic alumina. CuBr
2 (98%, Aldrich, Darmstadt, Germany),
N,
N,
N′,
N′,
N″–pentamethyldiethylenetriamine (PMDETA, 99%, Aldrich, Darmstadt, Germany), acetone (99.8%, Aldrich, Darmstadt, Germany), L-ascorbic acid (99%, Aldrich, Darmstadt, Germany), sodium dodecyl sulfate (SDS, 98.5%, Aldrich, Darmstadt, Germany) anhydrous dichloromethane (99.8%, Merck, Darmstadt, Germany), trifluoroacetic acid (99%, Aldrich, Darmstadt, Germany), 3-morpholinopropane-1-sulfonic acid (MOPS, 99.5%, Aldrich, Darmstadt, Germany) and human serum albumin (HSA, Mw: 66.5 kDa, 97%, Aldrich, Darmstadt, Germany) were used as received. The water was purified by filtration thorough a Millipore system (Barnstead, Lake Balboa, CA, USA) resulting in resistivity higher than 18 MΩcm. Gold-coated QCM crystals (5 MHz, 14 mm) were purchased from Q-Sense (Biolin Scientific, Västra Frölunda, Sweden) and cleaned prior to use. The synthesis and deposition of the surface-bound initiator bis[2-(2-bromoisobutyryloxy)undecyl]disulfide (DTBU) followed the published procedure [
27].
2.2. Instrumentation
ATR-FTIR spectra were recorded using a FTLA2000 spectrometer (ABB, Zürich, Switzerland) equipped with a MIRacle ATR sampling accessory (PIKE, Madison, WI, USA) in a set with a diamond crystal plate. Contact angles were determined using a NRL-100 contact angle goniometer (Rame Hart, Succasunna, NJ, USA) equipped with a tilting stage. Ellipsometric measurements were performed on a M-88 Variable Angle Spectroscopic Ellipsometer (J. A. Wollam, Lincoln, NE, USA) with a Hg-Xe laser (λ = 300−800 nm) at a fixed angle of incidence of 70°. The thicknesses of the layer underlying the PAA/PtBA films was determined experimentally based on the optical constants of these materials provided in the instrument software, and were then used to build a model. The PAA/PtBA film thickness, in a dry state, was determined using a Cauchy layer algorithm. Prior to this, we ensured that all carboxyl groups within the PAA brush were protonated by providing low pH conditions.
2.3. Immobilization of the Initiator on QCM Crystals
The QCM crystals were cleaned by immersion in 1% SDS solution, (DI) water, acetone and ethanol. At each time they were sonicated in respective medium for 5 min at constant temperature of 50 °C. They were then dried under a flow of gaseous nitrogen and exposed to air plasma (Harrick Plasma Cleaner, Ithaca, NY, USA) for 2 min to activate the surface [
50]. Afterwards, the QCM crystals were immersed for 24 h at room temperature in solution containing 35 mL of ethanol and 80 μL of DTBU initiator. The initiator-grafted QCM crystals were rinsed with ethanol and sonicated in ethanol for 30 min at 25 °C.
2.4. ATRP Procedure for Tert-Butyl Acrylate Polymerization from Flat Substrates
CuBr2 (67.1 mg, 0.30 mmol), acetone (35.0 mL, 0.48 mol), PMDETA (64.7 μL, 0.31 mmol) and tert-butyl acrylate (12.0 mL, 82.7 mmol) were added to a 100 mL glass flask sealed with a rubber septum and degassed by purging with nitrogen for 1 h. Ascorbic acid (0.7 g, 4.0 mmol) was added to the mixture in a glovebox under an argon atmosphere and the solution was stirred (~5 min) until the color changed. For the grafting procedure initiator-grafted gold QCM crystals were dried under a flow of gaseous nitrogen and then transferred to the flask containing the polymerization solution. The polymerization was allowed to proceed at 25 °C for 22 h. Afterwards the QCM crystals were removed and rinsed with DI water, ethanol and dried under a flow of gaseous nitrogen.
2.5. Hydrolysis of Poly(tert-butyl acrylate) to Poly(acrylic acid)
The poly(
tert-butyl acrylate) brush on a QCM crystal was converted into a poly(acrylic acid) brush by acid hydrolysis in dichlorometane (35 mL, 0.55 mol) and trifluoroacetic acid (3.0 mL, 39.2 mmol) according to established procedures [
51,
52,
53]. The conversion proceeded for 18 h at ~0 °C.
2.6. HSA Adsorption: Influence of Salt Concentration and pH
The QCM crystals were calibrated at constant pH (pH = 7.2) in the buffer solution containing 10 mM of 3-morpholinopropane-1-sulfonic acid (MOPS) buffer and 10 mM NaCl. From this point forward such buffer solutions characterized by pH = 7.2 and I = 20 mM will be called starting buffer. The calibrated crystals were then subjected to a 5 g/L HSA suspension in the matching buffer solution (10 mM MOPS and 10 mM NaCl) at controlled temperature of 25 °C and a flow rate of 50 µL/min. Conditions of temperature and flow rate are unified for all solution used in this study. Afterwards QCM crystals were rinsed with the starting buffer.
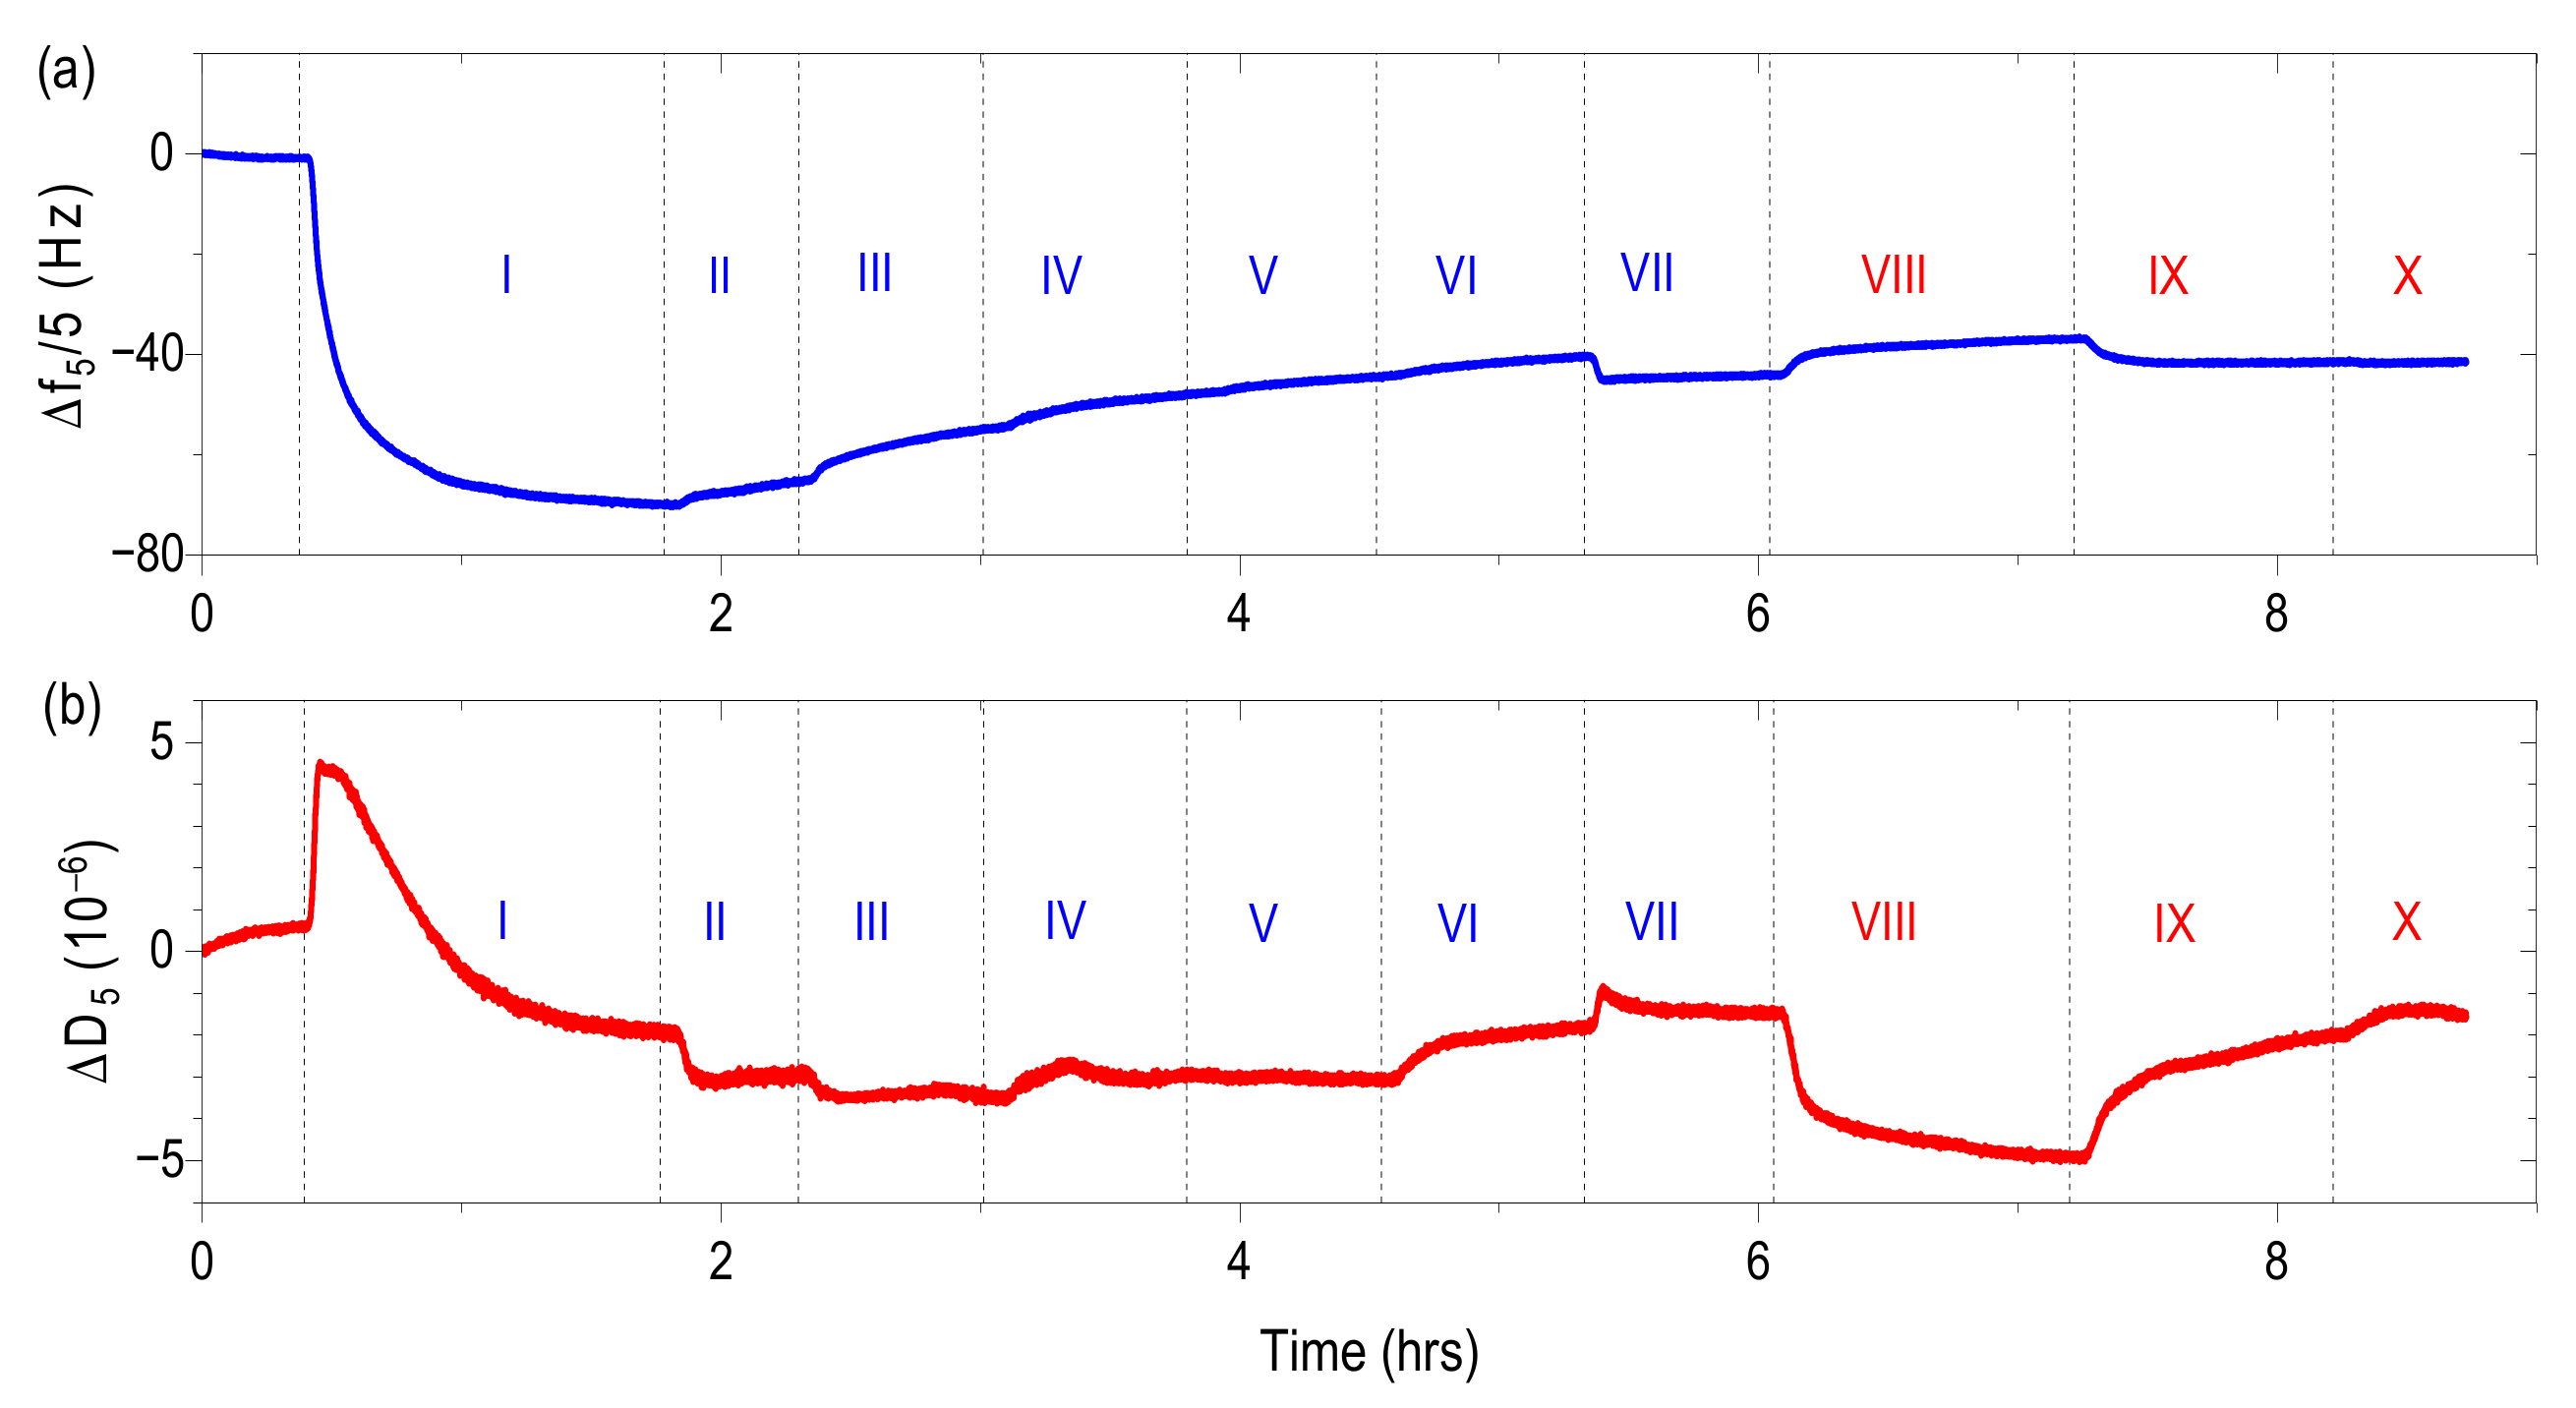
The influence of the salt concentration was studied by a step-wise increase of ionic strength to I = 50, 75, 100 and 120 mM adjusted by NaCl added to the buffer. Afterwards QCM crystals were rinsed with the starting buffer. After the step-wise increase of the ionic strength the QCM crystals were immersed in the buffer solution of the same pH and ionic strength conditions as at the beginning of the experiment.
In the studies regarding the influence of pH the QCM crystals were then rinsed by buffer solution of constant ionic strength (20 mM) but different pH (pH = 6.5 and 7.6, respectively). In the final step the QCM crystals were rinsed with the starting buffer. After pH change, the QCM crystals were immersed in the buffer solution of the same pH and ionic strength conditions (pH 7.2 and I = 20 mM) as at the beginning of the experiment.
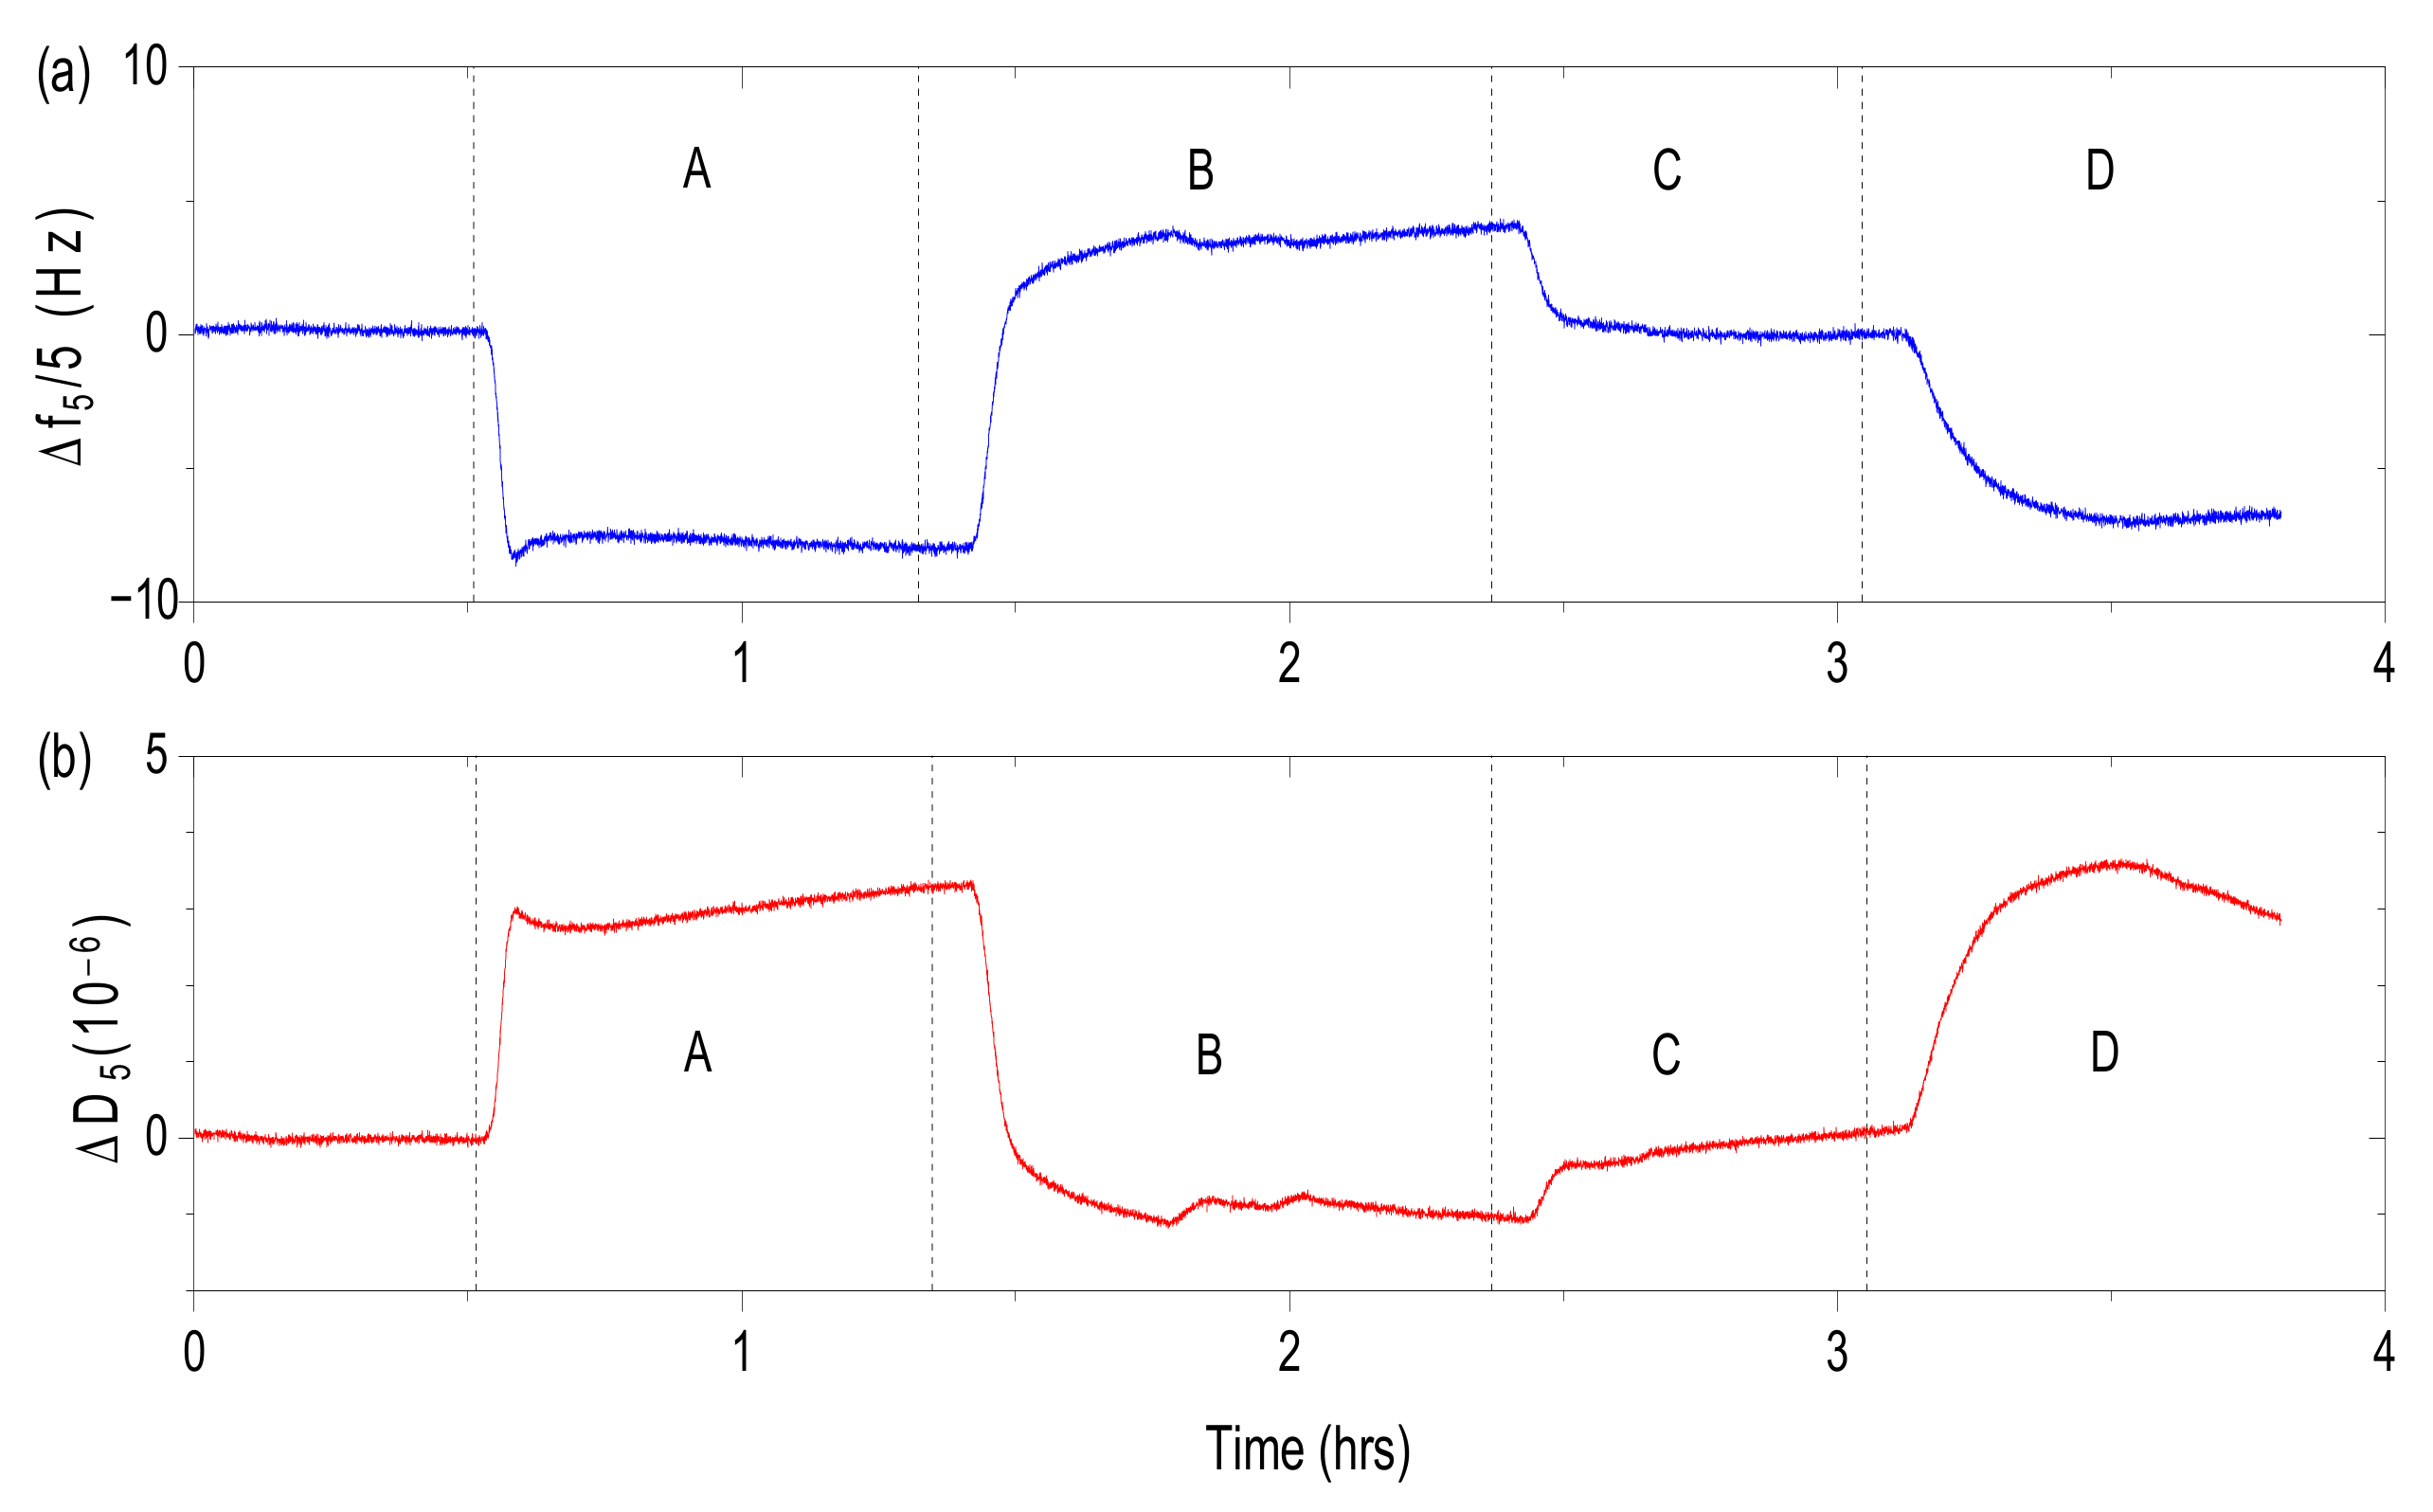
2.7. Response of Protein-Free Brush to pH
The QCM crystals were at first calibrated in buffer solution with ionic strength of 120 mM and pH of 7.2. After calibration, crystals were rinsed with buffer solution of I = 20 mM and pH of 7.2. In the following steps QCM crystals were rinsed with buffer solutions with pH of 6.5 and 7.6 at constant ionic strength (I = 20 mM). In the final step crystals were rinsed with buffer solution of I = 20 mM and pH 7.2.
2.8. Data Analysis
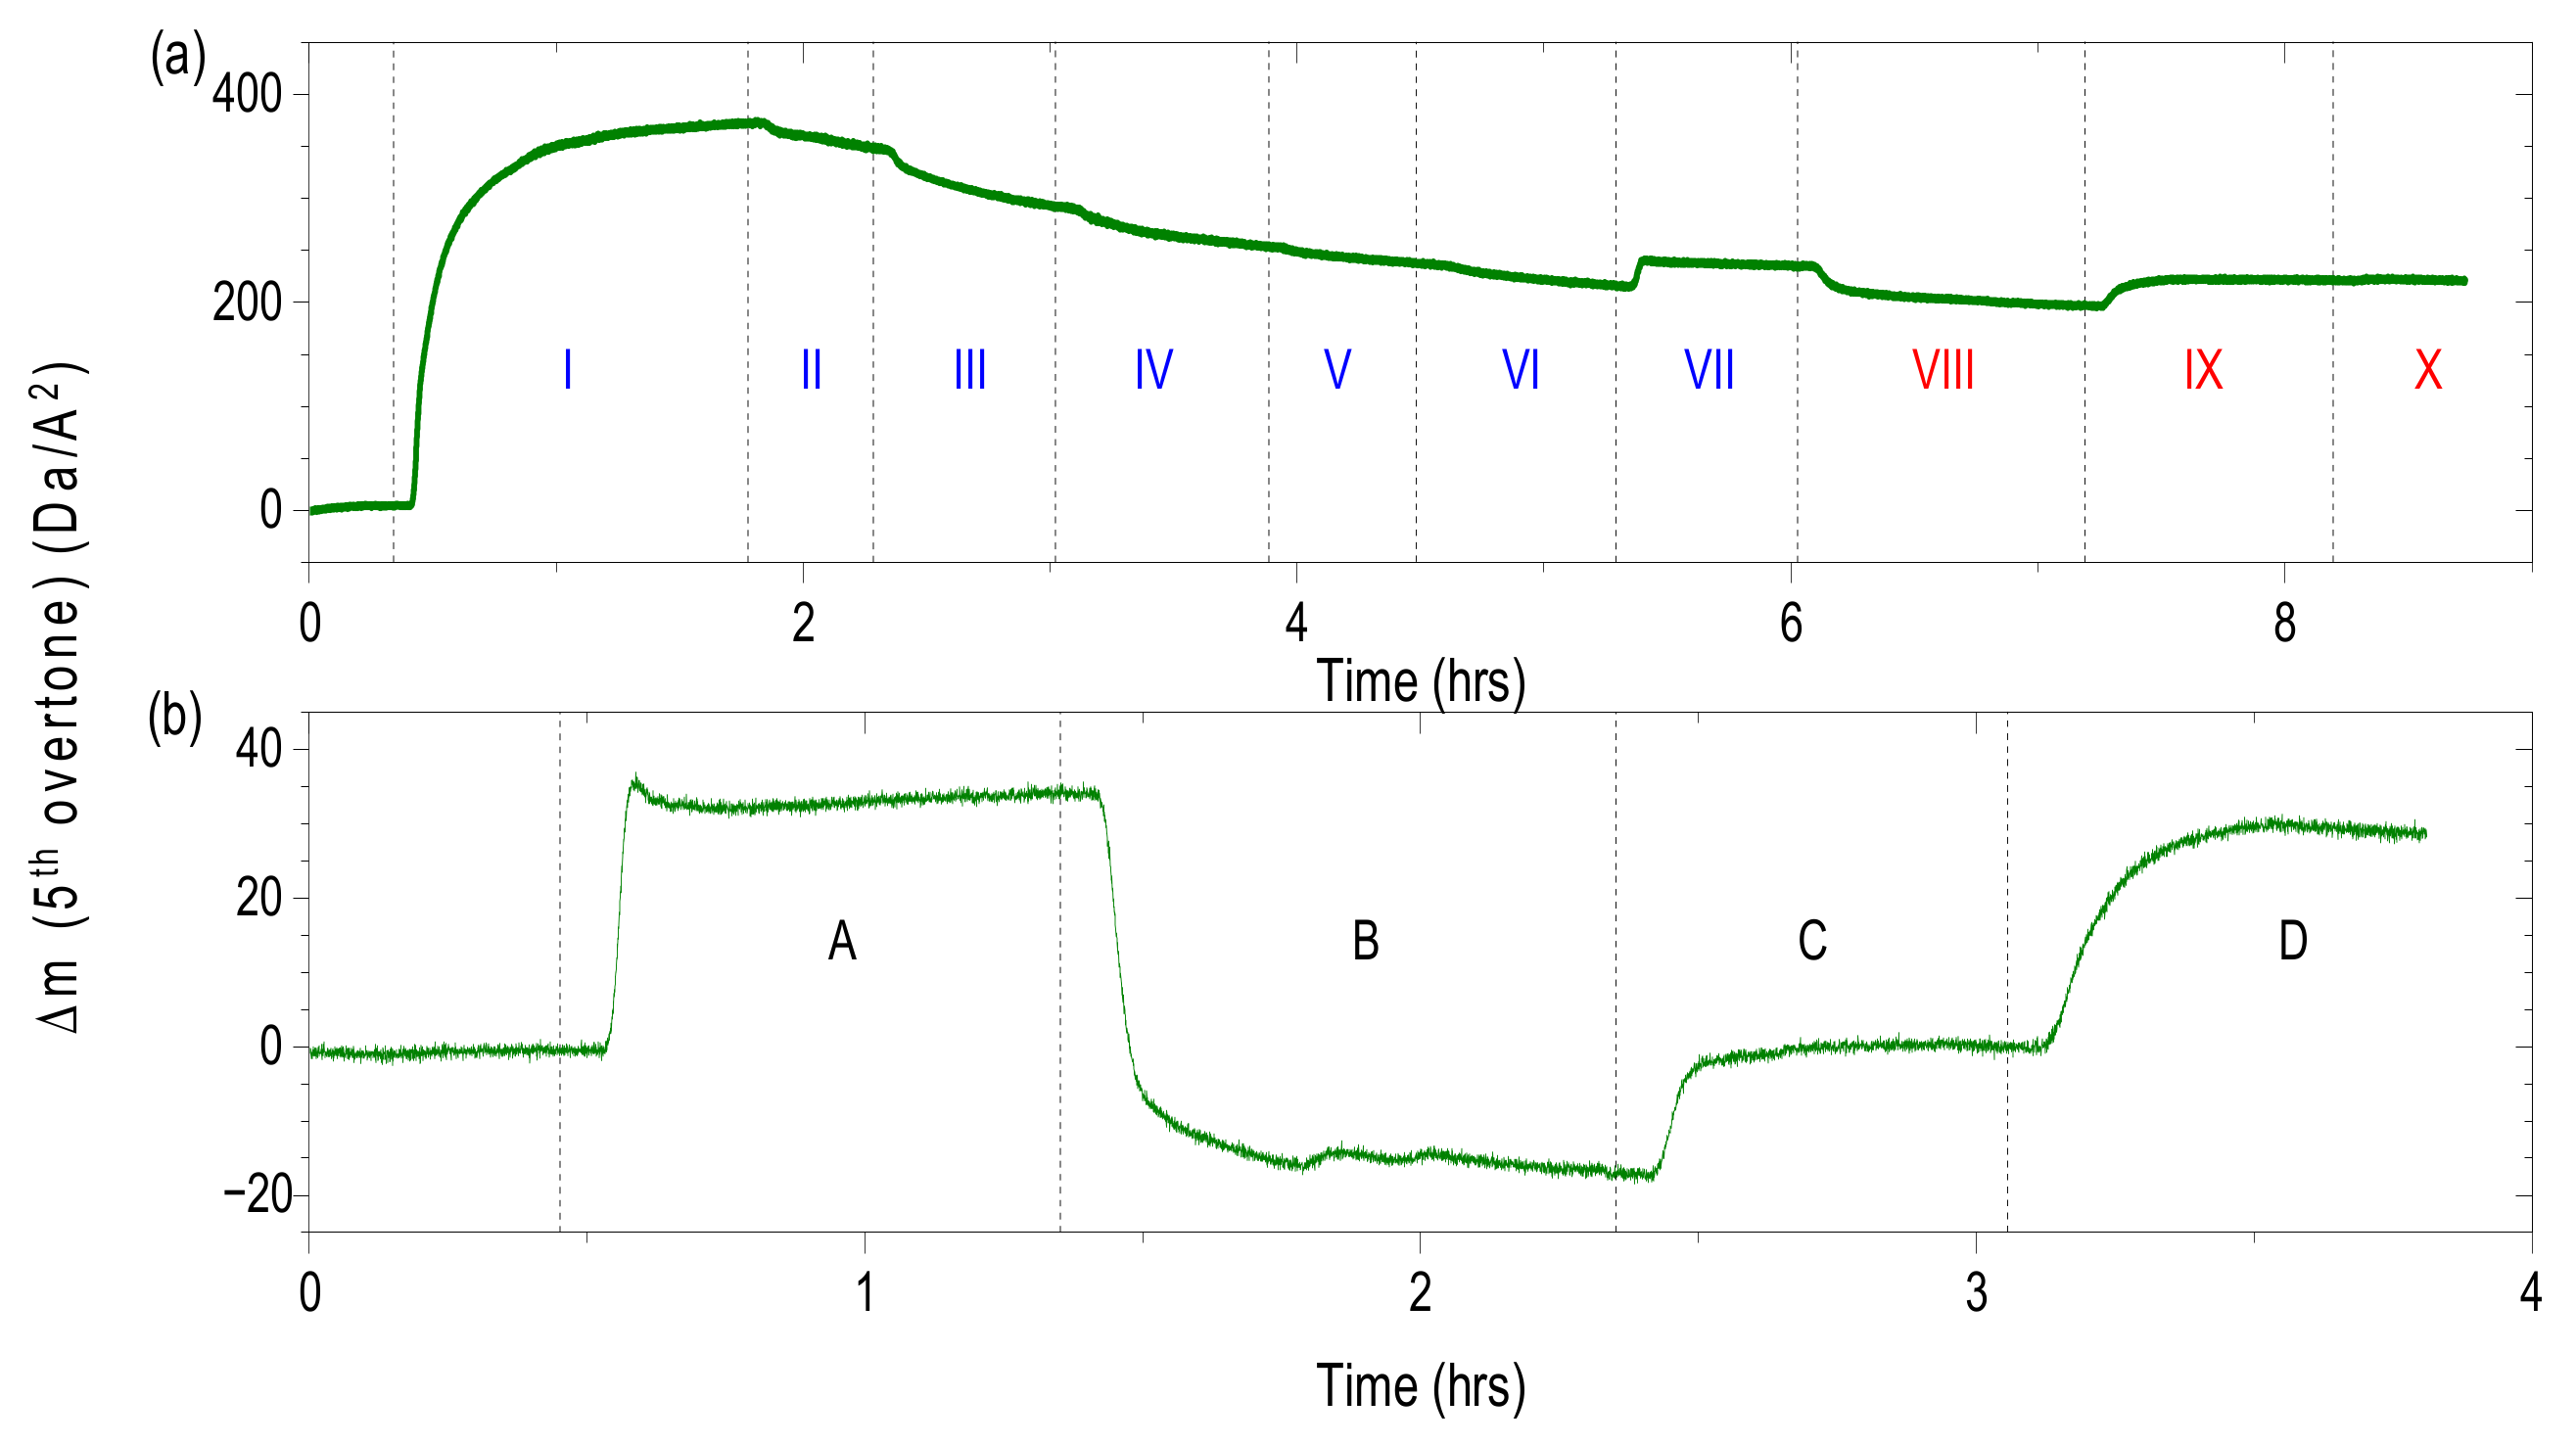
f versus time and
D versus time plots were generated using the fifth overtone. Similarly, the fifth overtone was used for the mass estimation (see
Section 3.5). The data analysis was performed using Q-Tools software from Q-Sense. In order to determine the mass change, ∆
m, upon brush response to changing ionic strength and pH conditions we used a linear relationship between gain/lost mass and the change in resonant frequency according to the Sauerbrey [
54] equation:
where ∆
m is the mass area change (in ng∙cm
−2),
CQCM the mass sensitivity (17.7 ng∙cm
−2 Hz
−1 at oscillation frequency of 5 MHz, or overtone
n = 1) and the
n is the overtone number (1, 3, 5, …). There are two situations in which the Sauerbrey relation might not be fully appropriate [
55,
56,
57,
58]. Firstly, the presence of water coupled to the attached layer can result in an overestimation of mass [
59]. Secondly, the viscoelastic adlayer gives rise to a compound resonator for which
∆f is not directly proportional to ∆
m [
59]. The Sauerbrey equation implies that if the changes of the normalized frequency ∆
fn/
n do not exhibit a significant dependence on the harmonic number, a given layer is a rigid one. The experimental results of ∆
fn/
n show only a small dependence on the overtone number (see
Supplementary Materials) which suggests that the Sauerbrey relation properly describes the behavior of our adlayers. Moreover a maximum dissipation changes compared with frequency shifts (see
Supplementary Materials) validates the Sauerbrey relation for this case [
35].


