Characterization and Biodegradability of Rice Husk-Filled Polymer Composites


Abstract
:
1. Introduction
2. Materials and Methods
2.1. Materials
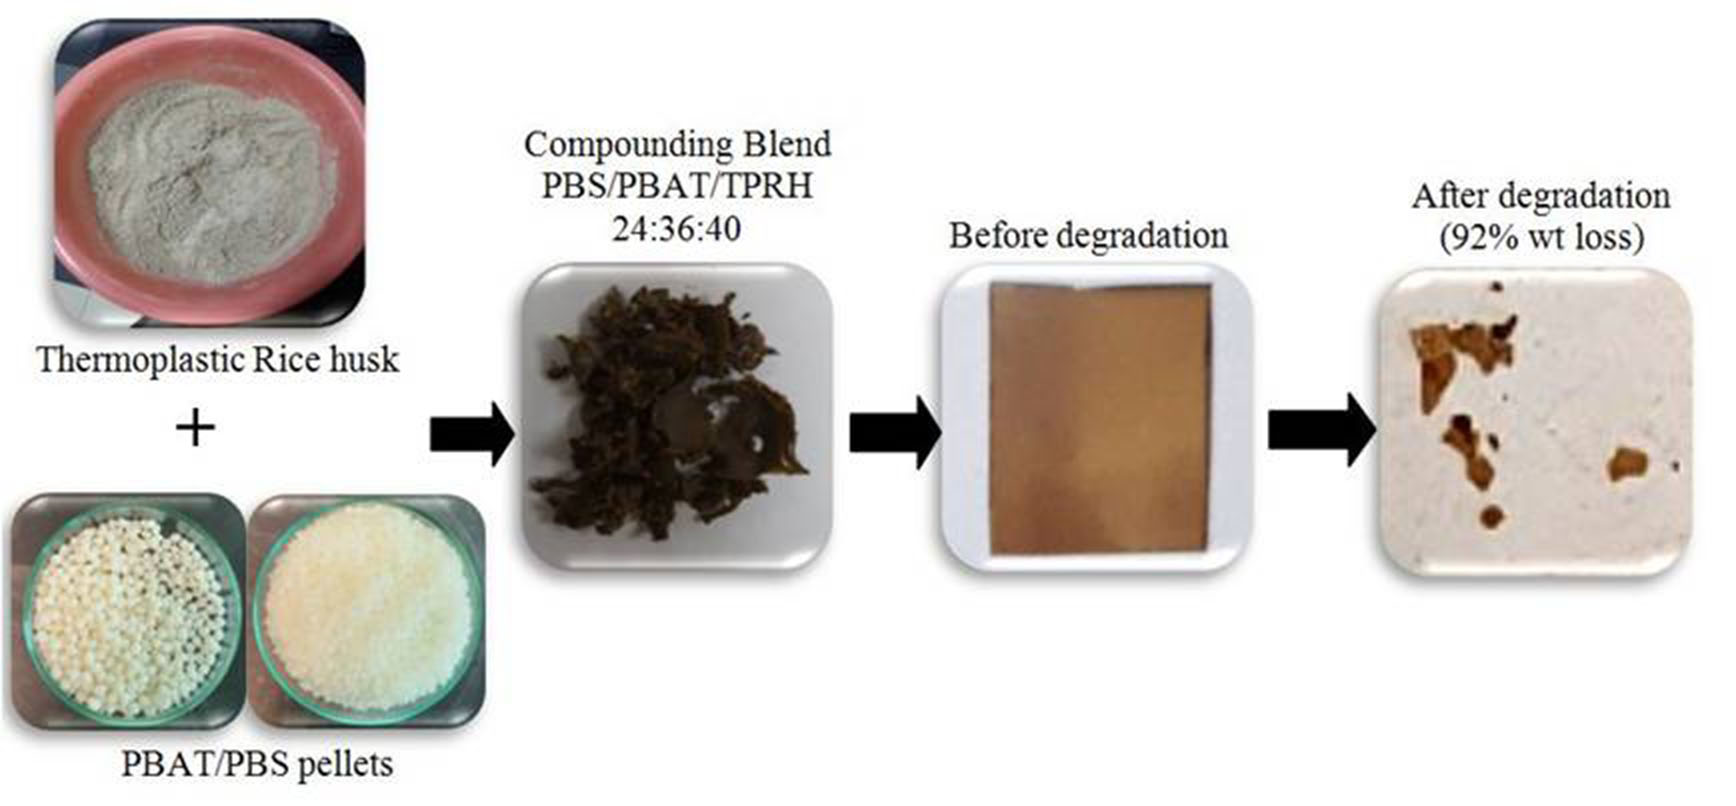
2.2. Polymer Composite Preparation
2.3. Material Characterization
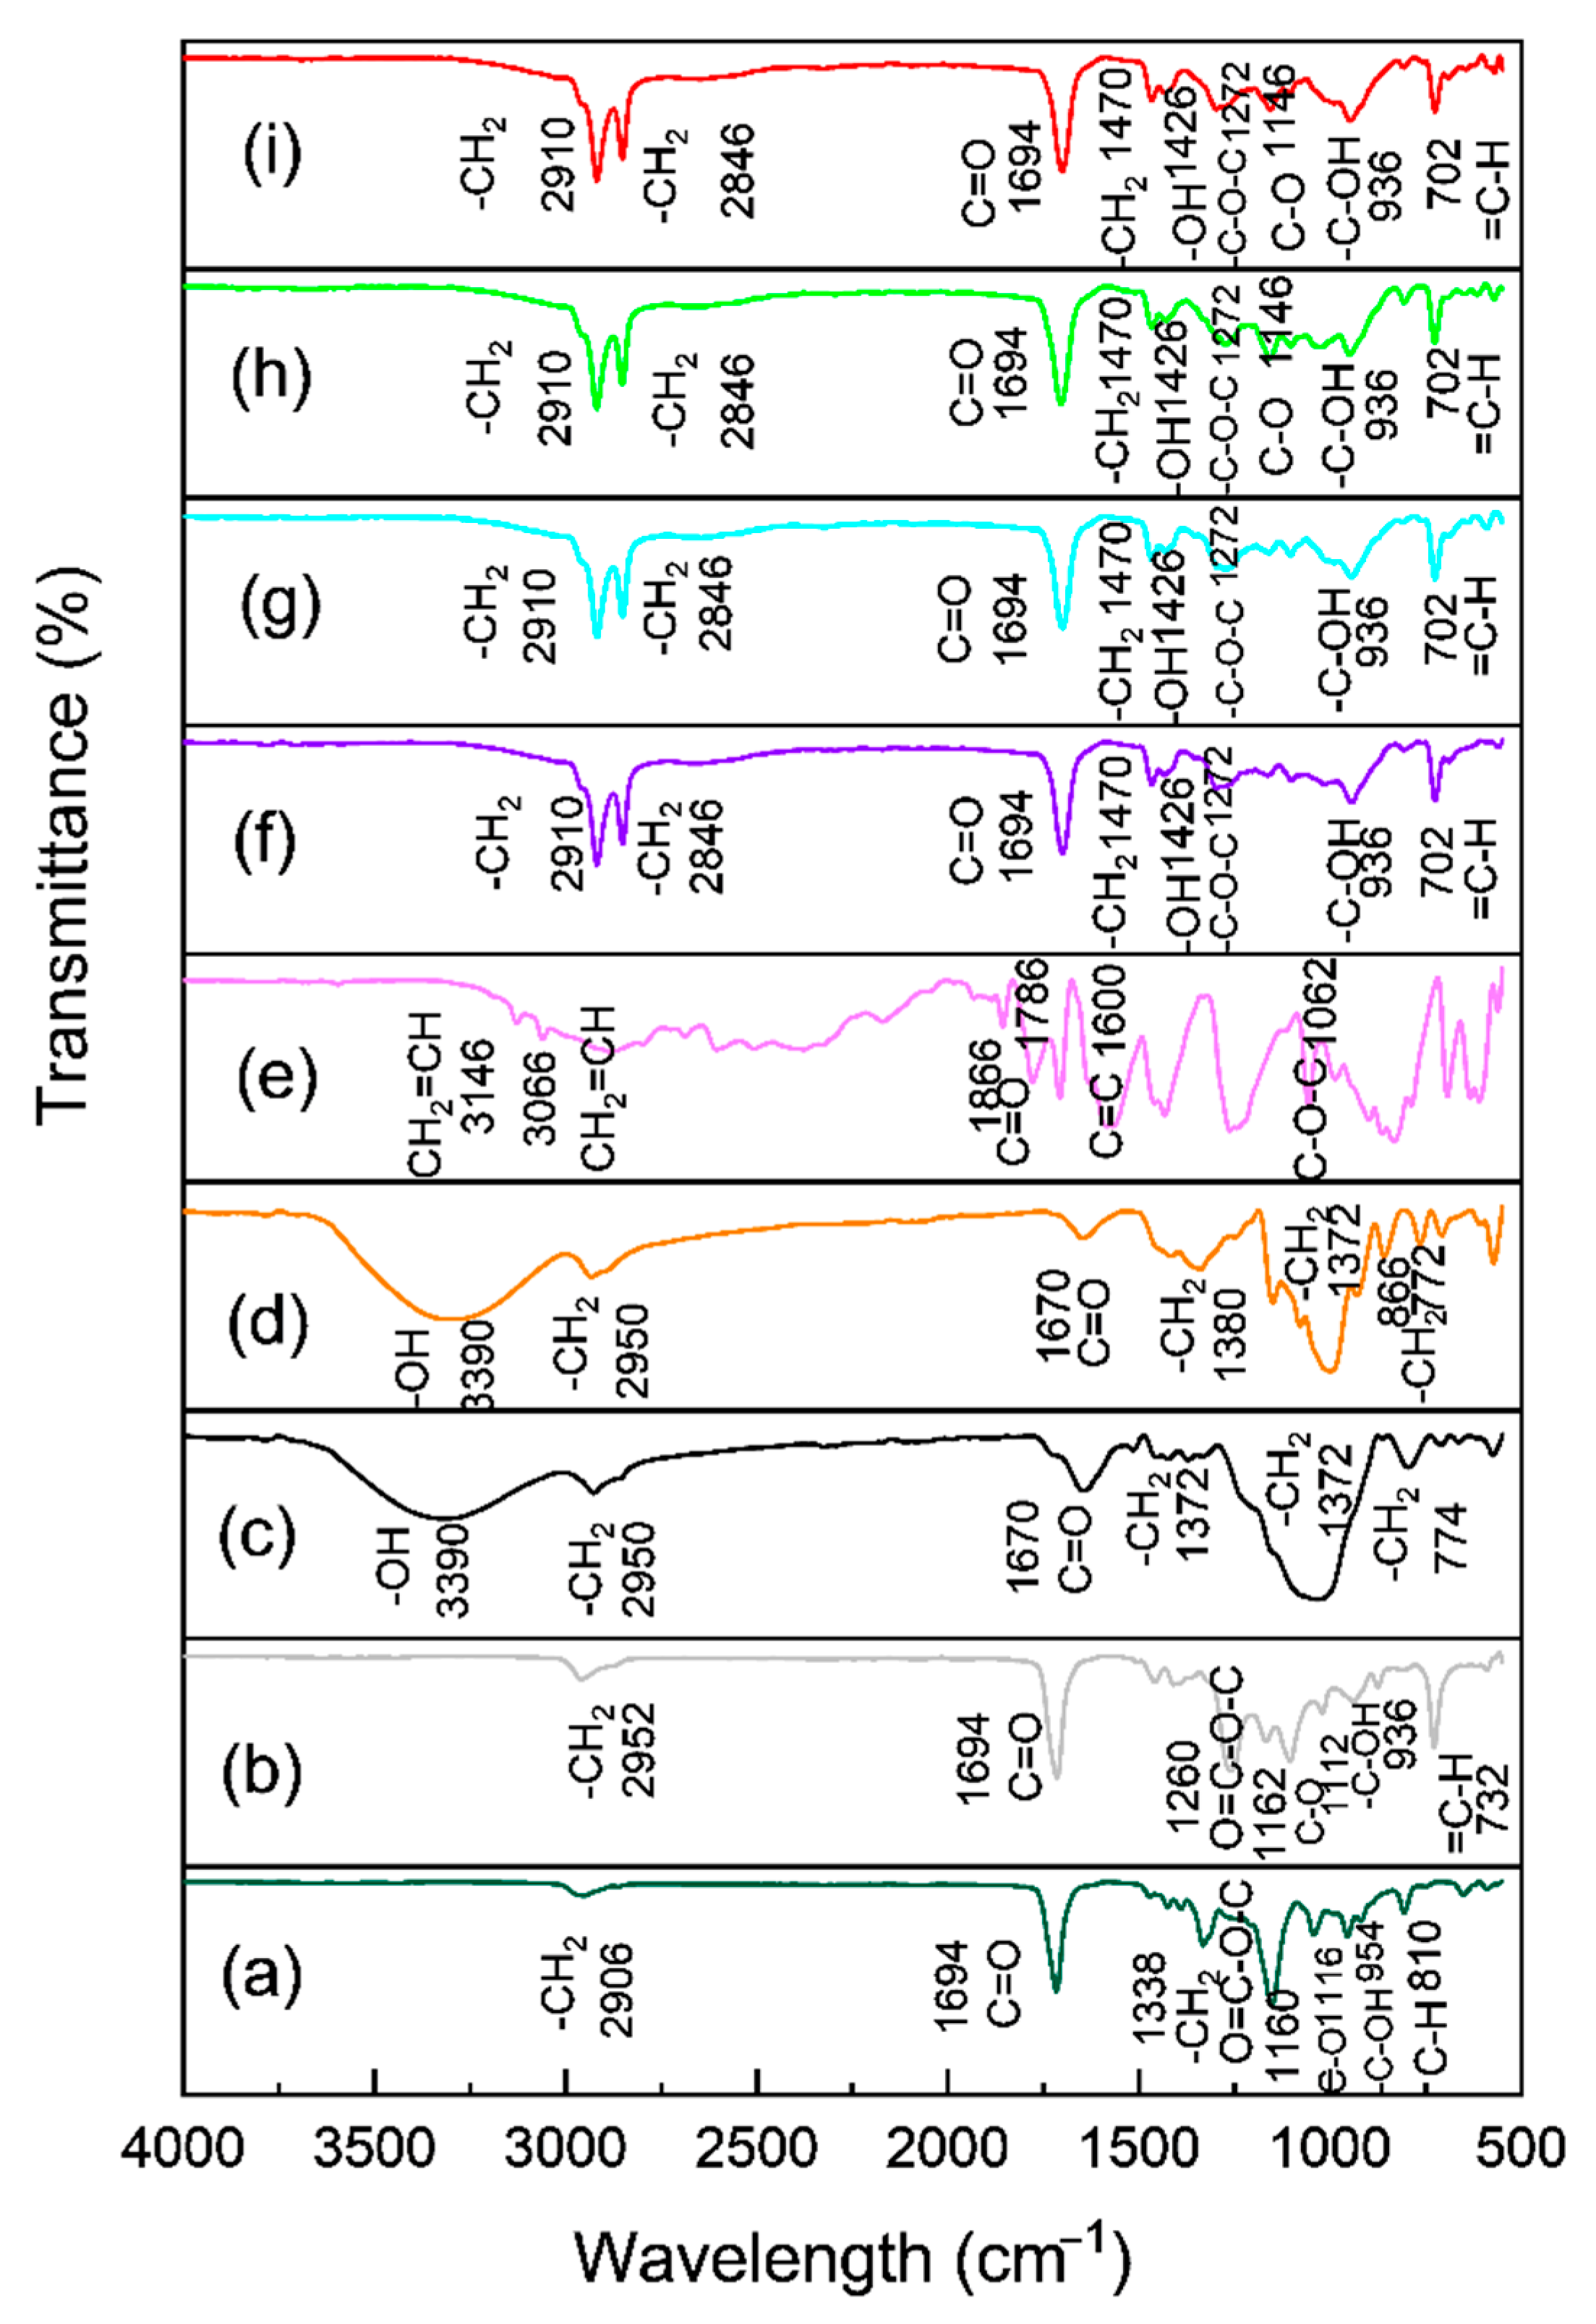
2.3.1. Fourier Transforms Infrared Spectroscopy (FT-IR)
2.3.2. Mechanical Properties
2.3.3. Thermal Behavior
2.3.4. Morphology Analysis
2.3.5. Water Absorption Test
2.3.6. Soil Burial Test
3. Results
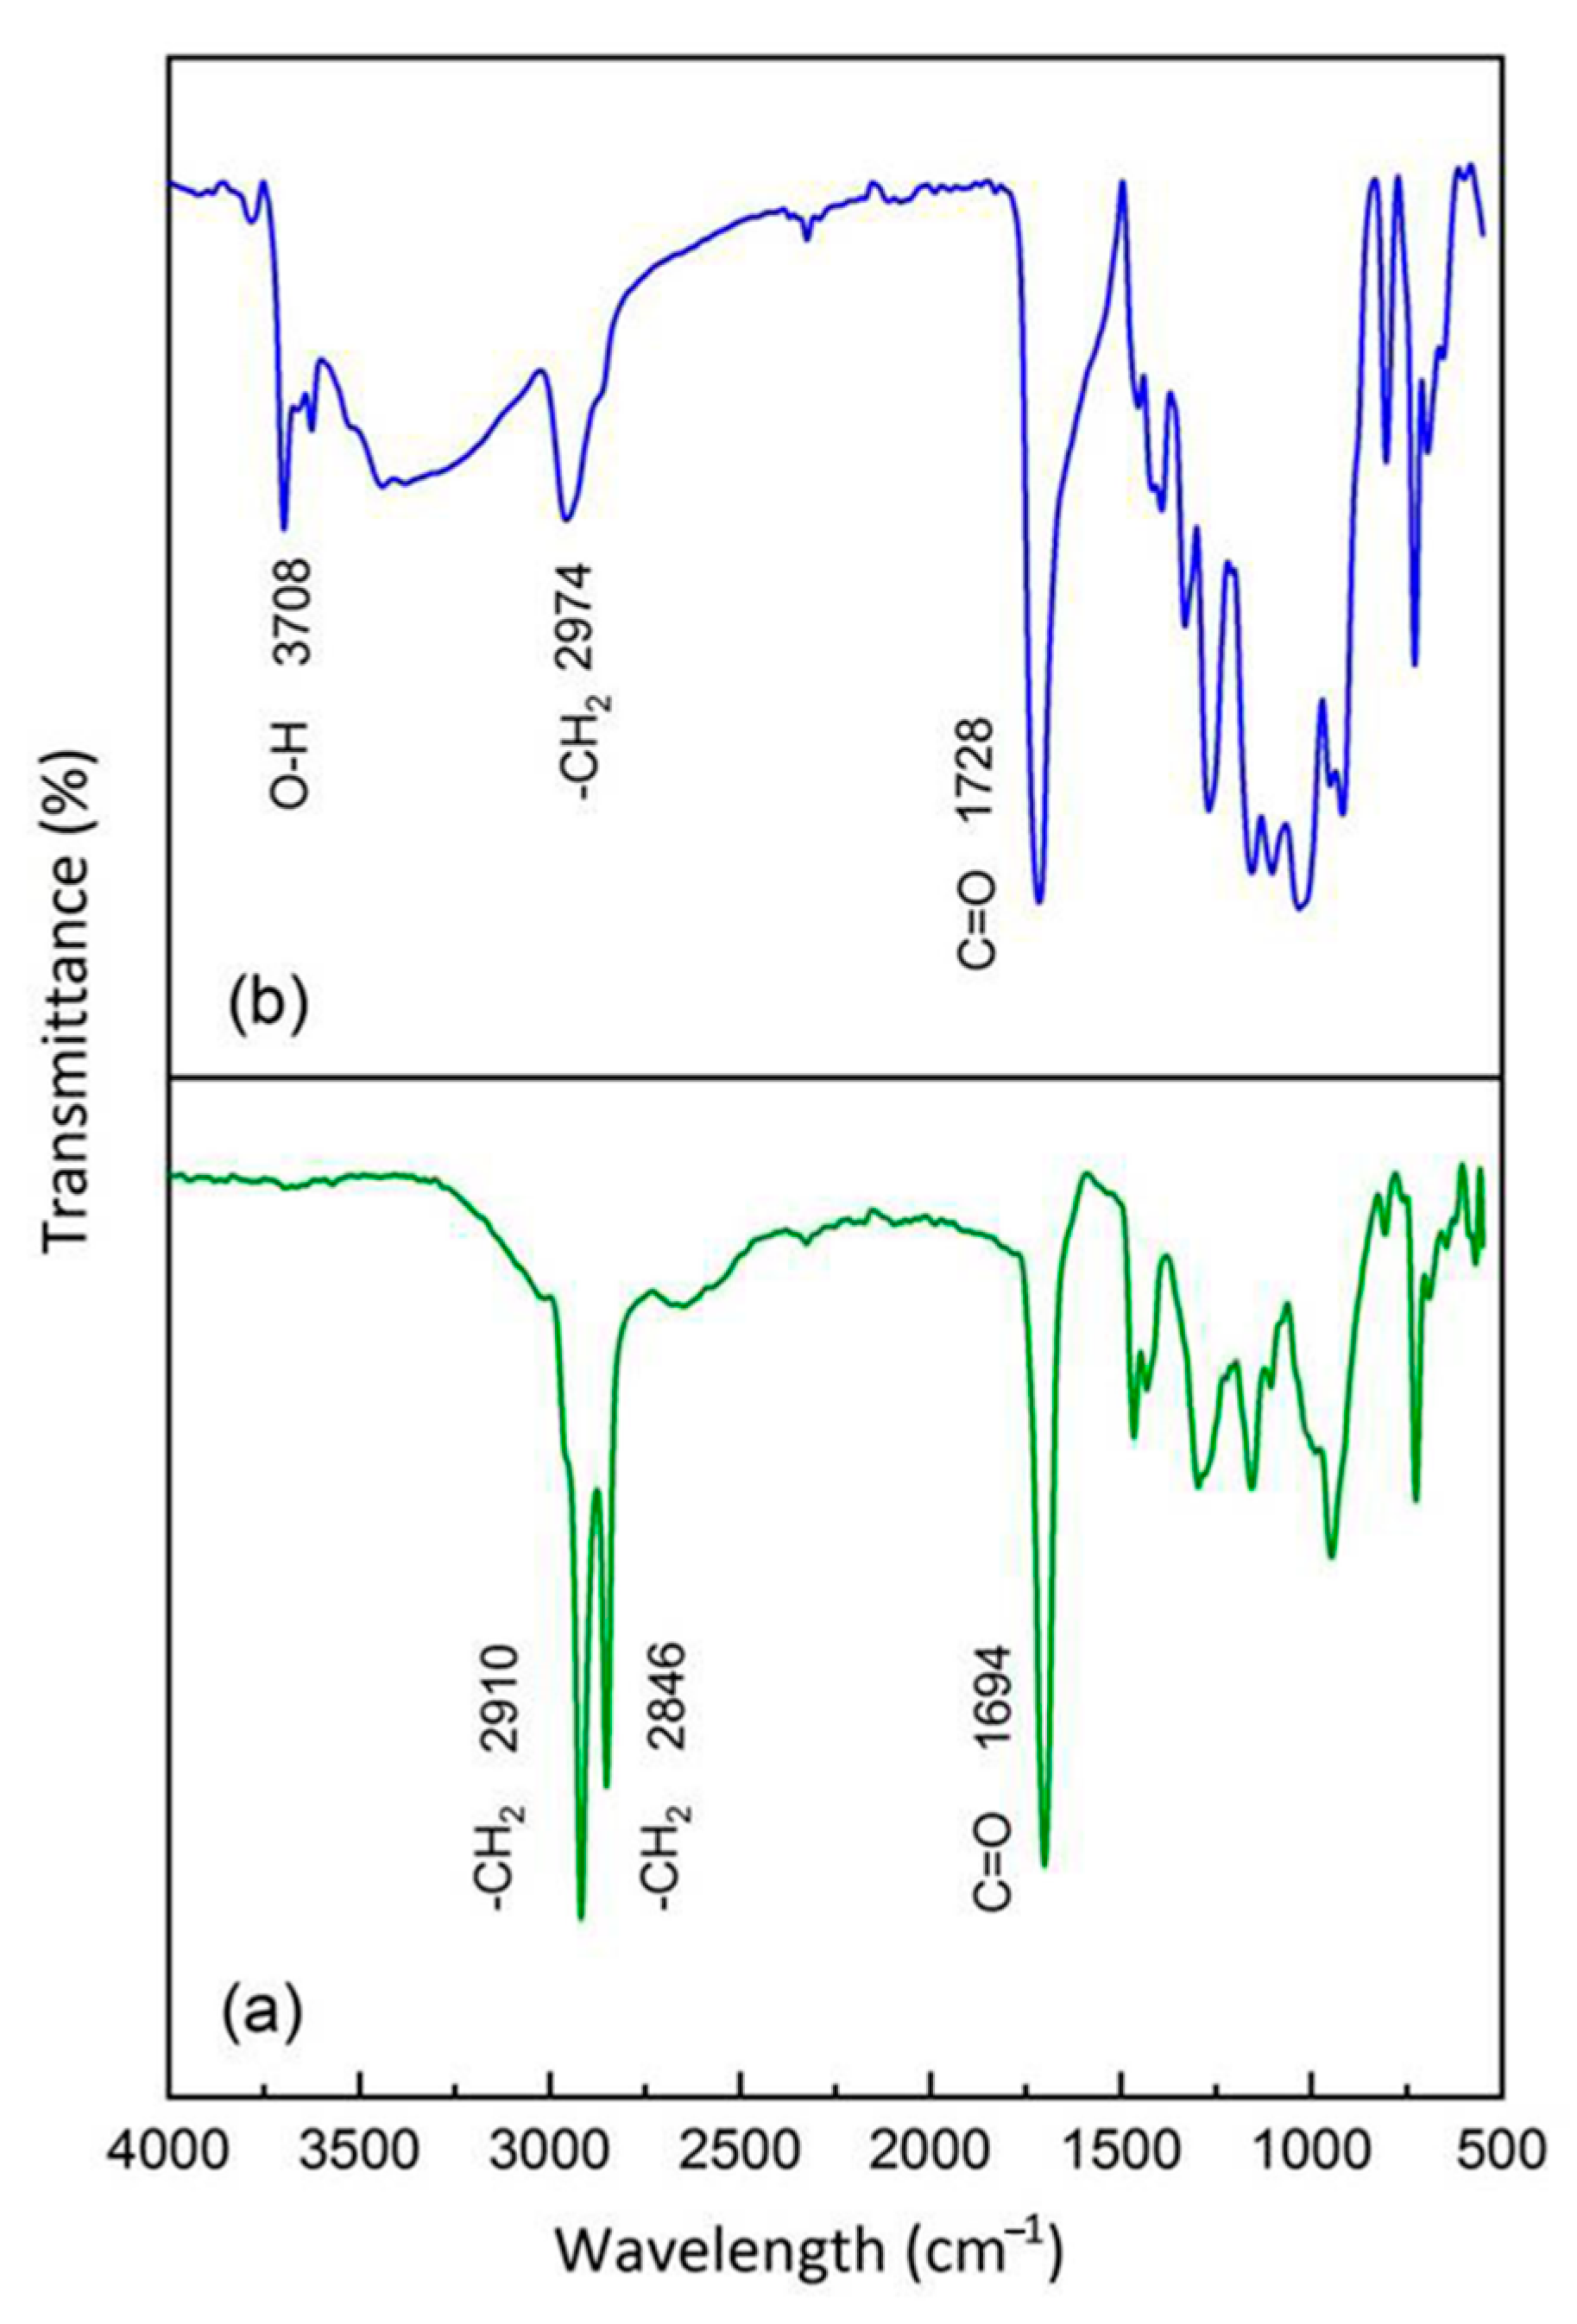
3.1. FT-IR Analysis
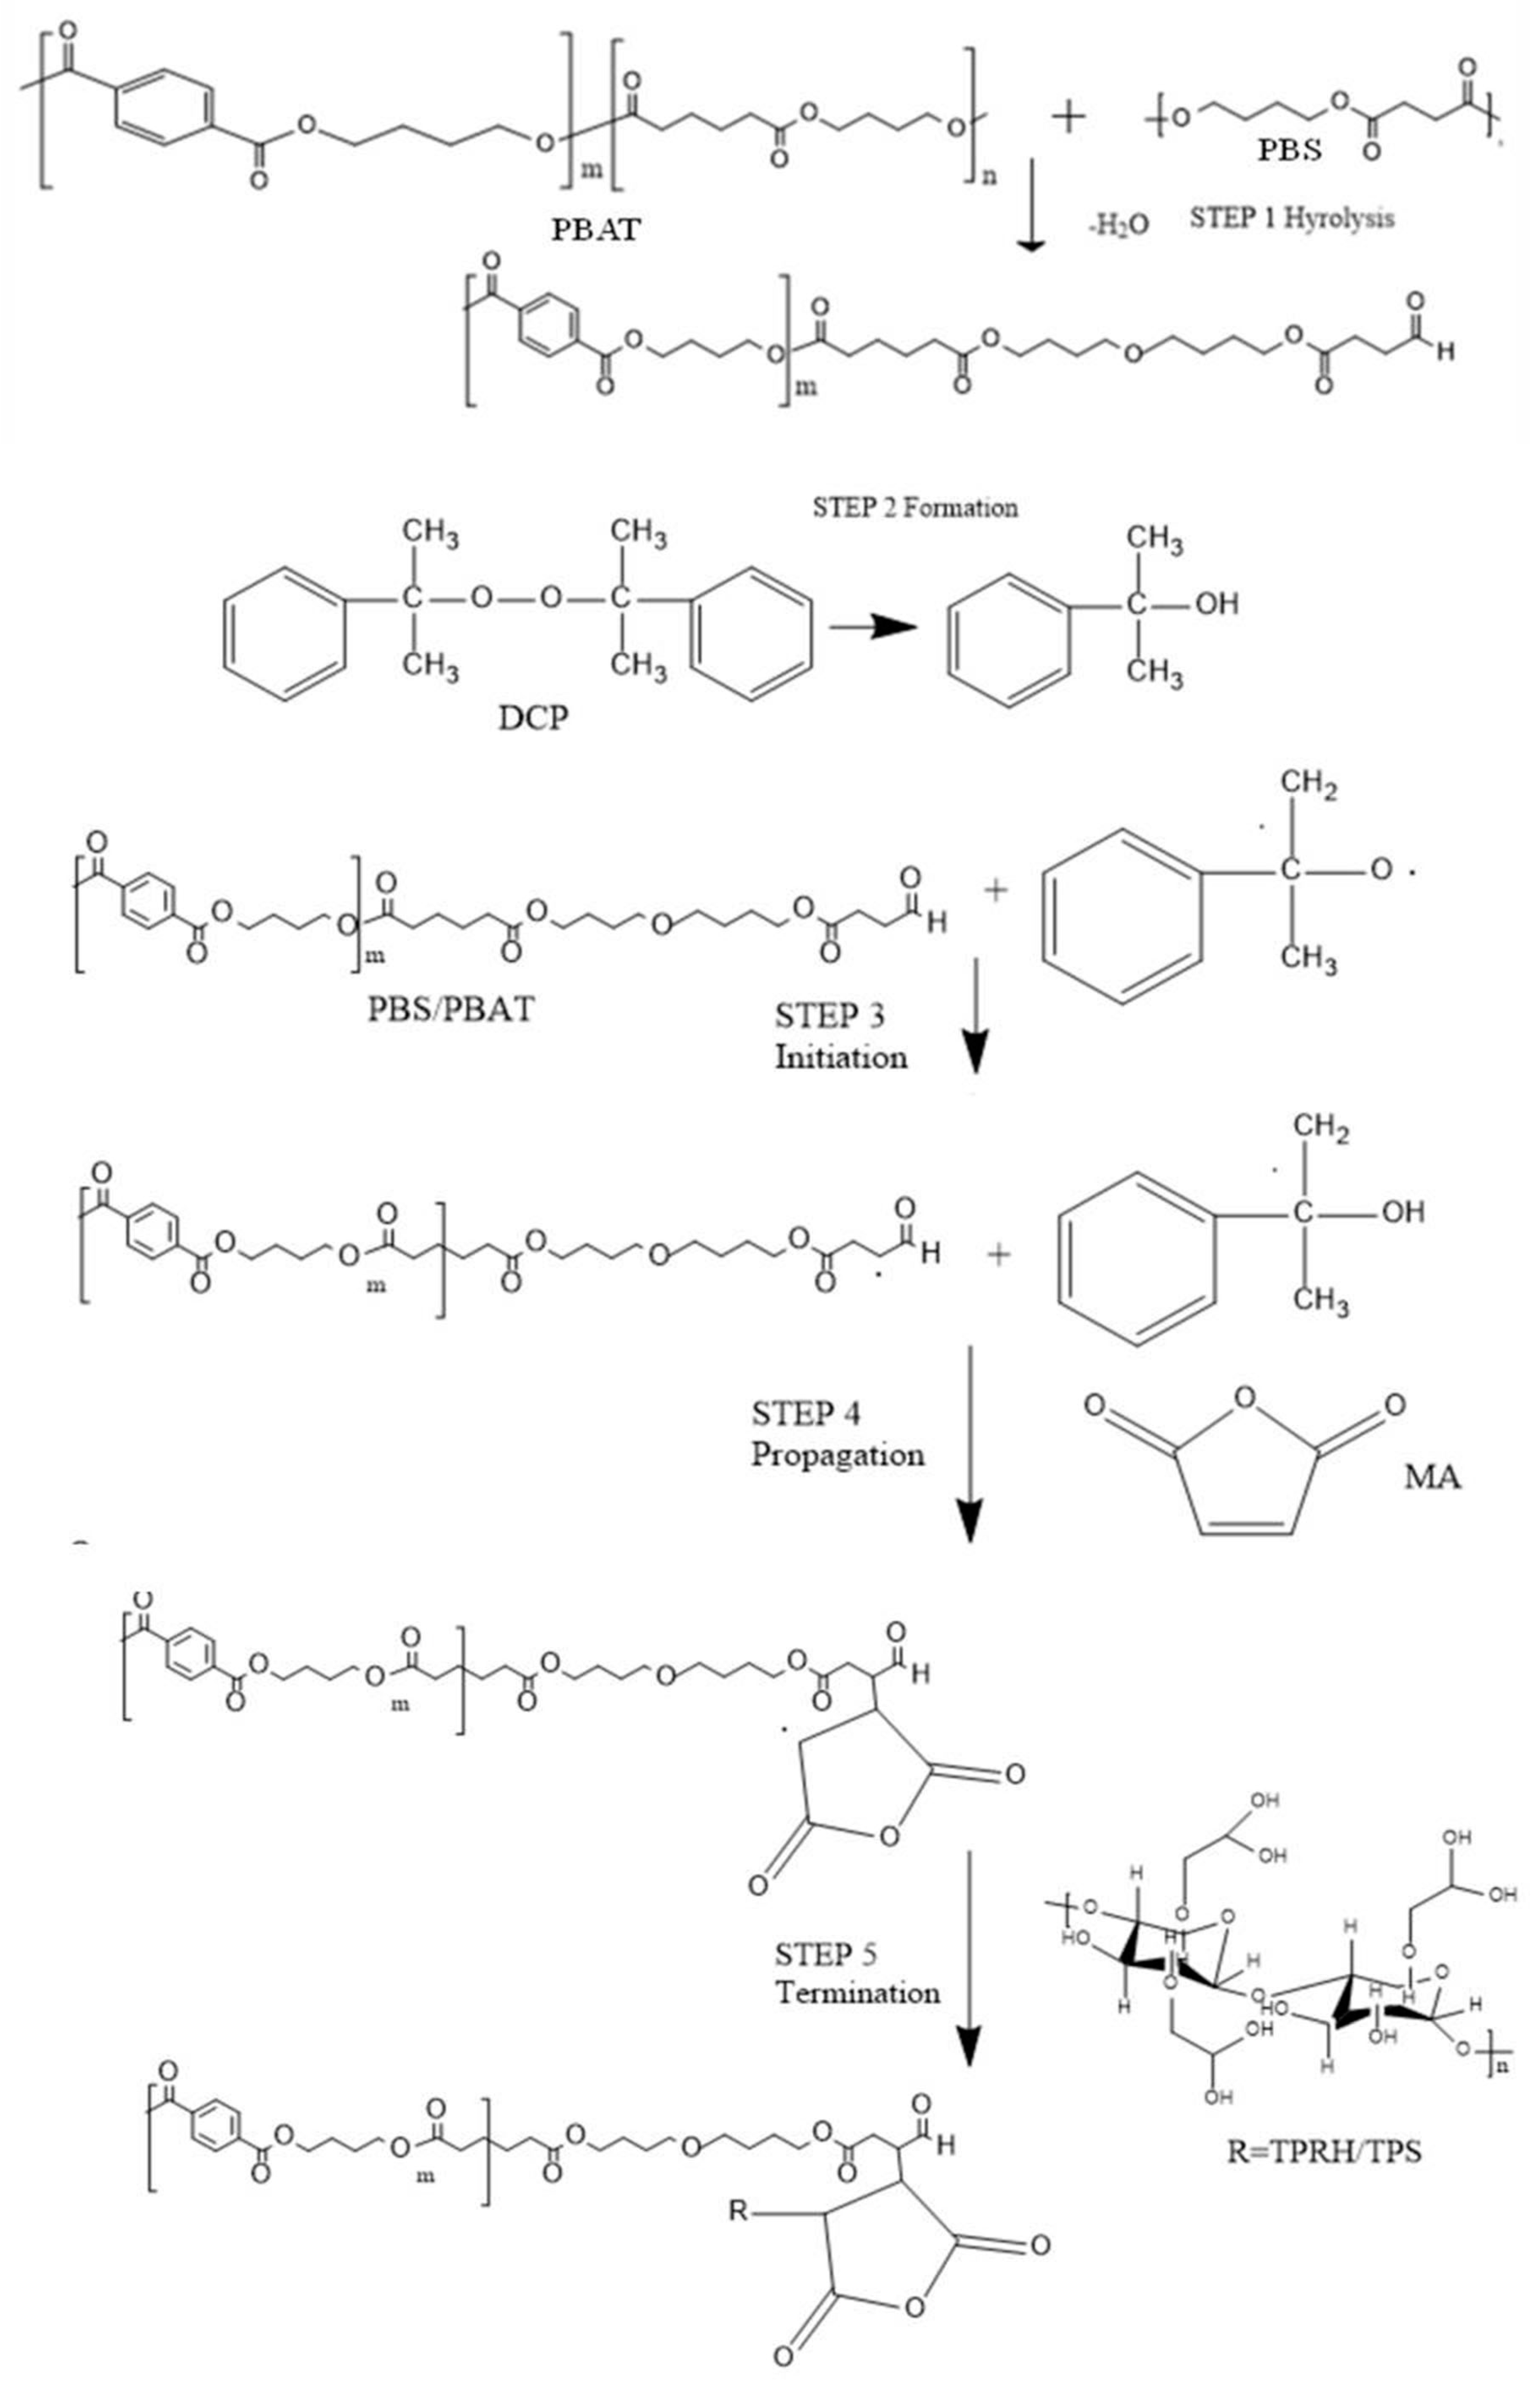
3.2. Mechanism between MA, DCP, PBS, PBAT, and TPRH/TPS
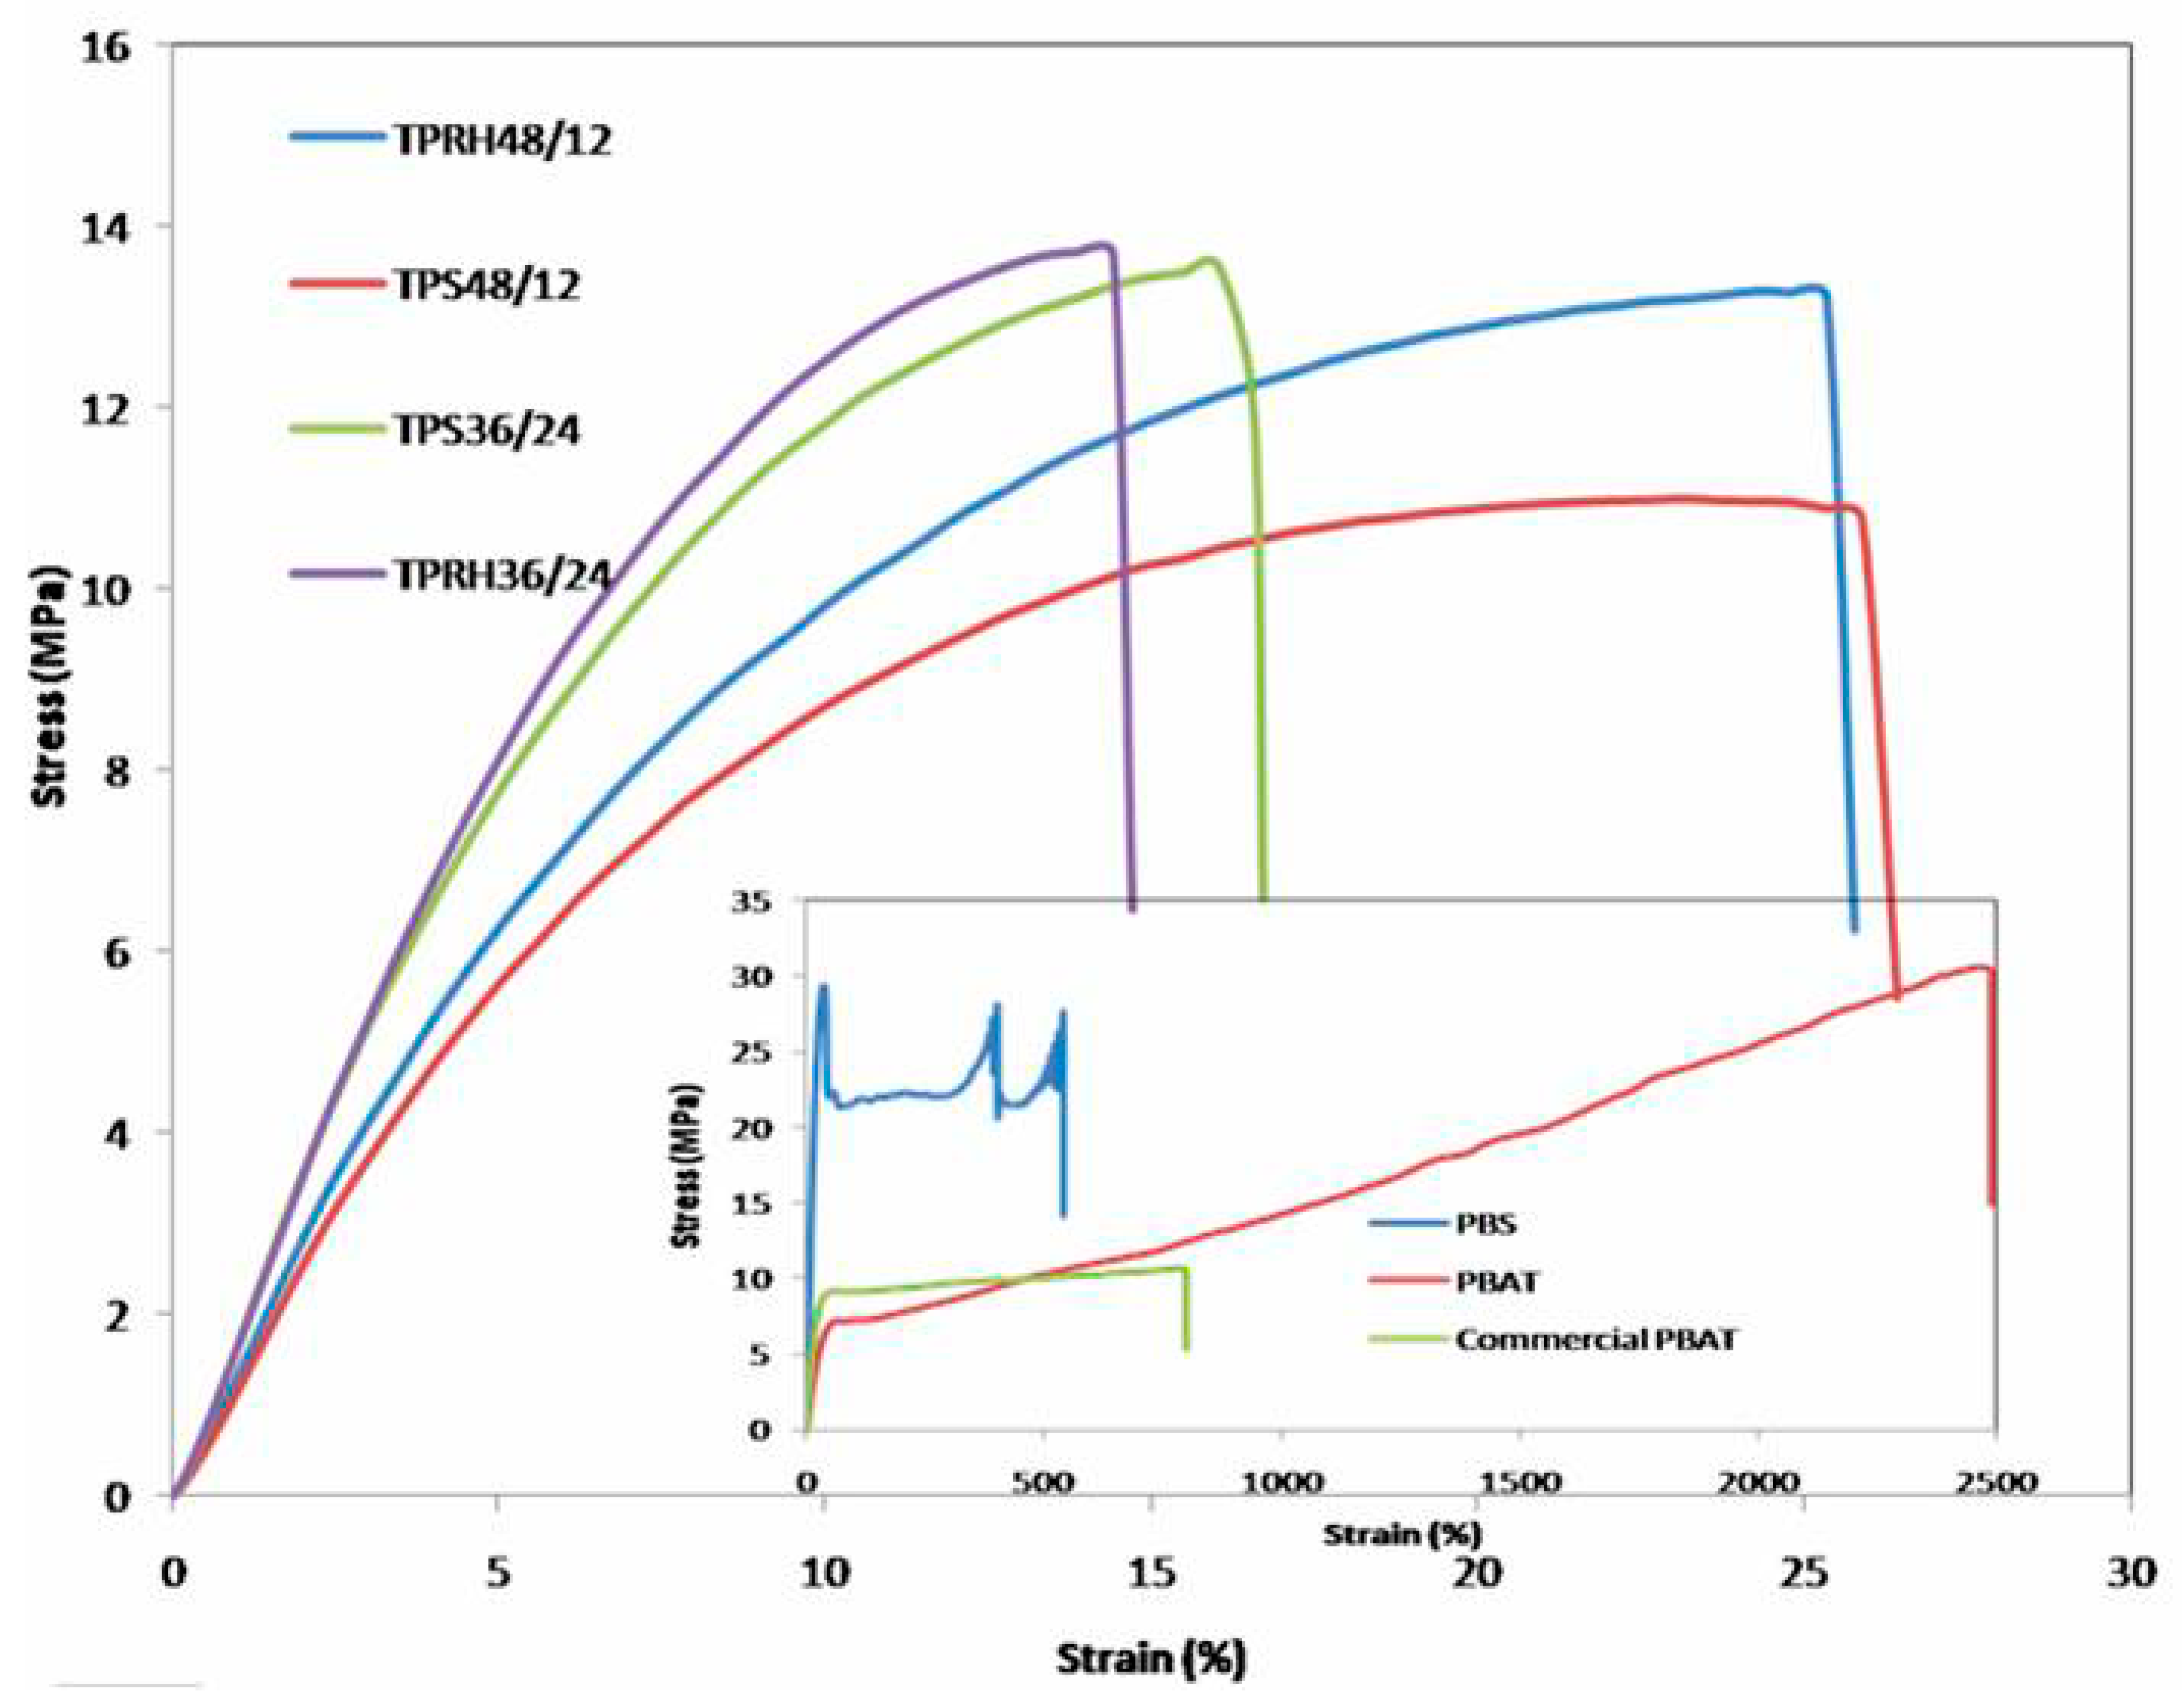
3.3. Mechanical Properties
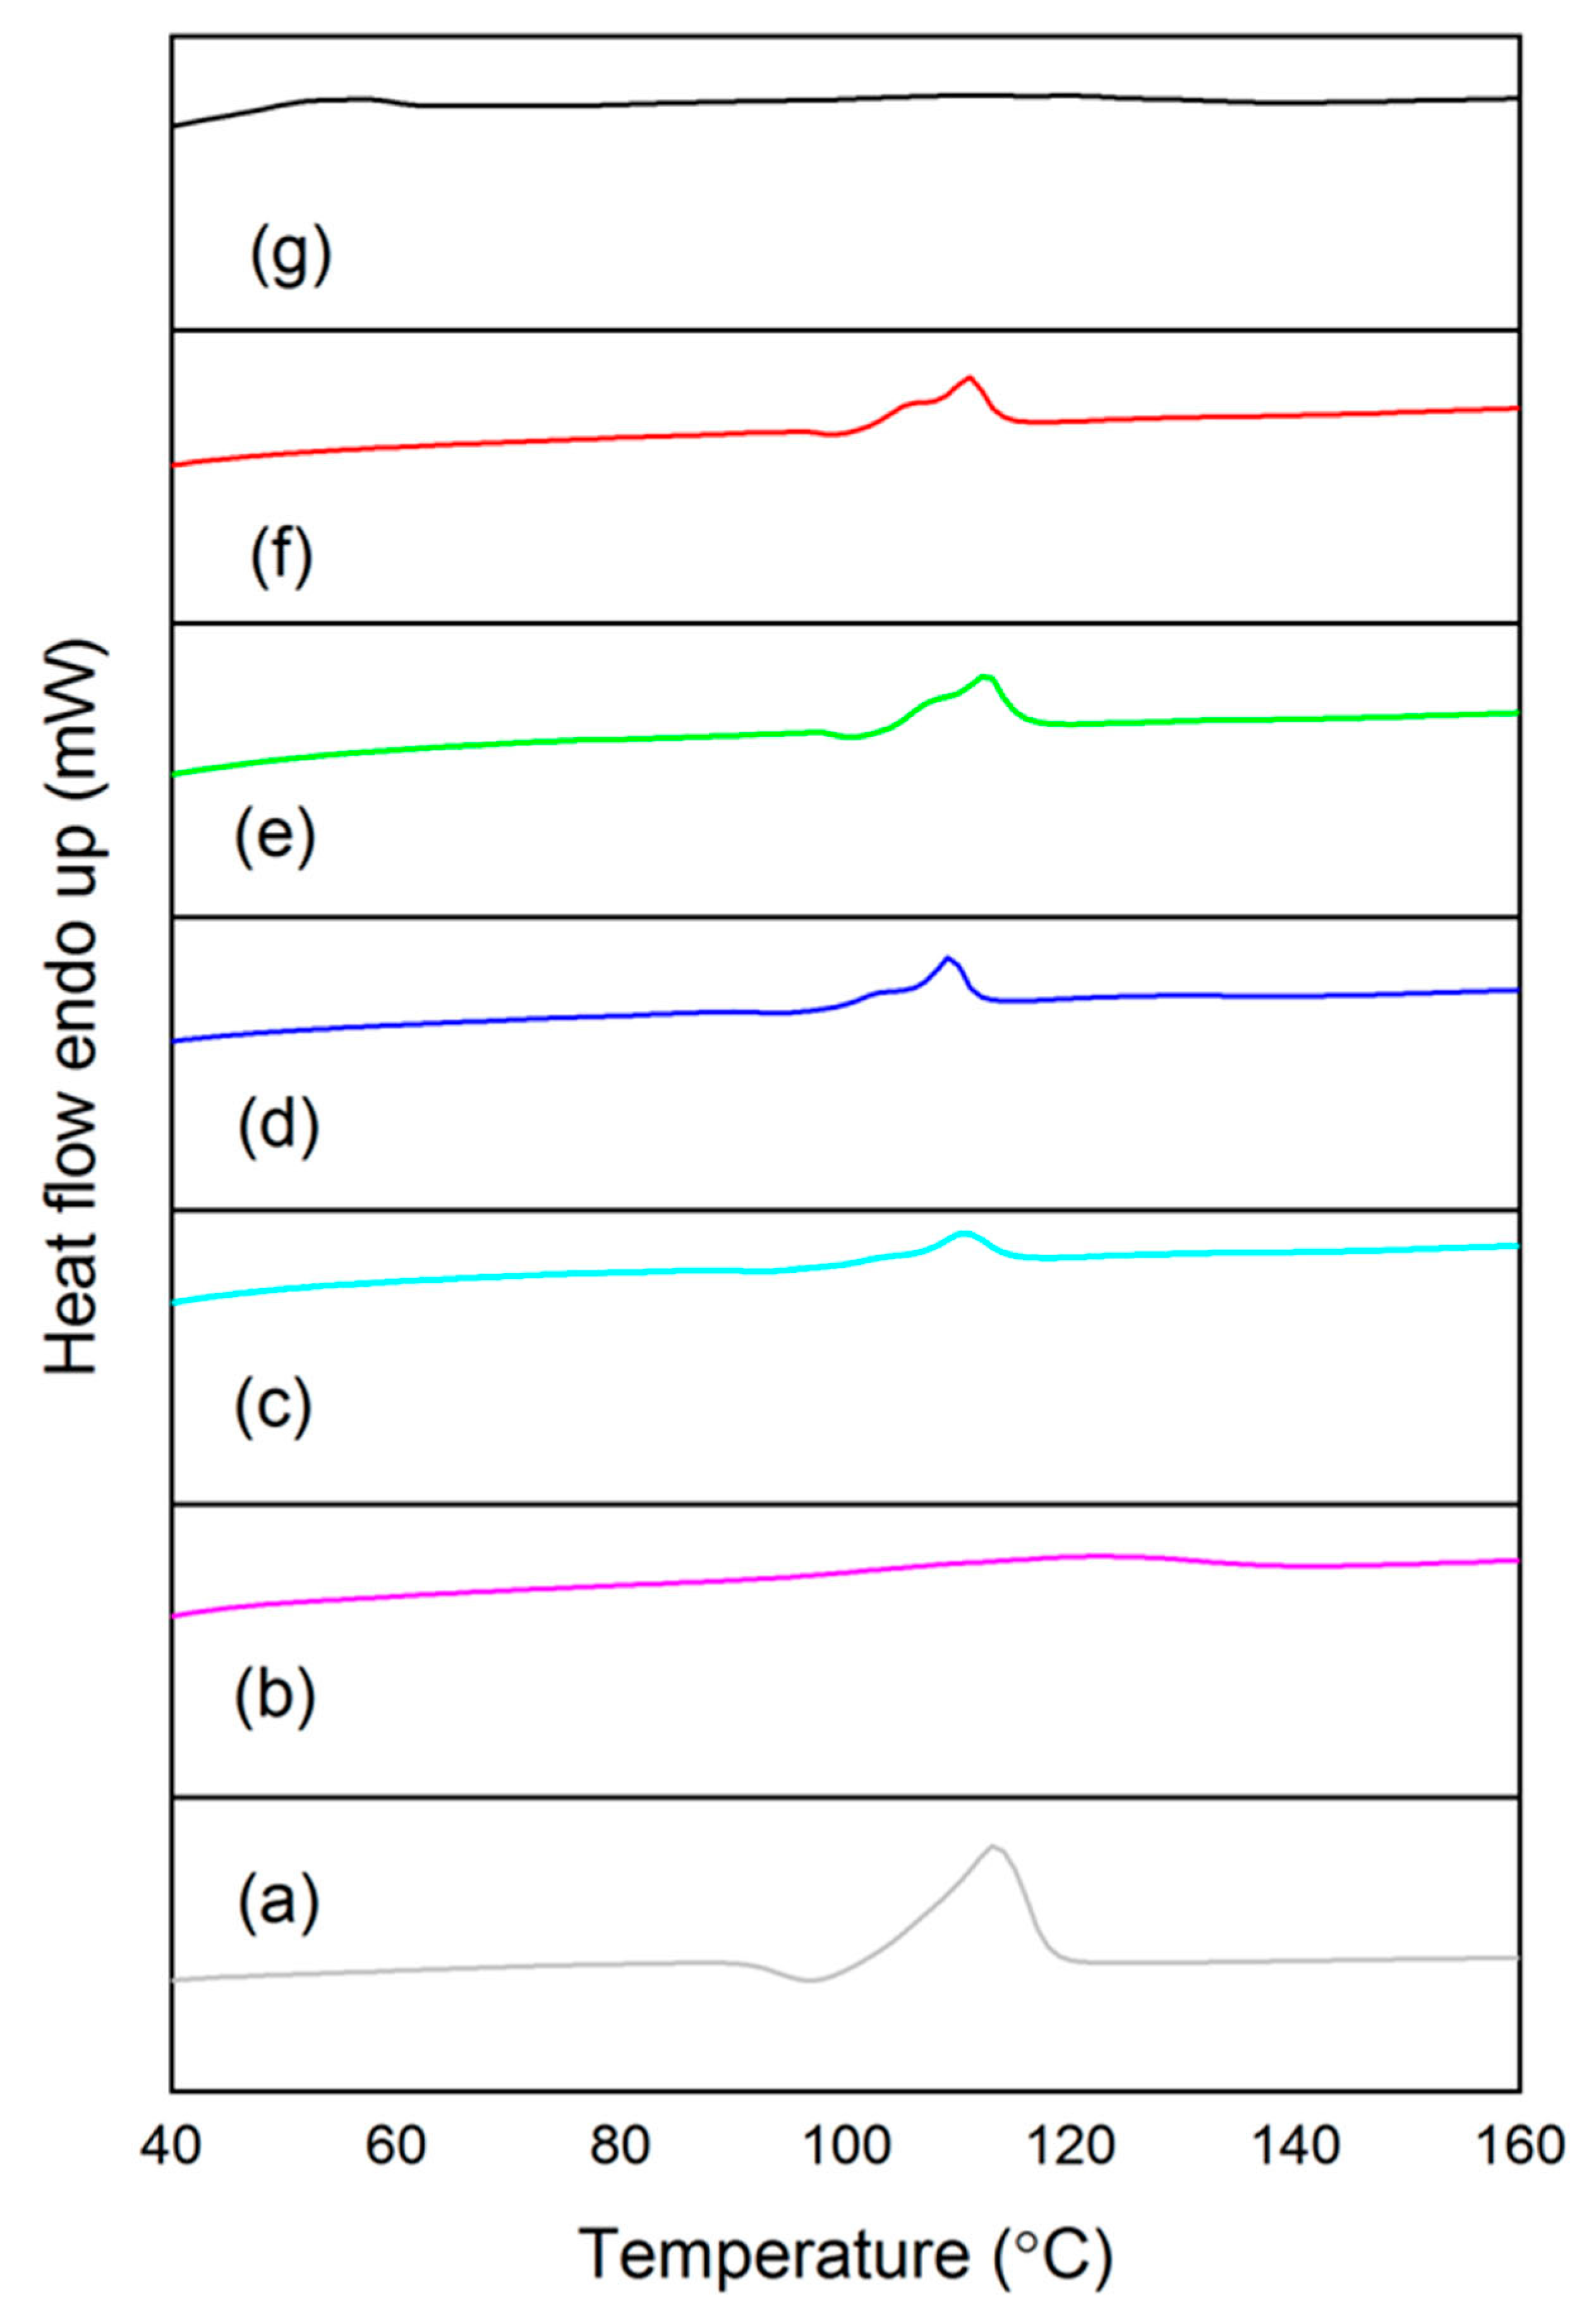
3.4. Thermal Behavior
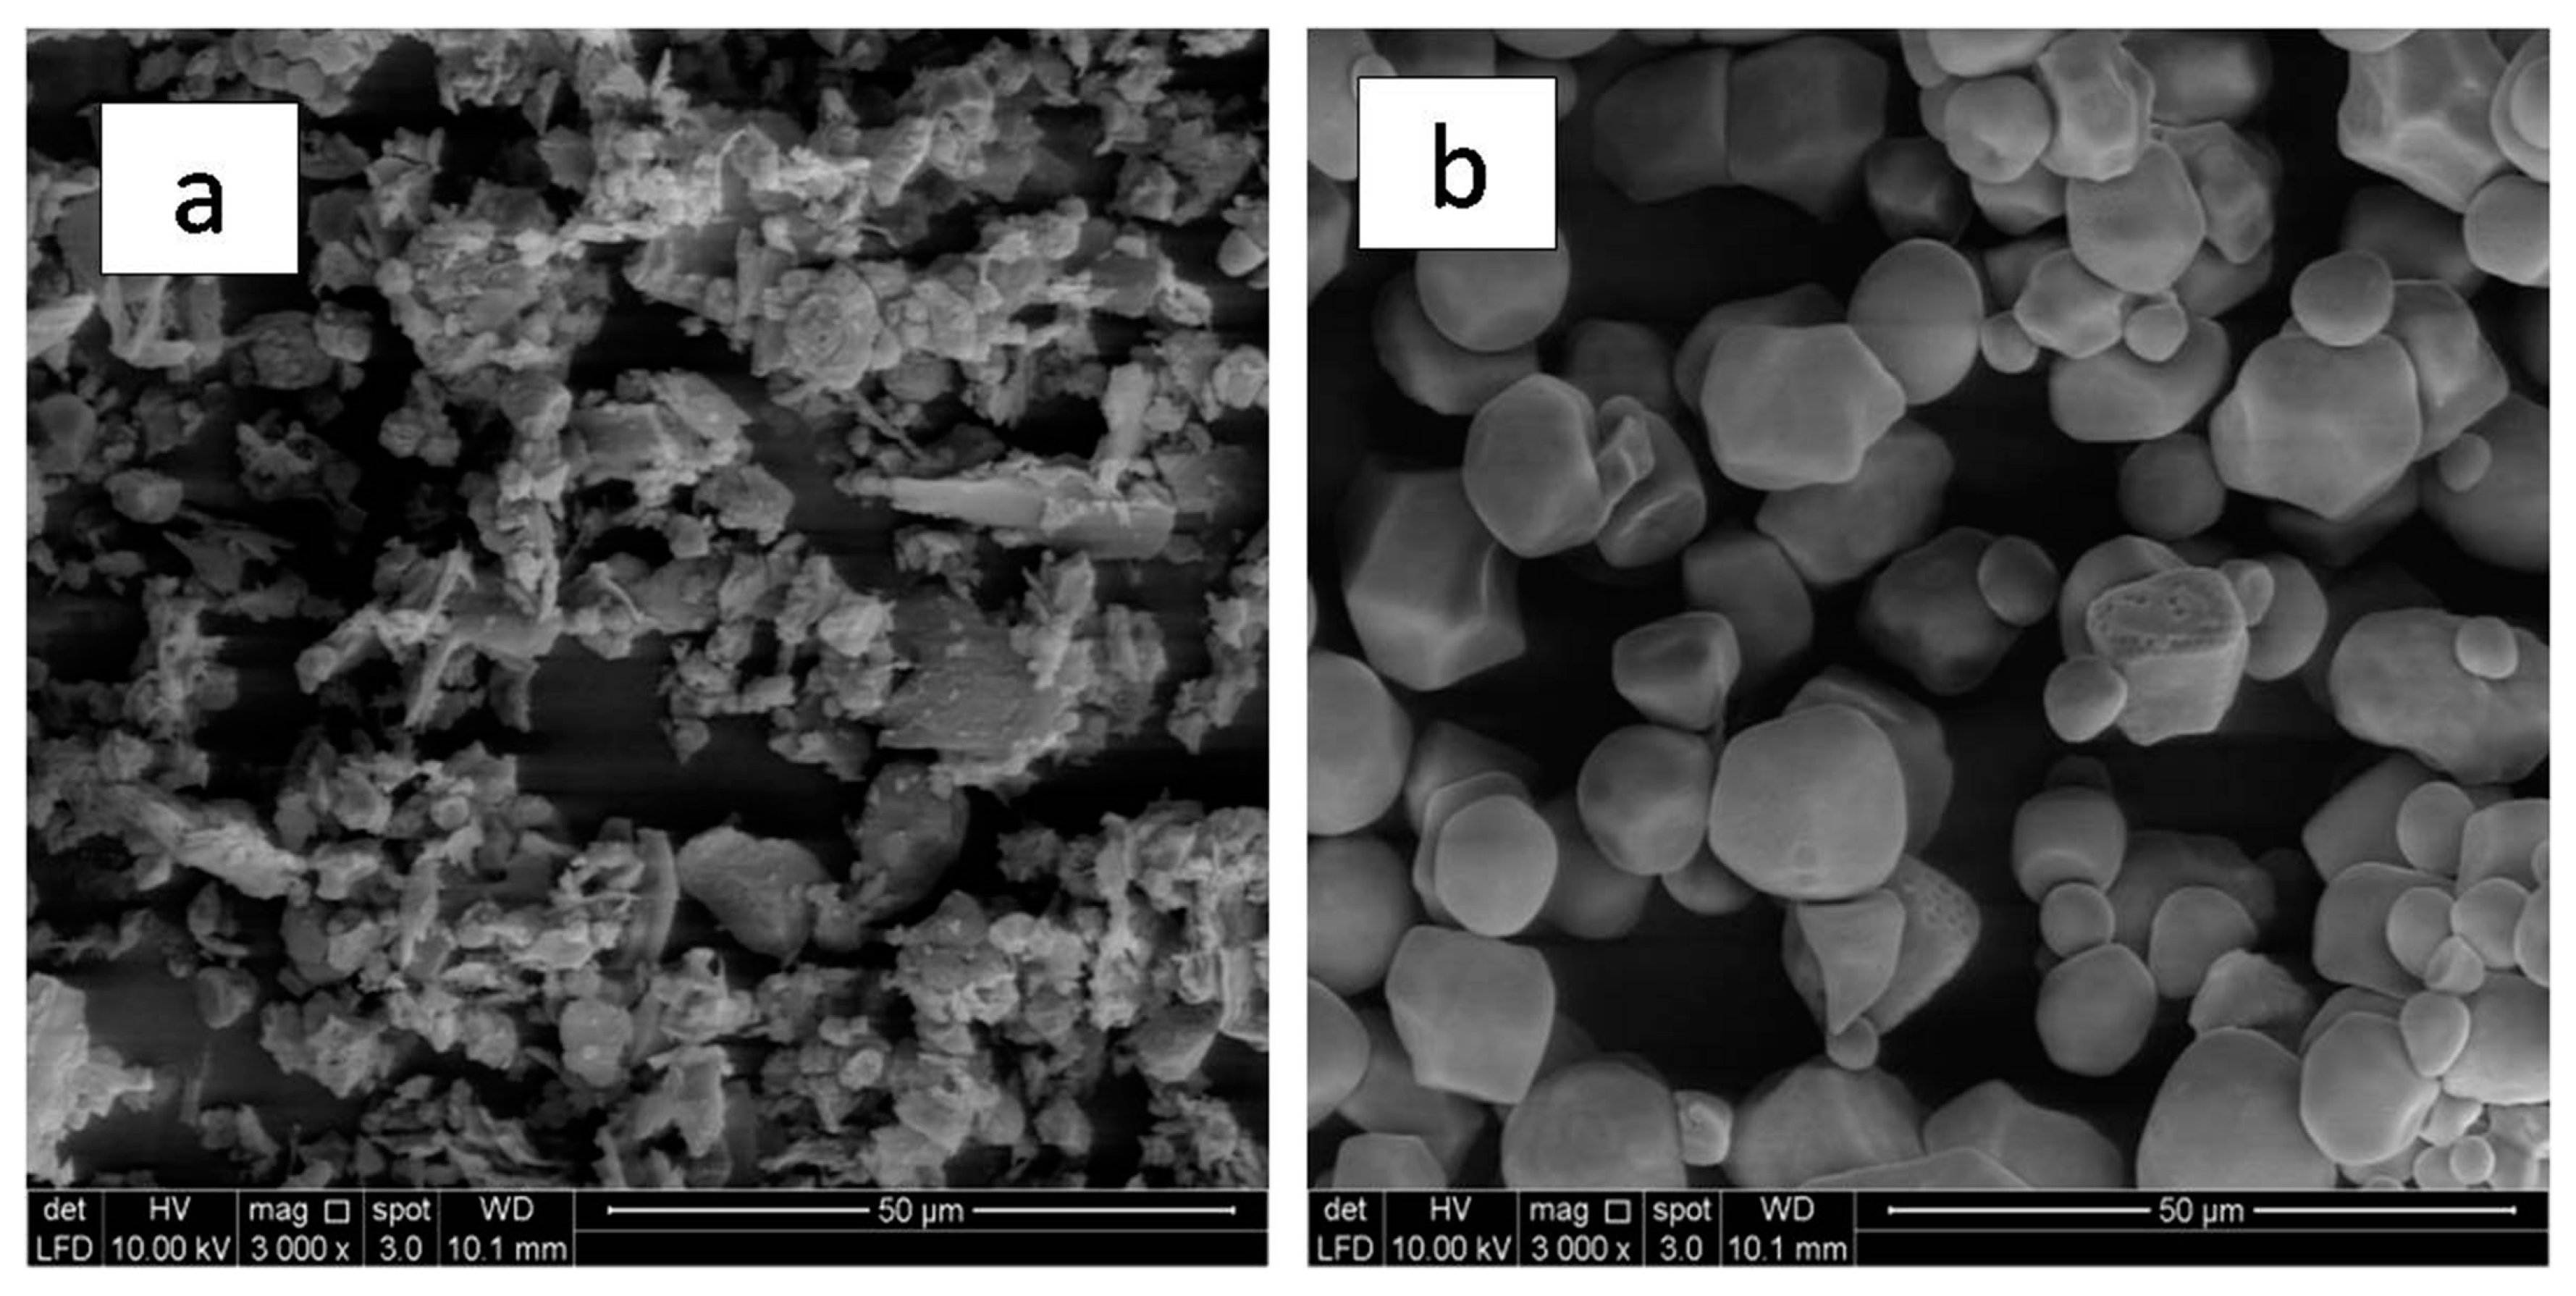
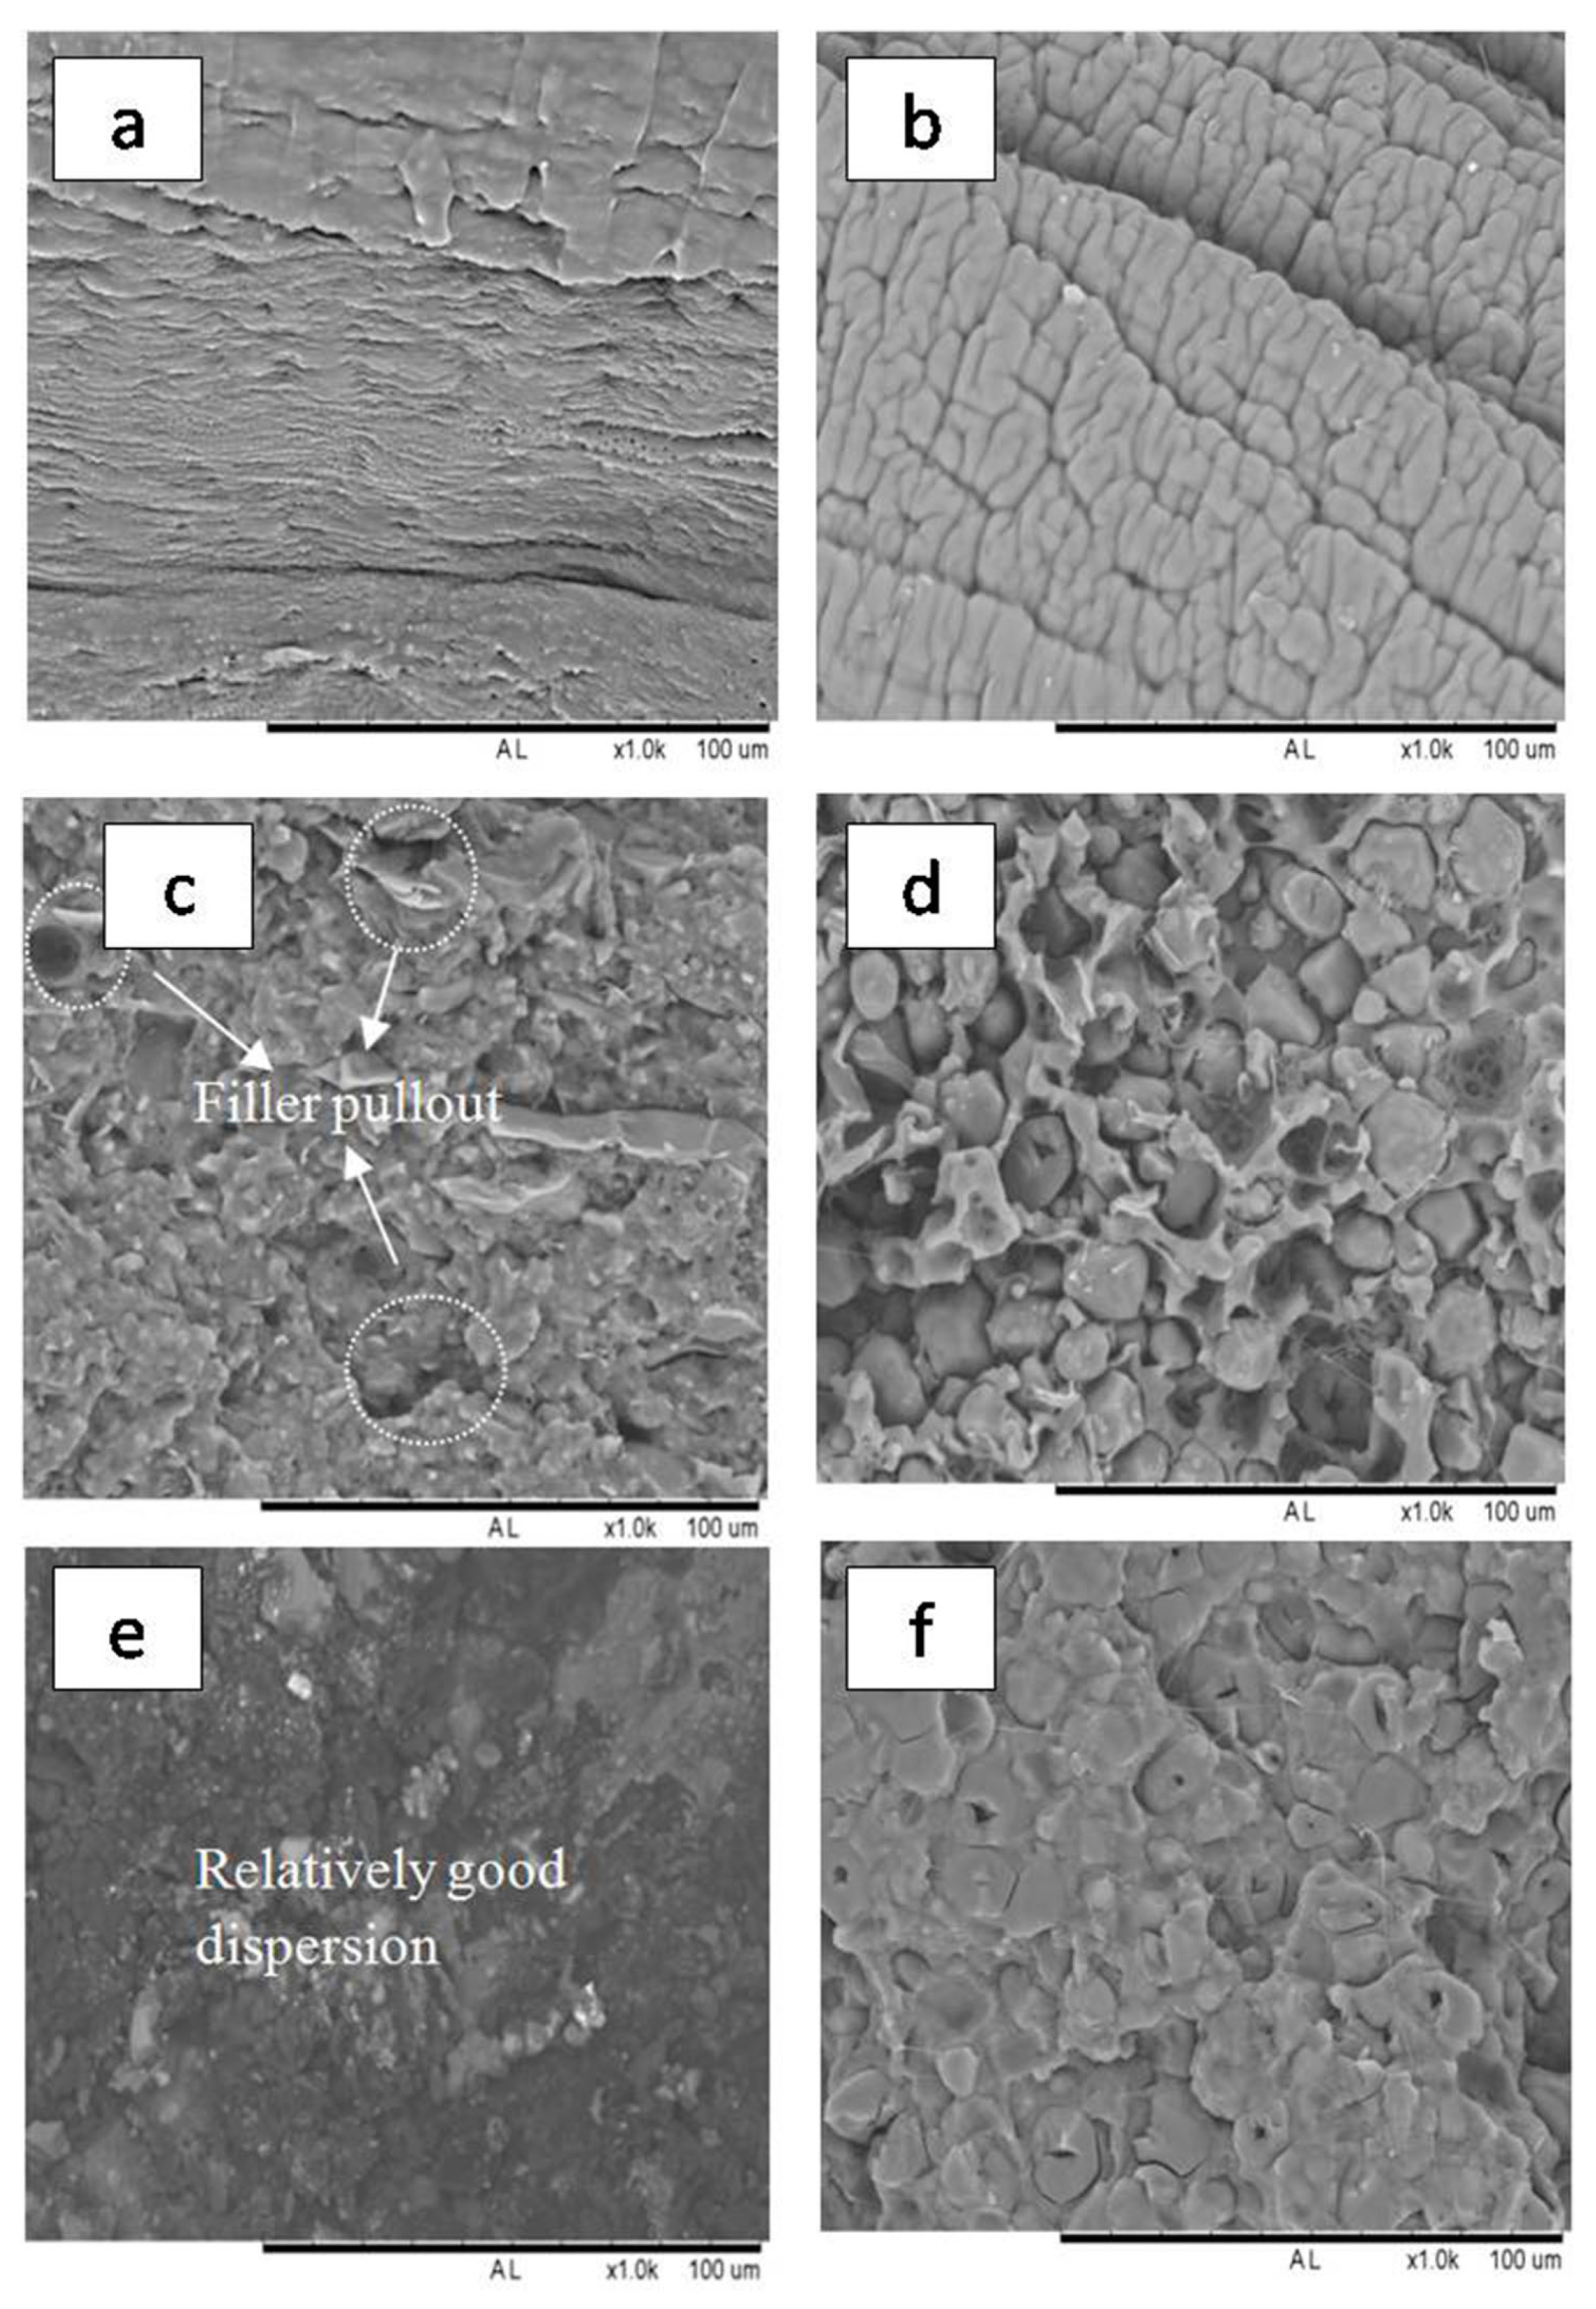
3.5. Morphology Analysis
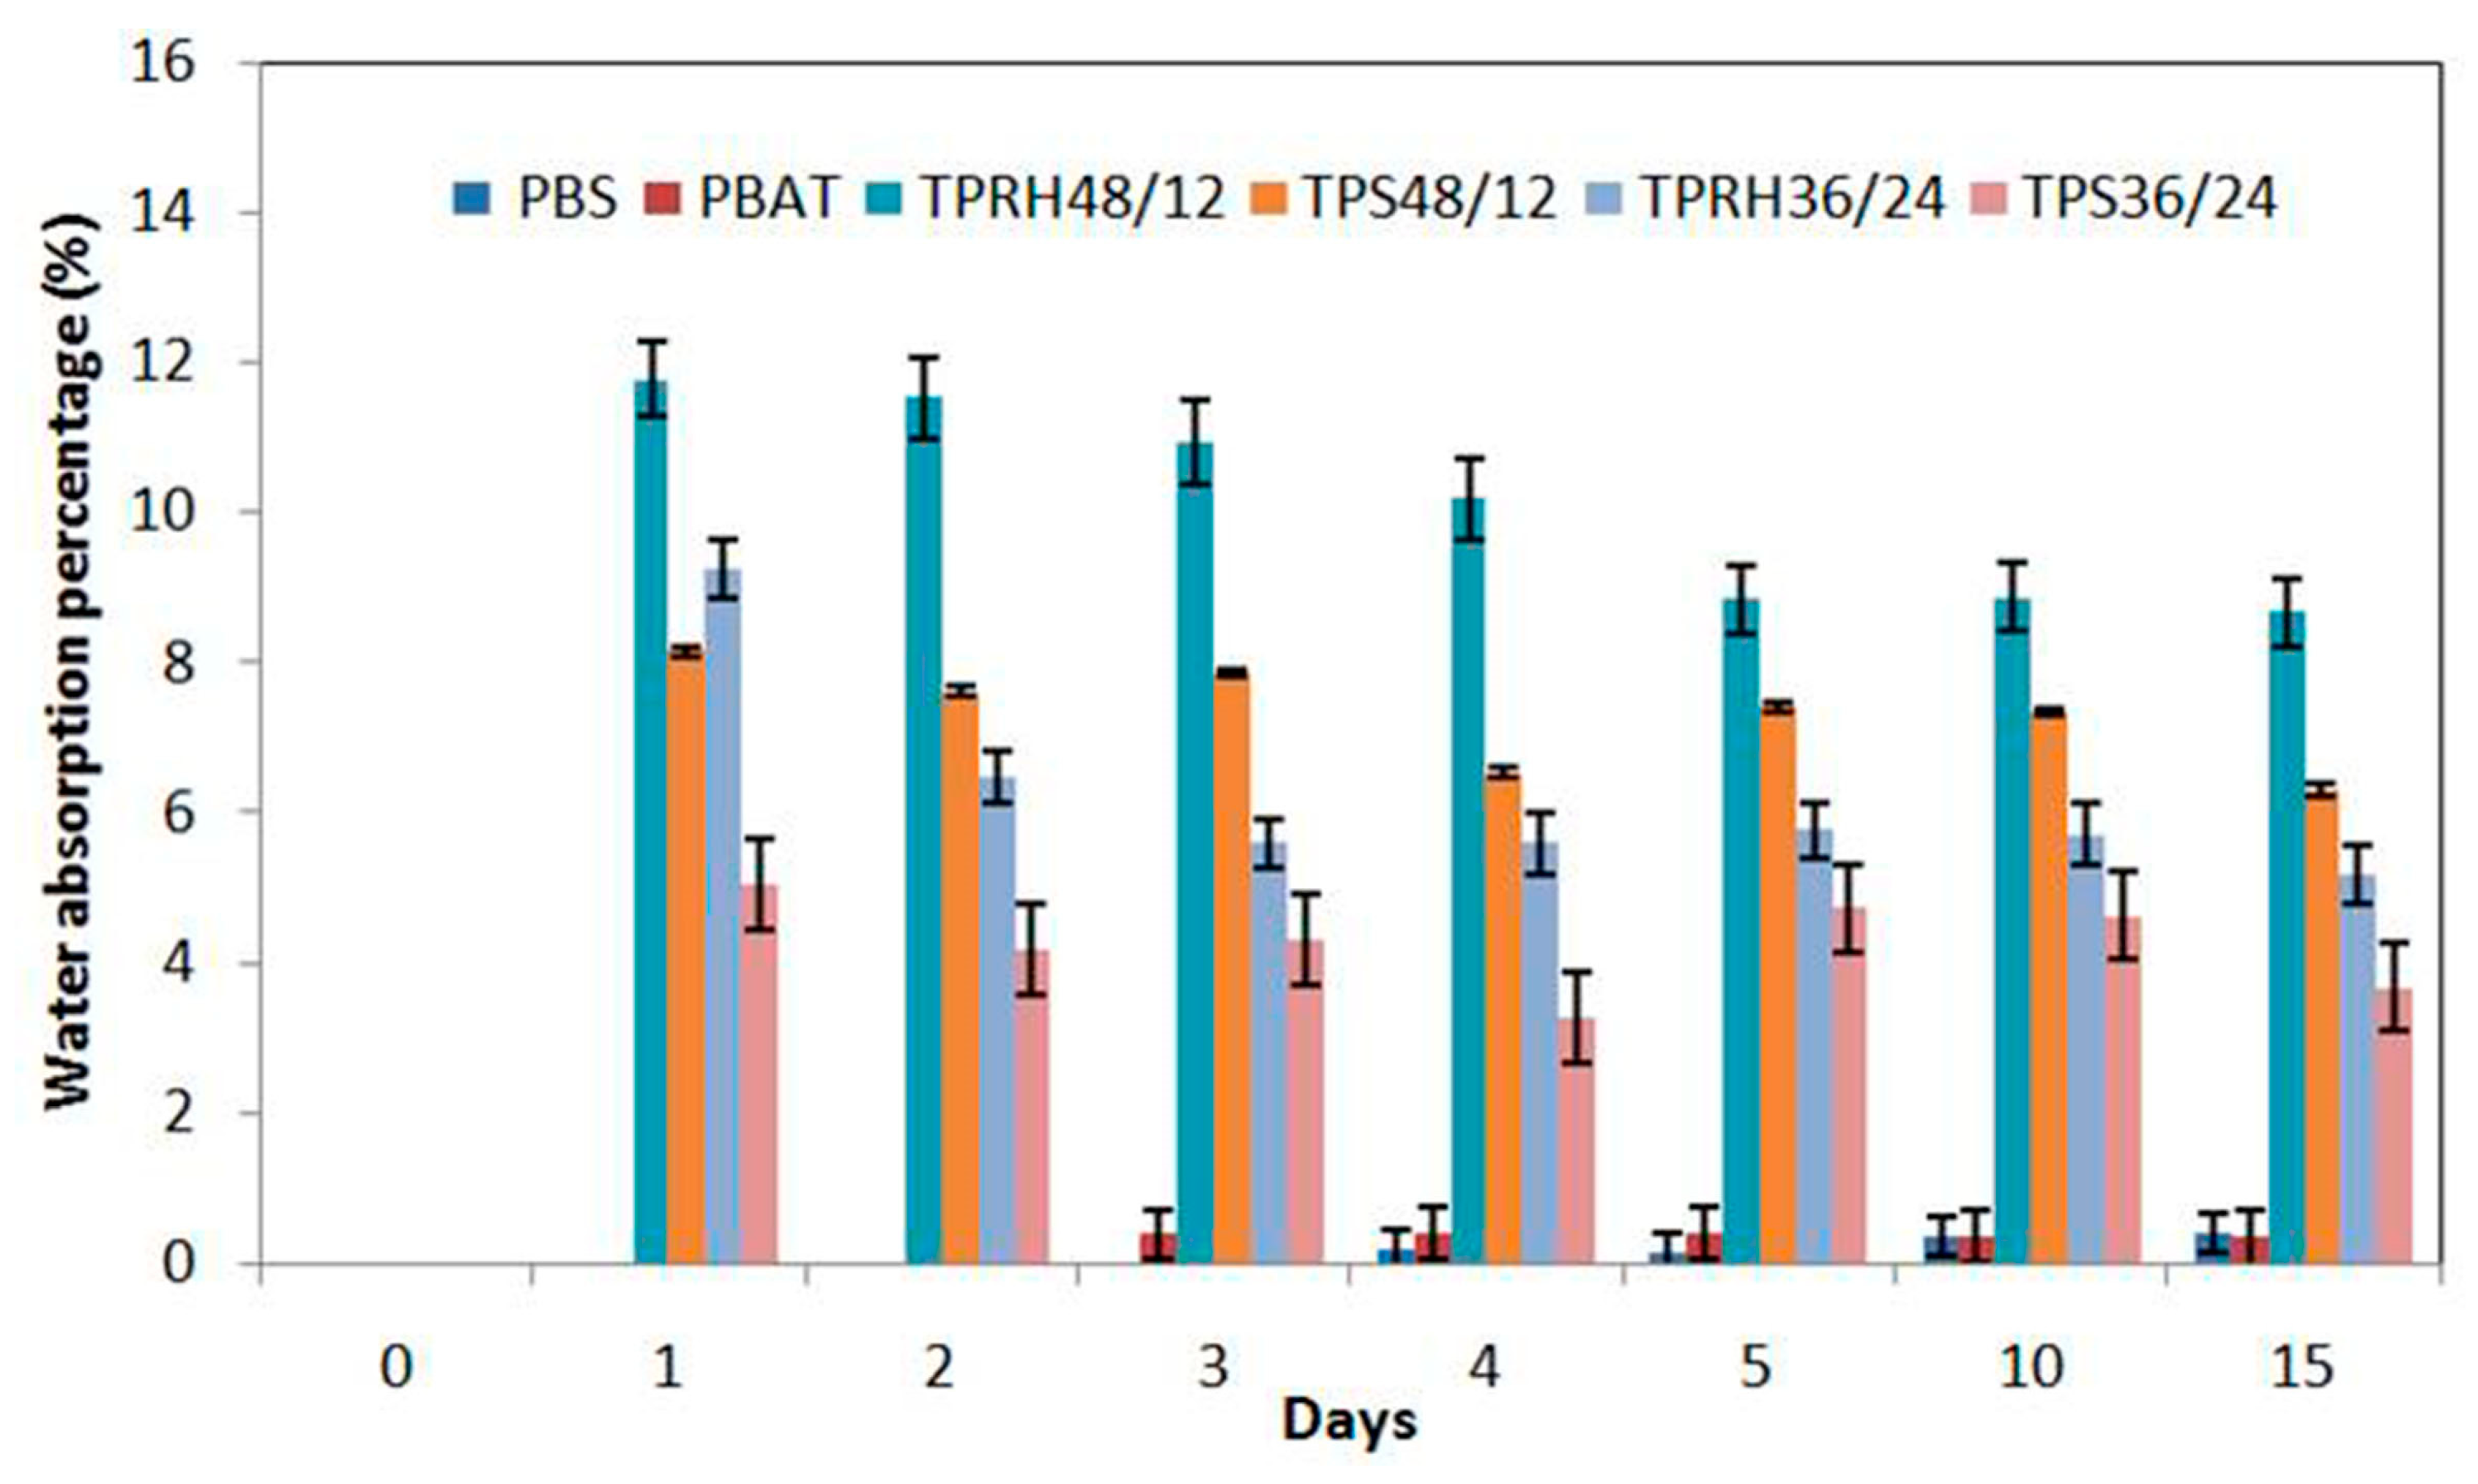
3.6. Water Absorption
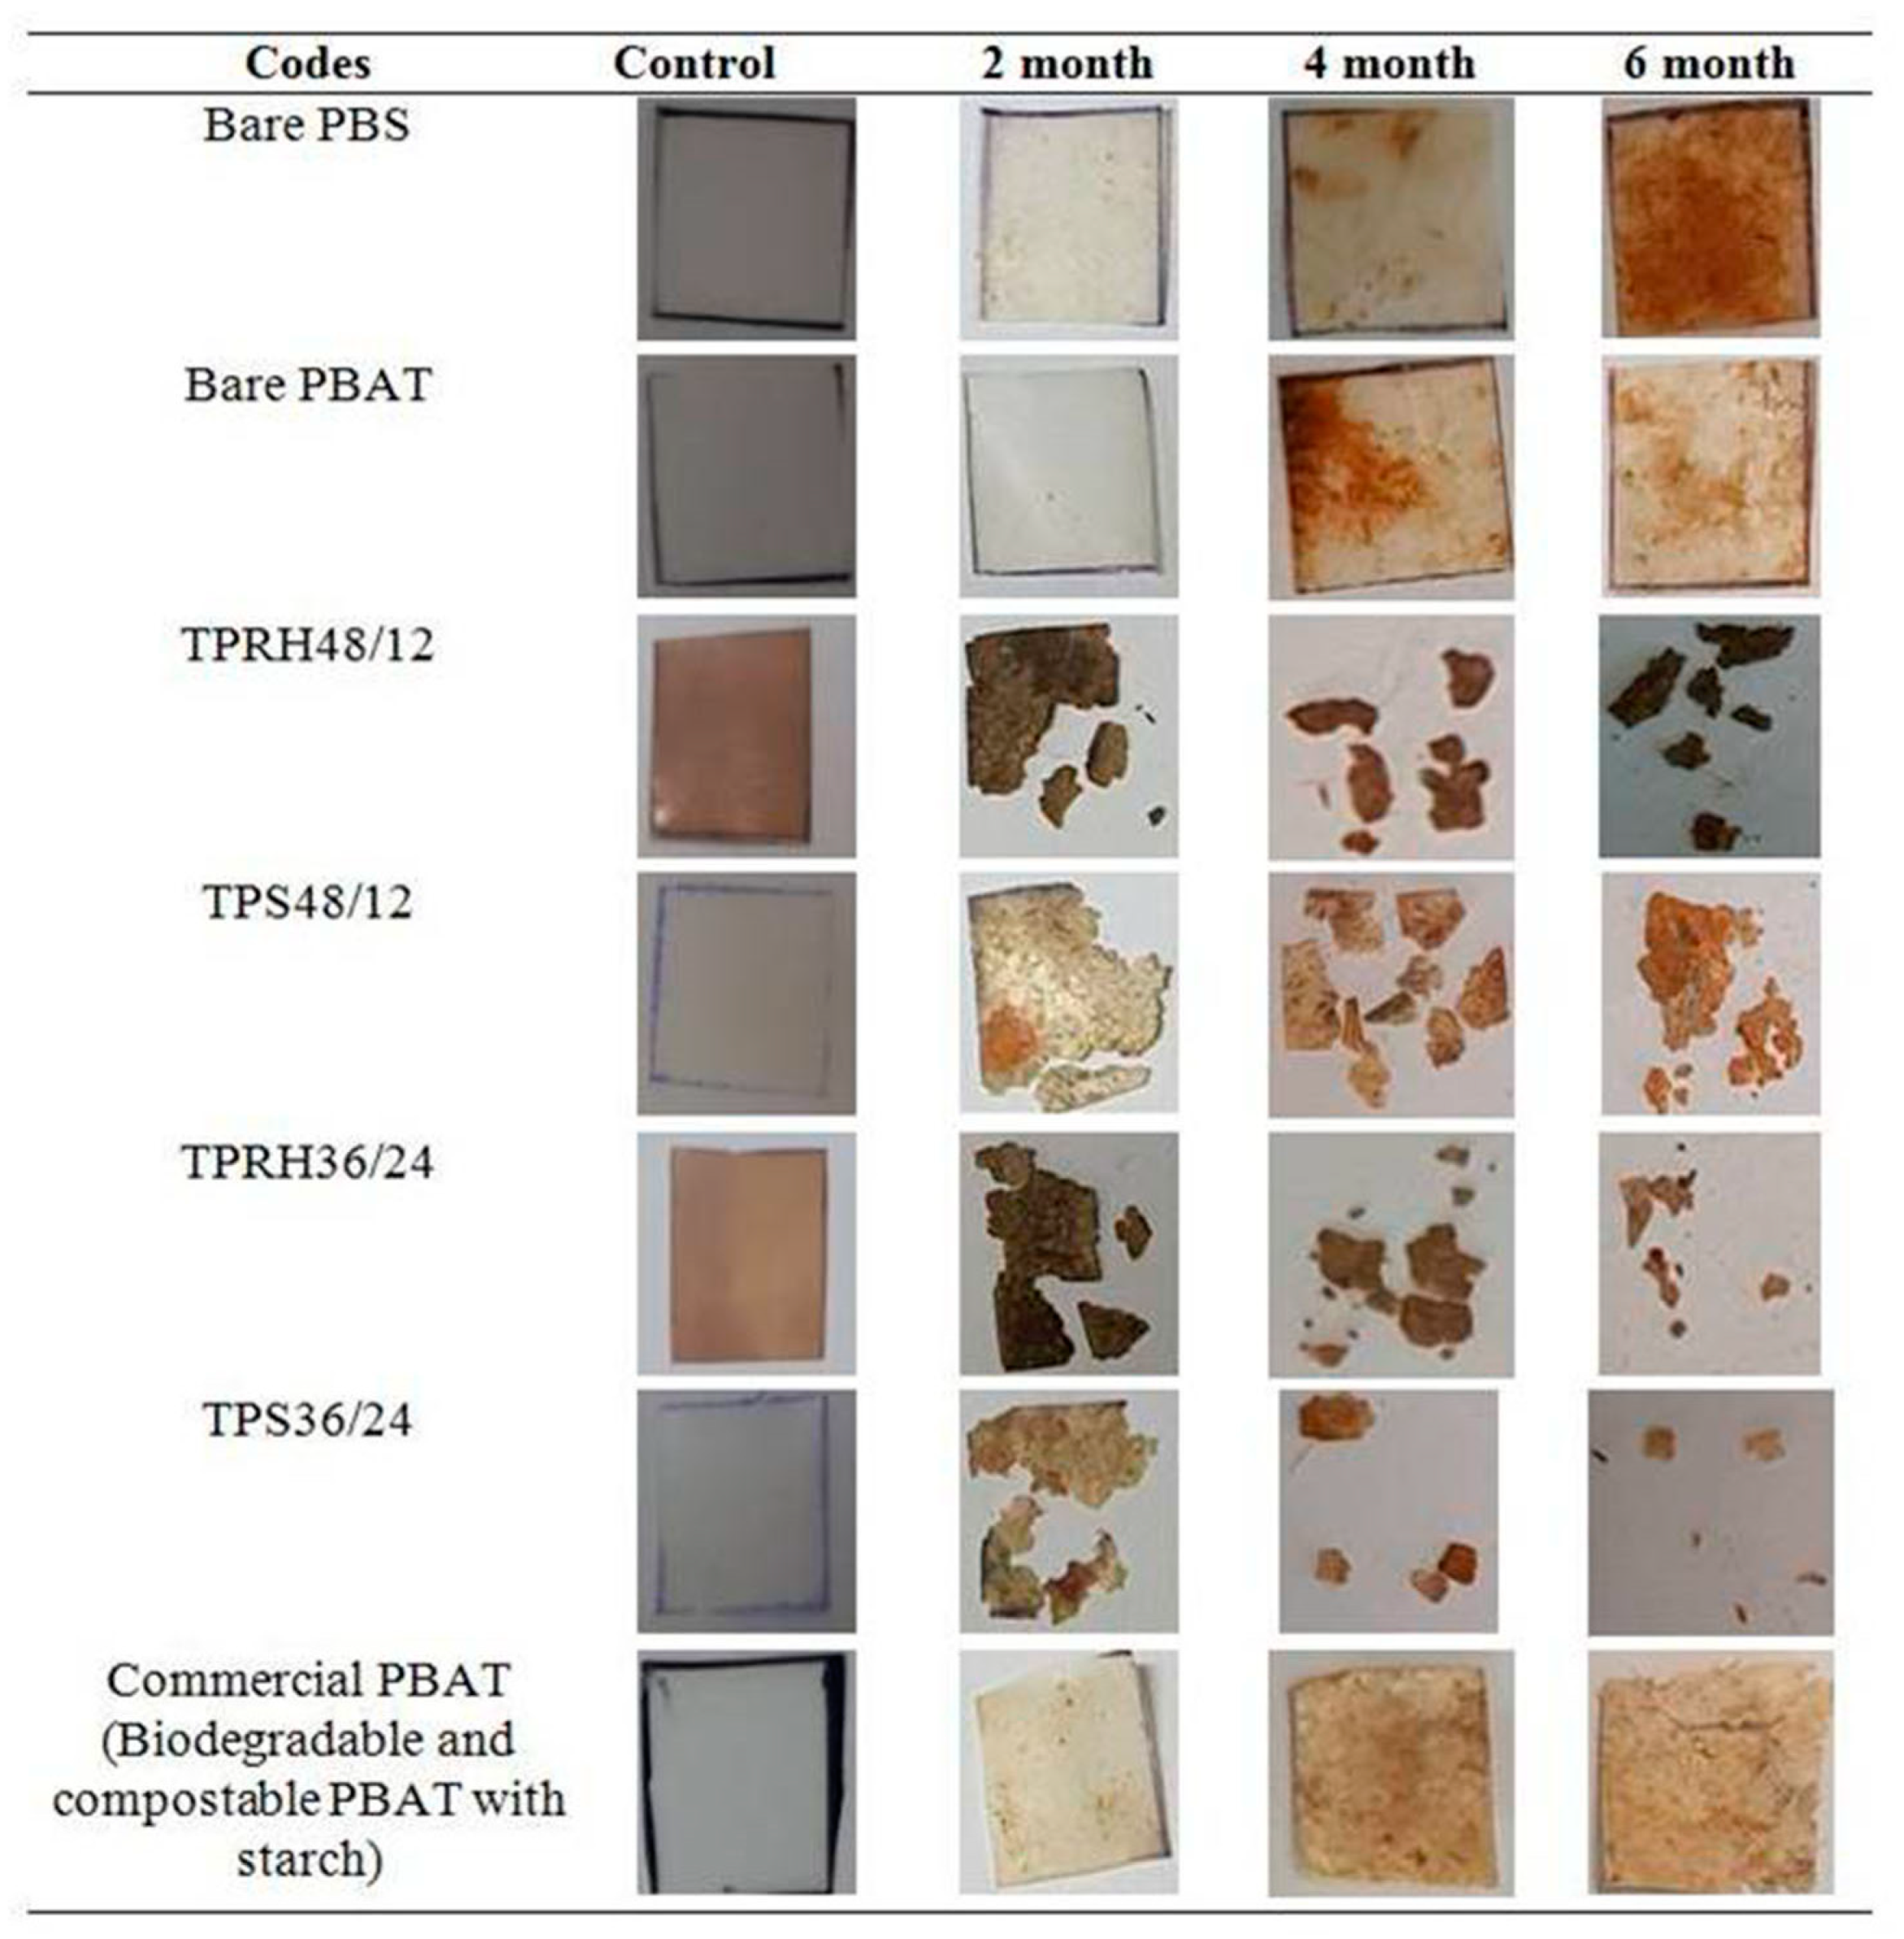
3.7. Soil Burial Test
4. Conclusions
Author Contributions
Funding
Institutional Review Board Statement
Informed Consent Statement
Data Availability Statement
Acknowledgments
Conflicts of Interest
References
- Strategies. 2017. Available online: https://www.statista.com/statistics/255977/total-global-riceconsumption/ (accessed on 4 August 2019).
- Taylor, M. The Star. 2020. Available online: https://www.thestar.com.my/news/nation/2020/02/17/malaysia-top-plastic-ocean-polluter-in-asia-says-wwf (accessed on 4 August 2019).
- Beckman, E. The World’s Plastic Problem in Numbers. 2018. Available online: https://www.weforum.org/ (accessed on 4 August 2019).
- Díez-Rodríguez, T.M.; Blázquez-Blázquez, E.; Pérez, E.; Cerrada, M.L. Composites Based on Poly(Lactic Acid) (PLA) and SBA-15: Effect of Mesoporous Silica on Thermal Stability and on Isothermal Crystallization from Either Glass or Molten State. Polymers 2020, 12, 2743. [Google Scholar] [CrossRef] [PubMed]
- Rezk, A.I.; Kim, K.-S.; Kim, C.S. Poly(ε-Caprolactone)/Poly(Glycerol Sebacate) Composite Nanofibers Incorporating Hydroxyapatite Nanoparticles and Simvastatin for Bone Tissue Regeneration and Drug Delivery Applications. Polymers 2020, 12, 2667. [Google Scholar] [CrossRef] [PubMed]
- Gigante, V.; Cinelli, P.; Righetti, M.C.; Sandroni, M.; Polacco, G.; Seggiani, M.; Lazzeri, A. On the Use of Biobased Waxes to Tune Thermal and Mechanical Properties of Polyhydroxyalkanoates–Bran Biocomposites. Polymers 2020, 12, 2615. [Google Scholar] [CrossRef] [PubMed]
- Costa, A.R.M.; Crocitti, A.; De Carvalho, L.H.; Carroccio, S.C.; Cerruti, P.; Santagata, G. Properties of Biodegradable Films Based on Poly(butylene Succinate) (PBS) and Poly(butylene Adipate-co-Terephthalate) (PBAT) Blends. Polymers 2020, 12, 2317. [Google Scholar] [CrossRef]
- Kirsh, I.; Frolova, Y.; Beznaeva, O.; Bannikova, O.; Gubanova, M.; Tveritnikova, I.; Romanova, V.; Filinskaya, Y. Influence of the Ultrasonic Treatment on the Properties of Polybutylene Adipate Terephthalate, Modified by Antimicrobial Additive. Polymers 2020, 12, 2412. [Google Scholar] [CrossRef]
- Muthuraj, R.; Misra, M.; Mohanty, A.K. Hydrolytic degradation of biodegradable polyesters under simulated environmental conditions. J. Appl. Polym. Sci. 2015, 132, 42189. [Google Scholar] [CrossRef]
- Vroman, I.; Tighzert, L. Biodegradable Polymers. Materials 2009, 2, 307–344. [Google Scholar] [CrossRef]
- Ferreira, F.V.; Cividanes, L.S.; Gouveia, R.F.; Lona, L.M.F. An overview on properties and applications of poly (butylene adipate-co-terephthalate)–PBAT based composites. Polym. Eng. Sci. 2017, 59, 7–15. [Google Scholar] [CrossRef] [Green Version]
- Muthuraj, R.; Misra, M.; Mohanty, A.K. Binary blends of poly(butylene adipate-co-terephthalate) and poly(butylene succinate):A new matrix for biocomposites applications. AIP Conf. Proc. 2015, 1664, 15009. [Google Scholar]
- Jantanasakulwong, K.; Leksawasdi, N.; Seesuriyachan, P.; Wongsuriyasak, S.; Techapun, C.; Ougizawa, T. Reactive blending of thermoplastic starch and polyethylene-graft-maleic anhydride with chitisan as compatibilizer. Carbohydr. Polym. 2016, 153, 89–95. [Google Scholar] [CrossRef]
- Ghavimi, S.A.A.; Ebrahimzadeh, M.H.; Abu Osman, N.A.; Solati-Hashjin, M. Polycaprolactone/starch composite: Fabrication, structure, properties, and applications. J. Biomed. Mater. Res. Part A 2015, 103, 2482–2498. [Google Scholar] [CrossRef] [PubMed]
- Meng, L.; Yu, L.; Khalid, S.; Liu, H.; Zhang, S.; Duan, Q.; Chen, L. Preparation, microstructure and performance of poly (lactic acid)-Poly (butylene succinate-co-butyleneadipate)-starch hybrid composites. Compos. Part B Eng. 2019, 177, 107384. [Google Scholar] [CrossRef]
- Zhang, S.; He, Y.; Yin, Y.; Jiang, G. Fabrication of innovative thermoplastic starch bio-elastomer to achieve high toughness poly(butylene succinate) composites. Carbohydr. Polym. 2019, 206, 827–836. [Google Scholar] [CrossRef] [PubMed]
- Panda, B.P.; Mohanty, S.; Nayak, S.K. Mechanism of Toughening in Rubber Toughened Polyolefin—A Review. Polym. Technol. Eng. 2015, 54, 462–473. [Google Scholar] [CrossRef]
- Prachayawarakorn, J.; Niracha, Y. Effect of recycling on properties of rice husk-filled-polypropylene. J. Sci. Technol. 2005, 27, 2. [Google Scholar]
- Phosee, J.; Wittayakun, J.; Suppakarn, N. Mechanical Properties and Morphologies of Rice Husk Silica (RHS)/ Poly (butylene adipate-co-terephthalate) (PBAT) Composites: Effect of Silane Coupling Agent. Adv. Mater. Res. 2010, 125, 141–144. [Google Scholar] [CrossRef]
- Dina, A.F.; Zaleha, S.S.; Najmi, B.N.; Azowa, I.N. The Influence of Alkaline Treatment on Mechanical Properties and Morphology of Rice Husk Fibre Reinforced Polylactic Acid. Adv. Mater. Res. 2014, 911, 13–17. [Google Scholar] [CrossRef]
- Statista. Total Global Rice Consumption 2008–2020. 2020. Available online: https://www.statista.com/statistics/255977/total-global-rice-consumption/ (accessed on 2 September 2020).
- Kumar, A.; Sengupta, B.; Dasgupta, D.; Mandal, T.; Datta, S. Recovery of value added products from rice husk ash to explore an economic way for recycle and reuse of agricultural waste. Rev. Environ. Sci. Technol. 2015, 15, 47–65. [Google Scholar] [CrossRef]
- Burgstaller, C. A comparison of processing and performance for lignocellulosic reinforced polypropylene for injection moulding applications. Compos. Part B Eng 2014, 69, 192–198. [Google Scholar] [CrossRef]
- Arjmandi, R.; Hassan, A.; Majeed, K.; Zakaria, Z. Rice Husk Filled Polymer Composites. Int. J. Polym. Sci. 2015, 2015, 1–32. [Google Scholar] [CrossRef]
- Salazar, M.A.H.; Salinas, E. Mechanical, thermal, viscoelastic performance and product application of PP—Rice husk Colombian biocomposites. Compos. Part B Eng. 2019, 176, 107135. [Google Scholar] [CrossRef]
- Yeh, S.-K.; Hsieh, C.-C.; Chang, H.-C.; Yen, C.C.; Chang, Y.-C. Synergistic effect of coupling agents and fiber treatments on mechanical properties and moisture absorption of polypropylene–rice husk composites and their foam. Compos. Part A Appl. Sci. Manuf. 2015, 68, 313–322. [Google Scholar] [CrossRef]
- Aridi, N.A.M.; Sapuan, S.M.; Zainudin, E.S.; Oqla, F.M.A. Mechanical and morphological properties of injection-molded rice husk polypropylene composites. Int. J. Polym. Anal. Charact. 2016, 21, 305–313. [Google Scholar] [CrossRef]
- Adeosun, S.O.; Aworinde, A.K.; Diwe, I.V.; Olaleye, S. Mechanical and Microstructural Characteristic of Rice Husk Reinforced Polylactide Nano Composite. West Indian J. Eng. 2016, 39, 63–71. [Google Scholar]
- Boonprasertpoh, A.; Pentrakoon, D.; Junkasem, J. Investigating rheological, morphological and mechanical properties of PBS/PBAT blends. J. Met. Mater. Miner. 2017, 27, 1–11. [Google Scholar] [CrossRef]
- Savas, L.A.; Tayfun, U.; Doğan, M. The use of polyethylene copolymers as compatibilizers in carbon fiber reinforced high density polyethylene composites. Compos. Part B Eng. 2016, 99, 188–195. [Google Scholar] [CrossRef]
- Arslan, A.; Çakmak, S.; Cengiz, A.; Gümüşderelioğlu, M. Poly(butylene adipate-co-terephthalate) scaffolds: Processing, structural characteristics and cellular responses. J. Biomater. Sci. Polym. Ed. 2016, 27, 1841–1859. [Google Scholar] [CrossRef]
- Brian, C.S. The C=O Bond, Part III: Carboxylic Acids. Spectroscopy 2018, 33, 14–20. [Google Scholar]
- Merck. 2020. Available online: https://www.sigmaaldrich.com/technical-documents/articles/biology/ir-spectrum-table.html (accessed on 28 November 2020).
- Phua, Y.J. Reactive processing of maleic anhydride-grafted poly(butylene succinate) and the compatibilizing effect on poly(butylene succinate) nanocomposites. Express Polym. Lett. 2013, 7, 340–354. [Google Scholar] [CrossRef]
- Cai, Y.; LV, J.; Liu, Y.; Wang, Z.; Zhao, M.; Shi, R. Discrimination of Poly (butylenes adipate-co-terephathalate) andPoly(ethylene terepthalate) with Fourier Transform Infrared Microscope and Raman Spectroscope. Spectrosc. Lett. 2012, 45, 280–284. [Google Scholar] [CrossRef]
- Mohkami, M.; Taleipour, M. Investigation of the chemical structure of carboxylated and carboxymethylated fibers from waste paper via XRD and FTIR analysis. Bioresources 2014, 6, 1988–2003. [Google Scholar]
- Gupta, H.; Kumar, H.; Kumar, M.; Gehlaut, A.K.; Gaur, A.; Sachan, S.; Park, J.-W. Synthesis of biodegradable films obtained from rice husk and sugarcane bagasse to be used as food packaging material. Environ. Eng. Res. 2019, 25, 506–514. [Google Scholar] [CrossRef]
- Amigo, N.; Palza, H.; Canales, D.; Sepúlveda, F.; Vasco, D.A.; Sepúlveda, F.; Zapata, P.A. Effect of starch nanoparticles on the crystallization kinetics and photodegradation of high density polyethylene. Compos. Part B Eng. 2019, 174, 106979. [Google Scholar] [CrossRef]
- Rachtanapun, P.; Rattanaponone, N. Synthesis and Characterization of Carboxymethyl Cellulose powder and Films from Mimosa pigra. J. Appl. Polym. Sci. 2011, 122, 3218–3226. [Google Scholar] [CrossRef]
- Yeasmin, M.S.; Mondal, M.I.H. Synthesis of highly substituted carboxymethyl cellulose depending on cellulose particle size. Int. J. Biol. Macromol. 2015, 80, 725–731. [Google Scholar] [CrossRef]
- Sarma, P.; Kumar, R.; Parshirajan, K. Batch and Continuous Removal of Copper and Lead from Aqueous Solution using Cheaply Available Agriculture Waste Materials. Int. J. Environ. Res. 2015, 9, 635–648. [Google Scholar]
- Derkus, B.; Emregui, K.; Mazi, H.; Emreg, L.; Yumak, T.; Sinag, A. Protein A immunosensor for the detection of immunoglobulin G by impedance spectroscopy. Bioprocess Biosyst. Eng. 2014, 37, 965–976. [Google Scholar] [CrossRef]
- Rahman, M.R.; Hamdan, S.; Hasan, M.; Baini, R.; Salleh, A.A. Physical, Mechanical, and Thermal Properties of Wood Flour Reinforced Maleic Anhydride Grafted Unsaturated Polyester (UP) Biocomposites. Bioresources 2015, 10, 10. [Google Scholar] [CrossRef] [Green Version]
- Mendes, J.; Paschoalin, R.; Carmona, V.B.; Neto, A.R.D.S.; Marques, A.; Marconcini, J.M.; Mattoso, L.H.C.; Medeiros, E.S.; Oliveira, J.E. Biodegradable polymer blends based on corn starch and thermoplastic chitosan processed by extrusion. Carbohydr. Polym. 2015, 137, 452–458. [Google Scholar] [CrossRef] [Green Version]
- Hardinnawirda, K.; Aisha, I.S. Effect of Rice Husks as Filler in Polymer Matrix Composites. J. Mech. Eng. Sci. 2014, 2, 181–186. [Google Scholar] [CrossRef]
- Garalde, R.A.; Thipmanee, R.; Jariyasakoolroj, P.; Sane, A. The effects of blend ratio and storage time on thermoplastic starch/poly(butylene adipate-co-terephthalate) films. Heliyon 2019, 5, 01251. [Google Scholar] [CrossRef] [PubMed] [Green Version]
- Sabetzadeh, M.; Bagheri, R.; Masoomi, M. Effect of nanoclay on the properties of low density polyethylene/linear low density polyethylene/thermoplastic starch blend films. Carbohydr. Polym. 2016, 141, 75–81. [Google Scholar] [CrossRef] [PubMed]
- Farotti, E.; Natalini, M. Injection molding. Influence of process parameters on mechanical properties of polypropylene polymer. A first study. Procedia Struct. Integr. 2018, 8, 256–264. [Google Scholar] [CrossRef]
- Onojah, A.D.; Agbendeh, N.A.; Mbakaan, C. Rice Husk Ash Refractory: The Temperature Dependent Crystalline Phase Aspects. Int. J. Recent Res. Appl. Stud. 2013, 15, 2. [Google Scholar]
- Bath, H. 2020. Available online: https://alisbathbomblab.weebly.com/index.html (accessed on 2 September 2020).
- Mohammadi-Rovshandeh, J.; Davachi, S.M.; Kaffashi, B.; Hassani, A.; Bahmeyi, A.; Pouresmaeel-Selakjani, P. Effect of lignin removal on mechanical, thermal, and morphological properties of polylactide/starch/rice husk blend used in food packaging. J. Appl. Polym. Sci. 2014, 131, 22. [Google Scholar] [CrossRef]
- Meincke, D.K.; de Oliveira Ogliari, A.; Ogliari, F.A. Influence of difference fillers on the properties of an experimental vinyl polysiloxane. Braz. Oral Res. 2016, 30, 1. [Google Scholar] [CrossRef] [Green Version]
- Derrien, K.; Gilormini, P. The effect of moisture-induced swelling on the absorption capacity of transversely isotropic elastic polymer–matrix composites. Int. J. Solids Struct. 2009, 46, 1547–1553. [Google Scholar] [CrossRef] [Green Version]
- Muthuraj, R.; Misra, M.; Mohanty, A.K. Biocomposite consisting of miscanthus fiber and biodegradable binary blend matrix: Compatibilization and performance evaluation. RSC Adv. 2017, 7, 27538–27548. [Google Scholar] [CrossRef] [Green Version]
- Dammak, M.; Fourati, Y.; Tarrés, Q.; Delgado-Aguilar, M.; Mutjé, P.; Boufi, S. Blends of PBAT with plasticized starch for packaging applications: Mechanical properties, rheological behaviour and biodegradability. Ind. Crop. Prod. 2020, 144, 112061. [Google Scholar] [CrossRef]
- Sun, E.; Liao, G.; Zhang, Q.; Qu, P.; Wu, G.; Huang, H. Biodegradable copolymer-based composites made from straw fiber for biocomposite flowerpots application. Compos. Part B Eng. 2019, 165, 193–198. [Google Scholar] [CrossRef]
- Tokiwa, Y.; Calabia, B.P.; Ugwu, C.U.; Aiba, S. Biodegradability of plastics. Int. J. Mol. Sci. 2009, 10, 3722–3742. [Google Scholar] [CrossRef] [PubMed]
- Celina, M.; Ottesen, D.; Gillen, K.; Clough, R. FTIR emission spectroscopy applied to polymer degradation. Polym. Degrad. Stab. 1997, 58, 15–31. [Google Scholar] [CrossRef]


| Material | Ratio | Compatibilizer | Tensile Strength (MPa) | Young’s Modulus (MPa) | Elongation at Break (%) | Reference |
|---|---|---|---|---|---|---|
| PP/rice husk | 60/40 | - | 21.5 | - | 4.7 | [18] |
| PBAT/rice husk silica | 70/30 | - | 14.5 | 54 | 820 | [19] |
| PLA/AT rice husk | 75/25 | - | 7.35 | - | 0.99 | [20] |
| PP/rice husk | 90/10 | - | 32.50 | 1944 | - | [23] |
| 80/20 | - | 31.78 | 2209 | - | [23] | |
| 70/30 | - | 31.42 | 2540 | - | [23] | |
| PP/Rice husk | 70/30 | - | 24 | 2100 | - | [24] |
| PP/rice husk | 70/30 | - | 29.1 | 2000 | - | [25] |
| PP/rice husk | 50/50 | - | 17.76 | 2134 | - | [26] |
| PP/rice husk | 60/40 | struktol | 20 | 5000 | - | [27] |
| PLA/rice husk | 100/0 95/5 | - | 0.22 0.24 | 0.2 2 | 45 7 | [28] |
| [28] |
| Designation | Composition | Parts |
|---|---|---|
| PBS | PBS | 100 |
| PBAT | PBAT | 100 |
| TPRH48/12 | PBAT/PBS/TPRH/CS/MA/DCP | 48/12/40/0.5/2/0.4 |
| TPS48/12 | PBAT/PBS/TPS/CS/MA/DCP | 48/12/40/0.5/2/0.4 |
| TPRH 36/24 | PBAT/PBS/TPRH/CS/MA/DCP | 36/24/40/0.5/2/0.4 |
| TPS36/24 | PBAT/PBS/TPS/CS/MA/DCP | 36/24/40/0.5/2/0.4 |
| Commercial PBAT | - | - |
| Sample Code | Tensile Strength (MPa) | Young’s Modulus (MPa) | Elongation at Break (%) |
|---|---|---|---|
| PBS | 30.63 ± 2.4 | 166.23 ± 2.71 | 547.45 ± 21.61 |
| PBAT | 38.99 ± 7.25 | 16.1 ± 2.63 | 1421.93 ± 123 |
| TPRH48/12 | 12.43 ± 0.48 | 150.34 ± 4.43 | 24.70 ± 2.53 |
| TPS48/12 | 10.42 ± 0.52 | 134.38 ± 3.63 | 28.62 ± 3.16 |
| TPRH36/24 | 14.27 ± 1.13 | 200.43 ± 14.73 | 12.99 ± 2.34 |
| TPS36/24 | 14.21 ± 0.81 | 199.49 ± 9.03 | 15.39 ± 0.98 |
| Commercial PBAT | 10.07 ± 0.99 | 55.84 ± 2.77 | 716.95 ± 125.44 |
| Code | Tm (°C) | Enthalpy of Melting of 100% Crystalline, ∆Hm100 (J/g) | Xc (%) |
|---|---|---|---|
| PBS | 114.04 | 70.62 | 64.03 |
| PBAT | 121.68 | 9.76 | 8.56 |
| TPRH48/12 | 110.29 | 8.49 | 15.52 |
| TPS48/12 | 111.27 | 7.92 | 14.47 |
| TPRH36/24 | 111.38 | 14.78 | 36.01 |
| TPS36/24 | 111.72 | 17.69 | 43.10 |
| Commercial PBAT | 119.77 | 1.4 | 1.75 |
| Sample Code | Mass Loss Percentage (%) | |||
|---|---|---|---|---|
| 0 month | 2 months | 4 months | 6 months | |
| PBS | 0 | 4.19 ± 0.29 | 6.54 ± 0.10 | 8.90 ± 0.06 |
| PBAT | 0 | 6.23 ± 0.31 | 6.82 ± 0.11 | 9.20 ± 0.05 |
| TPRH48/12 | 0 | 20.94 ± 0.14 | 64.56 ± 0.21 | 79.78 ± 0.10 |
| TPS48/12 | 0 | 48.74 ± 0.21 | 83.30 ± 0.27 | 86.88 ± 0.19 |
| TPRH36/24 | 0 | 31.52 ± 0.30 | 88.91 ± 0.08 | 92.00 ± 0.08 |
| TPS36/24 | 0 | 53.36 ± 0.17 | 92.07 ± 0.08 | 97.06 ± 0.03 |
| Commercial PBAT | 0 | 14.27 ± 0.15 | 18.16 ± 0.19 | 32.51 ± 0.17 |
Publisher’s Note: MDPI stays neutral with regard to jurisdictional claims in published maps and institutional affiliations. |
© 2020 by the authors. Licensee MDPI, Basel, Switzerland. This article is an open access article distributed under the terms and conditions of the Creative Commons Attribution (CC BY) license (http://creativecommons.org/licenses/by/4.0/).
Share and Cite
Yap, S.Y.; Sreekantan, S.; Hassan, M.; Sudesh, K.; Ong, M.T. Characterization and Biodegradability of Rice Husk-Filled Polymer Composites. Polymers 2021, 13, 104. https://doi.org/10.3390/polym13010104
Yap SY, Sreekantan S, Hassan M, Sudesh K, Ong MT. Characterization and Biodegradability of Rice Husk-Filled Polymer Composites. Polymers. 2021; 13(1):104. https://doi.org/10.3390/polym13010104
Chicago/Turabian StyleYap, Saw Yin, Srimala Sreekantan, Mohd Hassan, Kumar Sudesh, and Ming Thong Ong. 2021. "Characterization and Biodegradability of Rice Husk-Filled Polymer Composites" Polymers 13, no. 1: 104. https://doi.org/10.3390/polym13010104