Mechanistic Aspects of Condensed- and Gaseous-Phase Activities of Some Phosphorus-Containing Fire Retardants


Abstract
:
1. Introduction
2. Materials and Methods
3. Results and Discussion
3.1. Condensed-Phase Analysis
3.1.1. Inductively-Coupled Plasma Optical Emission Spectroscopy (ICP-OES)
3.1.2. Solid-State NMR Spectra
3.1.3. Raman Spectroscopy
3.2. Vapour-Phase Analyses of the Additives (i.e., Hyphenated Techniques)
3.2.1. Gas Chromatography-Mass Spectrometry (GC/MS)
3.2.2. Pyrolysis-Gas Chromatography/Mass Spectrometry (Pyrolysis-GC/MS)
4. Conclusions
- The inorganic solid additive, i.e., (NH4)2HPO4, underwent a two-step degradation, yielding ammonia gas and phosphoric acid in the first step, followed by the degradation of the product, ammonium dihydrogen phosphate to produce oxides of phosphorus and nitrogen and ammonia;
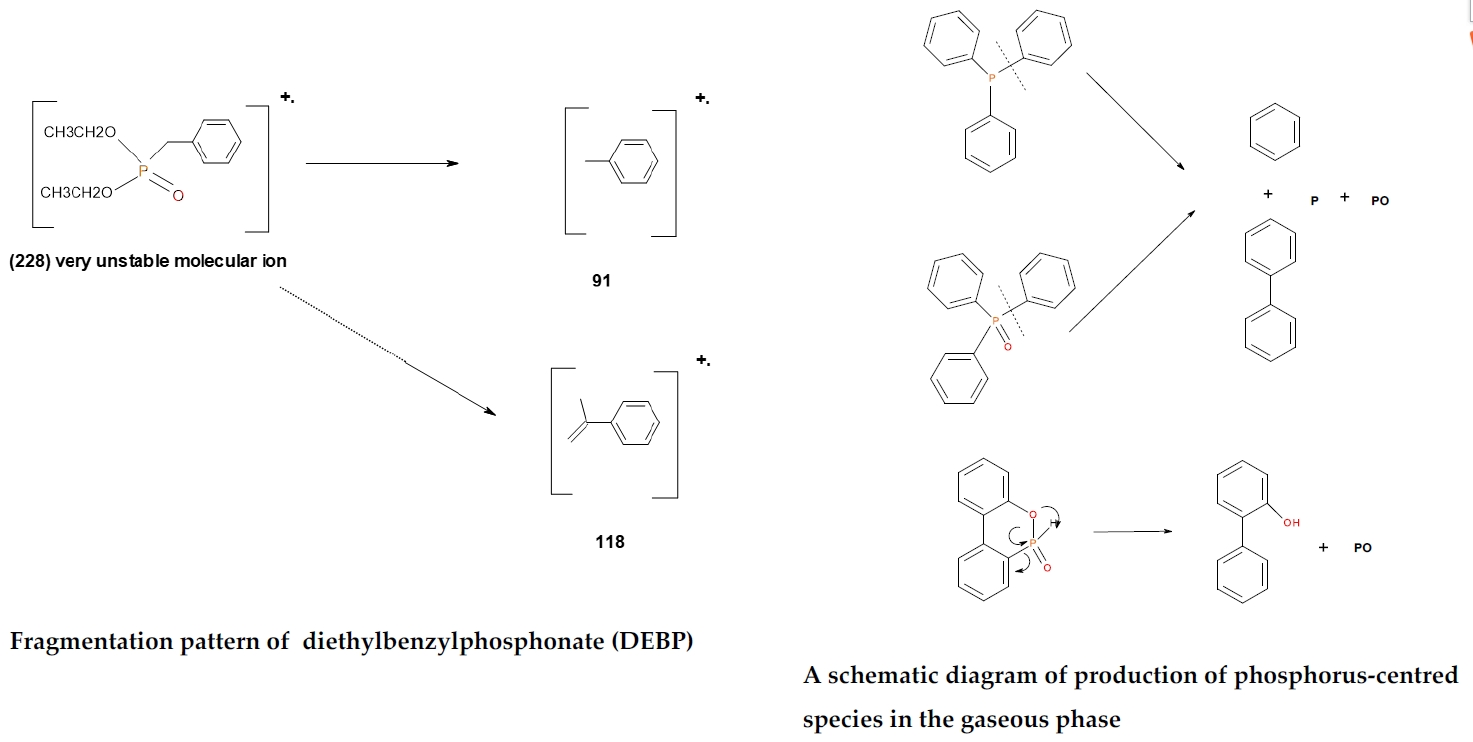
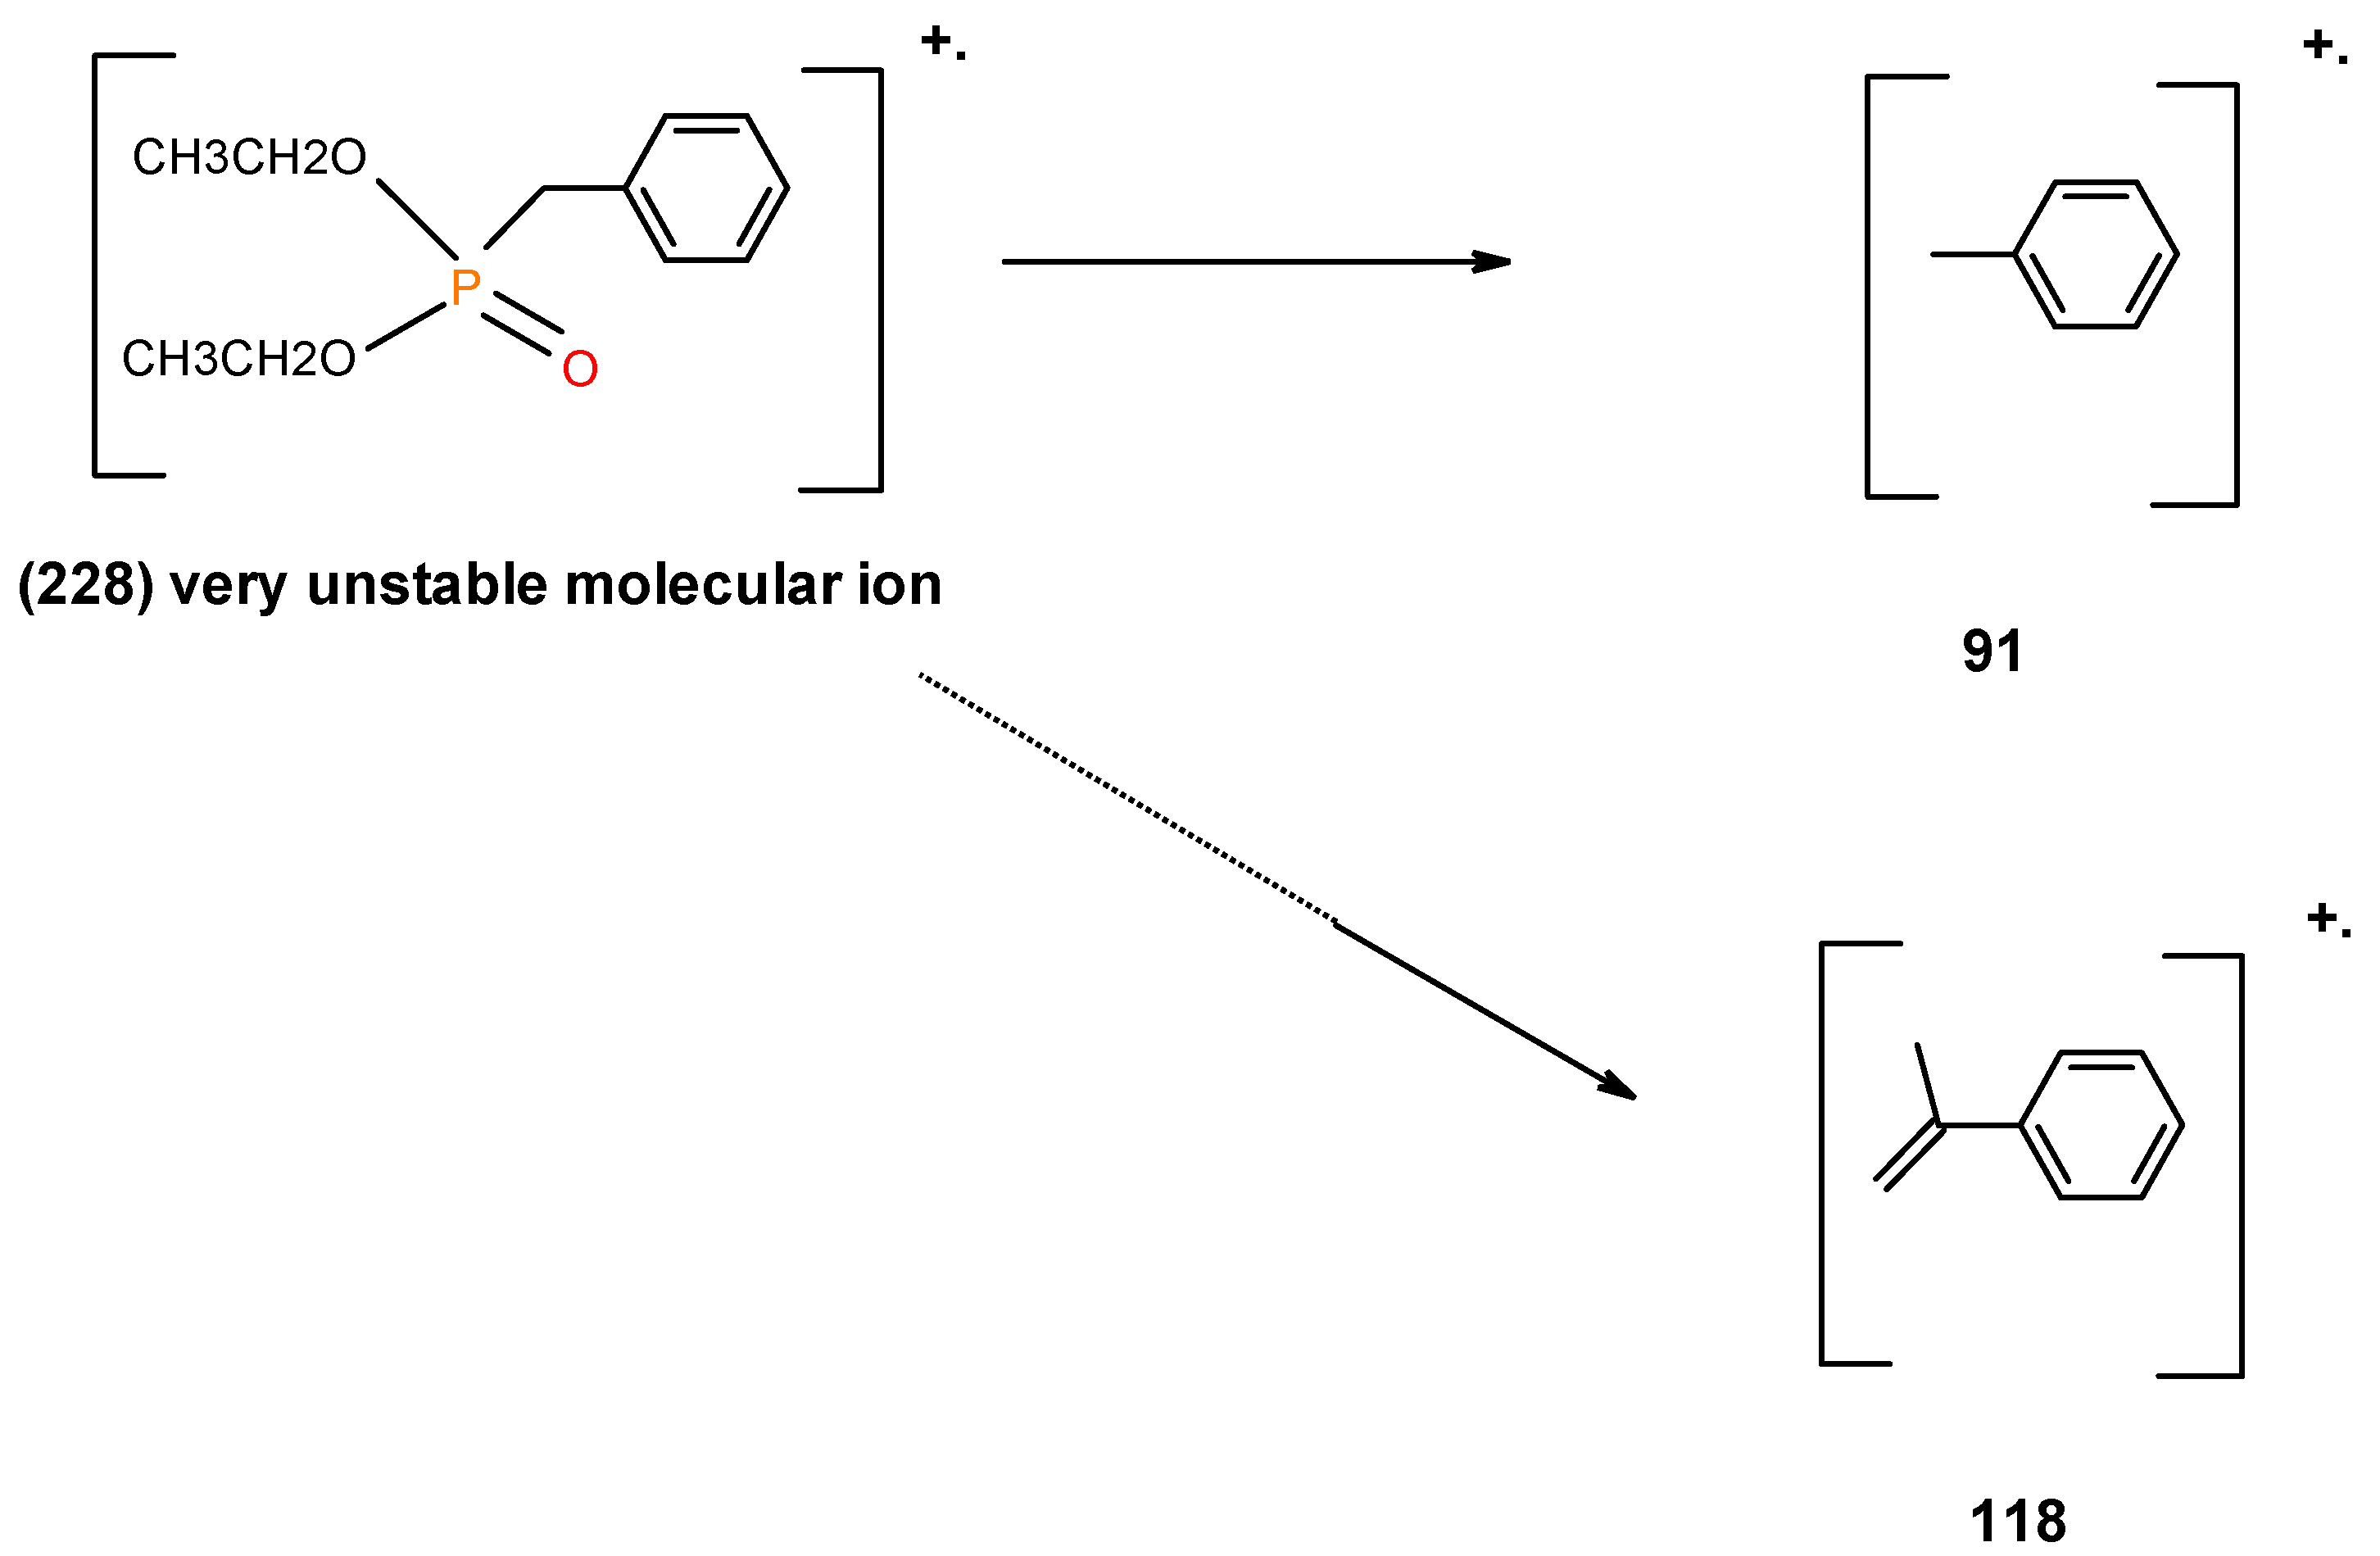
- As expected, the liquid additives, owing to their volatility as compared to the solid ones, showed a higher presence in the vapour phase. Furthermore, it can be seen that relatively substantial amounts of phosphorus-containing species from phosphine and the phosphine oxides were also presumably released into the vapour phase through fragments emanating from the thermal pyrolysis in the condensed phase
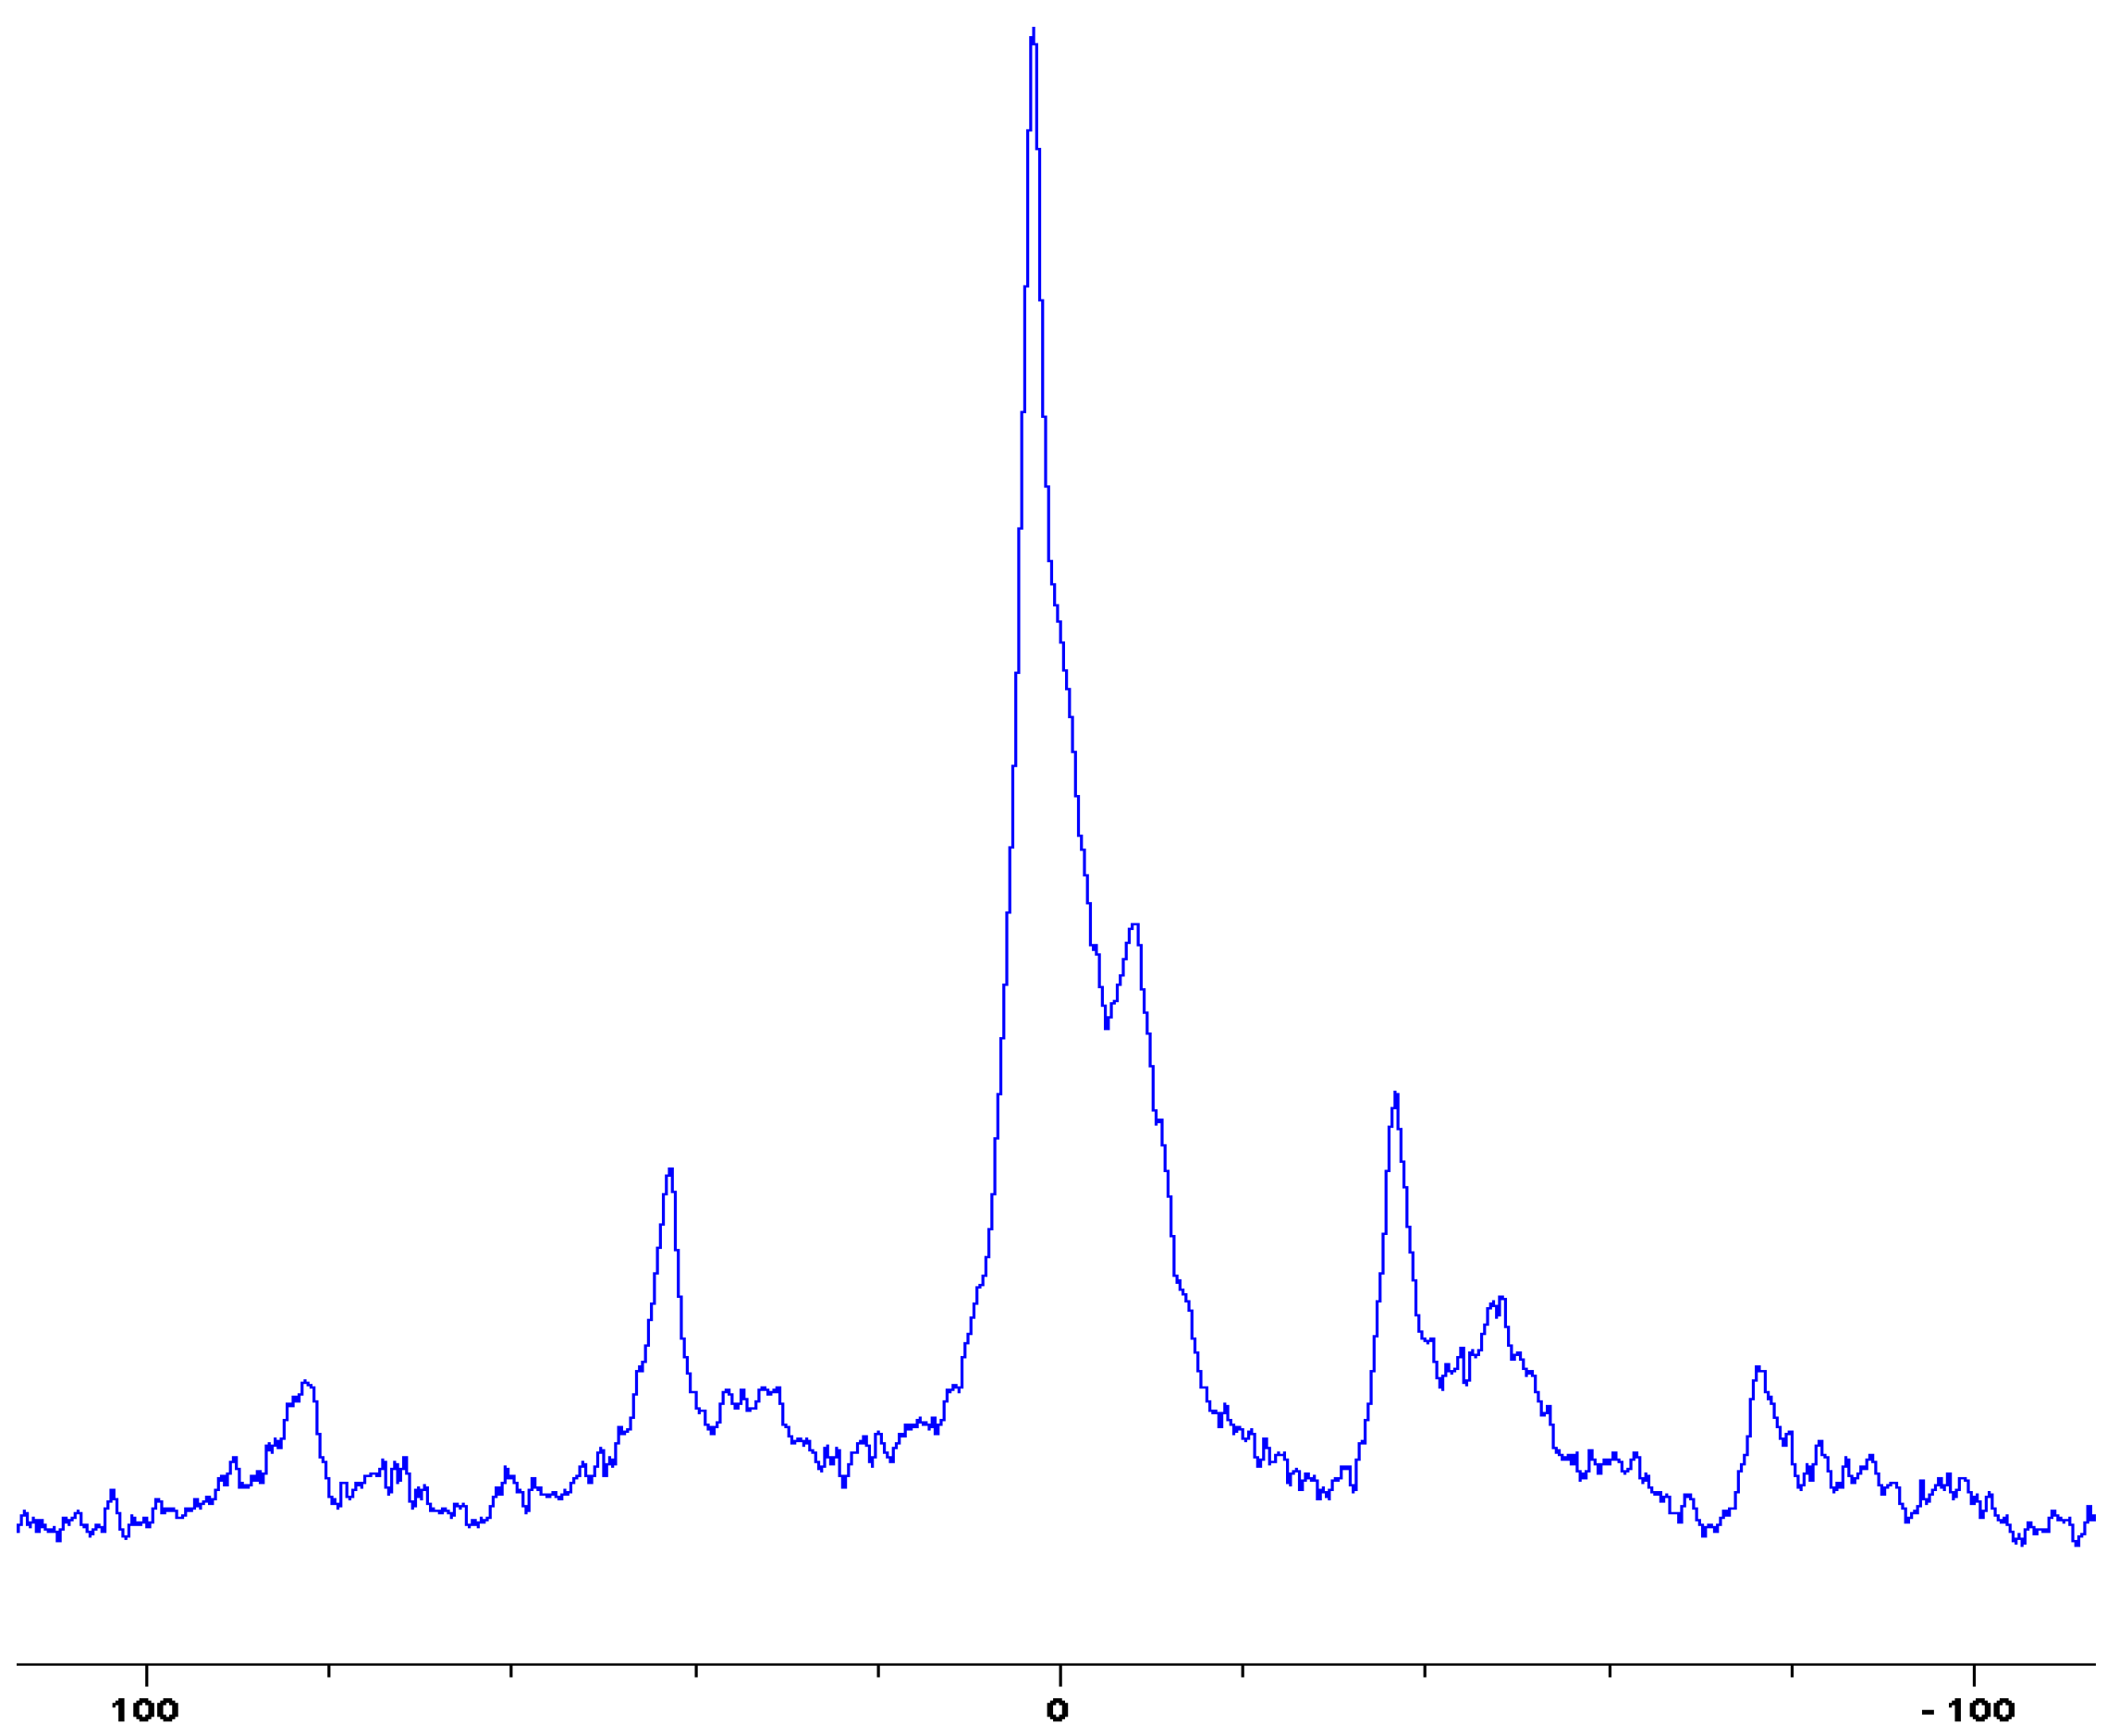
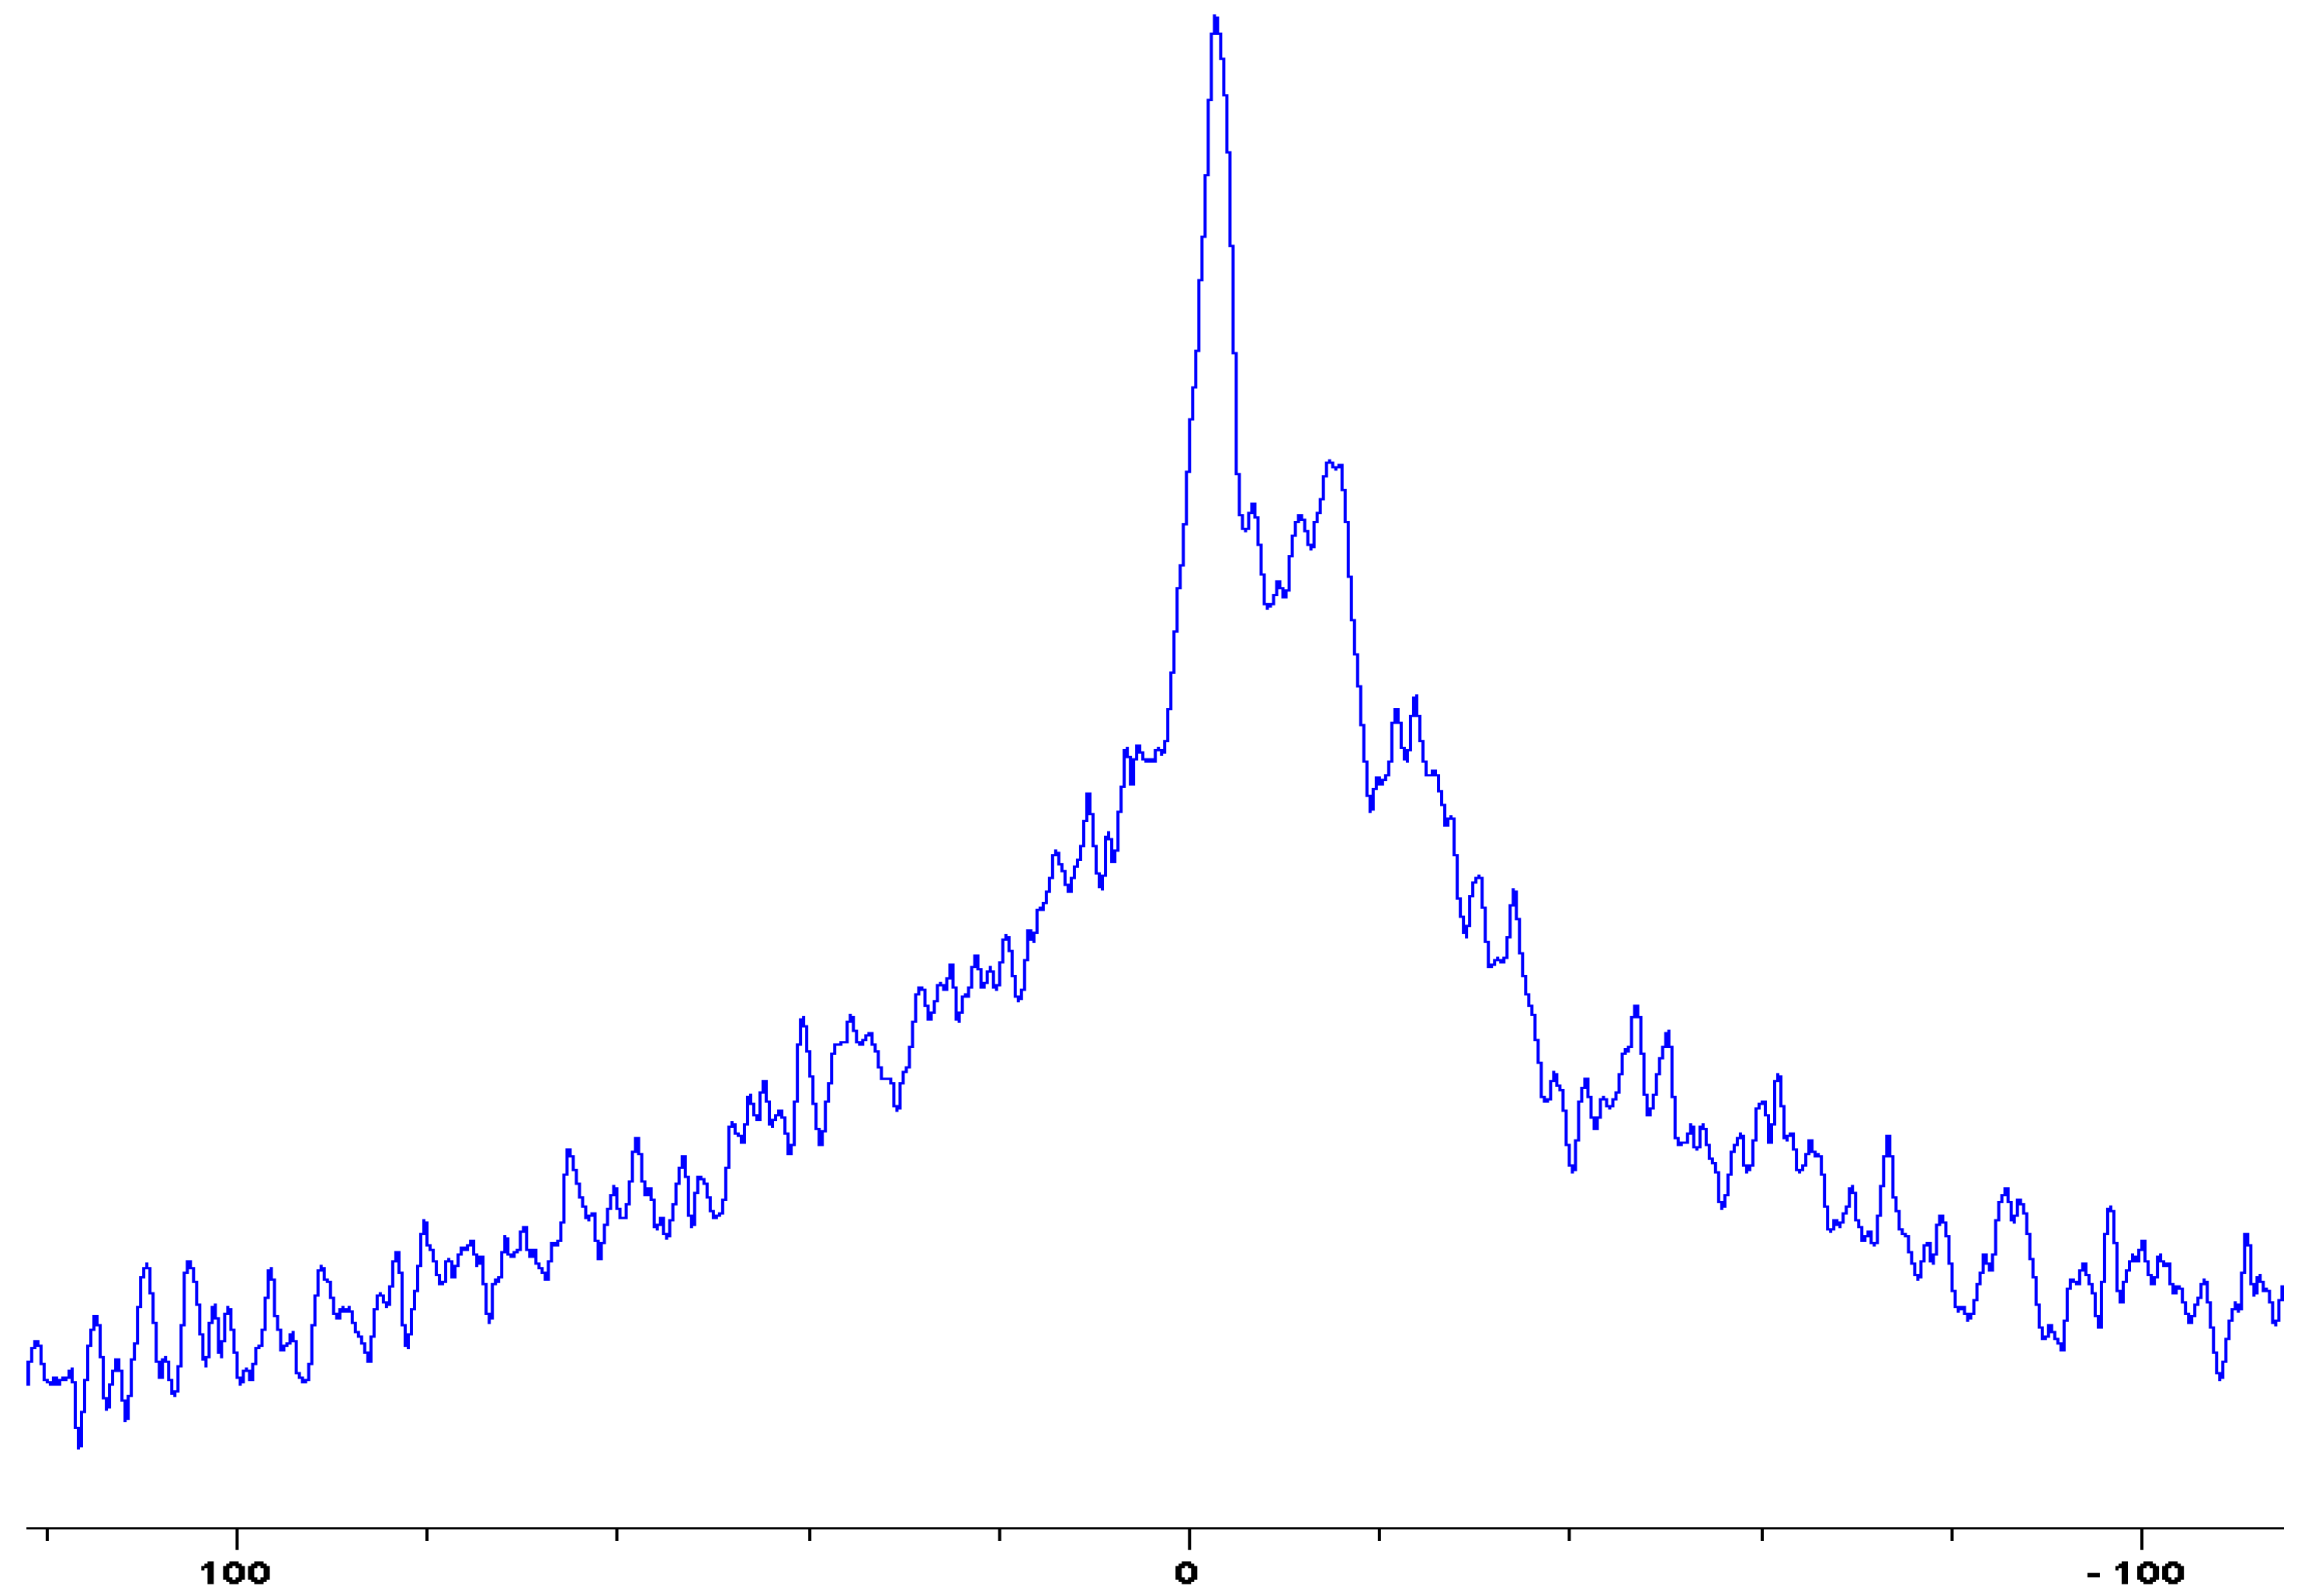
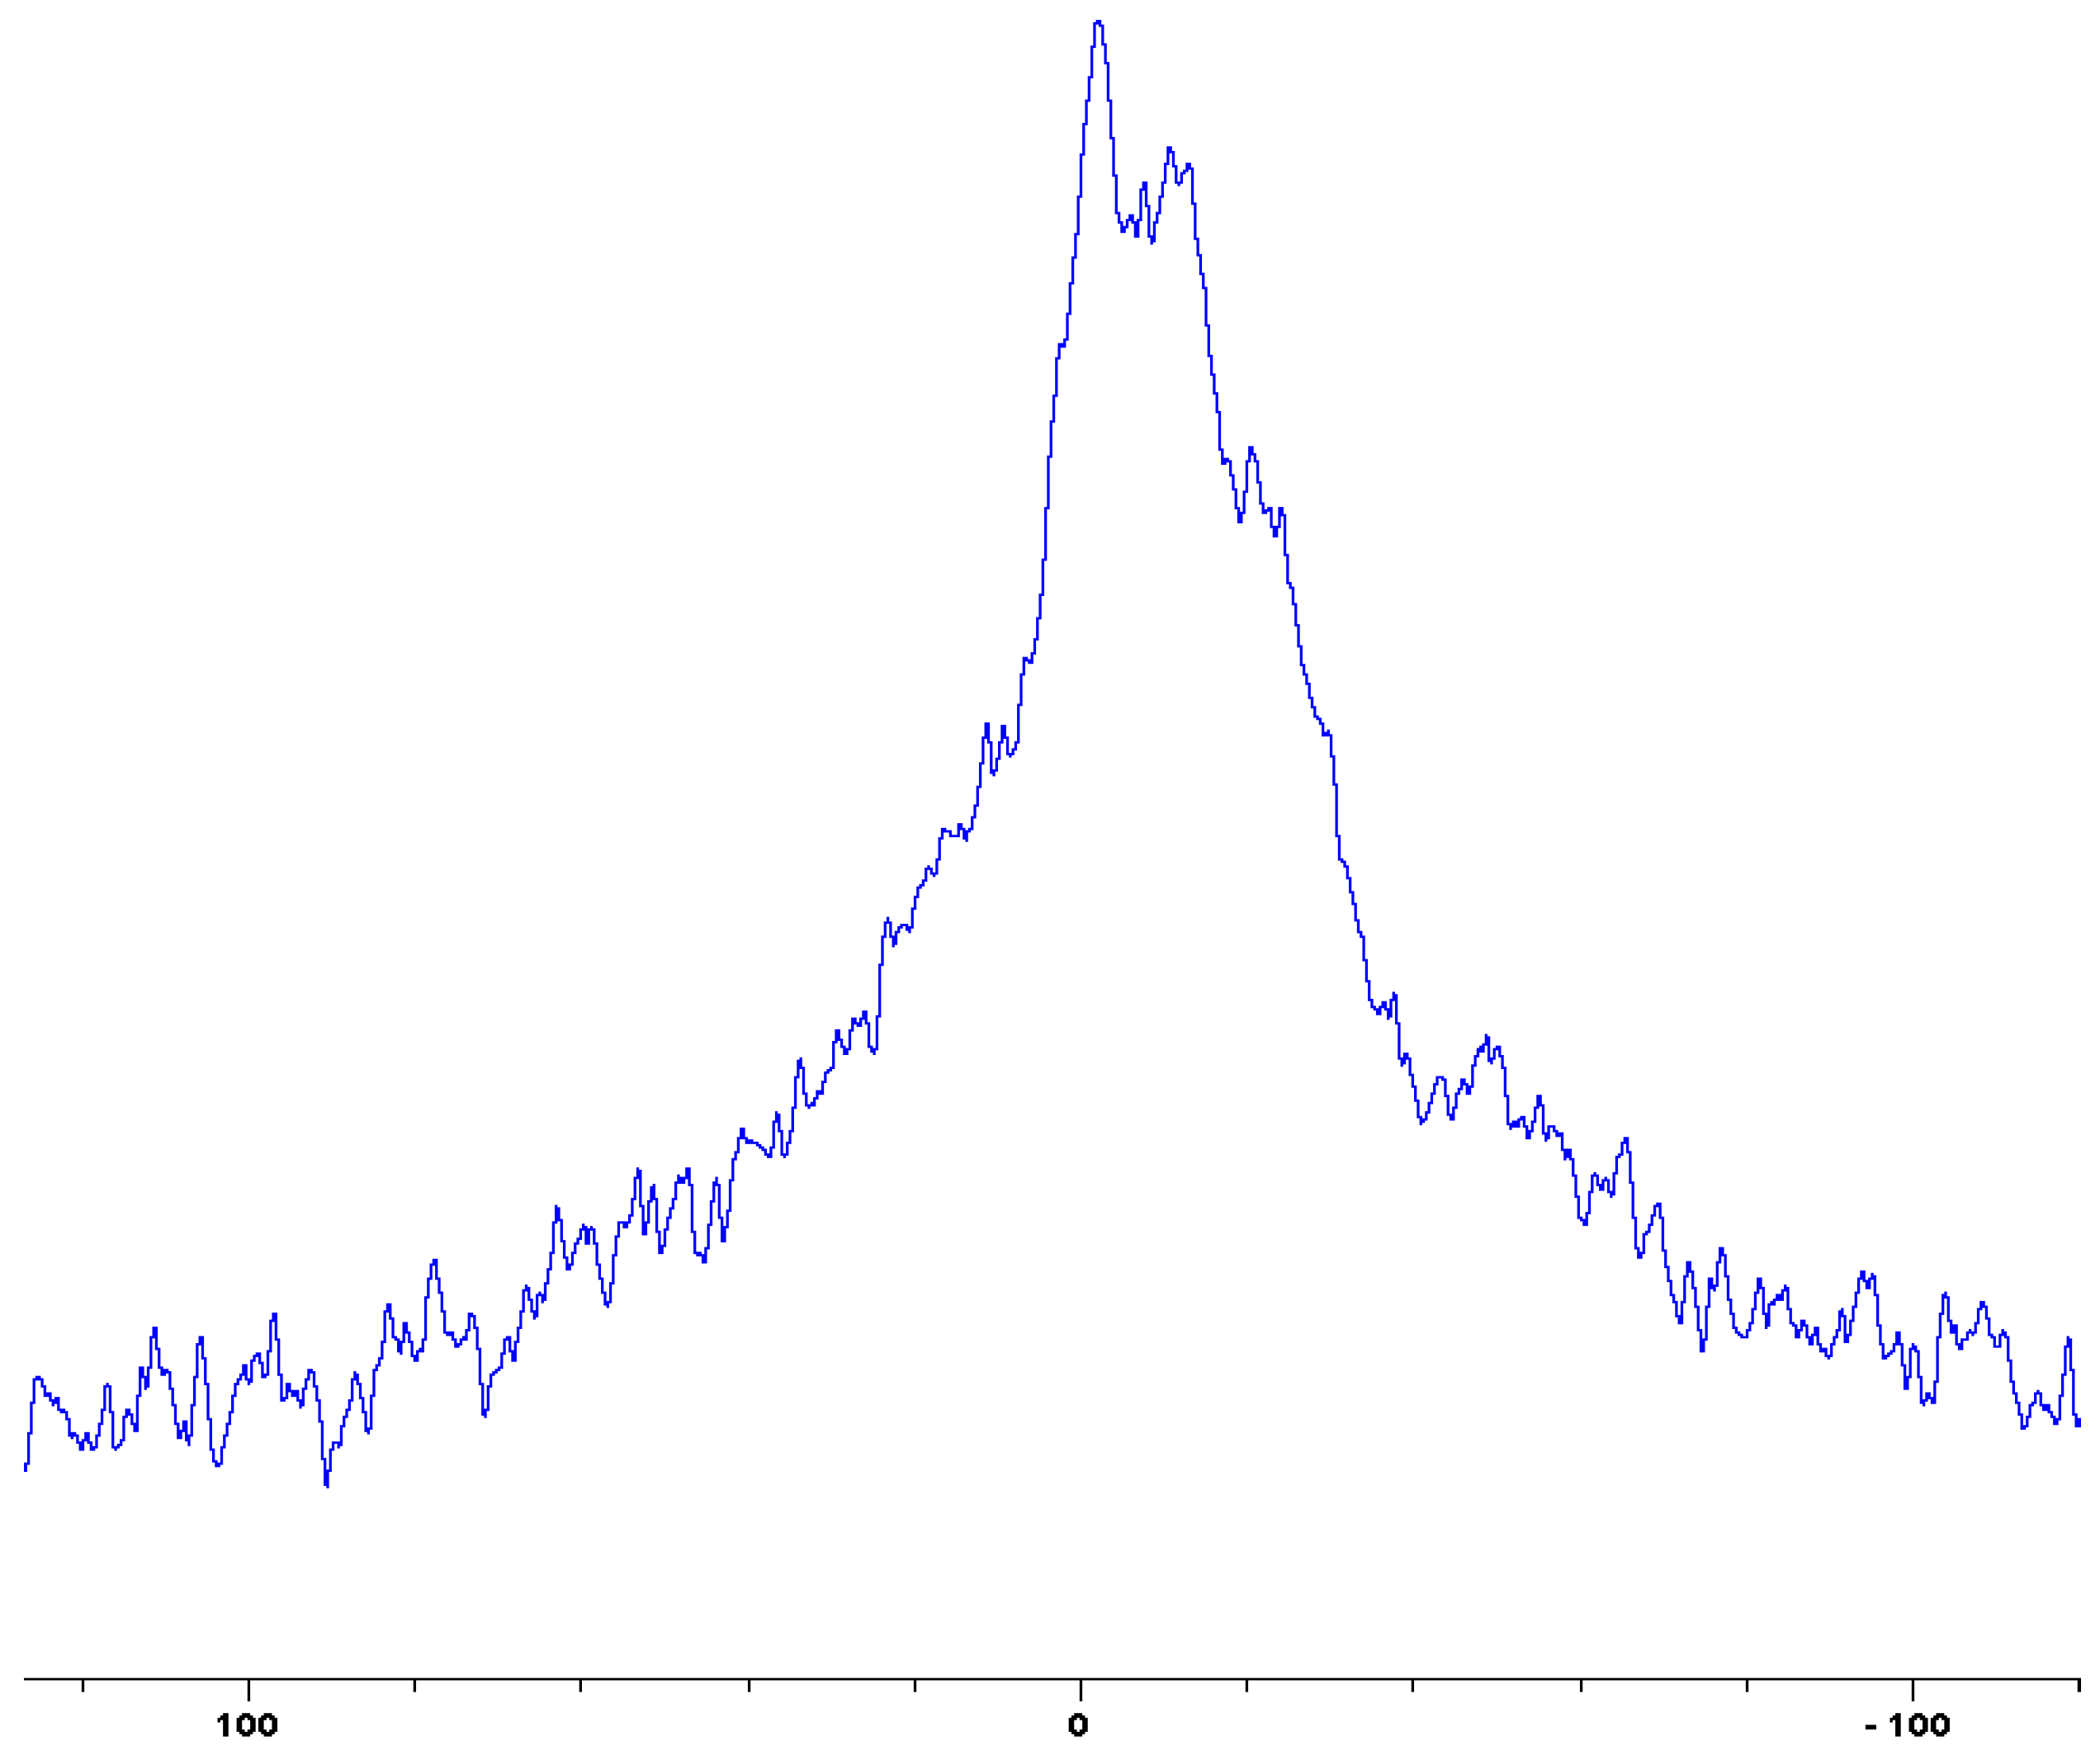
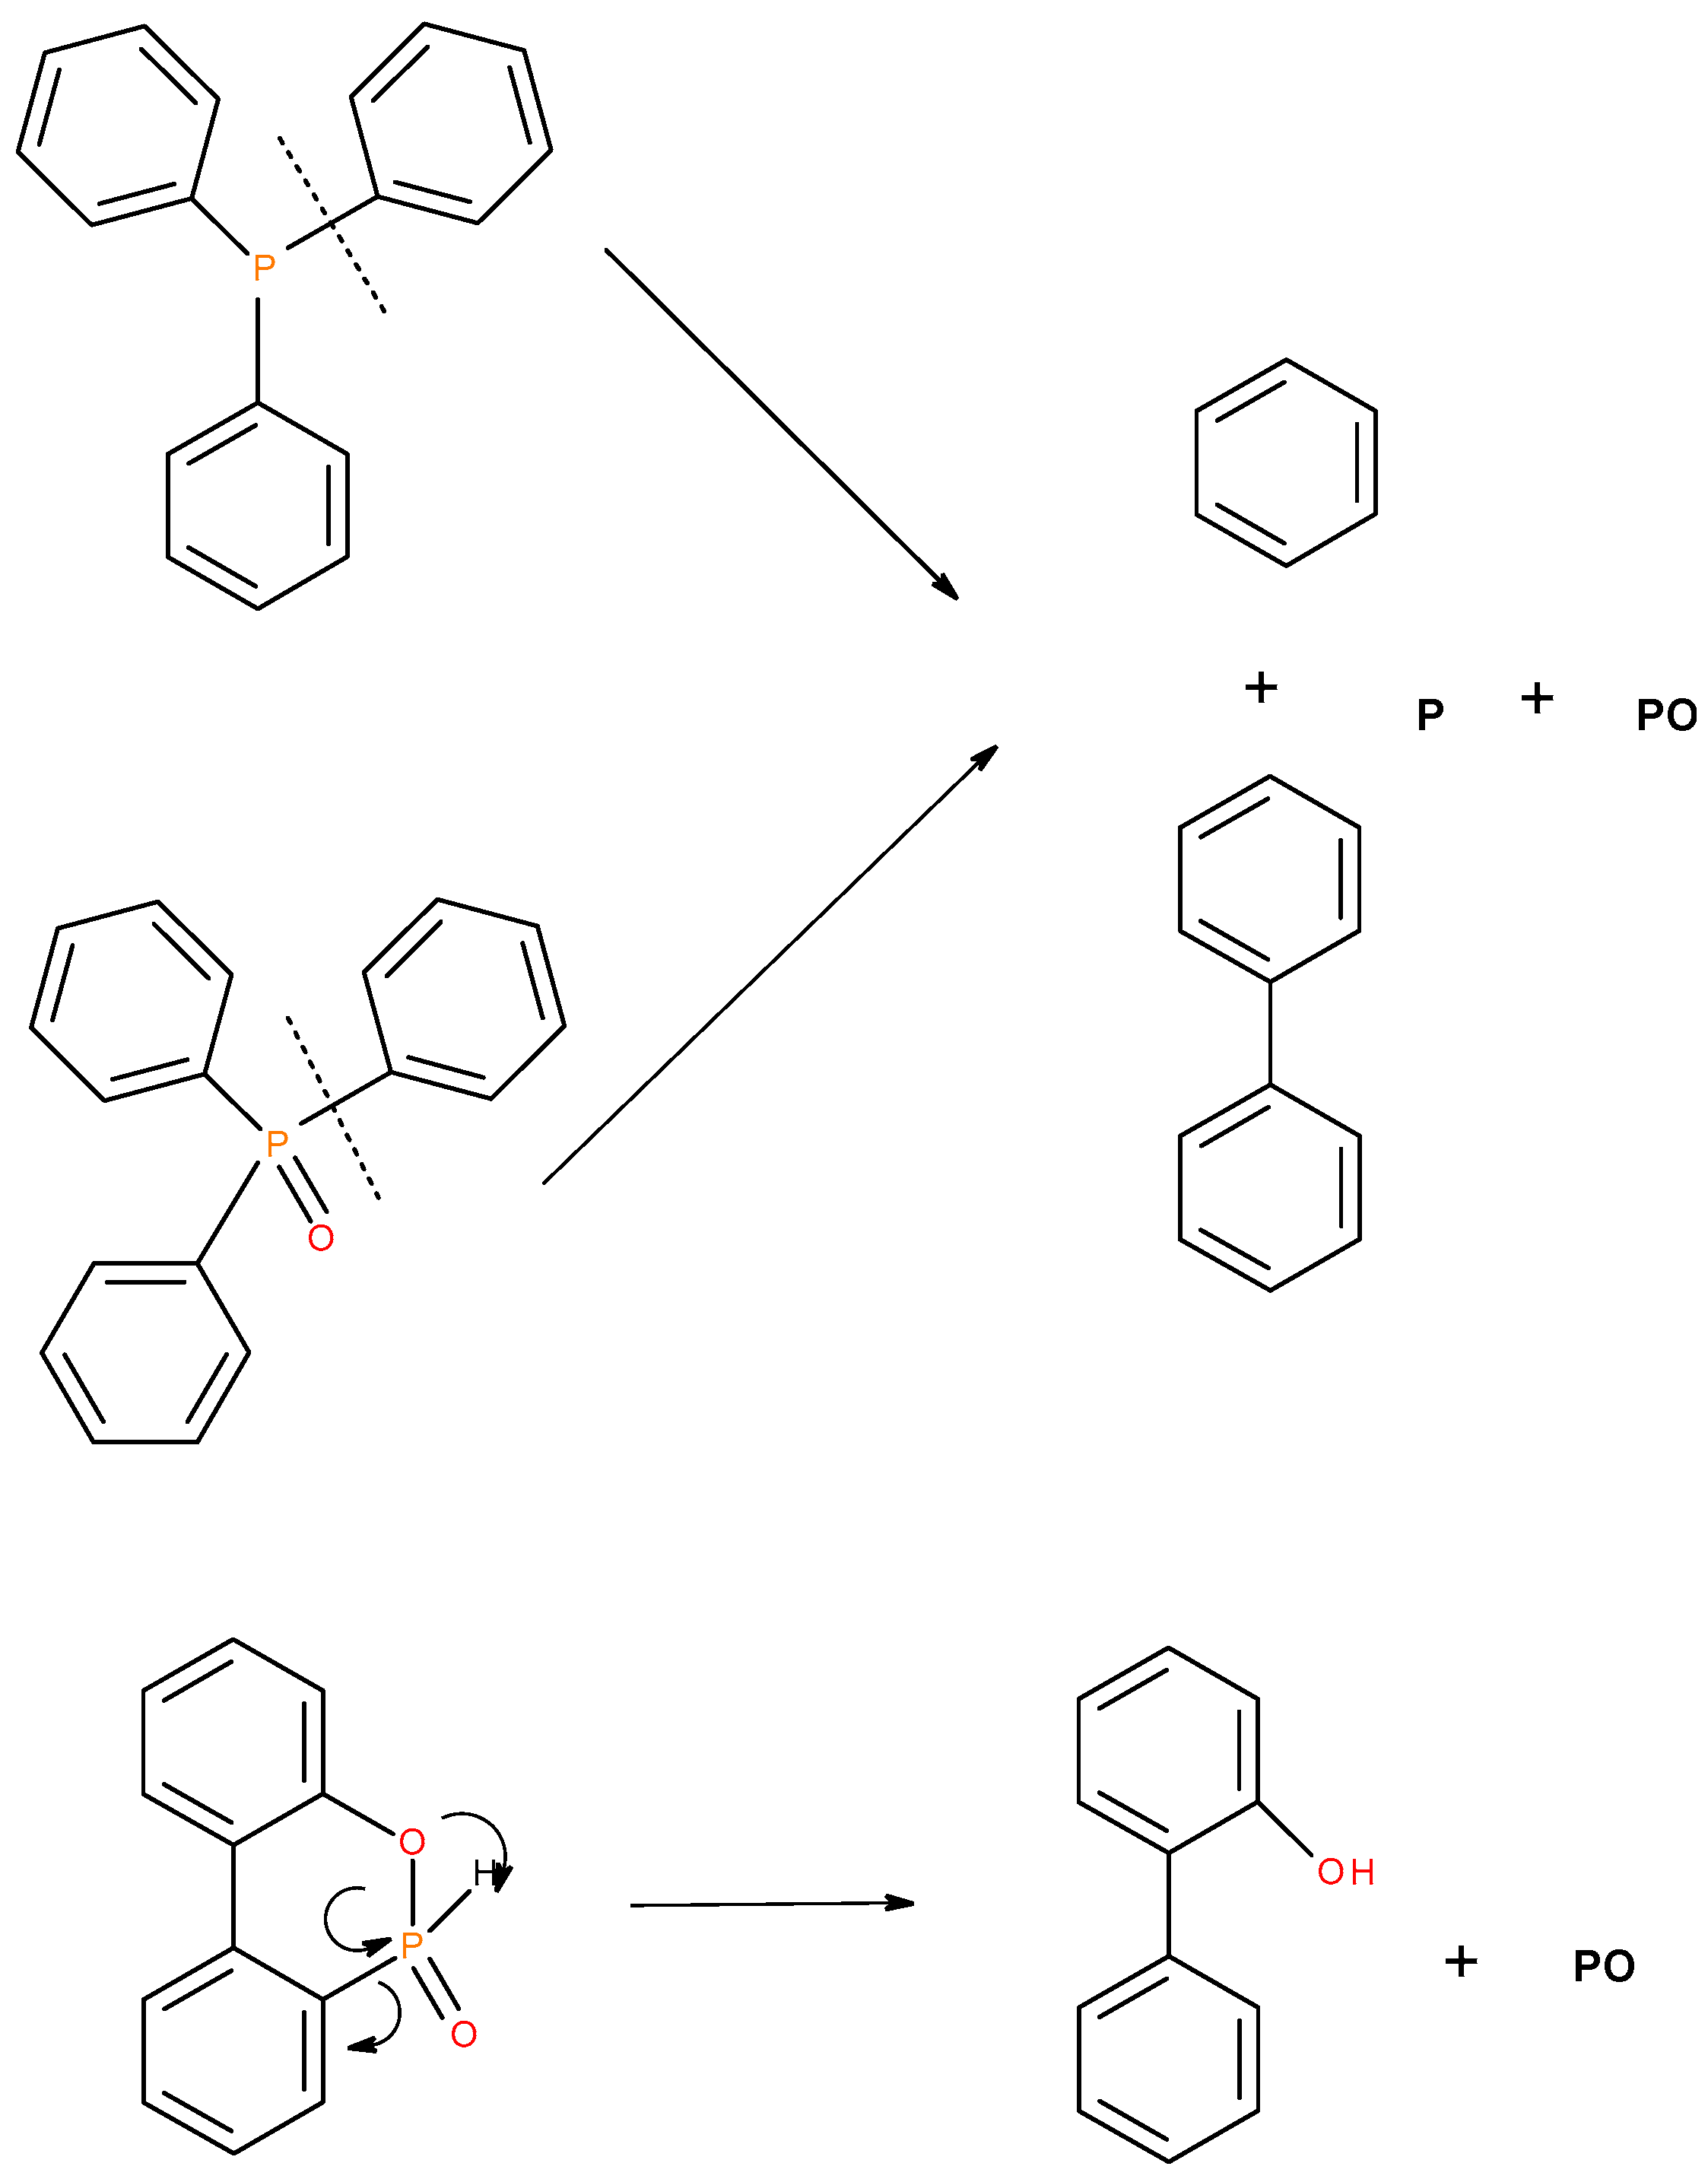
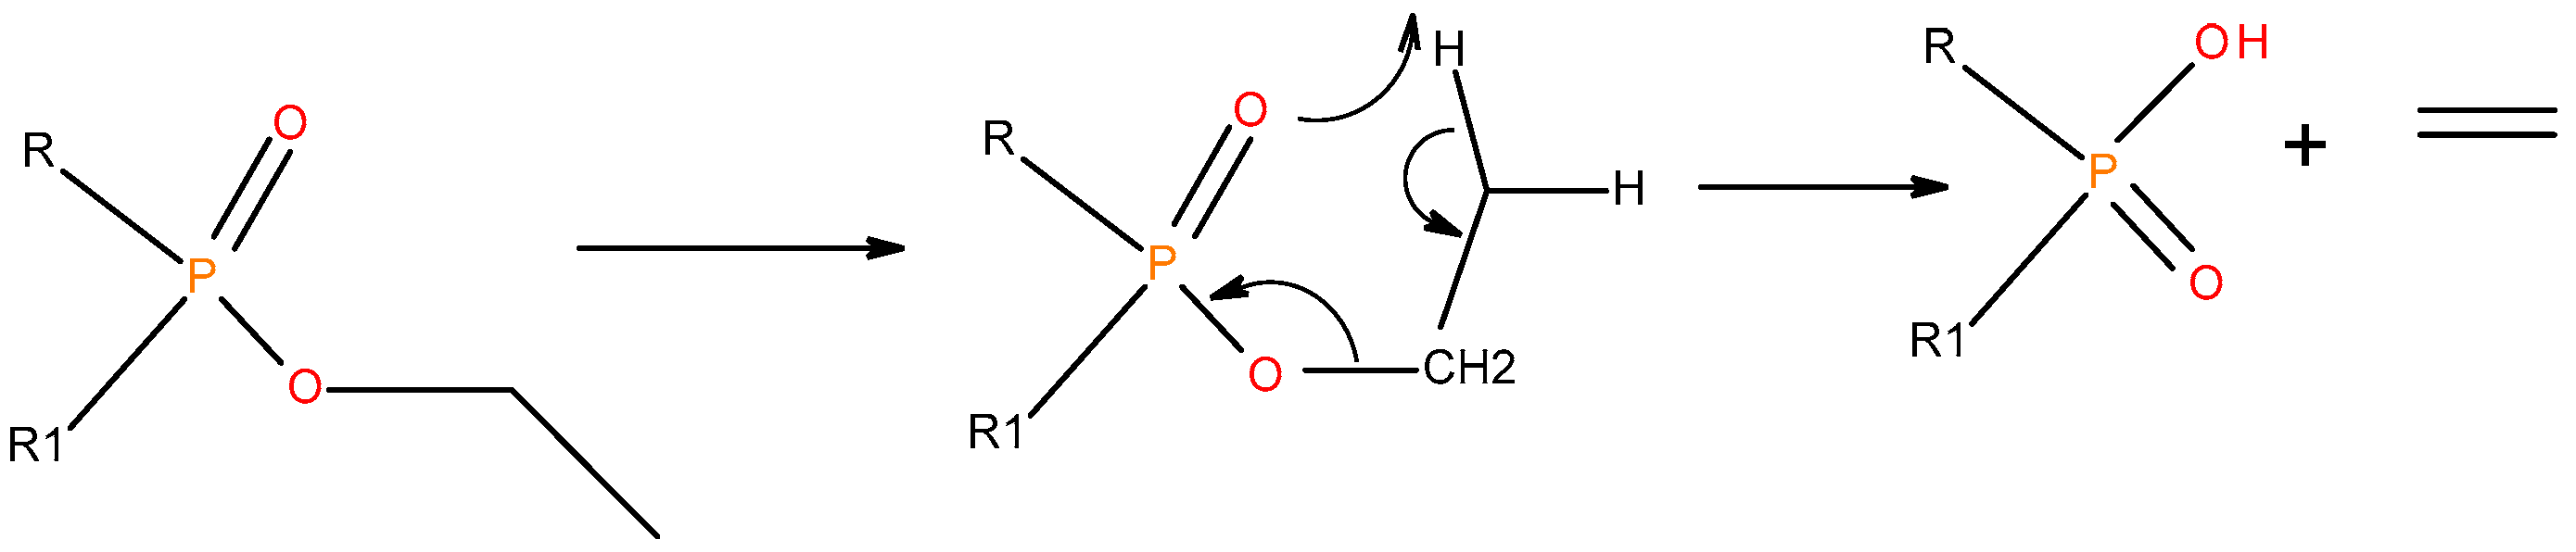
- The 31P-NMR spectra showed the ‘phosphorus’ acid species (∂ ~ 0 ppm), or oligomeric phosphate moieties (∂ ~ −10 ppm), are generated from the initial cracking/condensation reactions of AP, DEPi, TEPi, TEPa, DEPP and DEBP. However, cracking of TPP, TPPO and DOPO are bound to produce phenyl, or biphenyl species, and the phosphorus atom is likely to go into vapour phase either in the elemental form and/or as oxide species;
- The Raman spectra exhibited different degrees of graphitization, as revealed by the varying ratios of the areas corresponding to ordered and amorphous domains;
- From the complementary information that was gathered though vapour analyses, some probable mechanistic pathways that underpin the condensed- and gaseous-phase activities of the different additives were suggested
- In summary, it can be inferred that the organic solid additives (TPP, TPPO and DOPO) are predominantly active in the vapour phase, whereas the liquid additives (DEPi, TEPi, TEPa, DEPP and DEBP) can considered as more active in the condensed phase. The inorganic additive, AP, can assumed to be more active in the condense phase just the liquid additives.
Author Contributions
Funding
Acknowledgments
Conflicts of Interest
References
- Ramage, M.H.; Burridge, H.; Busse-Wicher, M.; Fereday, G.; Reynolds, T.; Shah, D.U.; Allwood, J. The wood from the trees: The use of timber in construction. Renew. Sustain. Energy Rev. 2017, 68, 333–359. [Google Scholar] [CrossRef]
- Buchanan, A.H.; Levine, S.B. Wood-based building materials and atmospheric carbon emissions. Environ. Sci. Policy 1999, 2, 427–437. [Google Scholar] [CrossRef]
- Freedman, B.; Stinson, G.; Lacoul, P. Carbon credits and the conservation of natural areas. Environ. Rev. 2009, 17, 1–19. [Google Scholar] [CrossRef]
- Aseeva, R.; Serkov, B.; Sivenkov, A. Fire Behavior and Fire Protection in Timber Buildings; Springer: Berlin/Heidelberg, Germany, 2014. [Google Scholar]
- Gaan, S.; Sun, G. Effect of phosphorus and nitrogen on flame retardant cellulose: A study of phosphorus compounds. J. Anal. Appl. Pyrolysis 2007, 78, 371–377. [Google Scholar] [CrossRef]
- Levchik, S.V.; Weil, E.D. A review of recent progress in phosphorus-based flame retardants. J. Fire Sci. 2006, 24, 345–364. [Google Scholar] [CrossRef]
- Joseph, P.; Tretsiakova-Mcnally, S. Reactive modifications of some chain-and step-growth polymers with phosphorus-containing compounds: Effects on flame retardance—A review. Polym. Adv. Technol. 2011, 22, 395–406. [Google Scholar] [CrossRef]
- Green, J. A review of phosphorus-containing flame retardants. J. Fire Sci. 1992, 10, 470–487. [Google Scholar] [CrossRef]
- Bhattacharya, A.K.; Thyagarajan, G. Michaelis-arbuzov rearrangement. Chem. Rev. 1981, 81, 415–430. [Google Scholar] [CrossRef]
- Thomas, A.; Joseph, P.; Moinuddin, K.; Zhu, H.; Tretsiakova-McNally, S. Thermal and Calorimetric Evaluations of Some Chemically Modified Carbohydrate-Based Substrates with Phosphorus-Containing Groups. Polymers 2020, 12, 588. [Google Scholar] [CrossRef] [Green Version]
- Thomas, A.; Moinuddin, K.; Zhu, H.; Joseph, P. Passive fire protection of wood using some bio-derived fire retardants. Fire Saf. J. 2020, 103074. [Google Scholar] [CrossRef]
- Ebdon, J.R.; Hunt, B.J.; Joseph, P.; Konkel, C.S.; Price, D.; Pyrah, K.; Lindsay, C.I. Thermal degradation and flame retardance in copolymers of methyl methacrylate with diethyl (methacryloyloxymethyl) phosphonate. Polym. Degrad. Stab. 2000, 70, 425–436. [Google Scholar] [CrossRef]
- Price, D.; Pyrah, K.; Hull, T.R.; Milnes, G.J.; Ebdon, J.R.; Hunt, B.J.; Joseph, P.; Konkel, C.S. Flame retarding poly(methyl methacrylate) with phosphorus-containing compounds: Comparison of an additive with a reactive approach. Polym. Degrad. Stab. 2001, 74, 441–447. [Google Scholar] [CrossRef]
- Wyman, P.; Crook, V.; Ebdon, J.; Hunt, B.; Joseph, P. Flame retarding effects of vinylbenzyl phosphonates in copolymers with acrylonitrile. Polym. Int. 2006, 55, 764–771. [Google Scholar] [CrossRef]
- Price, D.; Cunliffe, L.K.; Bullett, K.J.; Hull, T.R.; Milnes, G.J.; Ebdon, J.R.; Hunt, B.J.; Joseph, P. Thermal behaviour of covalently bonded phosphate and phosphonate flame retardant polystyrene systems. Polym. Degrad. Stab. 2007, 92, 1101–1114. [Google Scholar] [CrossRef]
- Salmeia, K.A.; Gaan, S. An overview of some recent advances in DOPO-derivatives: Chemistry and flame retardant applications. Polym. Degrad. Stab. 2015, 113, 119–134. [Google Scholar] [CrossRef]
- Schartel, B. Phosphorus-based flame retardancy mechanisms—Old hat or a starting point for future development? Materials 2010, 3, 4710–4745. [Google Scholar] [CrossRef] [Green Version]
- Joseph, P.; Tretsiakova-McNally, S.; McKenna, S. Characterization of cellulosic wastes and gasification products from chicken farms. Waste Manag. 2012, 32, 701–709. [Google Scholar] [CrossRef]
- Xu, L.; Lei, C.; Xu, R.; Zhang, X.; Zhang, F. Synergistic effect on flame retardancy and thermal behavior of polycarbonate filled with α-zirconium phosphate gel-silica. J. Appl. Polym. Sci. 2017, 134. [Google Scholar] [CrossRef]
- Suardana, N.P.G.; Ku, M.S.; Lim, J.K. Effects of diammonium phosphate on the flammability and mechanical properties of bio-composites. Mater. Des. 2011, 32, 1990–1999. [Google Scholar] [CrossRef]
- Joseph, P.; Tretsiakova-McNally, S. Combustion behaviours of chemically modified polyacrylonitrile polymers containing phosphorylamino groups. Polym. Degrad. Stab. 2012, 97, 2531–2535. [Google Scholar] [CrossRef]
- Weil, E.D.; Levchik, S.V.; Ravey, M.; Zhu, W. A survey of recent progress in phosphorous-based flame retardants and some mode of action studies. Phosphorous Sulfur Silicon Relat. Elem. 1999, 144, 17–20. [Google Scholar] [CrossRef]
- Velencoso, M.M.; Battig, A.; Markwart, J.C.; Schartel, B.; Wurm, F.R. Molecular Firefighting—How Modern Phosphorus Chemistry Can Help Solve the Challenge of Flame Retardancy. Angew. Chem. Int. Ed. 2018, 57, 10450–10467. [Google Scholar] [CrossRef] [PubMed] [Green Version]
- Rabe, S.; Chuenban, Y.; Schartel, B. Exploring the Modes of Action of Phosphorus-Based Flame Retardant in Polymeric Systems. Materials 2017, 10, 455. [Google Scholar] [CrossRef] [PubMed] [Green Version]
- Braun, U.; Balabanovich, A.I.; Schartel, B.; Knoll, U.; Artner, J.; Ciesielski, M.; Döring, M.; Perezm, R.; Sandler, J.K.W.; Altstädt, V.; et al. Influence of the oxidation state of phosphorus on the decomposition and fire behaviour of flame-retarded epoxy resin composites. Polymer 2006, 47, 8495–85605. [Google Scholar] [CrossRef]


| Sl. No. | Sample | wt % P in the Coating | Char Yield (wt %) from Cone | Theoretical Maximum of P Loading in the Char (wt %) | P Loading (ppm) | wt % P in the Char | wt % of P in the Gaseous Phase |
|---|---|---|---|---|---|---|---|
| 1 | Fish gelatin + AP | 4.10 | 21 | 19.52 | 36.6 | 7.82 | 59.93 |
| 2 | Fish gelatin + DOPO | 3.68 | 23 | 16.00 | 24.45 | 6.06 | 62.12 |
| 3 | Fish gelatin + TPP | 3.48 | 20 | 17.40 | 14.73 | 4.46 | 74.36 |
| 4 | Fish gelatin + TPPO | 3.43 | * --- | * --- | 11.23 | 3.50 | * --- |
| 5 | Fish gelatin + DEPi | 4.05 | 20 | 20.25 | 9.02 | 4.68 | 76.89 |
| 6 | Fish gelatin + TEPi | 3.97 | 21 | 18.90 | 3.84 | 2.83 | 85.02 |
| 7 | Fish gelatin + TEPa | 3.62 | 21 | 17.24 | 2.15 | 3.16 | 81.67 |
| 8 | Fish gelatin + DEPP | 3.85 | 19 | 20.26 | 4.63 | 2.04 | 89.93 |
| 9 | Fish gelatin + DEBP | 3.63 | 20 | 18.15 | 1.68 | 1.85 | 89.80 |
| Sl. No. | Additive | ∂ Value for 31P of the Additives * (Solution-State) | ∂ Value for 31P of the Char Residue # |
|---|---|---|---|
| 1 | AP | 0.02 | −2.3 (−13.4) |
| 2 | TPP | −7.10 | 2.9 (−8.5) |
| 3 | TPPO | 27.6 | 2.9 (−8.5) |
| 4 | DOPO | 16.7 | −1.3 (−9.8) |
| 5 | DEPi | 7.30 | −2.3 (−13.1) |
| 6 | TEPi | 7.30 | −3.3 (−15.0) |
| 7 | TEPa | −1.00 | −2.6 (−10.8) |
| 8 | DEPP | 32.2 | −1.3 (−9.1) |
| 9 | DEBP | 26.4 | −1.0 (−10.8) |
| Sl. No. | Char Residue | Intensity of the G Band (IG) | Intensity of the D Band (ID) | Ratio (IG/ID) |
|---|---|---|---|---|
| 1 | Unprotected wood | 18,030 | 24,830 | 0.73 |
| 2 | Fish gelatin + AP | 21,850 | 30,360 | 0.72 |
| 3 | Fish gelatin + TPP | 476,979 | 1,099,132 | 0.43 |
| 4 | Fish gelatin + TPPO | 450,413 | 343,278 | 1.32 |
| 5 | Fish gelatin + DOPO | 648,452 | 1,030,772 | 0.63 |
| 6 | Fish gelatin + DEPi | 580,753 | 1,002,797 | 0.58 |
| 7 | Fish gelatin + TEPi | 515,705 | 954,779 | 0.54 |
| 8 | Fish gelatin + TEPa | 570,280 | 943,631 | 0.60 |
| 9 | Fish gelatin + DEPP | 402,813 | 1,238,529 | 0.33 |
| 10 | Fish gelatin + DEBP | 846,410 | 913,333 | 0.93 |
| Sample | Chemical Structures | Retention Time (min) | Molar Mass | [M]+. | [M ± 1]+. | [M] (100%) | Other Predominant Species/Remarks |
|---|---|---|---|---|---|---|---|
| DEPi |  | 4.7 | 138 | --- | 139 | 83 | 111 |
| TEPi |  | 3.9 | 166 | 166 | --- | 65 | 139 |
| TEPa |  | 5.2 | 182 | --- | 183 | 99 | 127 |
| DEPP |  | 5.0 | 180 | --- | --- | 125 | 43 |
| DEBP |  | 8.0 | 228 | --- | --- | 91 | 118 |
| Sample (Chemical Name) | Chemical Structures | mp/bp (°C) | Pyrolysis Temp. (°C) | Retention Time (min) | Molar Mass | [M]+ ± 1 |
|---|---|---|---|---|---|---|
| TPP |  | 80/377 | 288 | 18.8 | 263 | 262 |
| TPPO |  | 154–158/360 | 340 | 21.4 | 278 | 277 |
| DOPO |  | 116–120/200 (at 1mm Hg) | 381 | 18.8 * 15.7/ # 13.1 | 216 | 216 |
© 2020 by the authors. Licensee MDPI, Basel, Switzerland. This article is an open access article distributed under the terms and conditions of the Creative Commons Attribution (CC BY) license (http://creativecommons.org/licenses/by/4.0/).
Share and Cite
Thomas, A.; Arun, M.; Moinuddin, K.; Joseph, P. Mechanistic Aspects of Condensed- and Gaseous-Phase Activities of Some Phosphorus-Containing Fire Retardants. Polymers 2020, 12, 1801. https://doi.org/10.3390/polym12081801
Thomas A, Arun M, Moinuddin K, Joseph P. Mechanistic Aspects of Condensed- and Gaseous-Phase Activities of Some Phosphorus-Containing Fire Retardants. Polymers. 2020; 12(8):1801. https://doi.org/10.3390/polym12081801
Chicago/Turabian StyleThomas, Ananya, Malavika Arun, Khalid Moinuddin, and Paul Joseph. 2020. "Mechanistic Aspects of Condensed- and Gaseous-Phase Activities of Some Phosphorus-Containing Fire Retardants" Polymers 12, no. 8: 1801. https://doi.org/10.3390/polym12081801