3.1. Mechanical Behavior
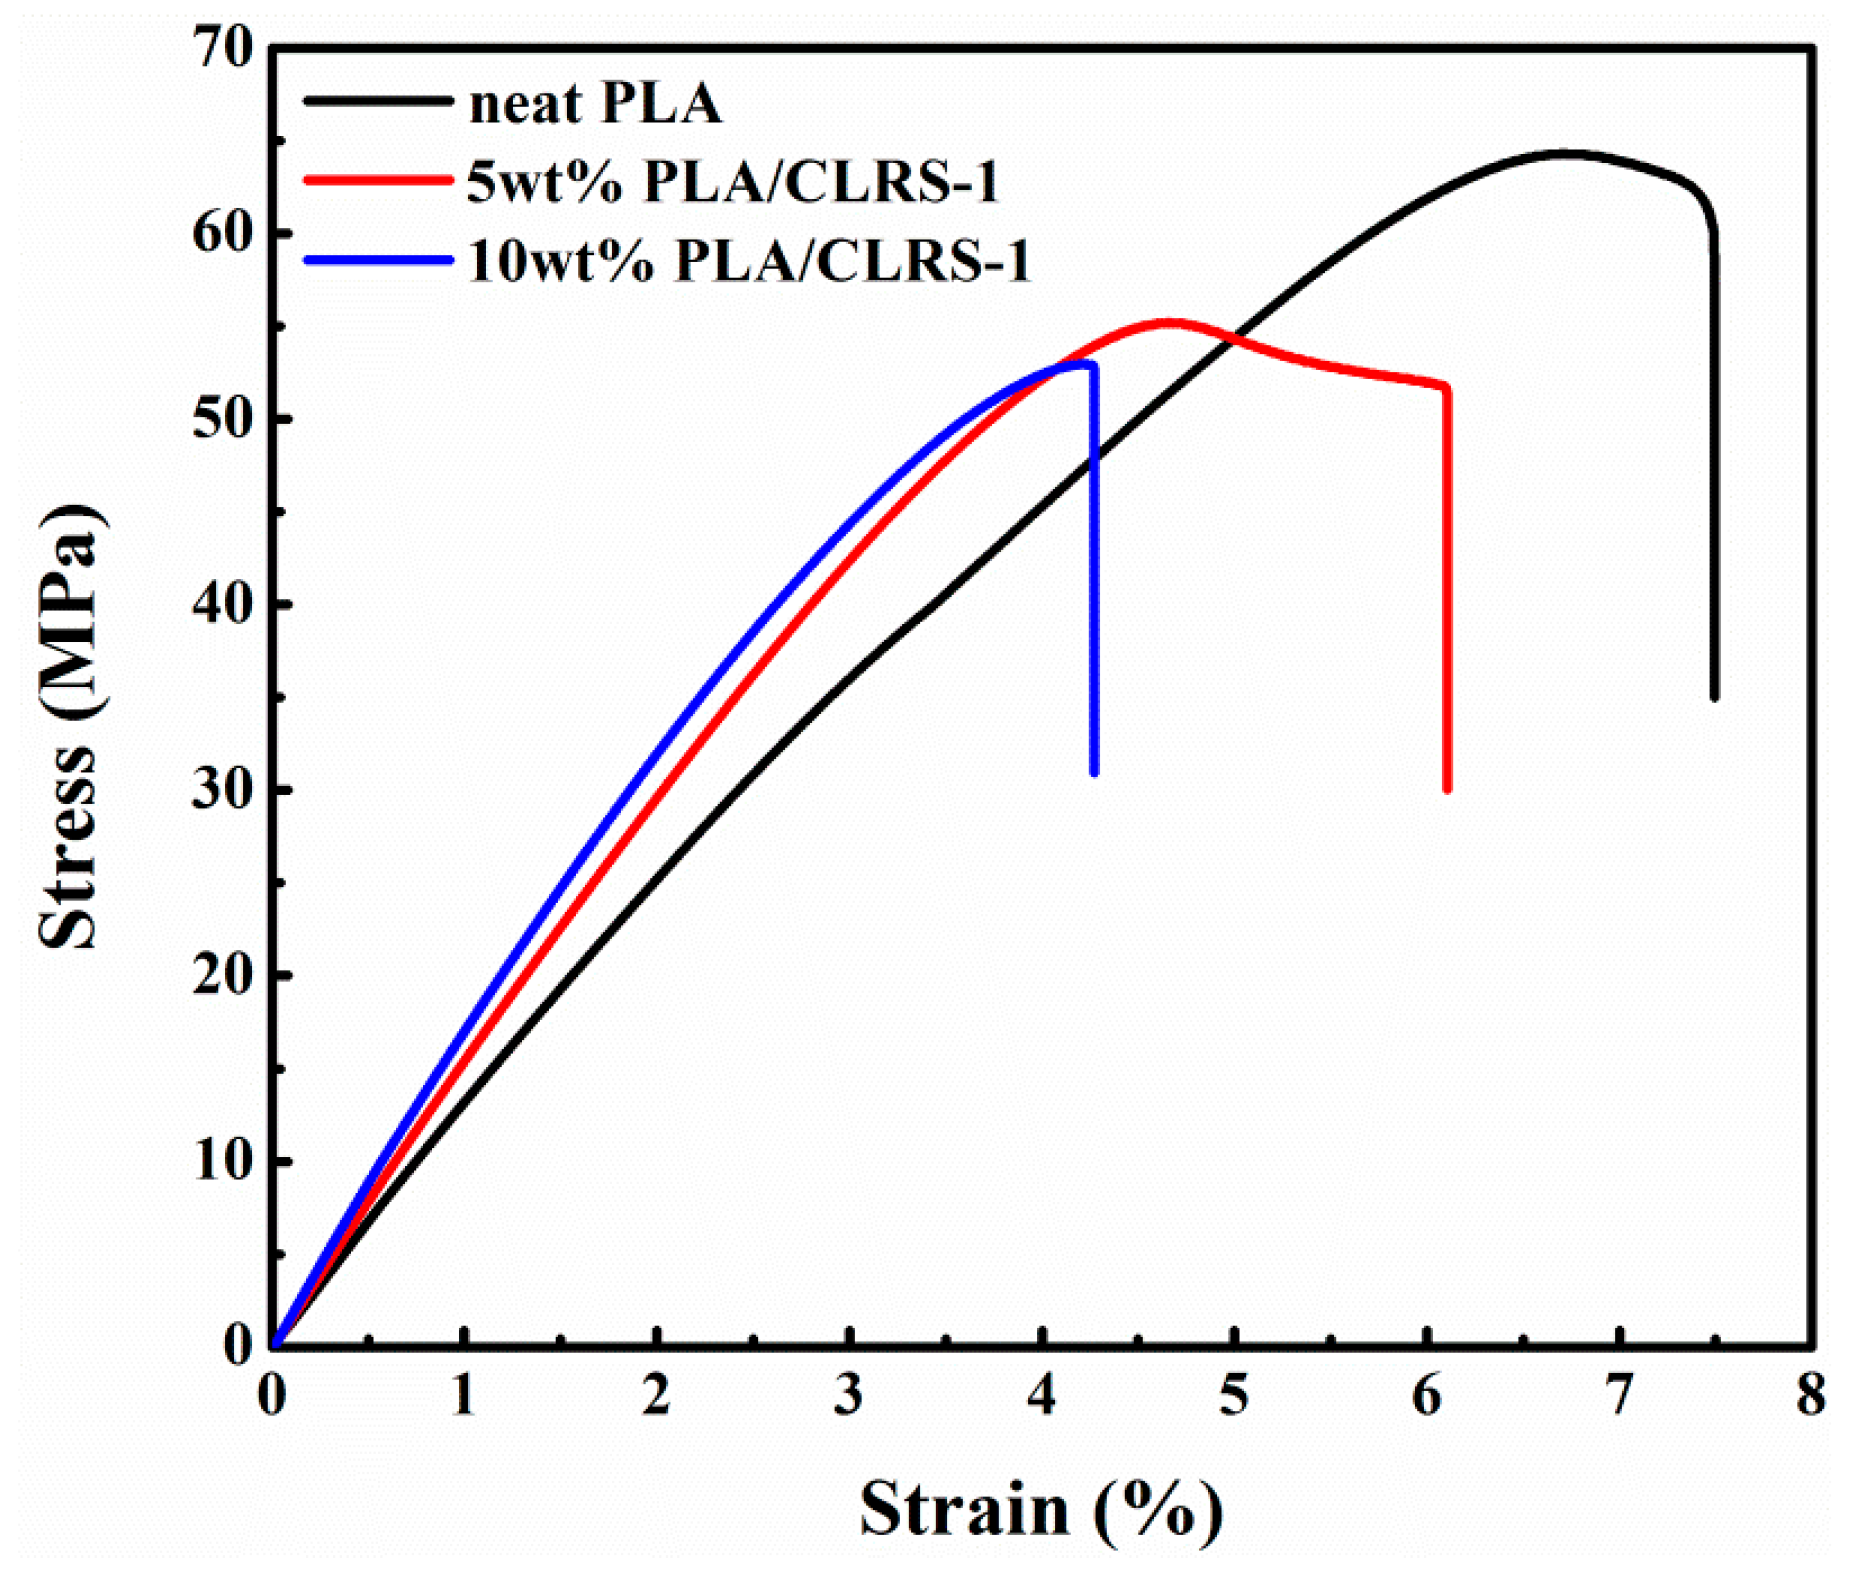
Figure 1 presents the typical stress–strain curves of the 3D printed PLA and PLA/CLRS-1 composites, where the tensile strength and the amount of elongation at break are summarized in
Table 2. Before fracturing, all 3D printed specimens underwent linear elastic deformation ranging from 4% to 8%, but thereafter, the specimens behaved differently. The 3D printed specimens made of PLA and PLA/CLRS-1 composites with 5 wt.% CLRS-1 yielded after the maximum stress (64.3 and 55.2 MPa) before fracturing. Meanwhile, the PLA/CLRS-1 composite specimens containing 10 wt.% CLRS-1 exhibited little plastic deformation prior to fracturing, although brittle fracture patterns were observed. These results showed that the addition and content of CLRS-1 had a great influence on the properties and fracture modes of the printed specimens.
The tensile properties of the printed PLA/CLRS-1 composite specimens were compared to those of the neat PLA in terms of the relative difference (% R.D.). The ultimate tensile strength of the 5 wt.% and 10 wt.% CLRS-1 samples was reduced by 14.2% and 17.6%, respectively, compared to that of neat PLA. Obviously, all printed PLA/CLRS-1 specimens presented a higher elasticity modulus compared to that of neat PLA (
Figure 1). The higher elastic modulus was achieved in printed PLA/CLRS-1 composites, which agrees with the results of Paspali’s work regarding the incorporation of nanoclay into PLA [
35]. The amount of elongation at break of the PLA/CLRS-1 composites also presented similar characteristics as seen for the tensile strength.
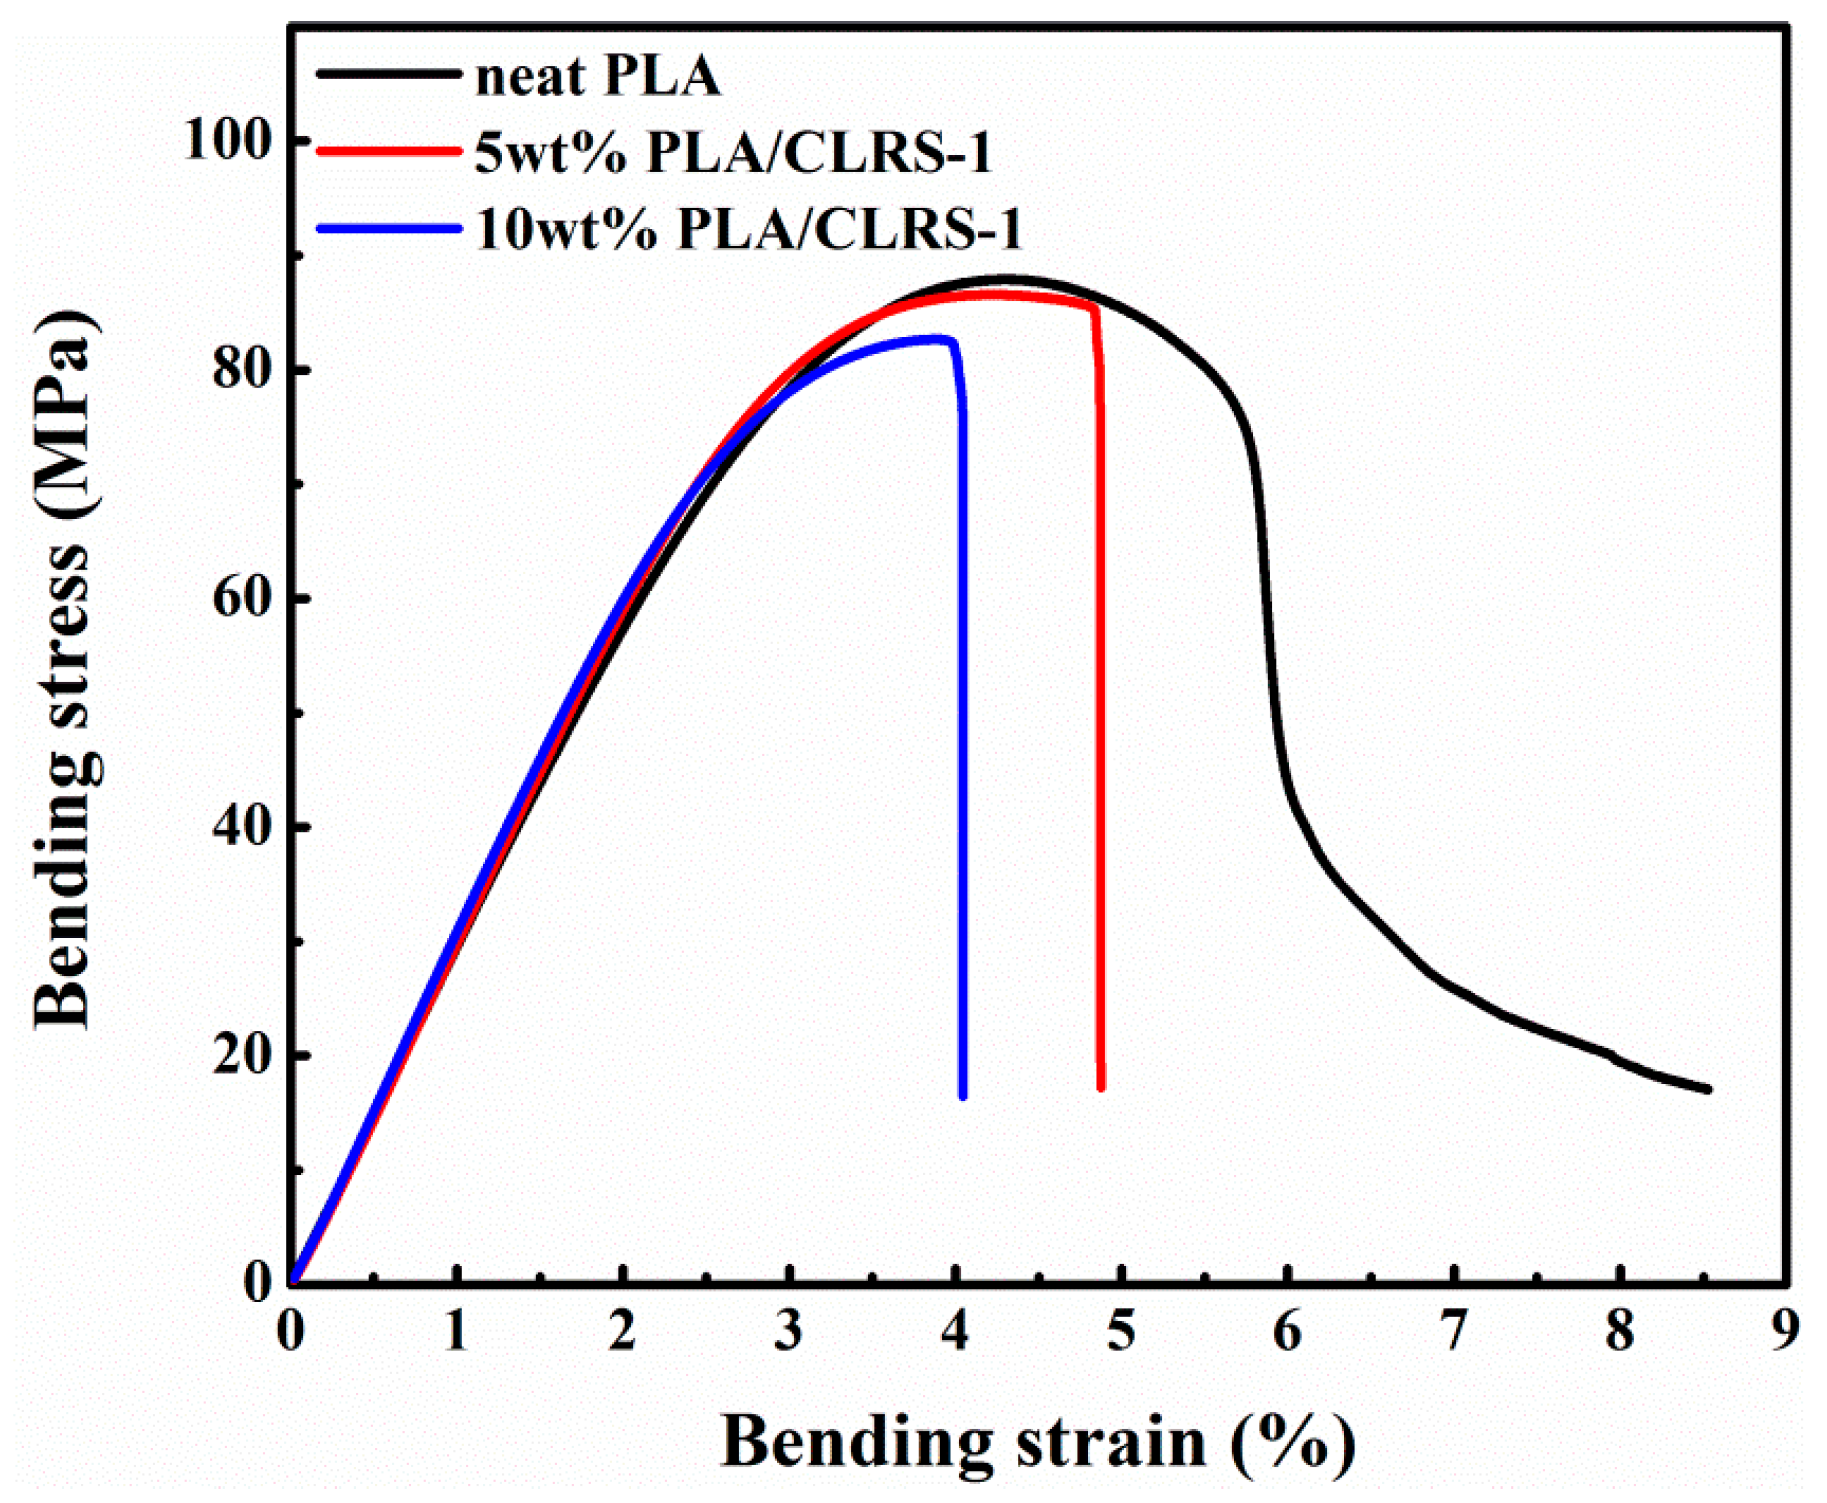
Figure 2 presents the typical stress–strain curves of the printed specimens, obtained from the three-point bending tests, where the detailed data are summarized in
Table 3. All printed specimens exhibited linear elastic deformation before the yield point. The neat PLA did not break during the test, and showed good toughness, while the 5 wt.% and 10 wt.% PLA/CLRS-1 composites fractured after yielding. The trends seen in bending test results were similar to those from the tensile tests, such as an increased modulus, and reduced strength and elongation. With an increased content of CLRS-1, the printed PLA/CLRS-1 composites could also achieve a high bending strength, as well as the neat PLA. Moreover, the bending modulus of the printed PLA/CLRS-1 composites increased due to the incorporation of the CLRS-1. This phenomenon indicated the good dispersity of CLRS-1 in the PLA matrix, and the CLRS-1 simulant in PLA. In comparison with previous research, 10 wt.% of CLRS-1 into PLA only shows a 7.39% reduction in the bending strength of printed composites, compared to a 21.1% reduction in PLA composites with 5 wt.% nanoclay [
35]. This phenomenon lays the foundation for the use of PLA/CLRS-1 composites. In the following sections, further studies are performed to understand the mechanical mechanism of lunar regolith simulant in 3D printed PLA.
3.2. Mechanism of the Mechanical Behavior of PLA/CLRS-1 Composite Materials
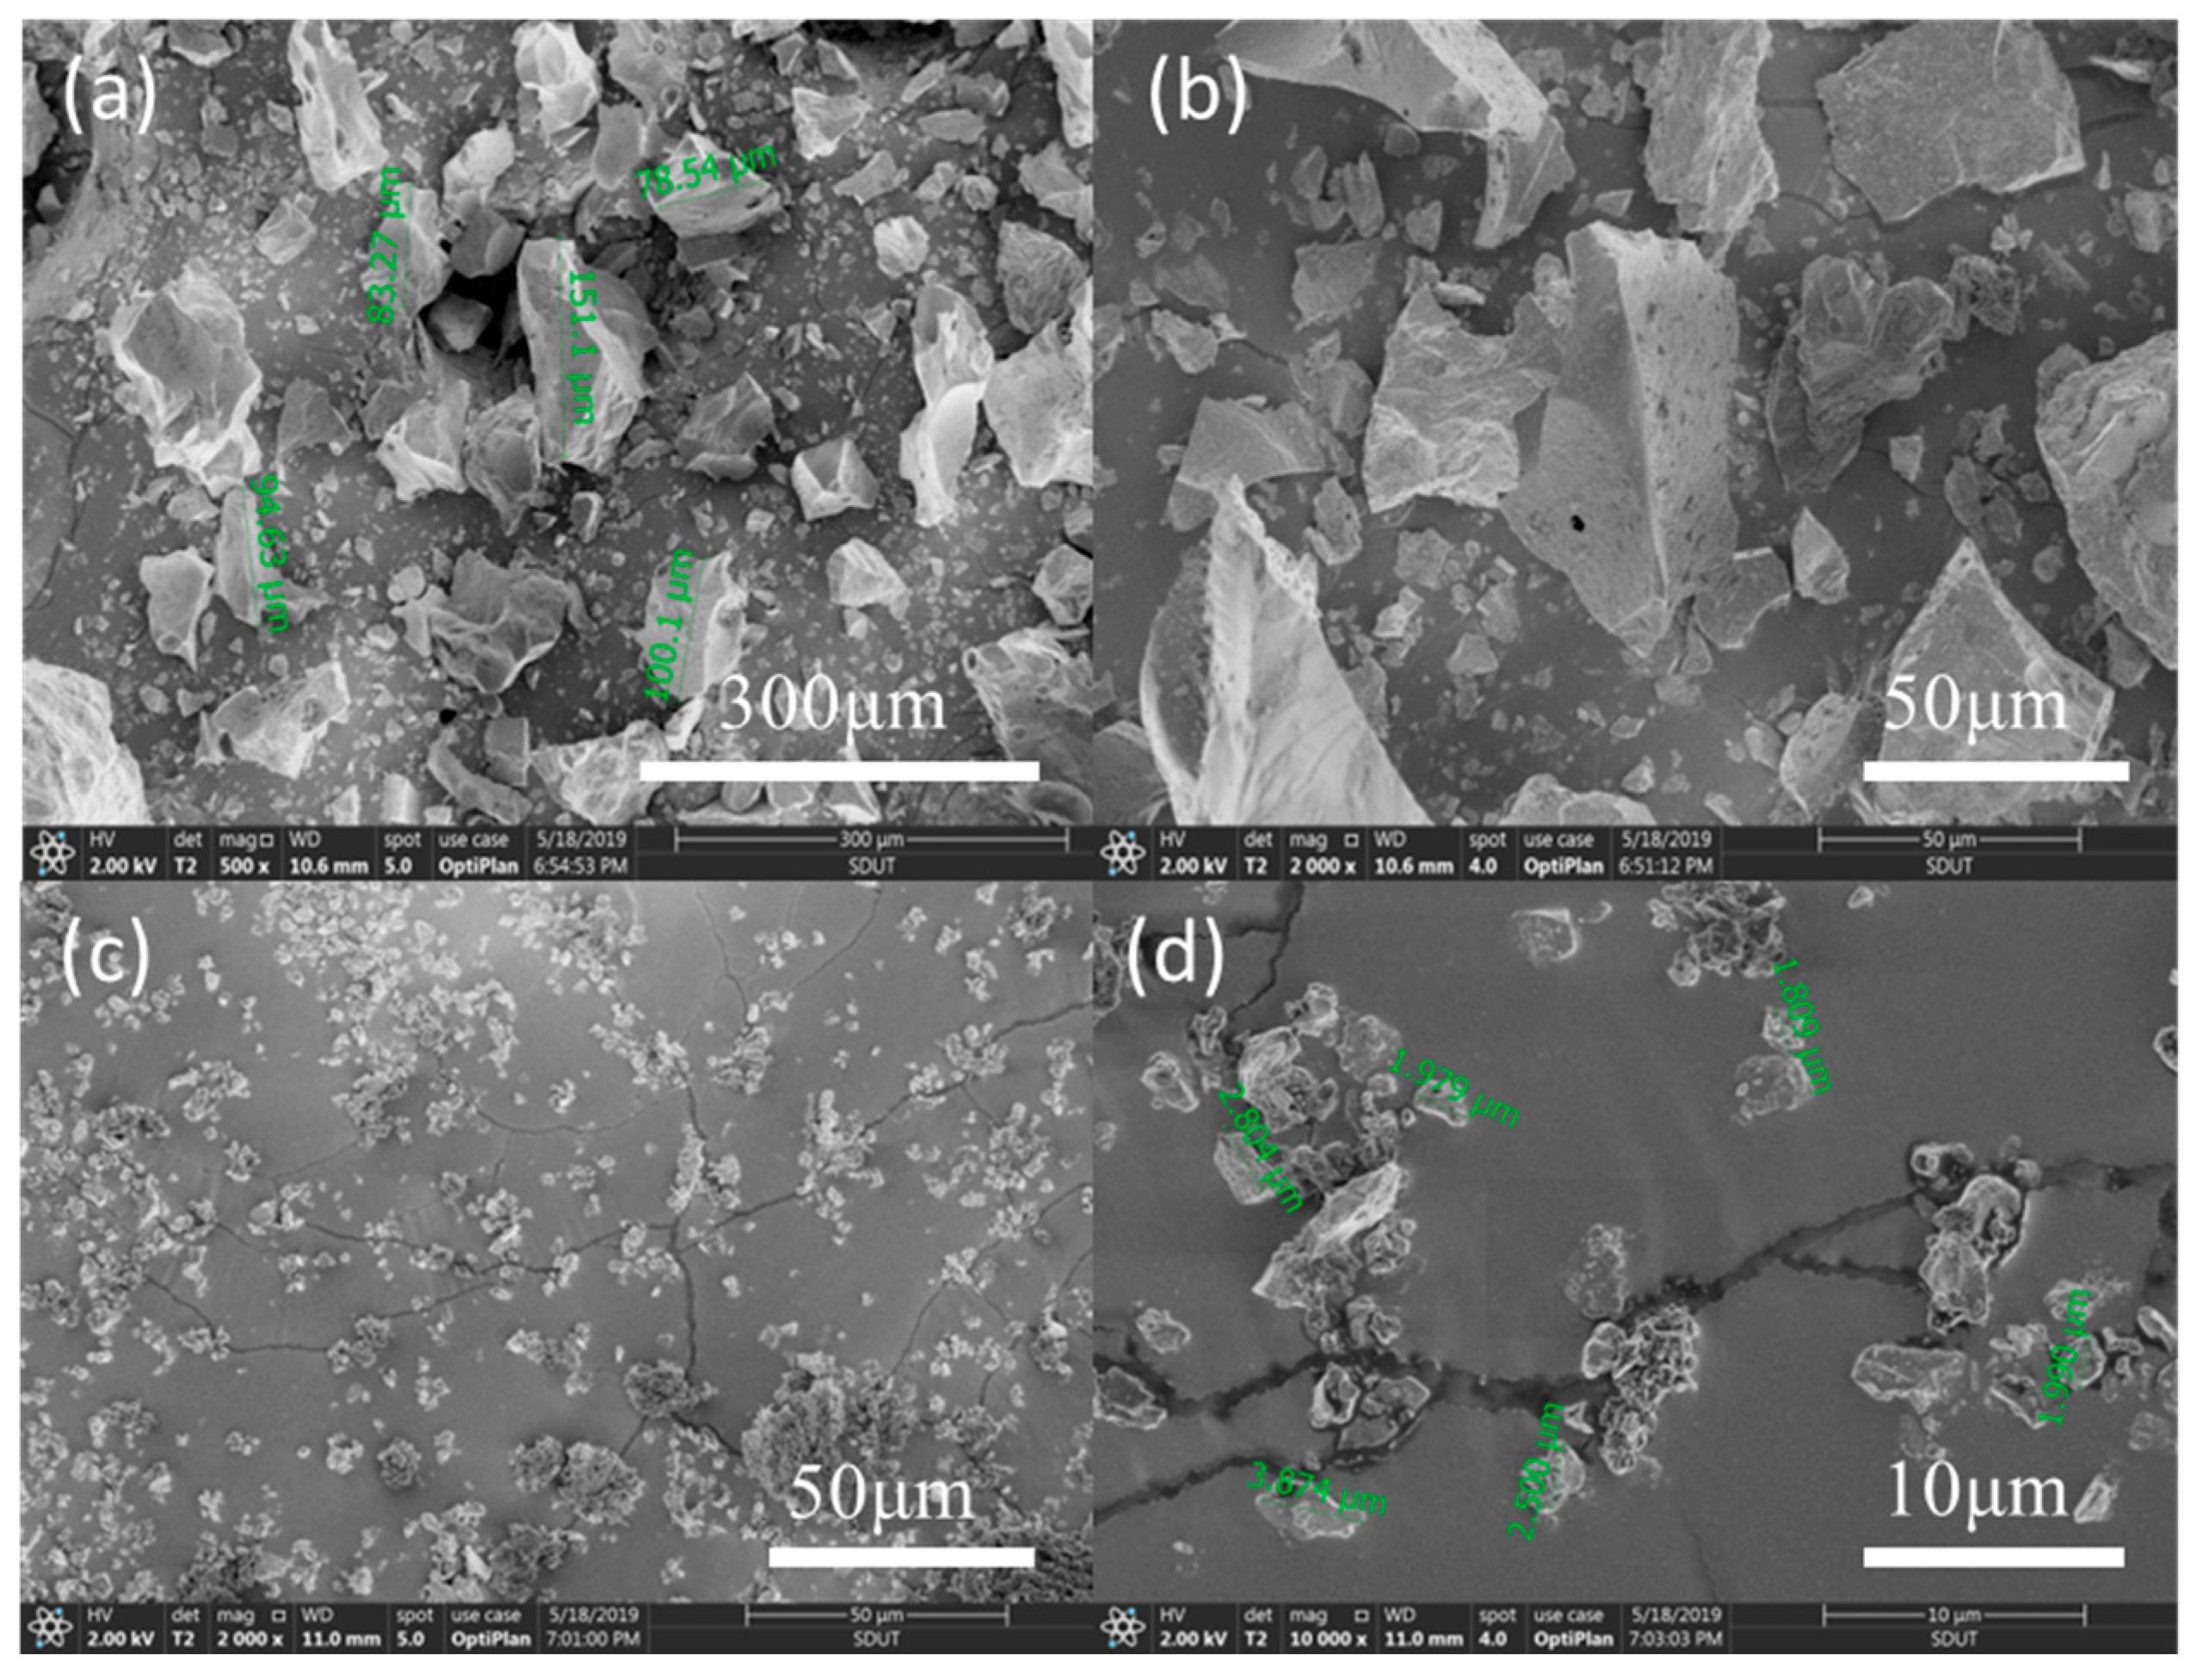
The morphologies of CLRS-1 before and after processing are shown in
Figure 3. Pristine lunar regolith, before ball milling, exhibited irregular jagged contours, with a particle size of approximately 100 μm. Meanwhile, the milled CLRS-1 particles were smoother, with fewer contours, and the average particle size was ~2.5 μm. These images demonstrated that the ball milling process could significantly reduce the size of the lunar regolith powder, so that it could be mixed with the PLA better.
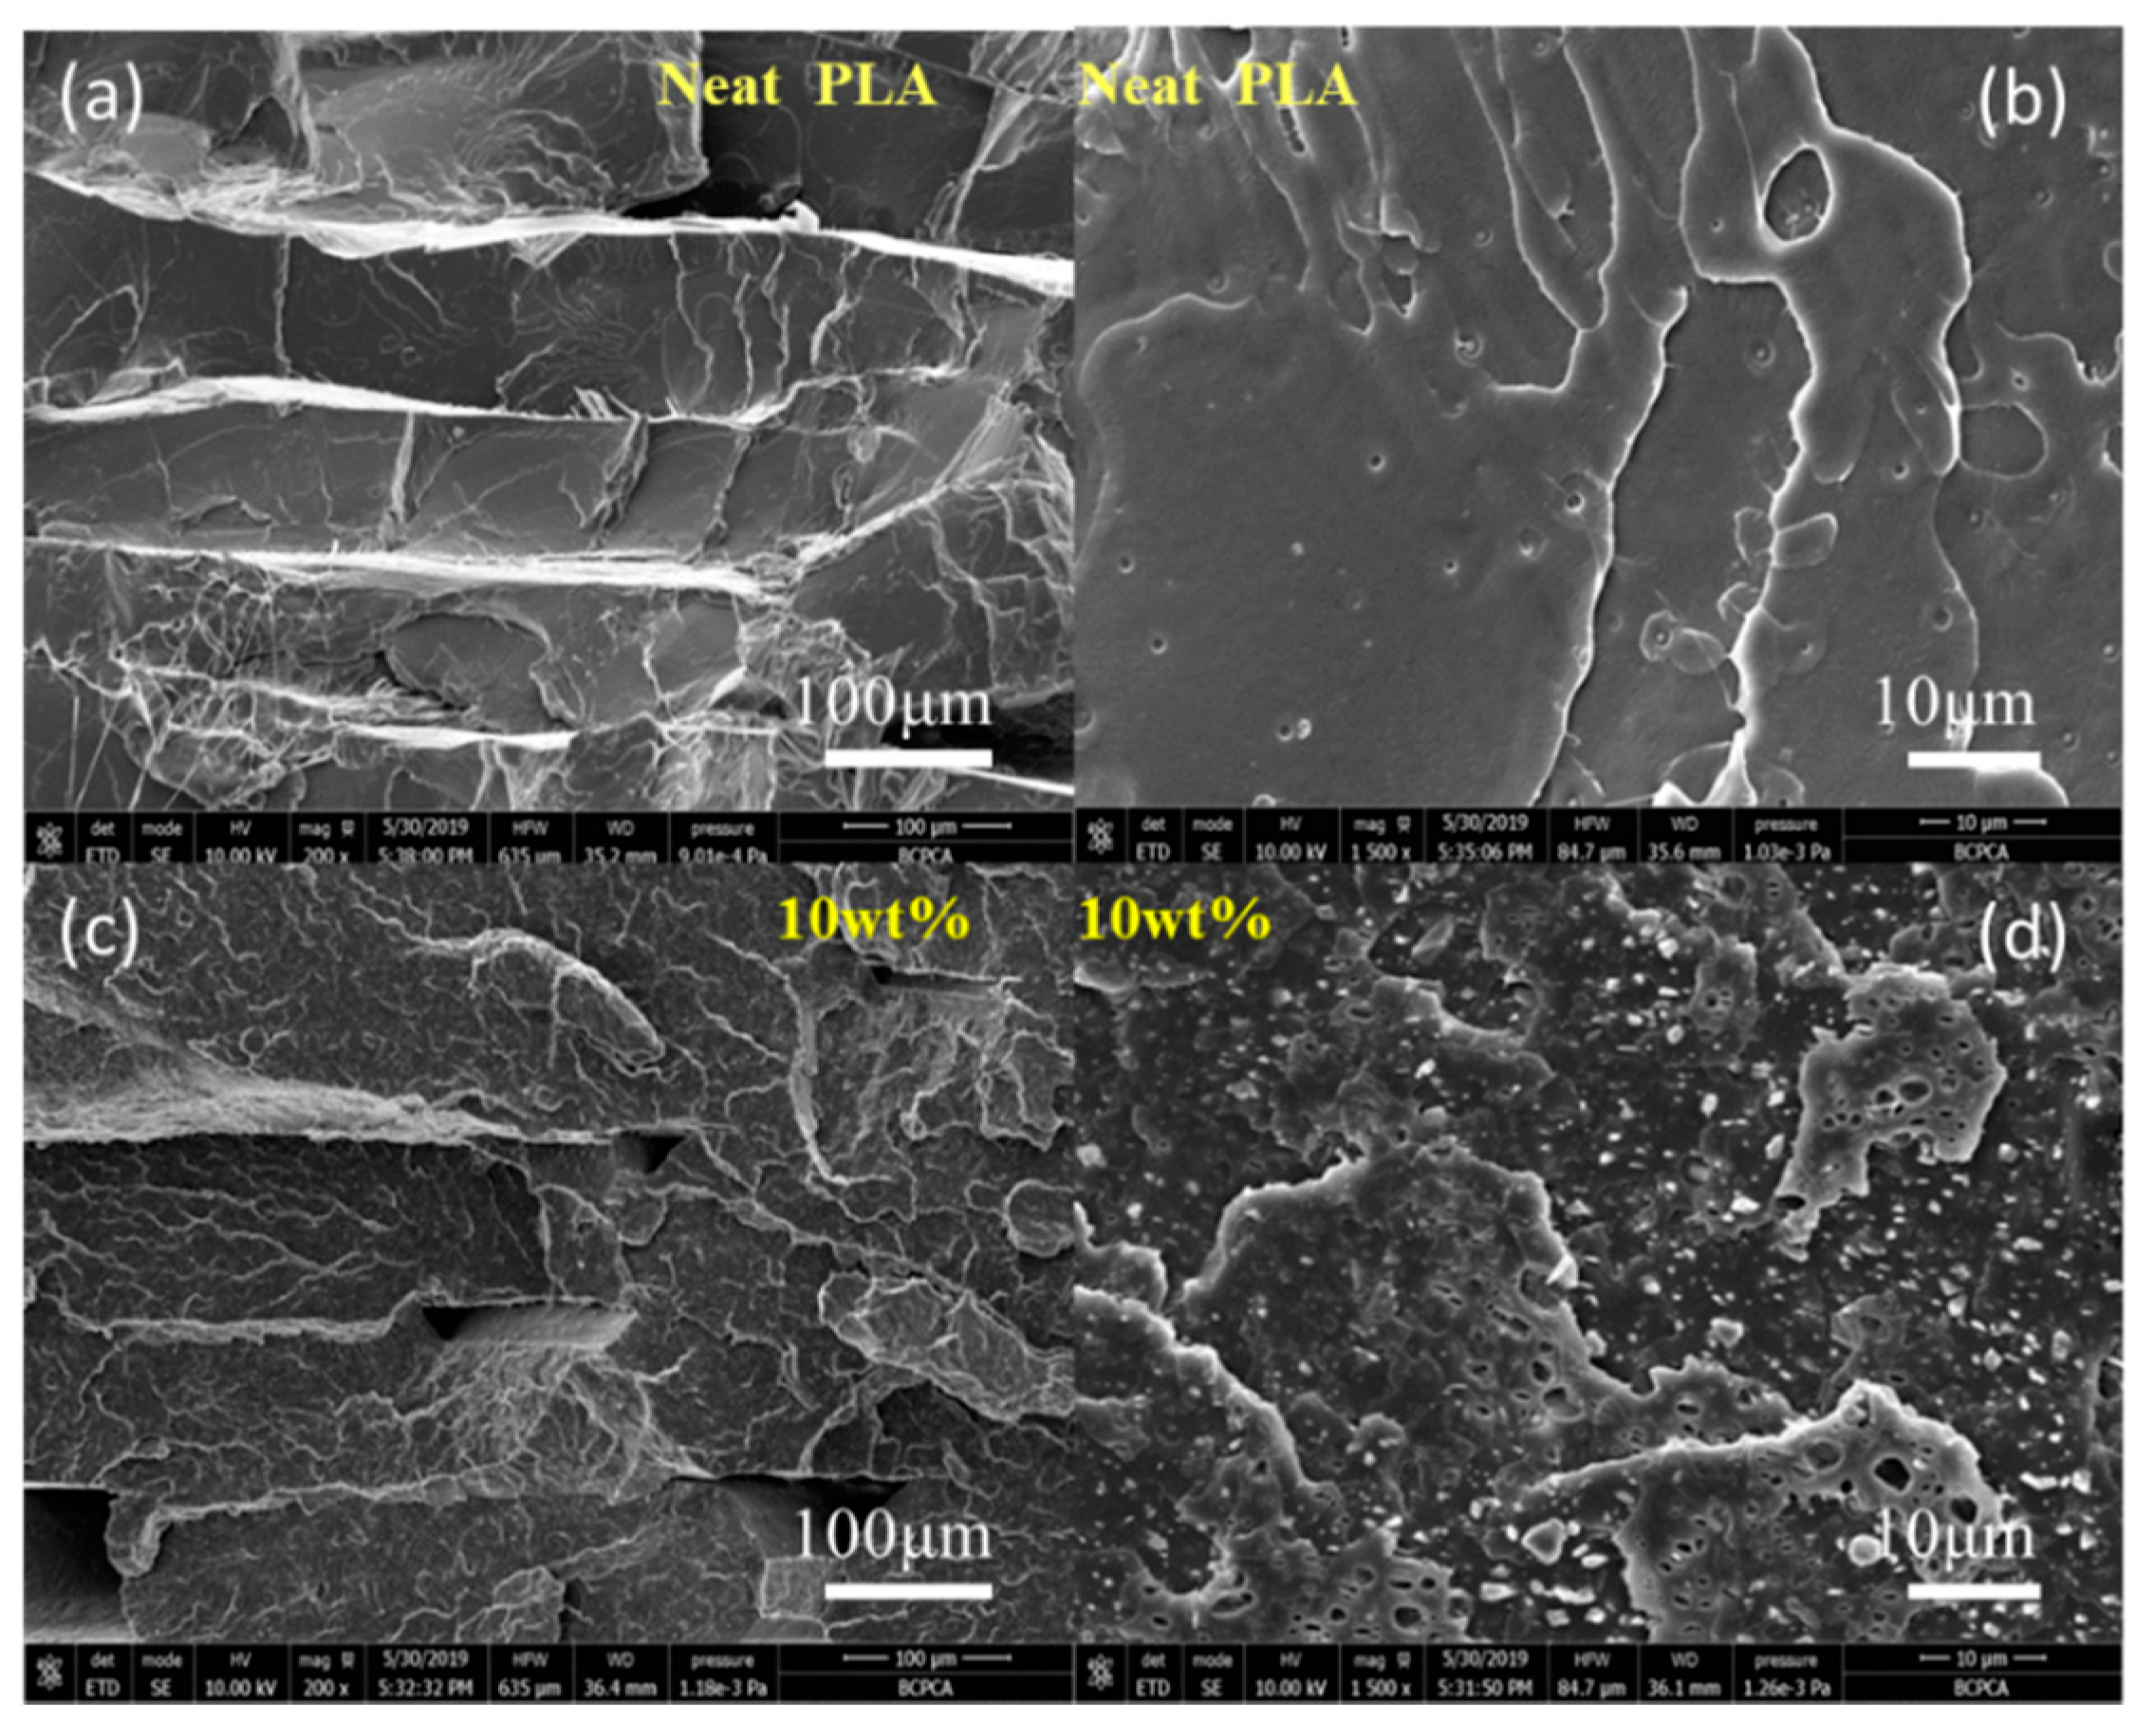
Figure 4 displays SEM images of a fractured section of the printed, neat PLA, and the PLA/CLRS-1 composite with a loading of 10 wt.% CLRS-1. As shown in
Figure 4a,c, a regular, stacked, layered structure and smooth surfaces were present for both the neat PLA and PLA/CLRS-1 composites; these topologies are associated with the brittle fracture mode of the printed specimens. There were fewer small holes in the cross section of neat PLA (
Figure 4b), due to the degradation of the PLA molecules during the printing process. As depicted in
Figure 4c, there were more obvious triangular holes between adjacent layers, and more cracks on the surface of the fractured section of the PLA/CLRS-1 composite. This phenomenon may be related to the increased melt viscosity and crack deflection caused by the addition of the lunar regolith simulant. Moreover, the increased porosity and crack deflection could respond to the reduced of strength. From
Figure 4d, it can be seen that the lunar regolith simulant particles were uniformly distributed on the surface.
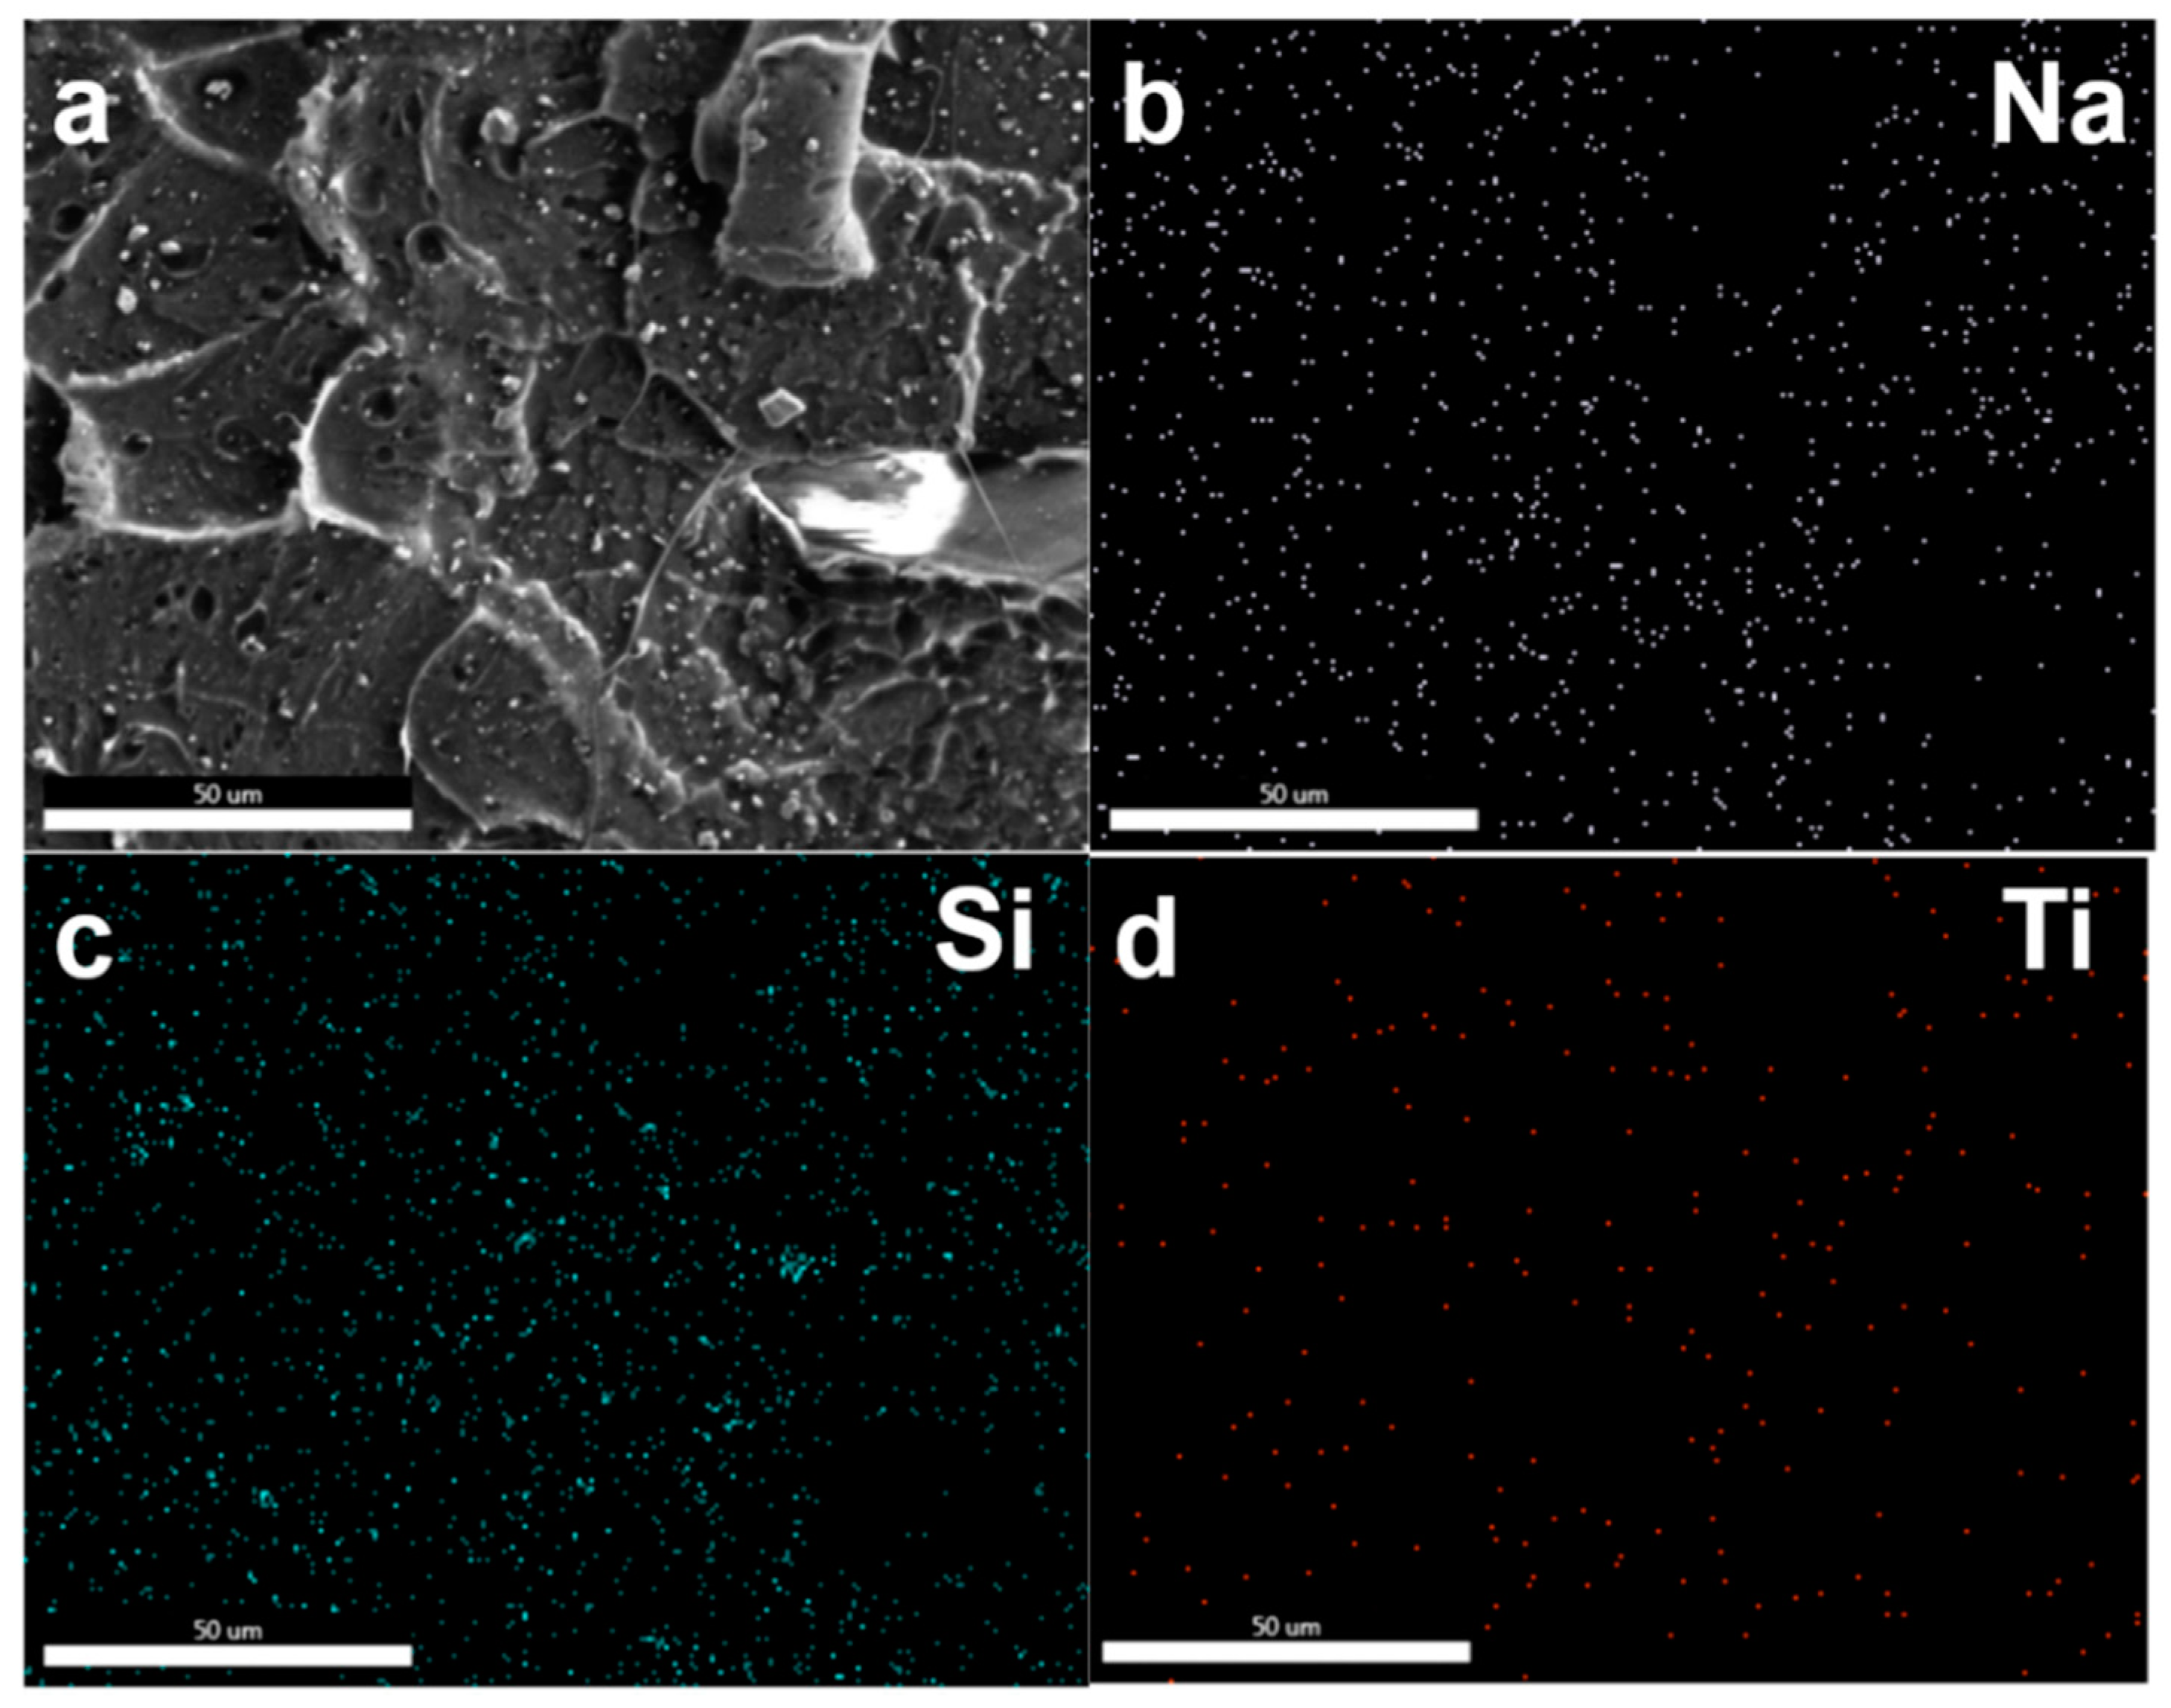
It is well known that lunar regolith consists of several kinds of oxides, such as silicates, metal oxides, and so on. To further demonstrate the dispersity of the multi-oxides in the polymer matrix, the lunar regolith present in the PLA matrix was analyzed by energy dispersive X-ray spectroscopy (EDS). As seen in the EDS mapping images (
Figure 5), typical Na, Si and Ti elements were uniformly dispersed on the fractured surface of the PLA matrix.
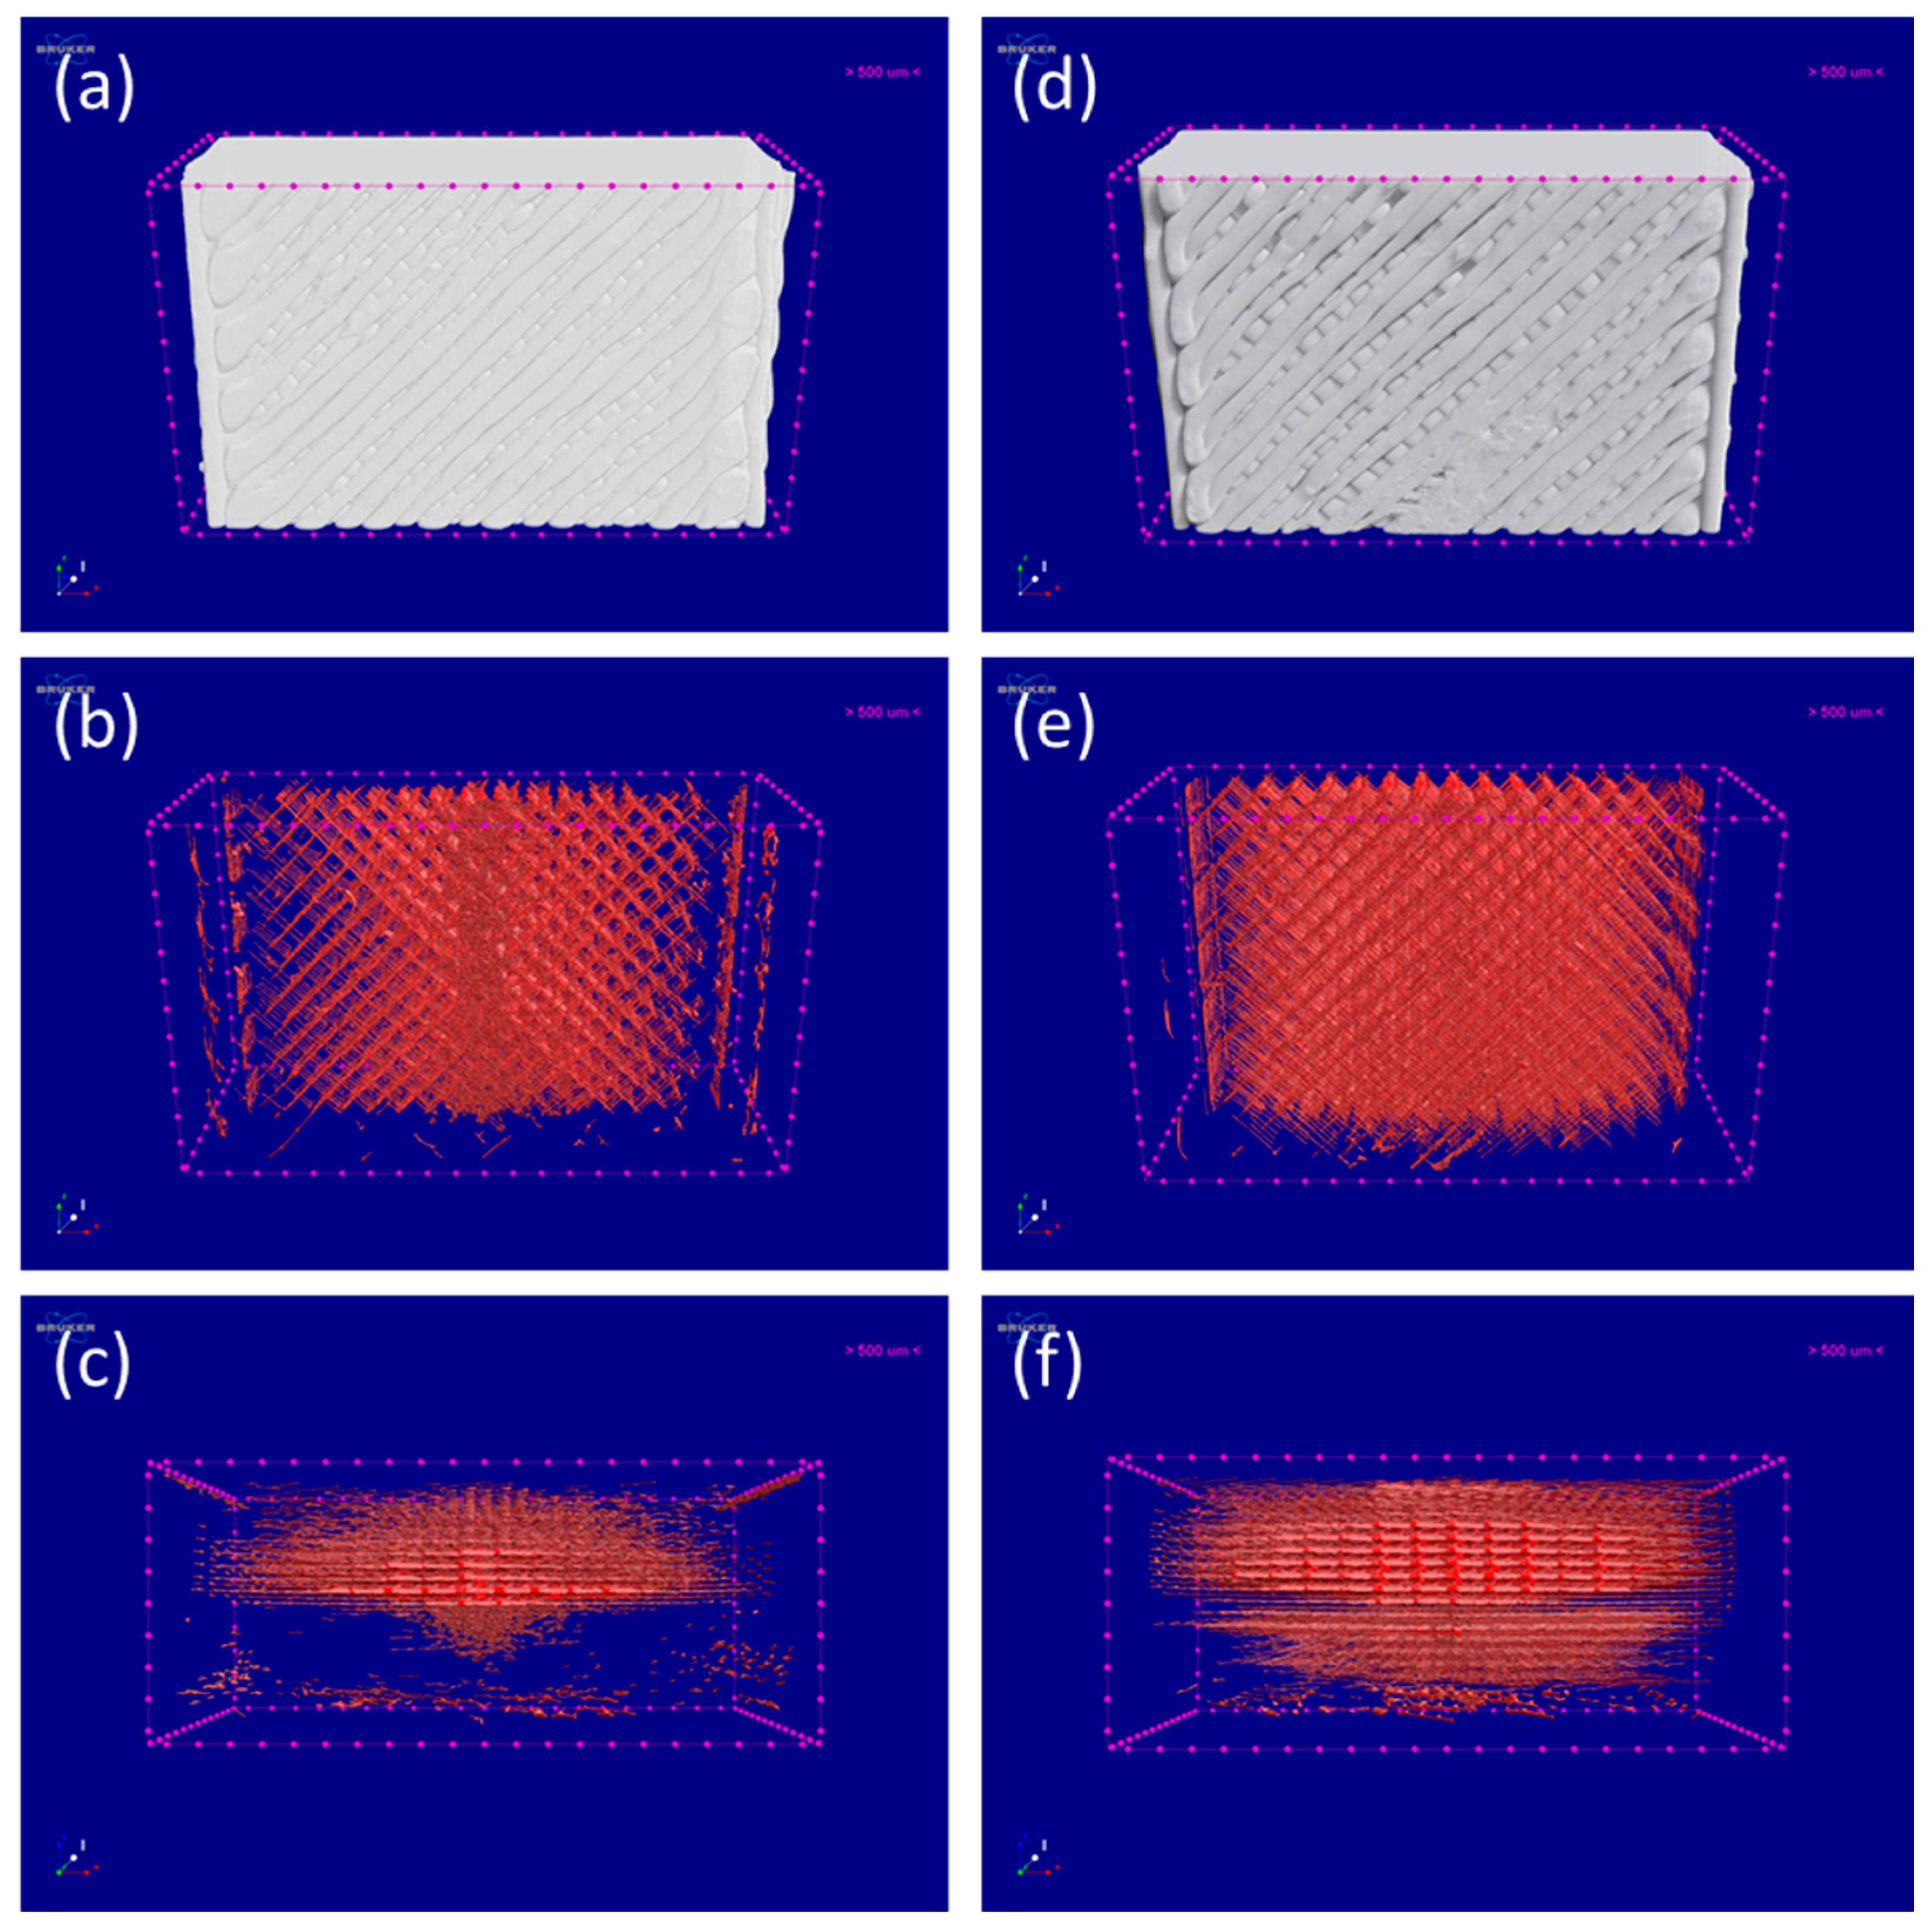
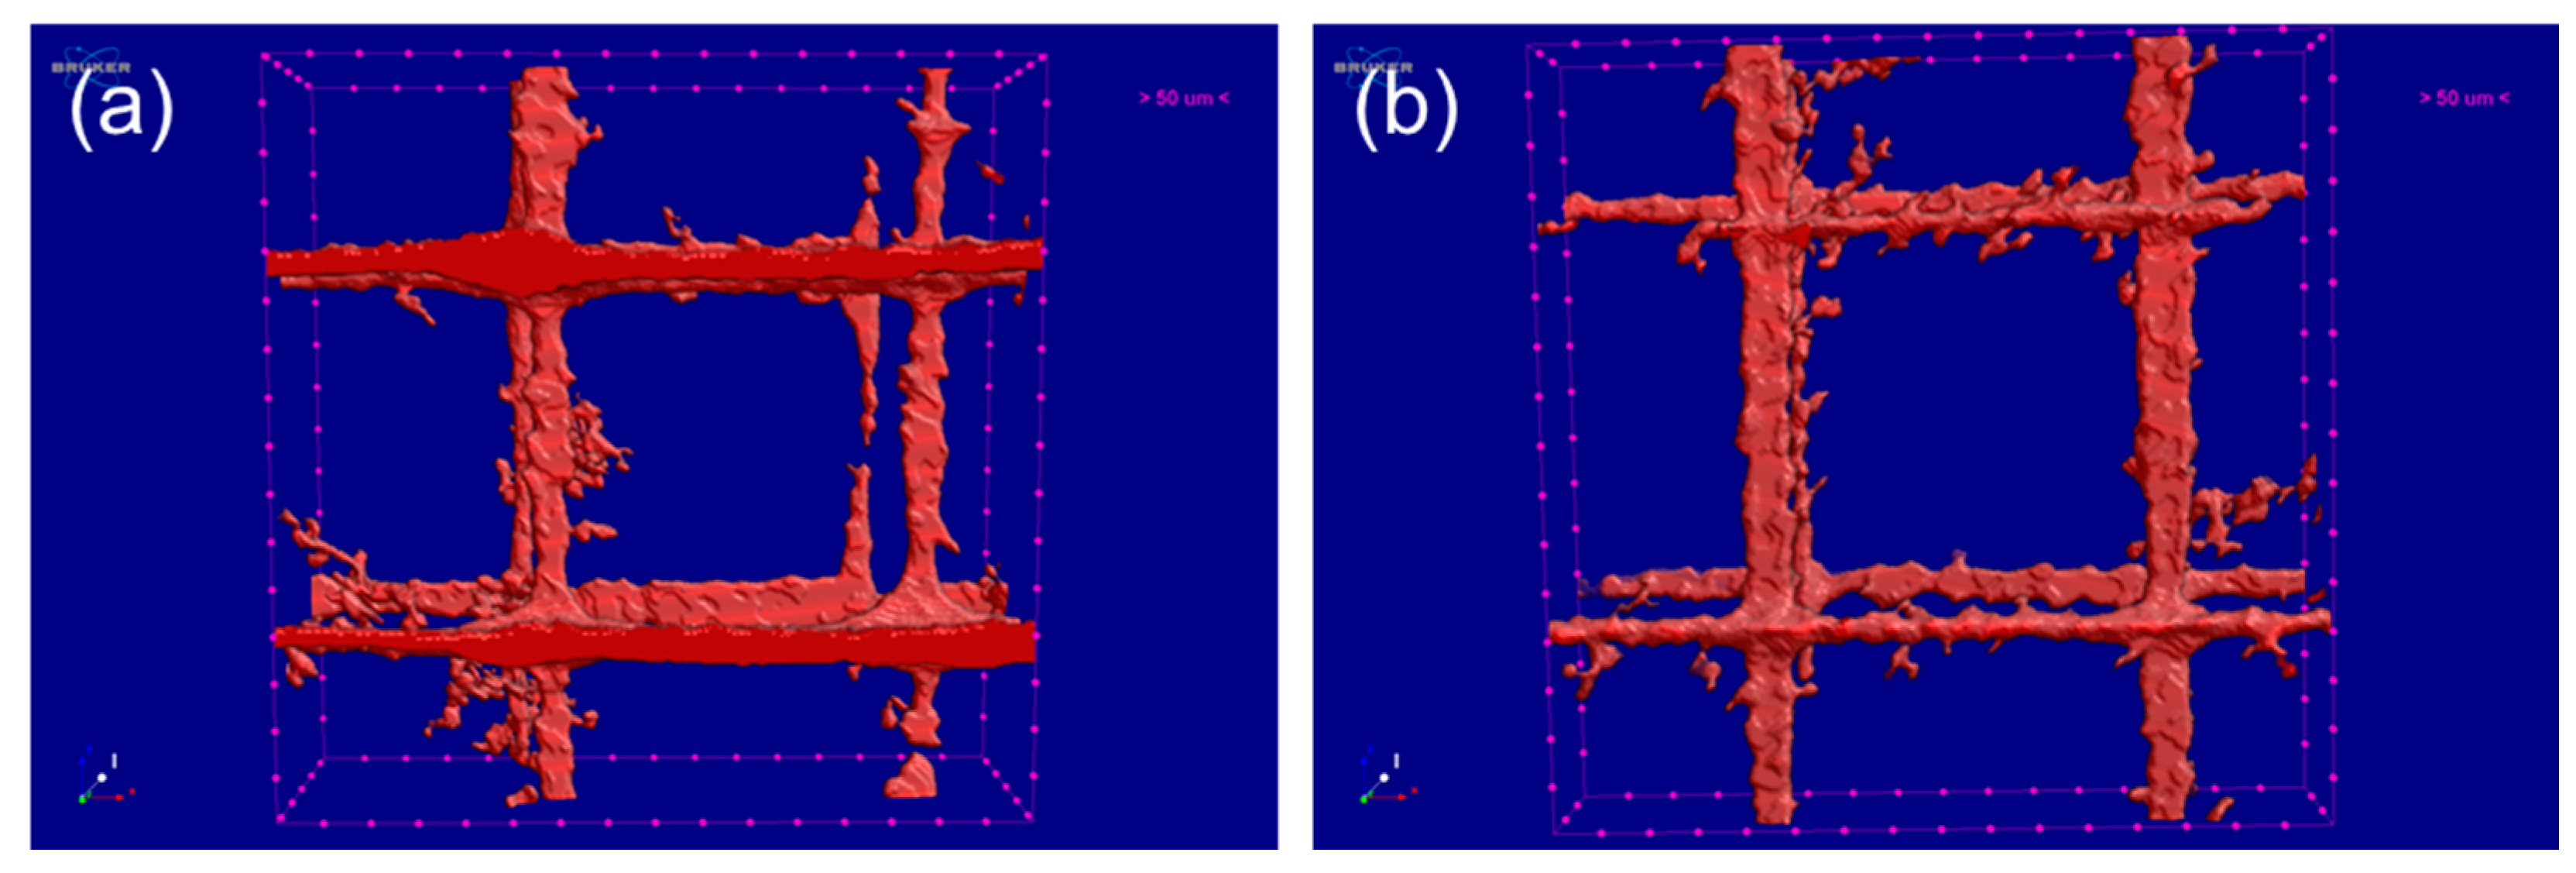
To further study the microstructures of the printed PLA/CLRS-1 samples, an XCT analysis was used to determine their porosities, pore distributions and pore sizes. In recent years, XCT has played an increasingly important role in the nondestructive testing of 3D printed parts.
Figure 6 and
Figure 7, respectively, display the 3D reconstructed pore distributions of the PLA and PLA/CLRS-1 samples. On the outside surfaces of the printed specimens (
Figure 6a,b), it can be seen that with the addition of lunar regolith, the gaps between adjacent extruded filaments have been enlarged. In terms of the 3D reconstructed pore distributions of the printed specimens, a regular crossed inter-connective porous structure was formed in all the printed specimens, which revealed the 3D printing path. Moreover, it can be concluded that the pore distribution of both printed specimens was inhomogeneous, on account of the temperature gradient of the build chamber. This is because the initial printed layer, which was closer to the print bed, experienced higher temperatures, which increased the flow of the extruded melt and reduced the gaps between adjacent filaments and layers. The crossed inter-connective porous structure and inhomogeneous pore distribution was also consistent with our previous work on 3D printed PEEK and CF/PEEK parts [
9].
From
Figure 6c,f, it can be seen that more pores and gaps appeared in the 3D images of the PLA/CLRS-1 composites, relative to the neat PLA samples. Statistically, the porosity of the 10wt.% PLA/CLRS-1 composite was 5.20%, while the porosity of the neat PLA sample was 4.18%. The porosity of the 3D printed PLA and PLA/CLRS-1 composite shows little difference compared to previous studies [
36]. Based on the results of the porosity and pore distribution study, we investigated the pore sizes in the inner regions of the printed, neat PLA sample and 10 wt.% PLA/CLRS-1 composite further, as shown in
Figure 7. The pores were mutually and perpendicularly orientated, forming a rectangular structure, whose dimensions are given in
Table 4. As for the neat PLA sample, the length and width of the rectangular structure were 0.38 mm and 0.37 mm, respectively, while those of the 10 wt.% PLA/CLRS-1 composites were 0.33 mm and 0.39 mm, respectively. We found that the length and widths were all close to 0.4 mm, which was the filament diameter produced by the nozzle. More interestingly, the pore spacings of the neat PLA sample and the 10 wt.% PLA/CLRS-1 composite were 0.09 mm and 0.08 mm, respectively, which were close to the 0.1-mm layer thickness of the printed specimens. This could be related to interlayer overlapping and silting during the printing process. Therefore, the 10wt.% PLA/CLRS-1 composite specimens were thinner than the neat PLA specimens. This could be associated with the increased melt viscosity caused by the addition of lunar regolith, and interface effects between the PLA and lunar regolith.
In conclusion, the microstructure and pore analysis results are in accordance with the decreased mechanical properties of the 3D printed PLA/CLRS-1 composites, where the increased porosity may be responsible for the lower bonding strength of the PLA/CLRS-1 composites.
3.3. Thermal Properties
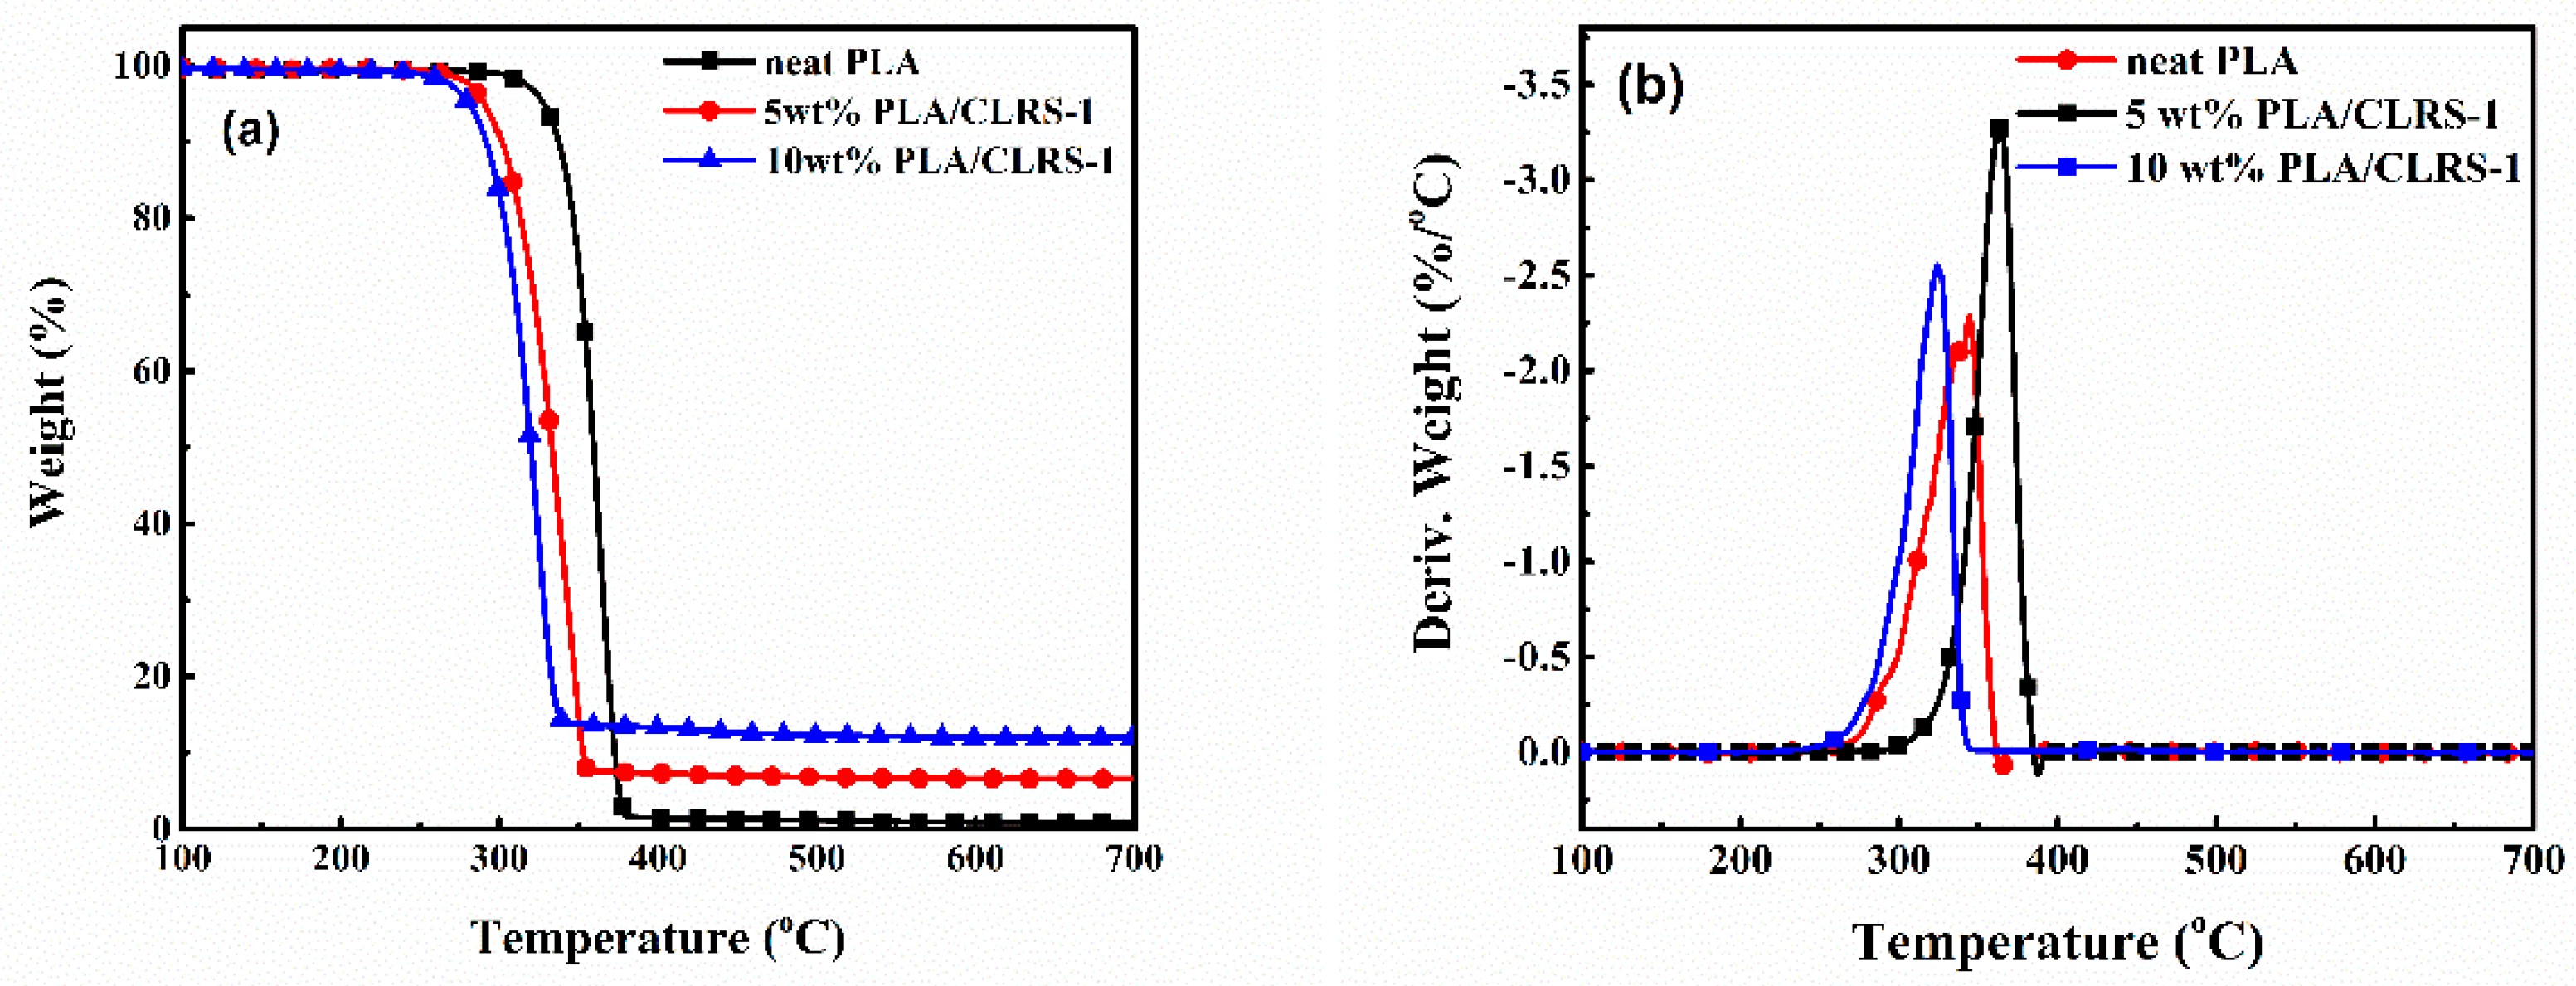
To study the influence of the lunar regolith on the thermal properties of PLA, TGA and DSC analyses were performed on the 3D printed PLA and PLA/CLRS-1 specimens.
Figure 8 shows the TGA and DTG curves of the 3D printed PLA and PLA/CLRS-1 composites, where detailed data, such as the temperatures at which 5% weight losses occurred (
T5%), the maximum decomposition temperature (
Tmax) and residual char of 700 °C, are listed in
Table 5. The
T5% values of the PLA/CLRS-1 composites decreased from 328 °C to 290 °C with the addition of 5 wt.% CLRS-1. The further addition of CLRS-1 up to 10 wt.% led to a lower
T5% of 279 °C, which was associated with the catalysis effect of the metal oxide and phosphate in the CLRS-1 lunar regolith simulant [
37,
38,
39]. With the addition of CLRS-1, the
Tmax values of the PLA/CLRS-1 composites also shifted to low temperatures. Moreover, the residual char of the PLA/CLRS-1 composites at 700 °C increased with the increased content of CLRS-1. This enhancement of char formation was due to the hindering ability of CLRS-1, which prevented the polymer matrix from degrading further at higher temperatures. The CLRS-1 component in the PLA/CLRS-1 composites mainly acted as barrier to hinder the transport of pyrolysis gaseous products, thus affecting the degradation process [
40].
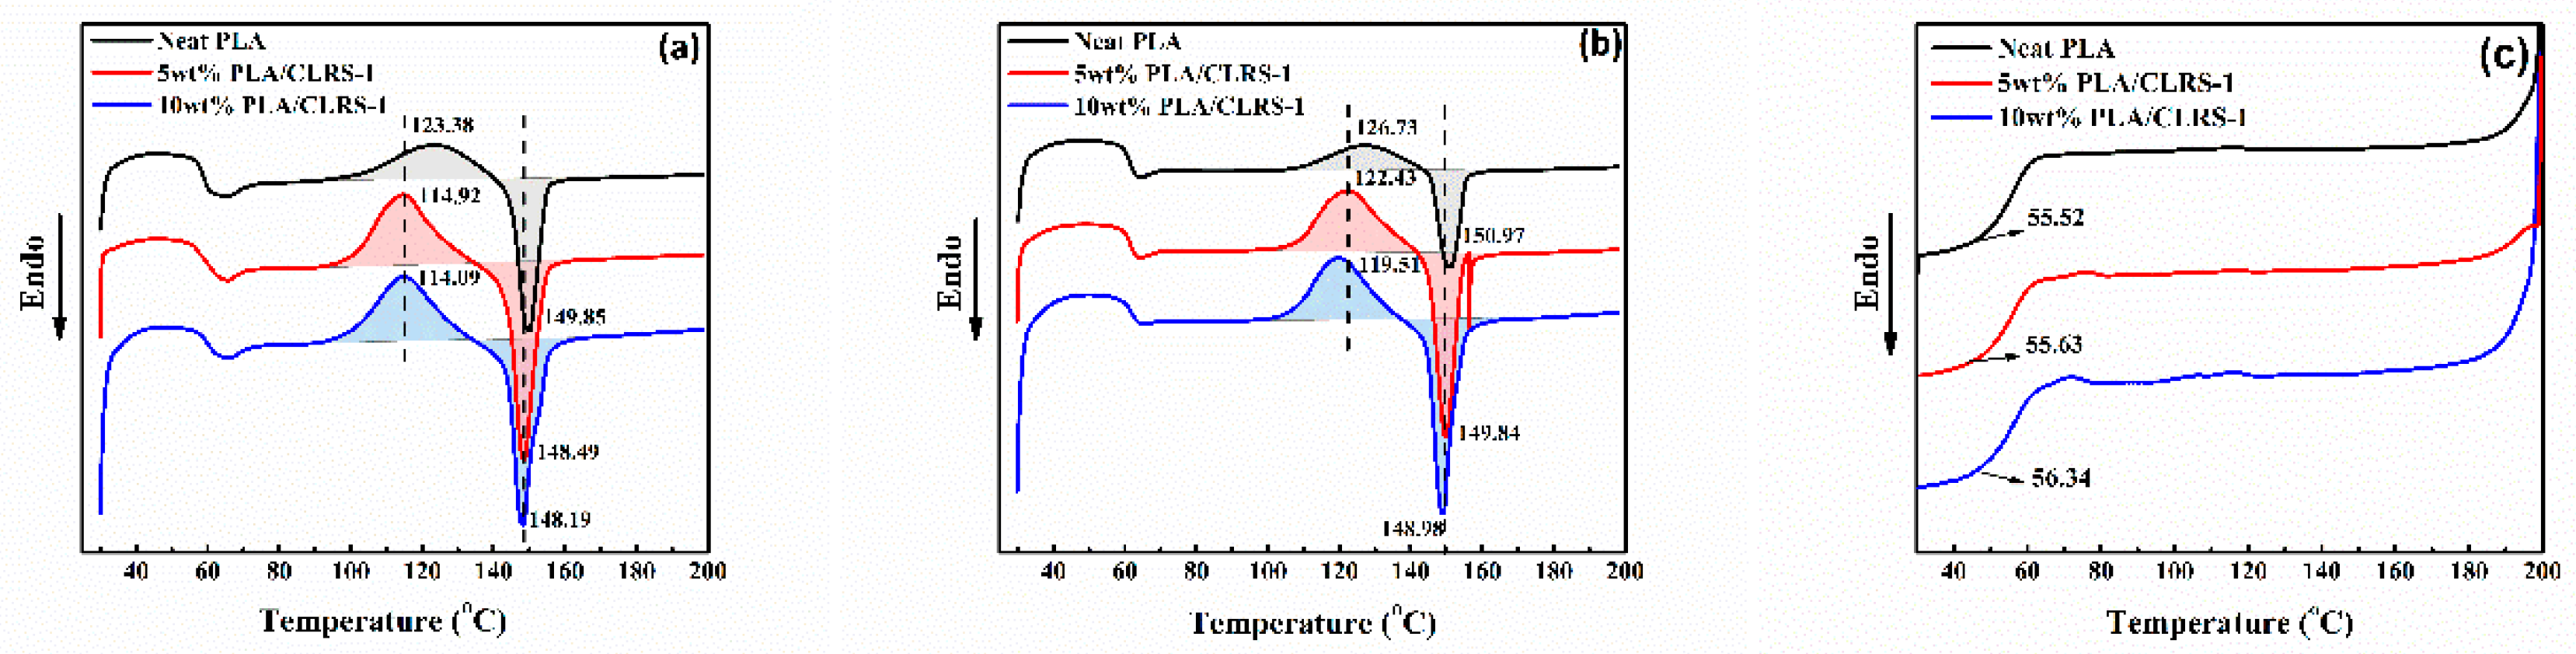
As a semi-crystalline polymer, the crystallinity of PLA has a significant influence on the mechanical properties.
Figure 9a presents the DSC curves of the 3D printed PLA and PLA/CLRS-1 composites, whereas the detailed data are summarized in
Table 5. Among those, crystallinity was calculated according to equation (1) and both enthalpies are integrated from the first heating curves to reflect the crystallization process of printed parts. The first heating curve reflects the thermal performance of the neat PLA and PLA/CLRS-1 composites during the 3D printing process, and the second heating scan reflects the intrinsic thermal properties of them. The addition of CLRS-1 has a slight influence on
Tg and the crystallinity of the PLA matrix. However, with respect to the cold crystallinity behavior, the results show that the crystallization temperature is reduced with the content of the lunar soil simulant (from 123.38 to 114.09 °C) and the corresponding enthalpy is increased (from 14.76 to 21.18 J/g), which exhibits narrower and sharper peak on DSC curves. This phenomenon mainly contributes to the heterogeneous nucleation effect of CLRS-1 microparticles uniformly dispersed in the PLA matrix. Because CLRS-1 restricted the chain mobility of PLA, spherocrystal and lamellar crystal grow more easily under a relatively low temperature. Moreover,
Figure 9b shows the intrinsic heat flow process of PLA/CLRS-1. Compared to neat PLA, the second heating curve indicates that the 3D printing process and CLRS-1 both improve the cold crystallization process, while they do not influence the whole degree of crystallinity of the final product (all crystallinities are lower than 4%).
3.4. Recycling Process
ISRU is regarded as a key technology to carry out manned extraterrestrial and deep-space exploration. With the ISRU approach, new tools and supplies for scientific experiments can be made from the bio-packing of materials and printed parts. There are two main methods used to recycle polymer materials, including solvent dissolution recycling and grinding cycle processing. Along these lines, NASA has deployed a recycling machine on the ISS, which has been used to test recycling processes under microgravity. The recycling machine, named the ‘Refabricator’, can break waste plastic into pieces and turn it into feedstock for the printer to create new items by the melt extrusion method [
27].
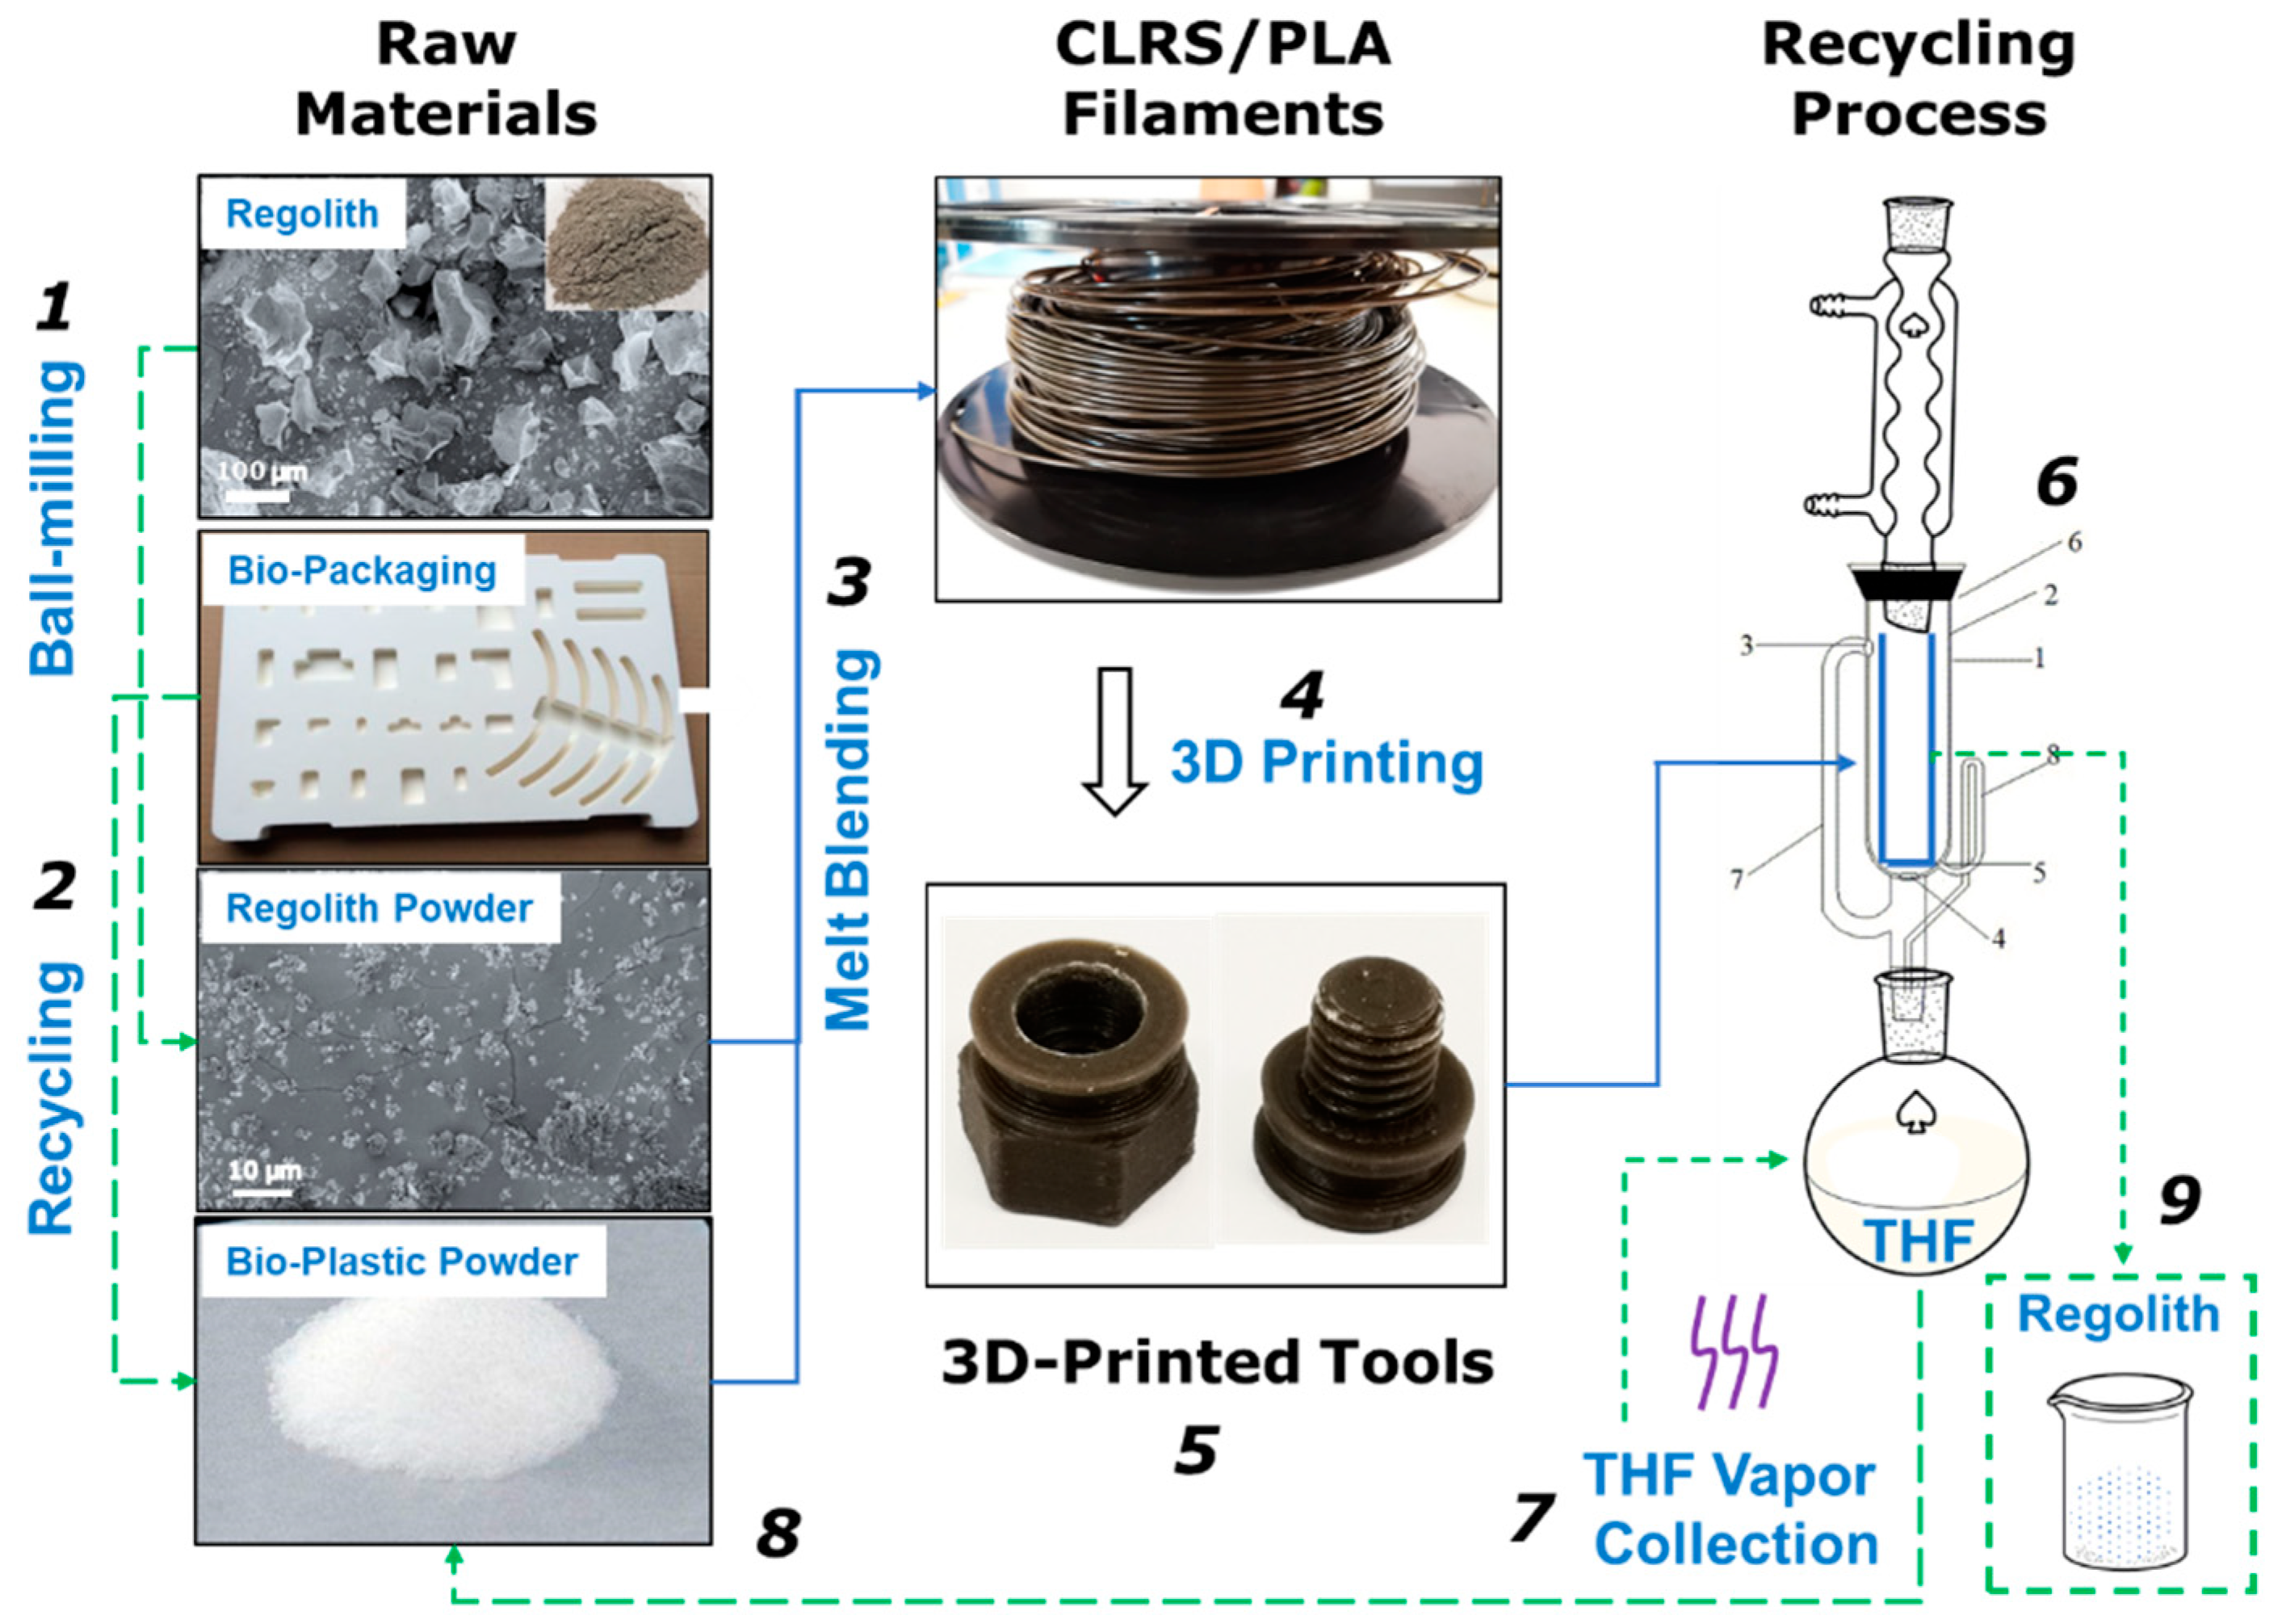
Here, we adopted the fat extractor reflux method, which is a solvent dissolution method, to recycle PLA and lunar regolith from 3D printed components.
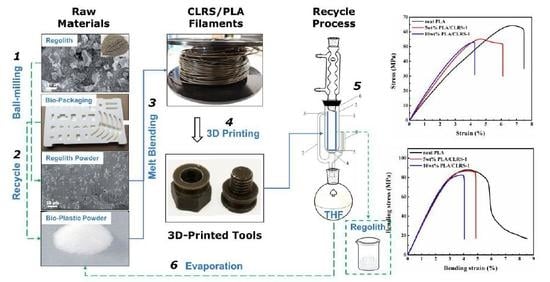
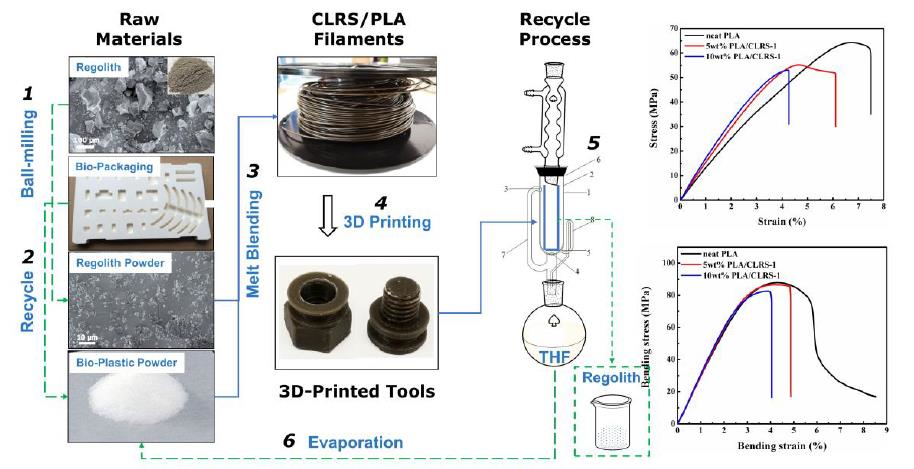
Figure 10 shows the fabrication and recycling processes of the 3D printed parts. The PLA/CLRS-1 filaments can be produced using aerospace bio-packaging materials and regolith powder. After the 3D printing process, the 3D printed PLA/CLRS-1 components were placed in an extraction thimble. Through the reflux of THF, the components slowly dissolved in the solution. The dissolved PLA was then refluxed into a flask along with the THF. The lunar regolith was sieved as needed, which then accumulated in the extraction thimble for collection after the dissolution of the 3D printed PLA–regolith components. Then, the PLA and THF were separated and recycled using the rotary evaporation method, then reserved for future use. The total process lasted for approximately 3 h.
Next, we analyzed the feasibility of the PLA powder obtained after the recycling process. For this purpose, the chemical structure and molecular weight were analyzed by FTIR-ATR and GPC.
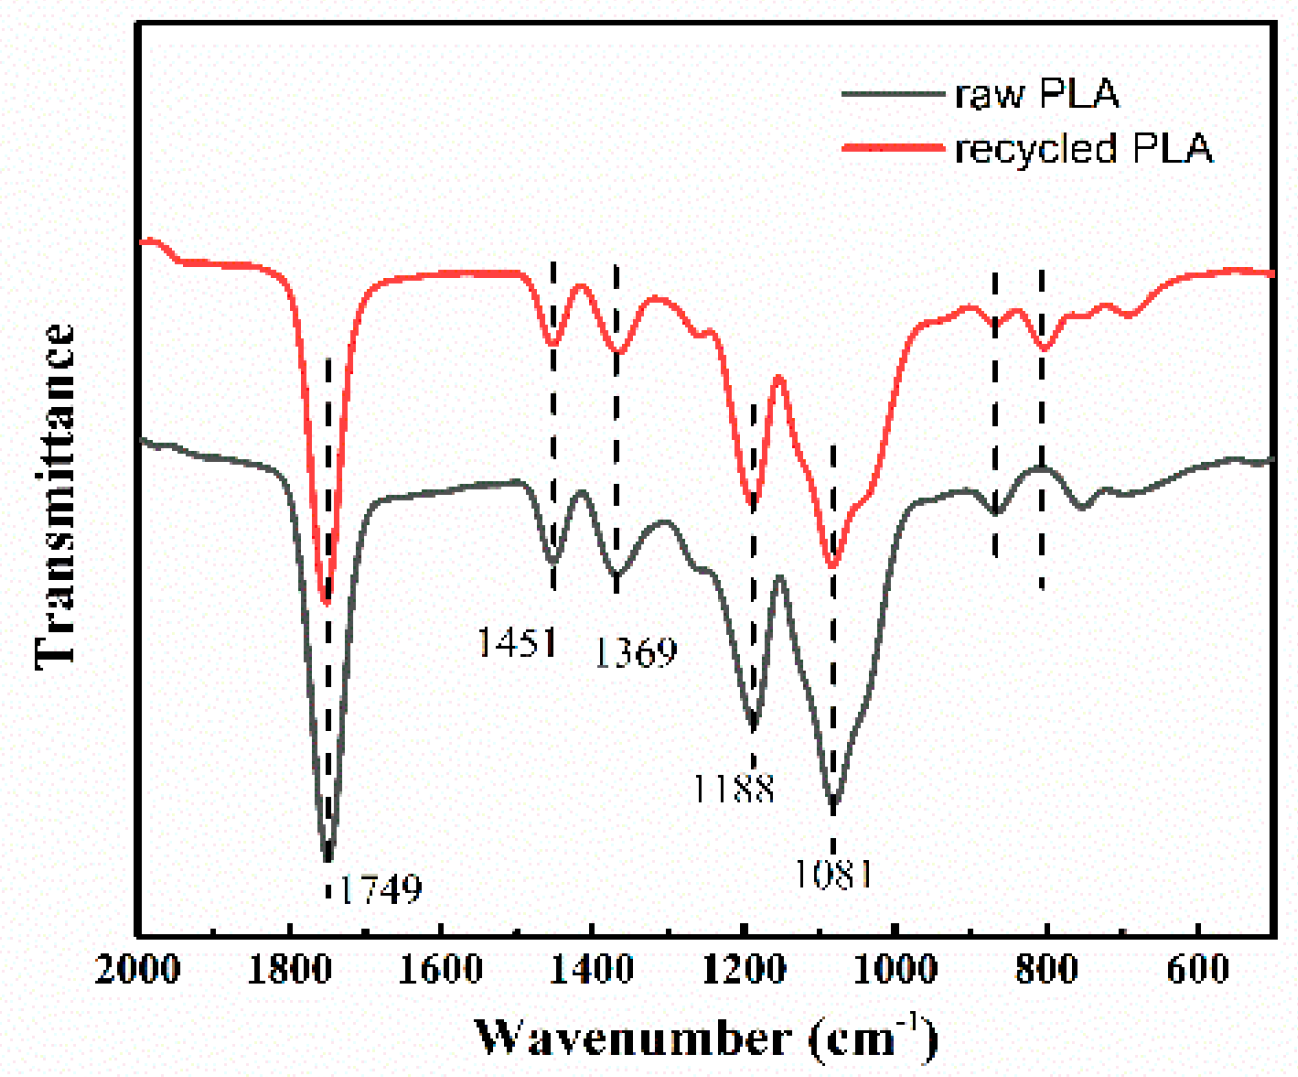
Figure 11 presents the FTIR spectra of the raw and recycled PLA samples, which showed the characteristic peak of the C=O group (1749 cm
−1), methyl group bonds (1451 and 1369 cm
−1), C–O (1188 cm
−1), and C–O–C structures (1081 cm
−1) [
41,
42]. Therefore, the FTIR spectra preliminary illustrated that no obviously degraded byproducts were found in the recycled PLA, and the recycled PLA could be reused in future applications.
GPC analysis is a useful approach for determining the molecular weights and distributions of polymers. The GPC data of the raw and recycled PLA samples are summarized in
Table 6. From
Table 6, it is apparent that, compared to raw PLA, the average molecular weight (
Mw) of the recycled PLA decreased slightly from 75.85 kg/mol to 73.92 kg/mol. The polydispersity index (
D) of the recycled PLA also decreased. The
Mw value of the recycled PLA was smaller compared to that of the raw PLA, implying the occurrence of compounding-, 3D printing- and recycling-induced molecular weight degradation. Combined with the FTIR results shown above, the decrease in the
Mw value was due to the shortening of the PLA molecular chain during the melt extrusion process.


 ,
, 


