Application of Synchrotron Radiation X-ray Scattering and Spectroscopy to Soft Matter


Abstract
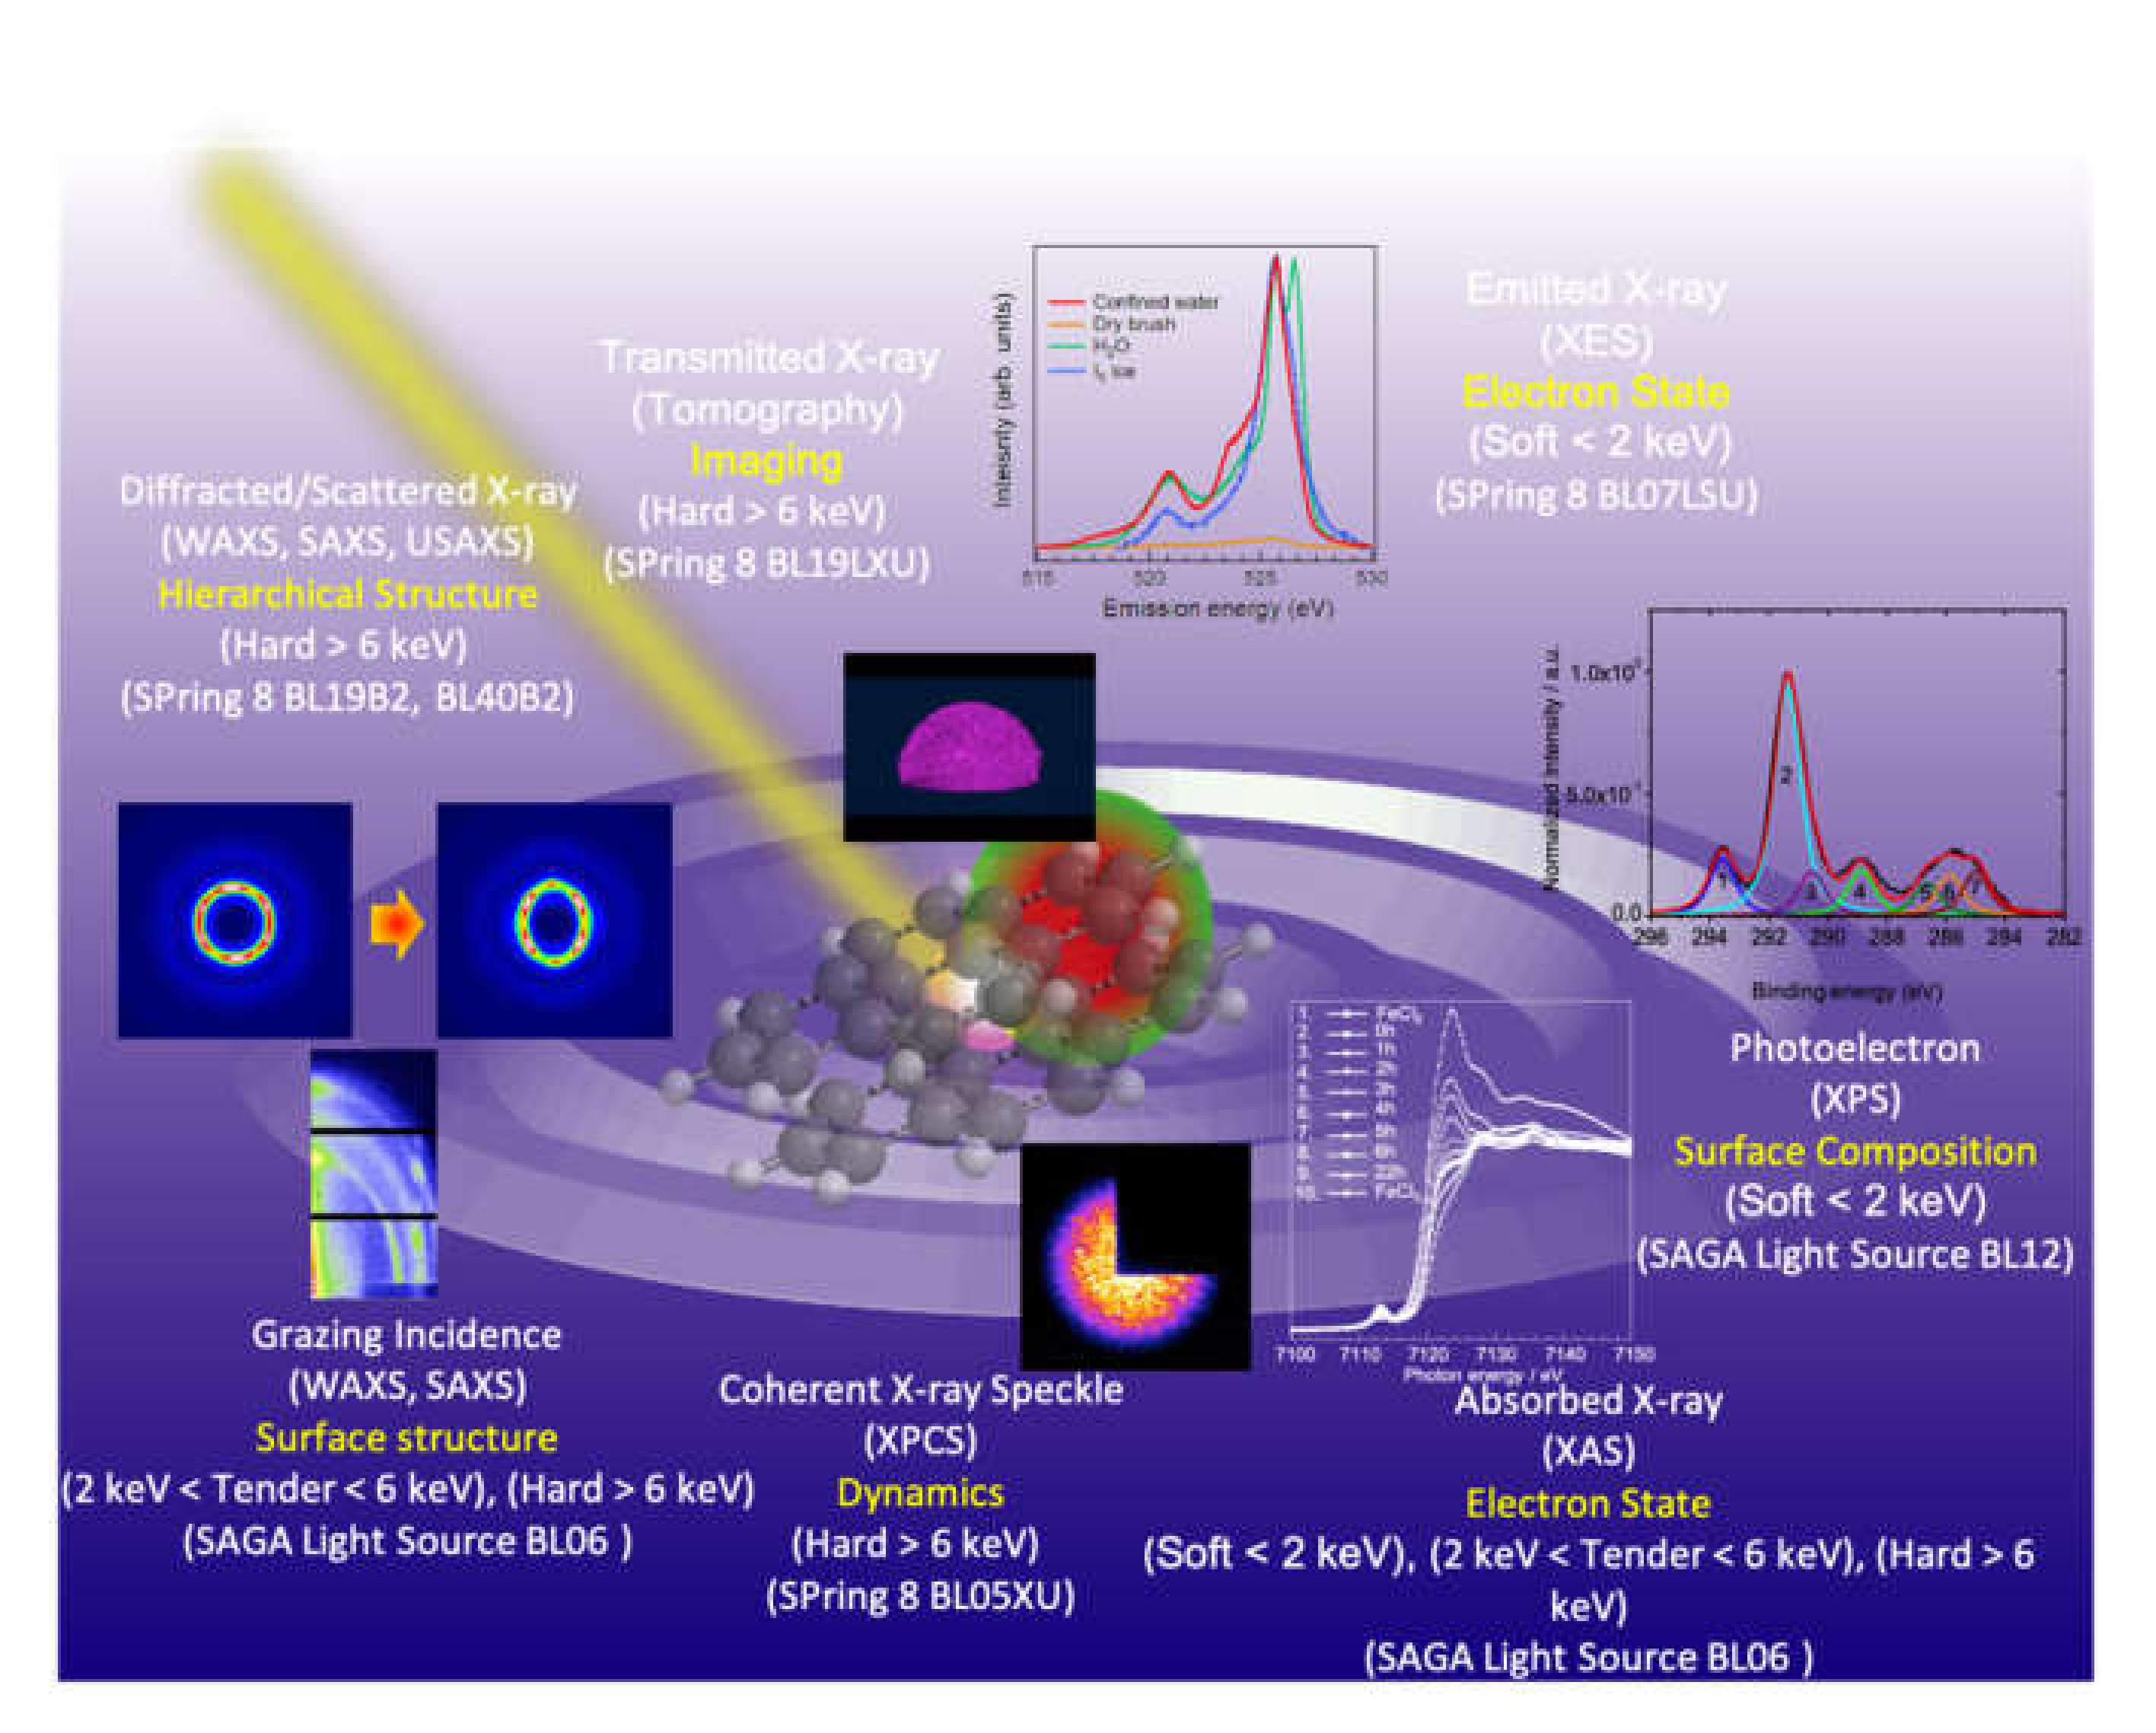
:1. Introduction
2. Synchrotron Radiation X-ray Scattering
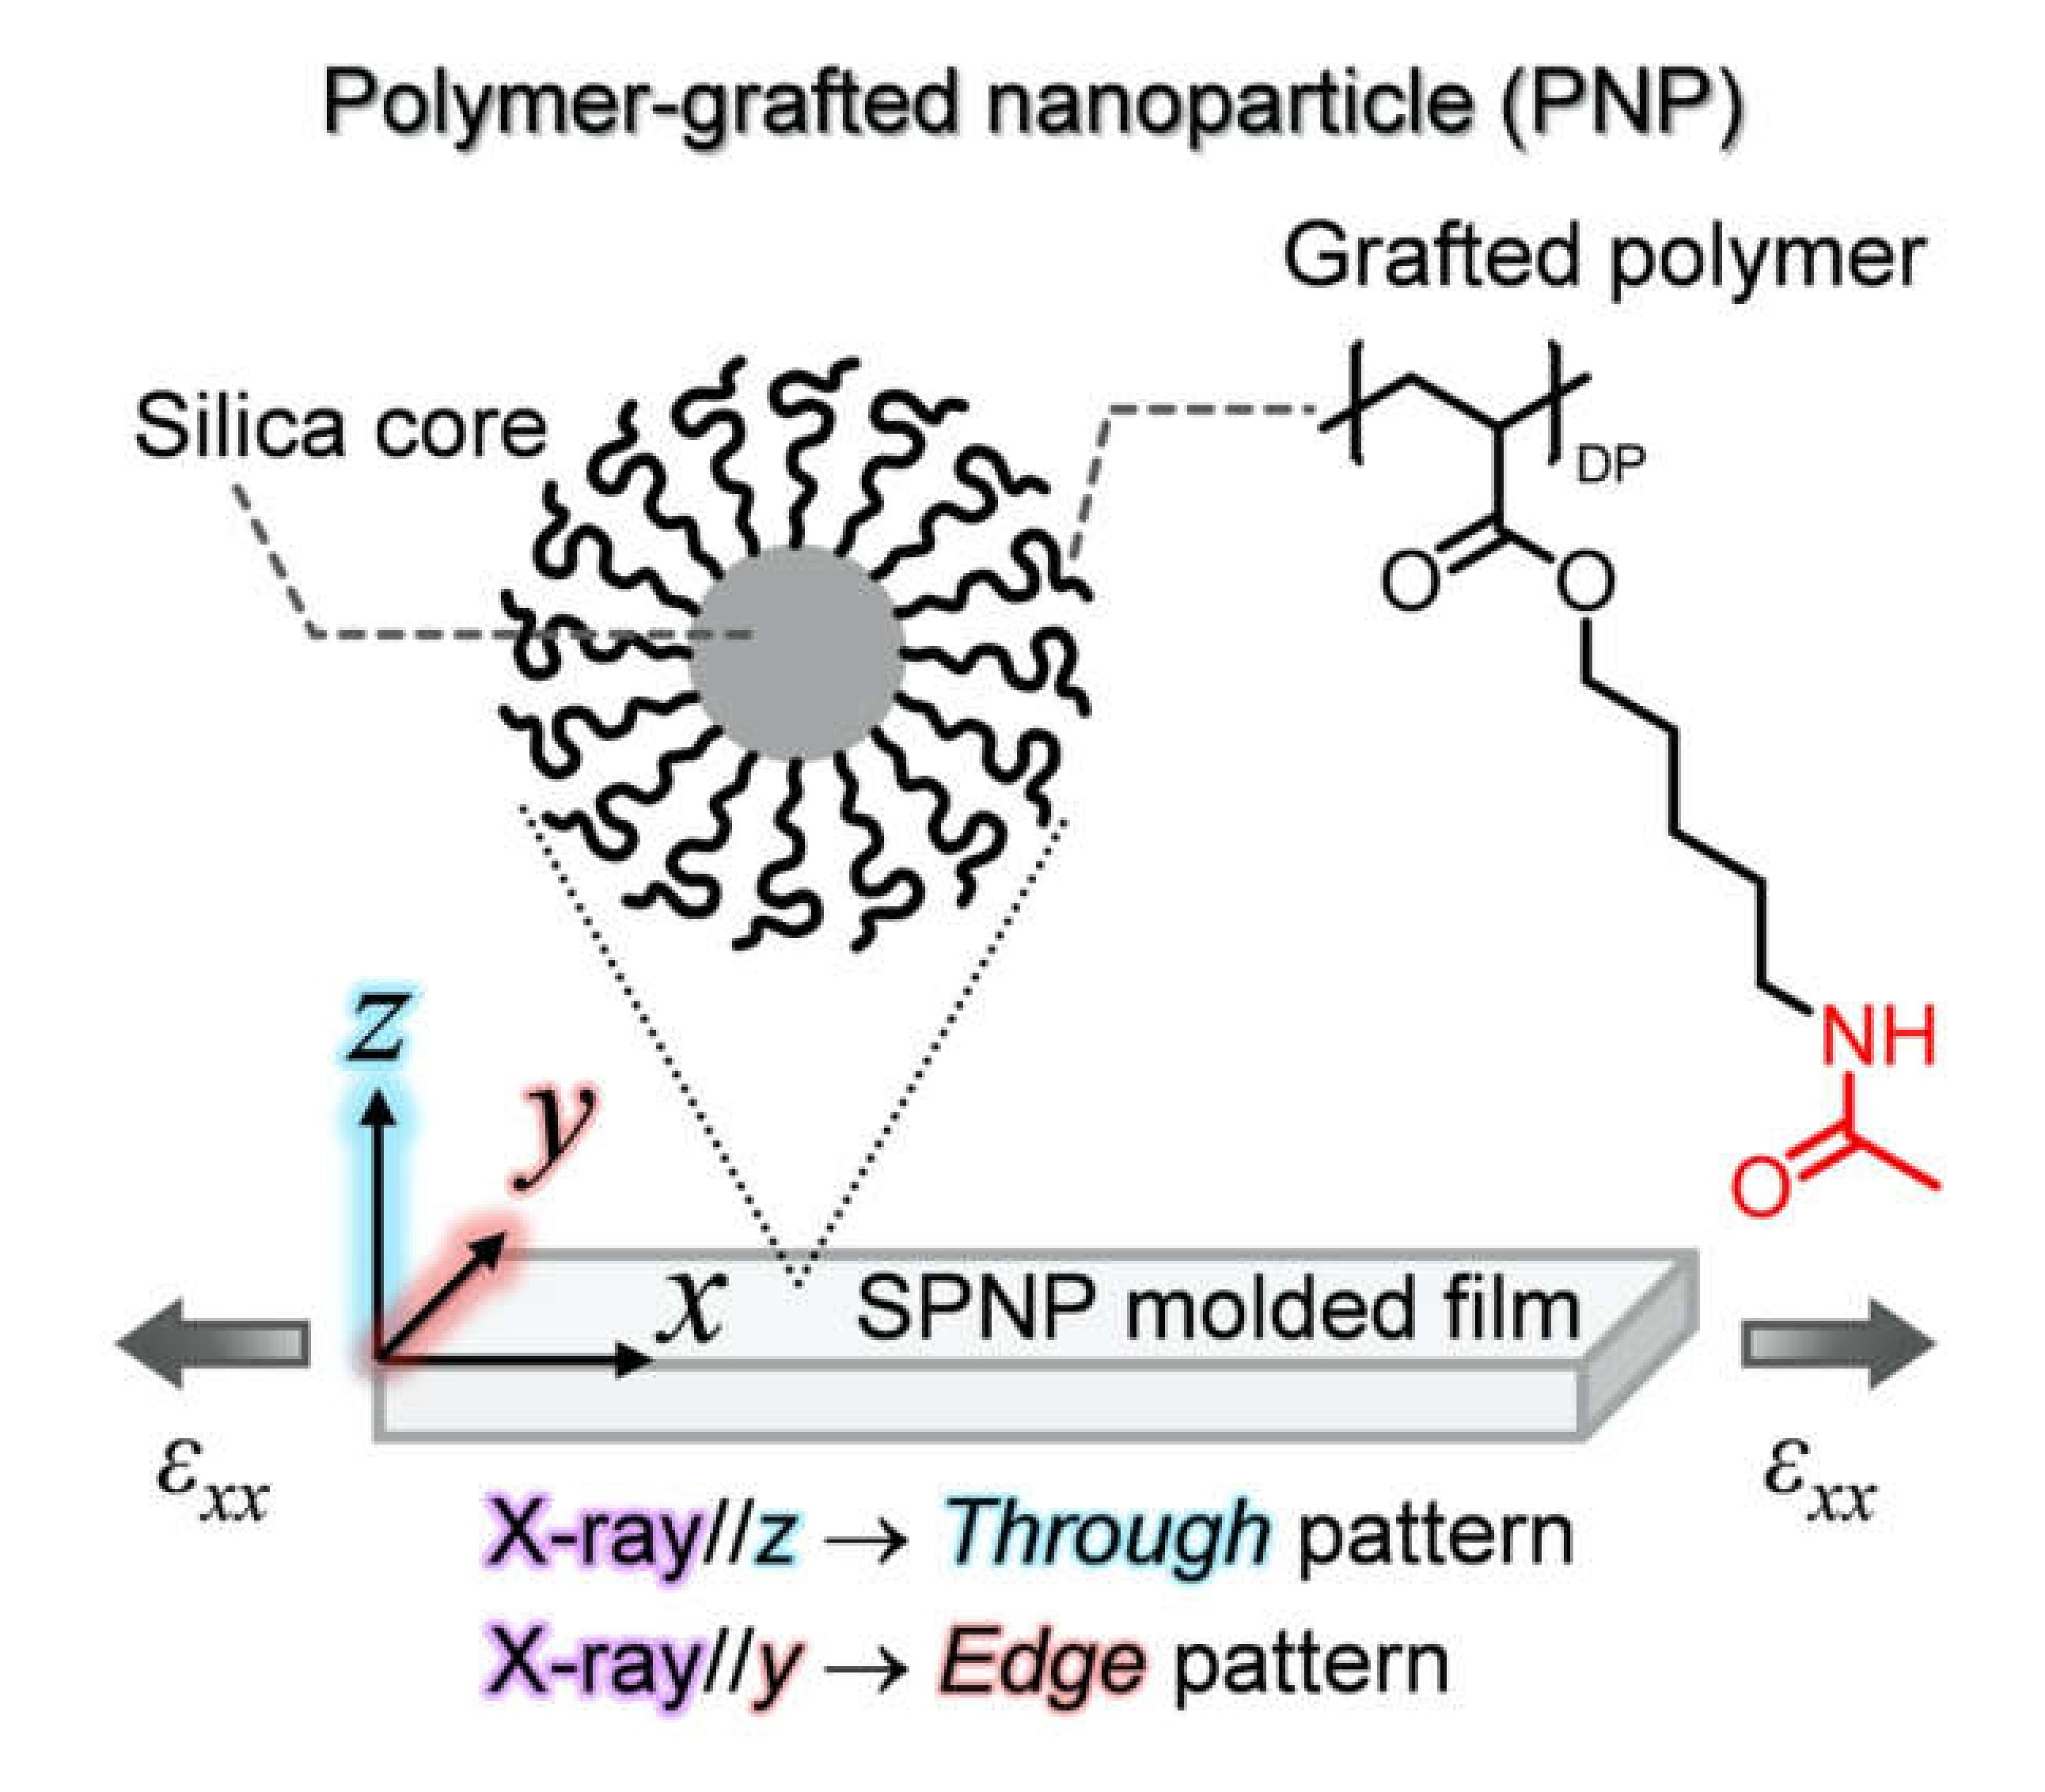
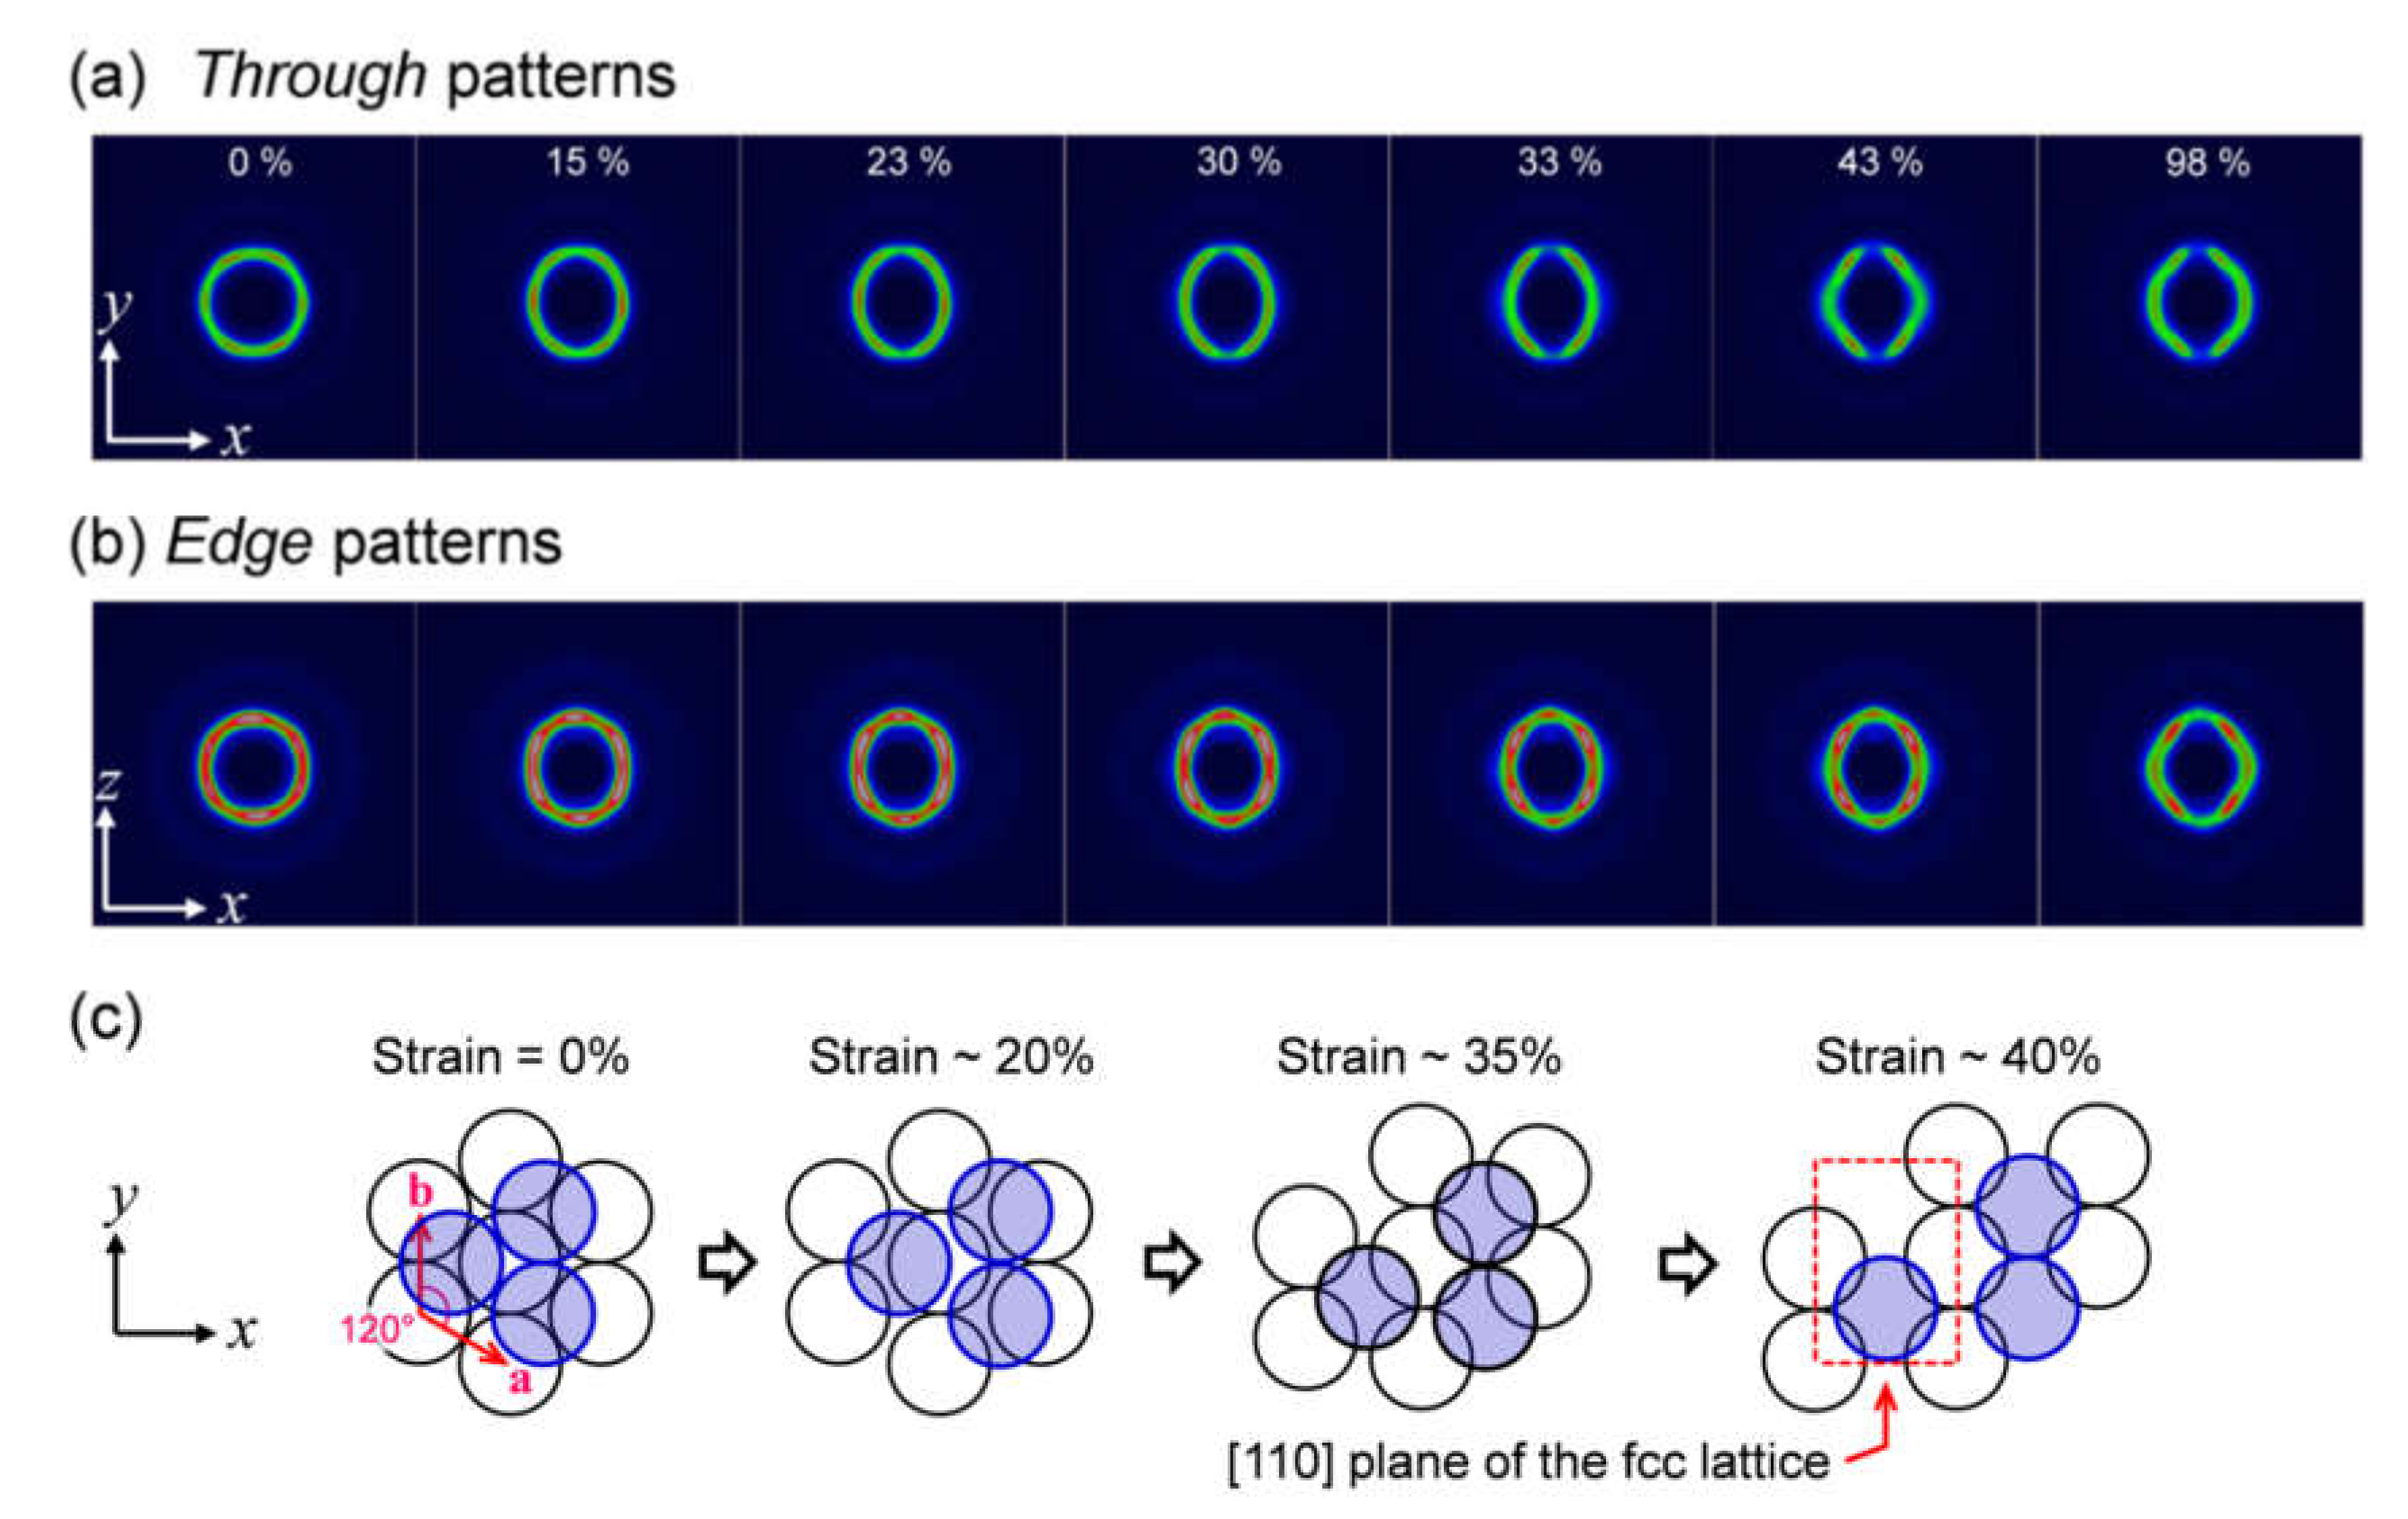
2.1. In Situ USAXS Study to Understand Structural Change in a Colloidal Crystal Elastomer During Uniaxial Stretching
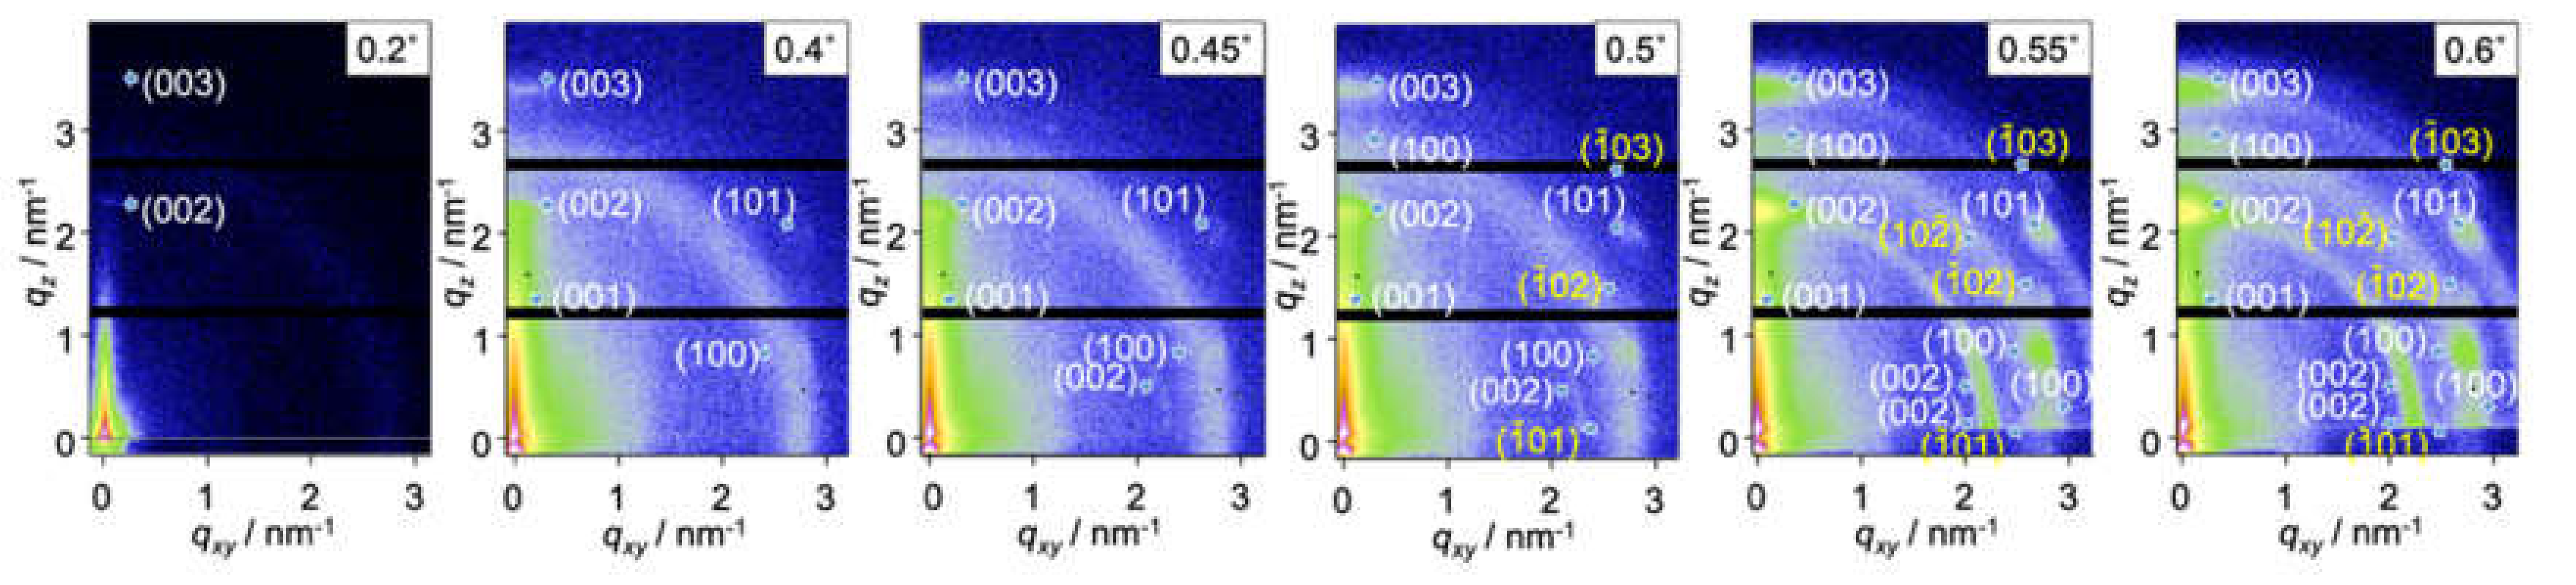
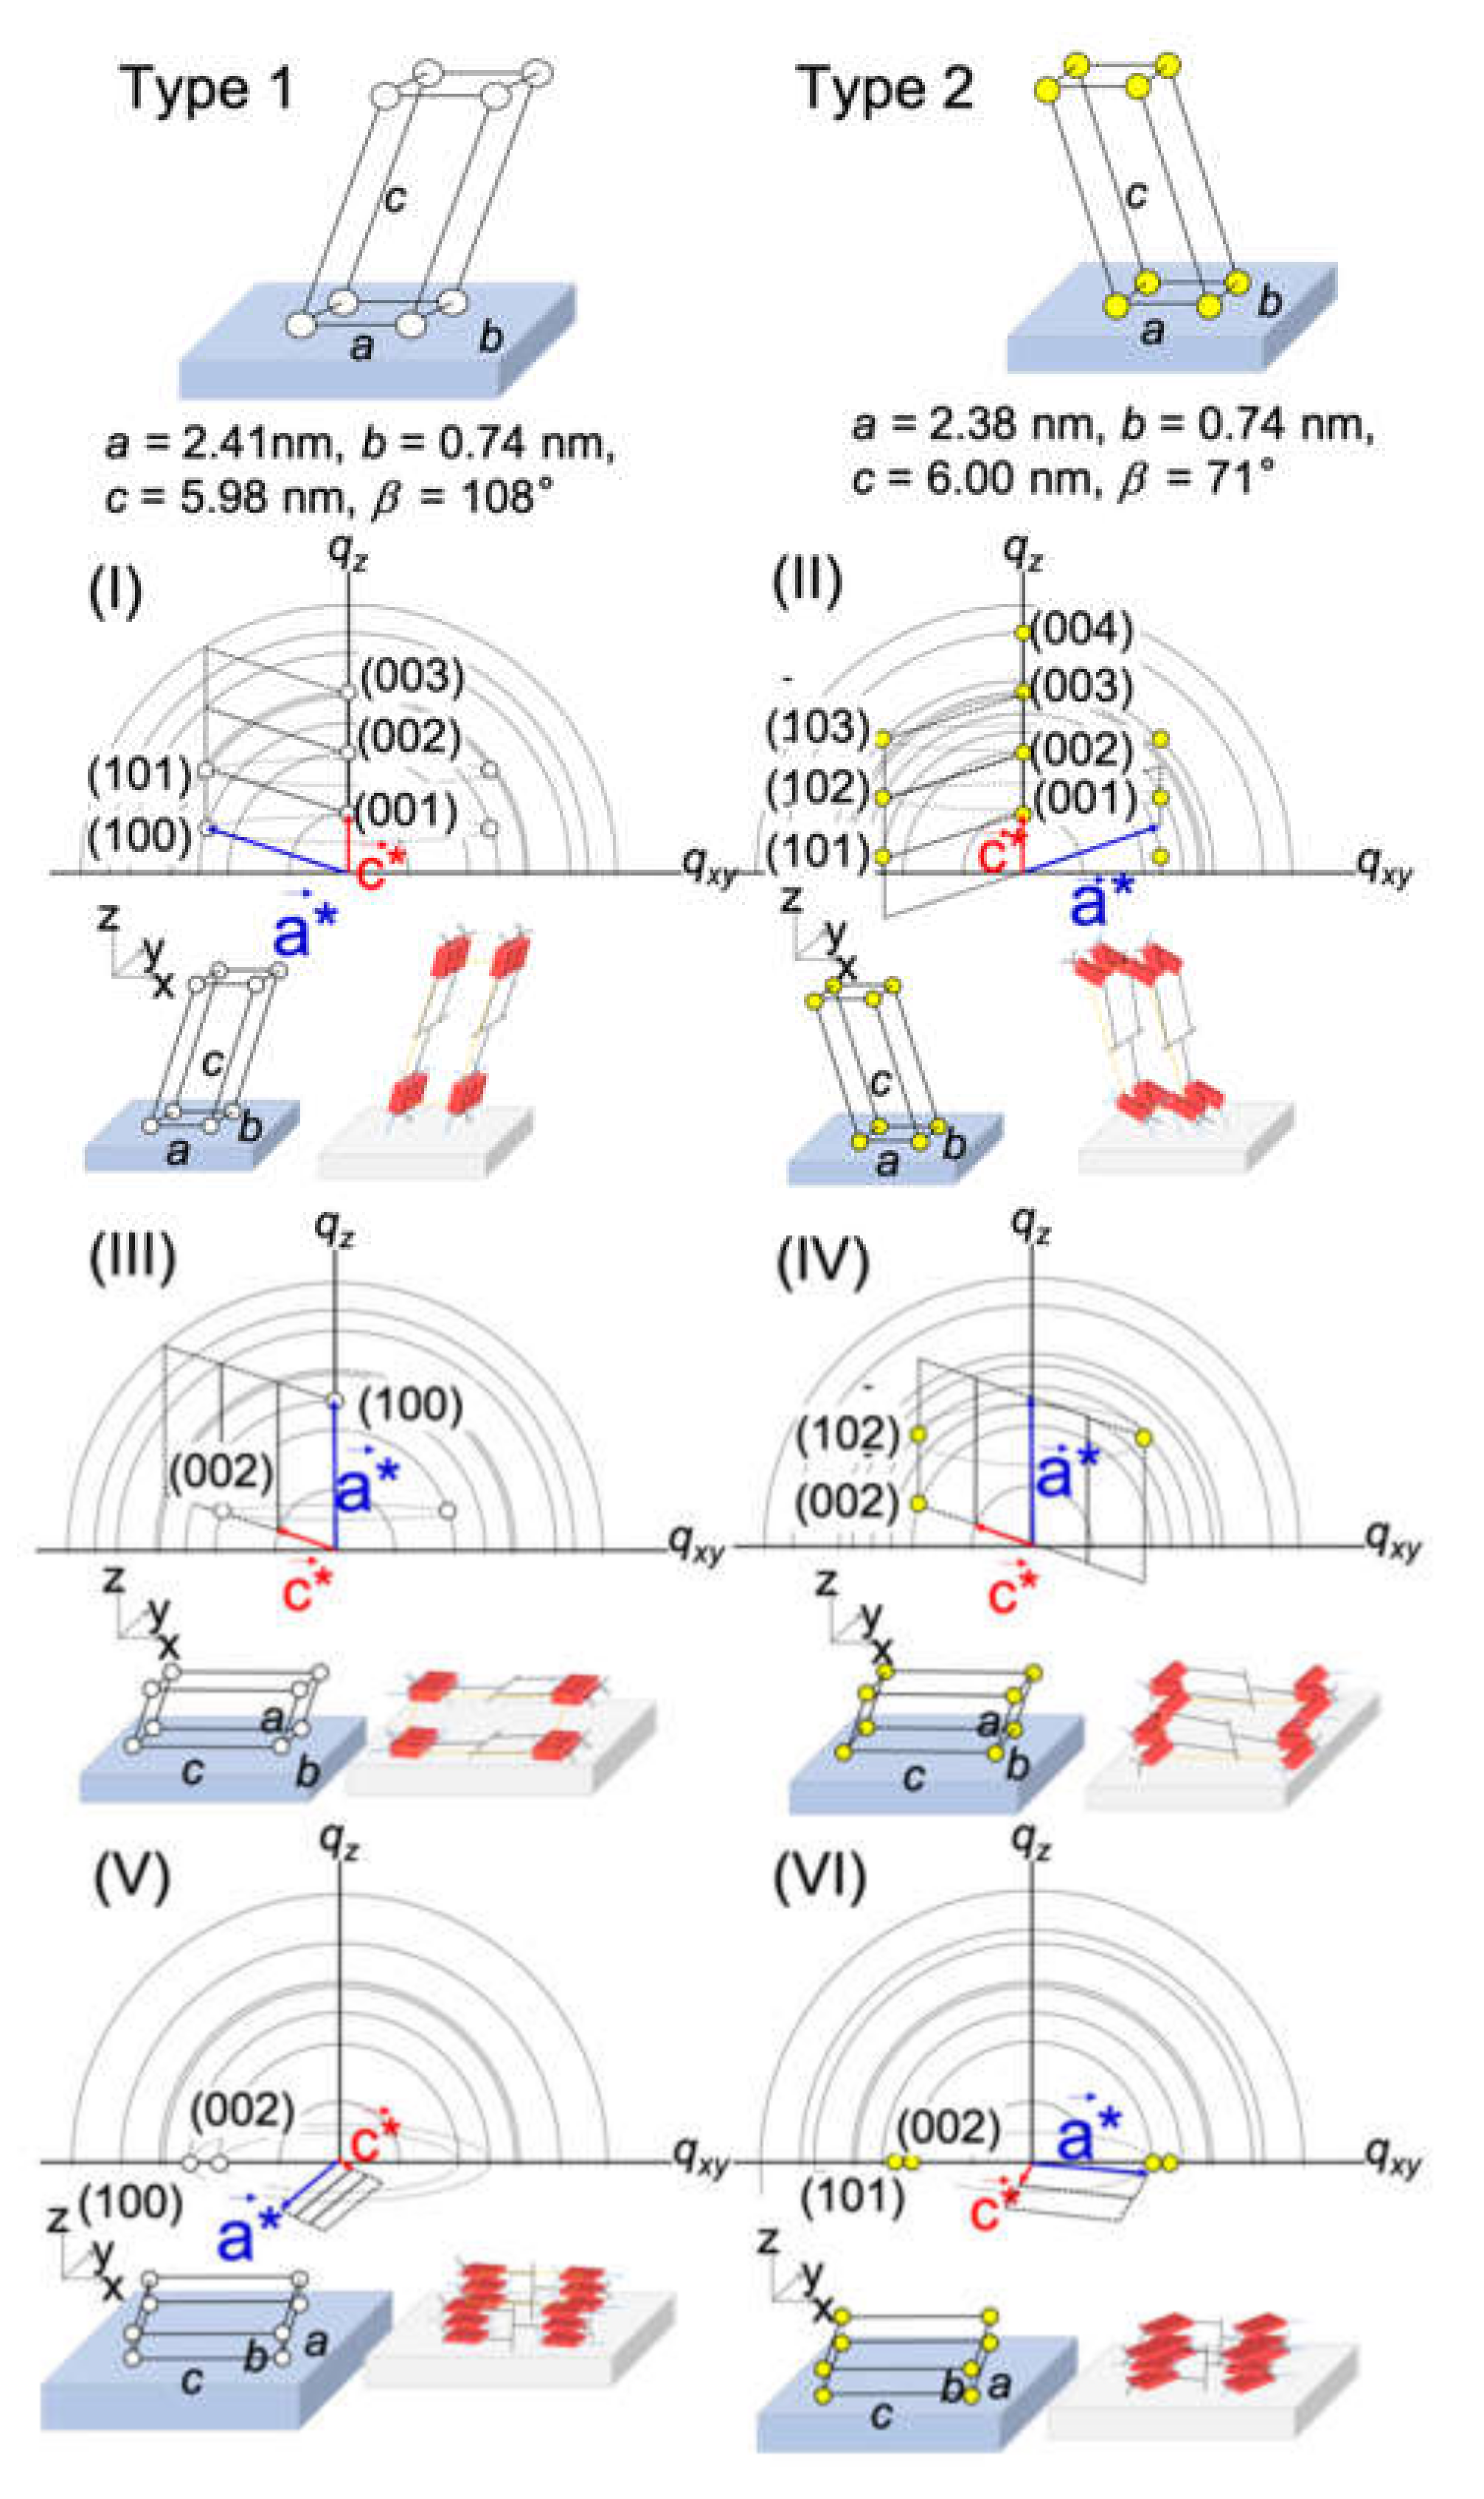
2.2. Surface Depth Profile Characterization of n-Type Semiconducting Polymer Thin Films by Grazing-Incidence Wide-Angle X-ray Scattering with Tender X-rays
3. X-ray Spectroscopy
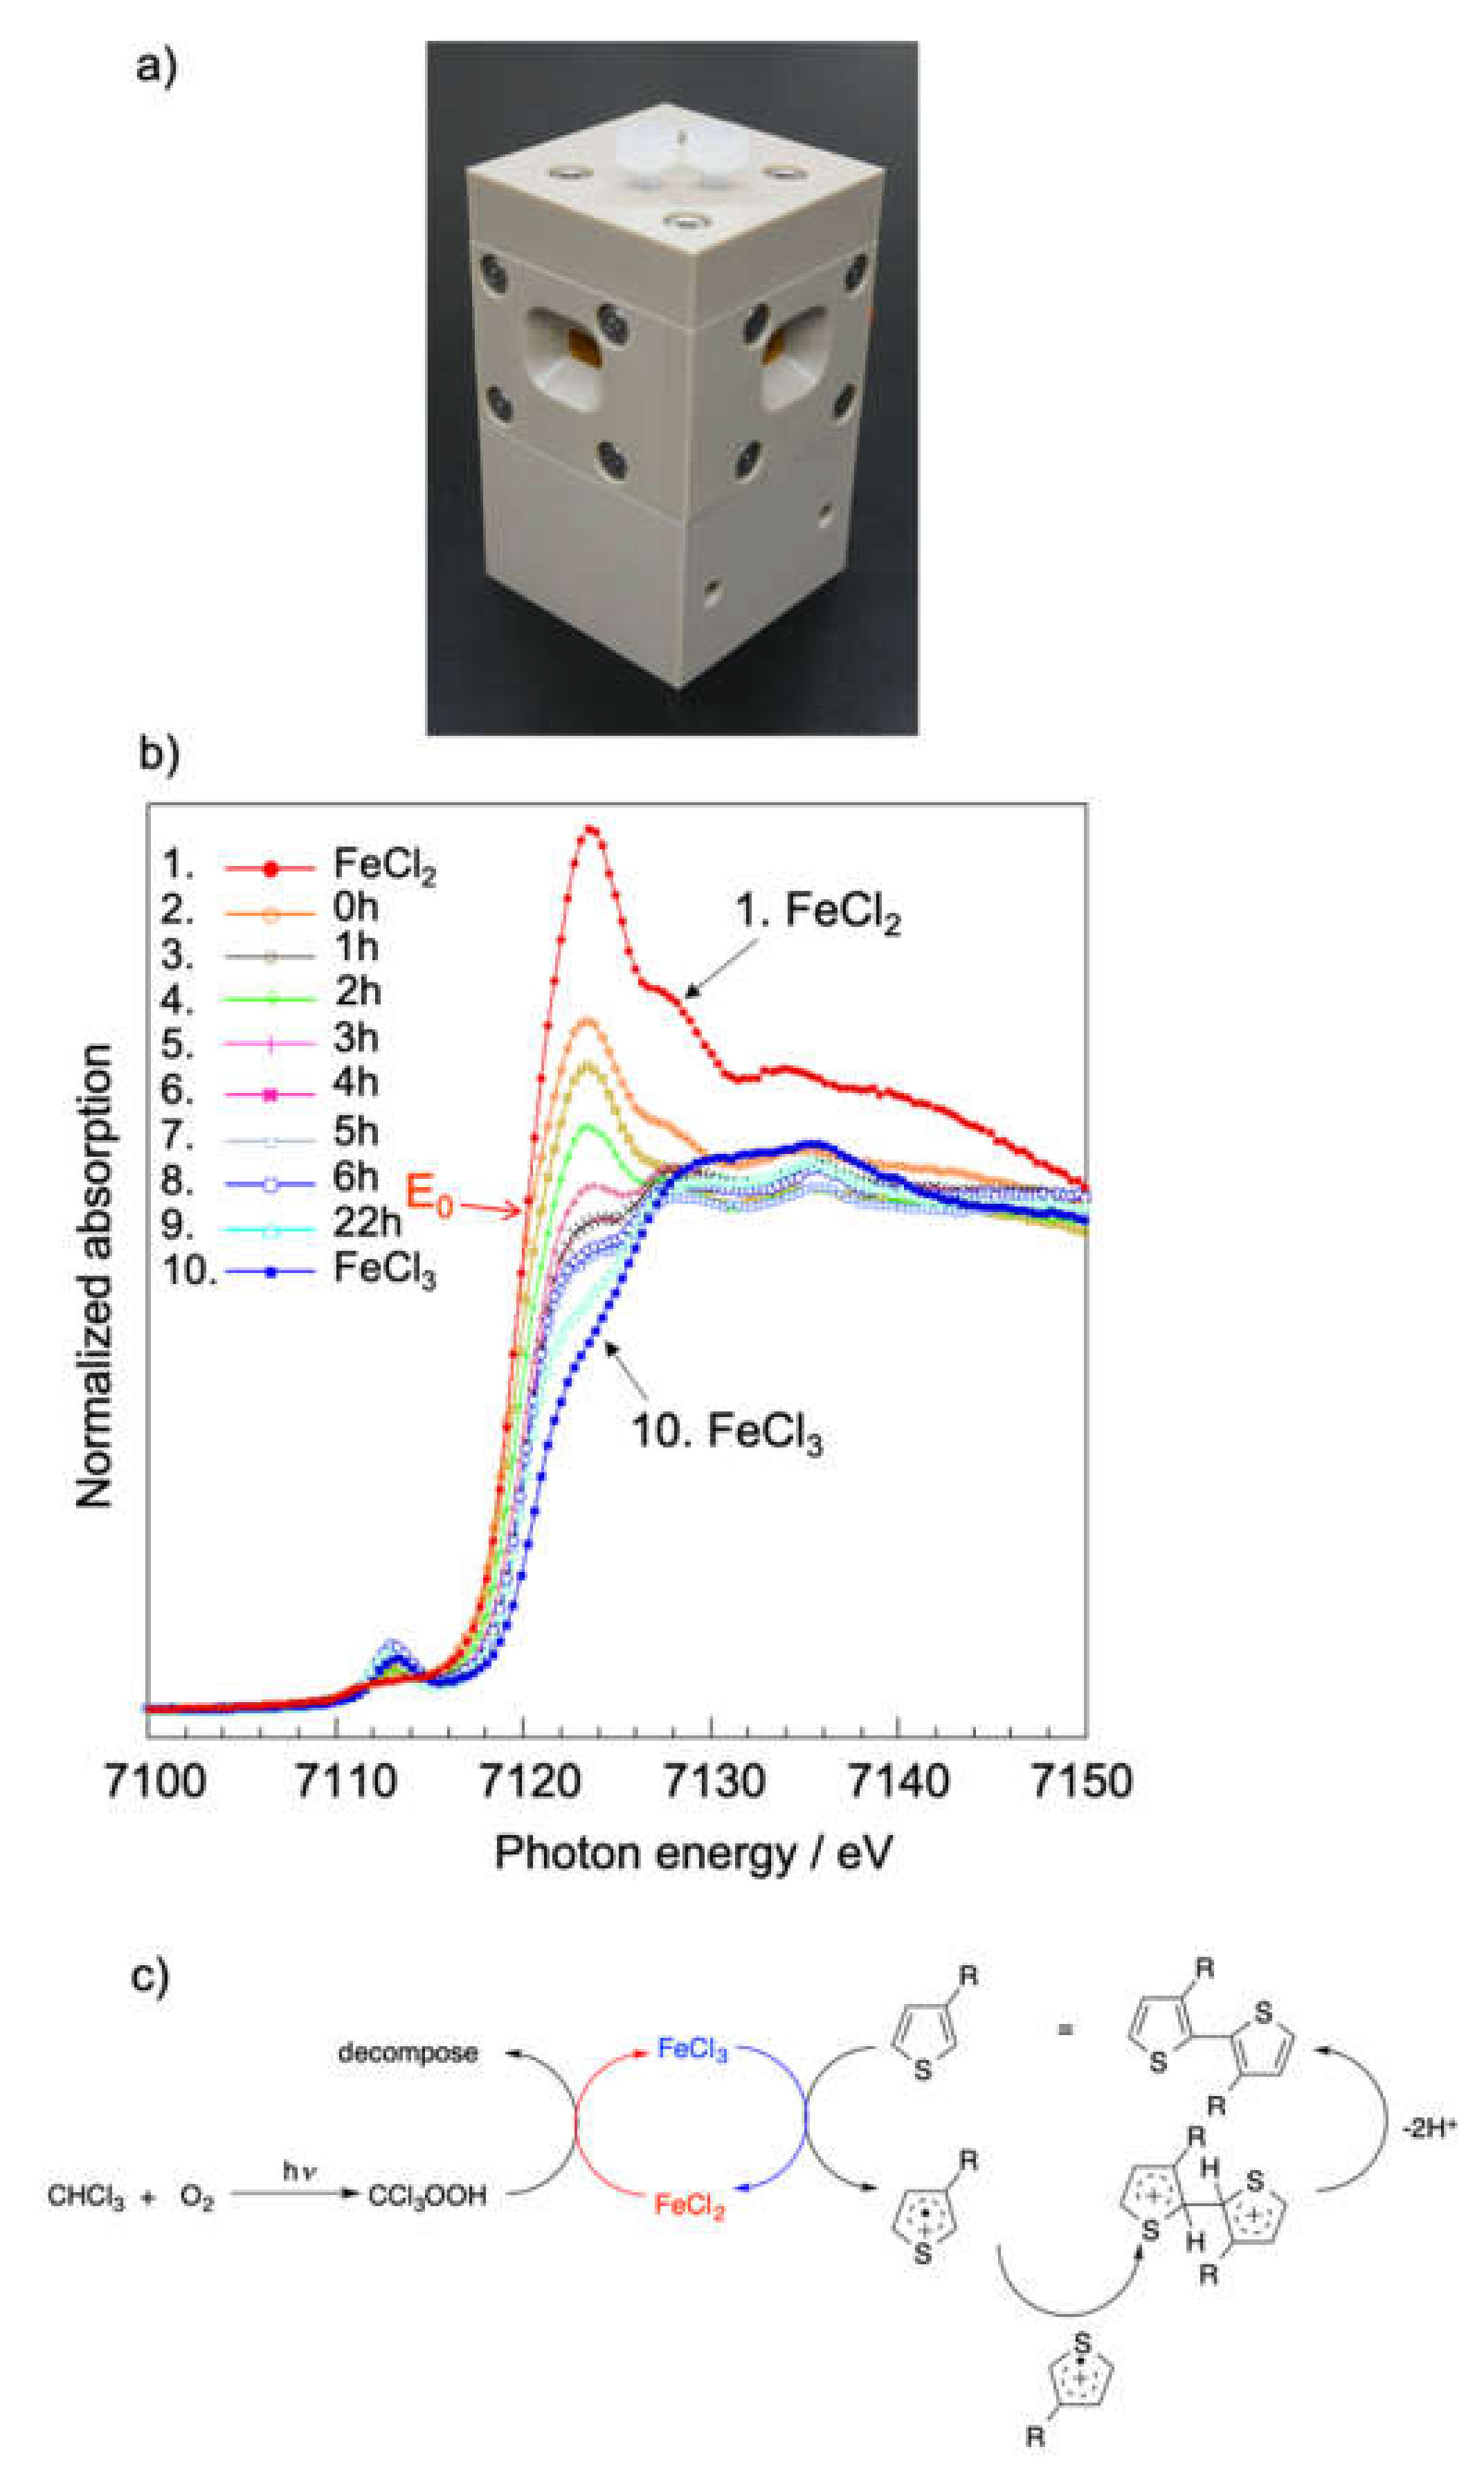
3.1. Clarification of Formation Mechanism for Poly(3-hexylthiophene) (P3HT) by X-ray Absorption Fine Structure (XAFS) Measurements
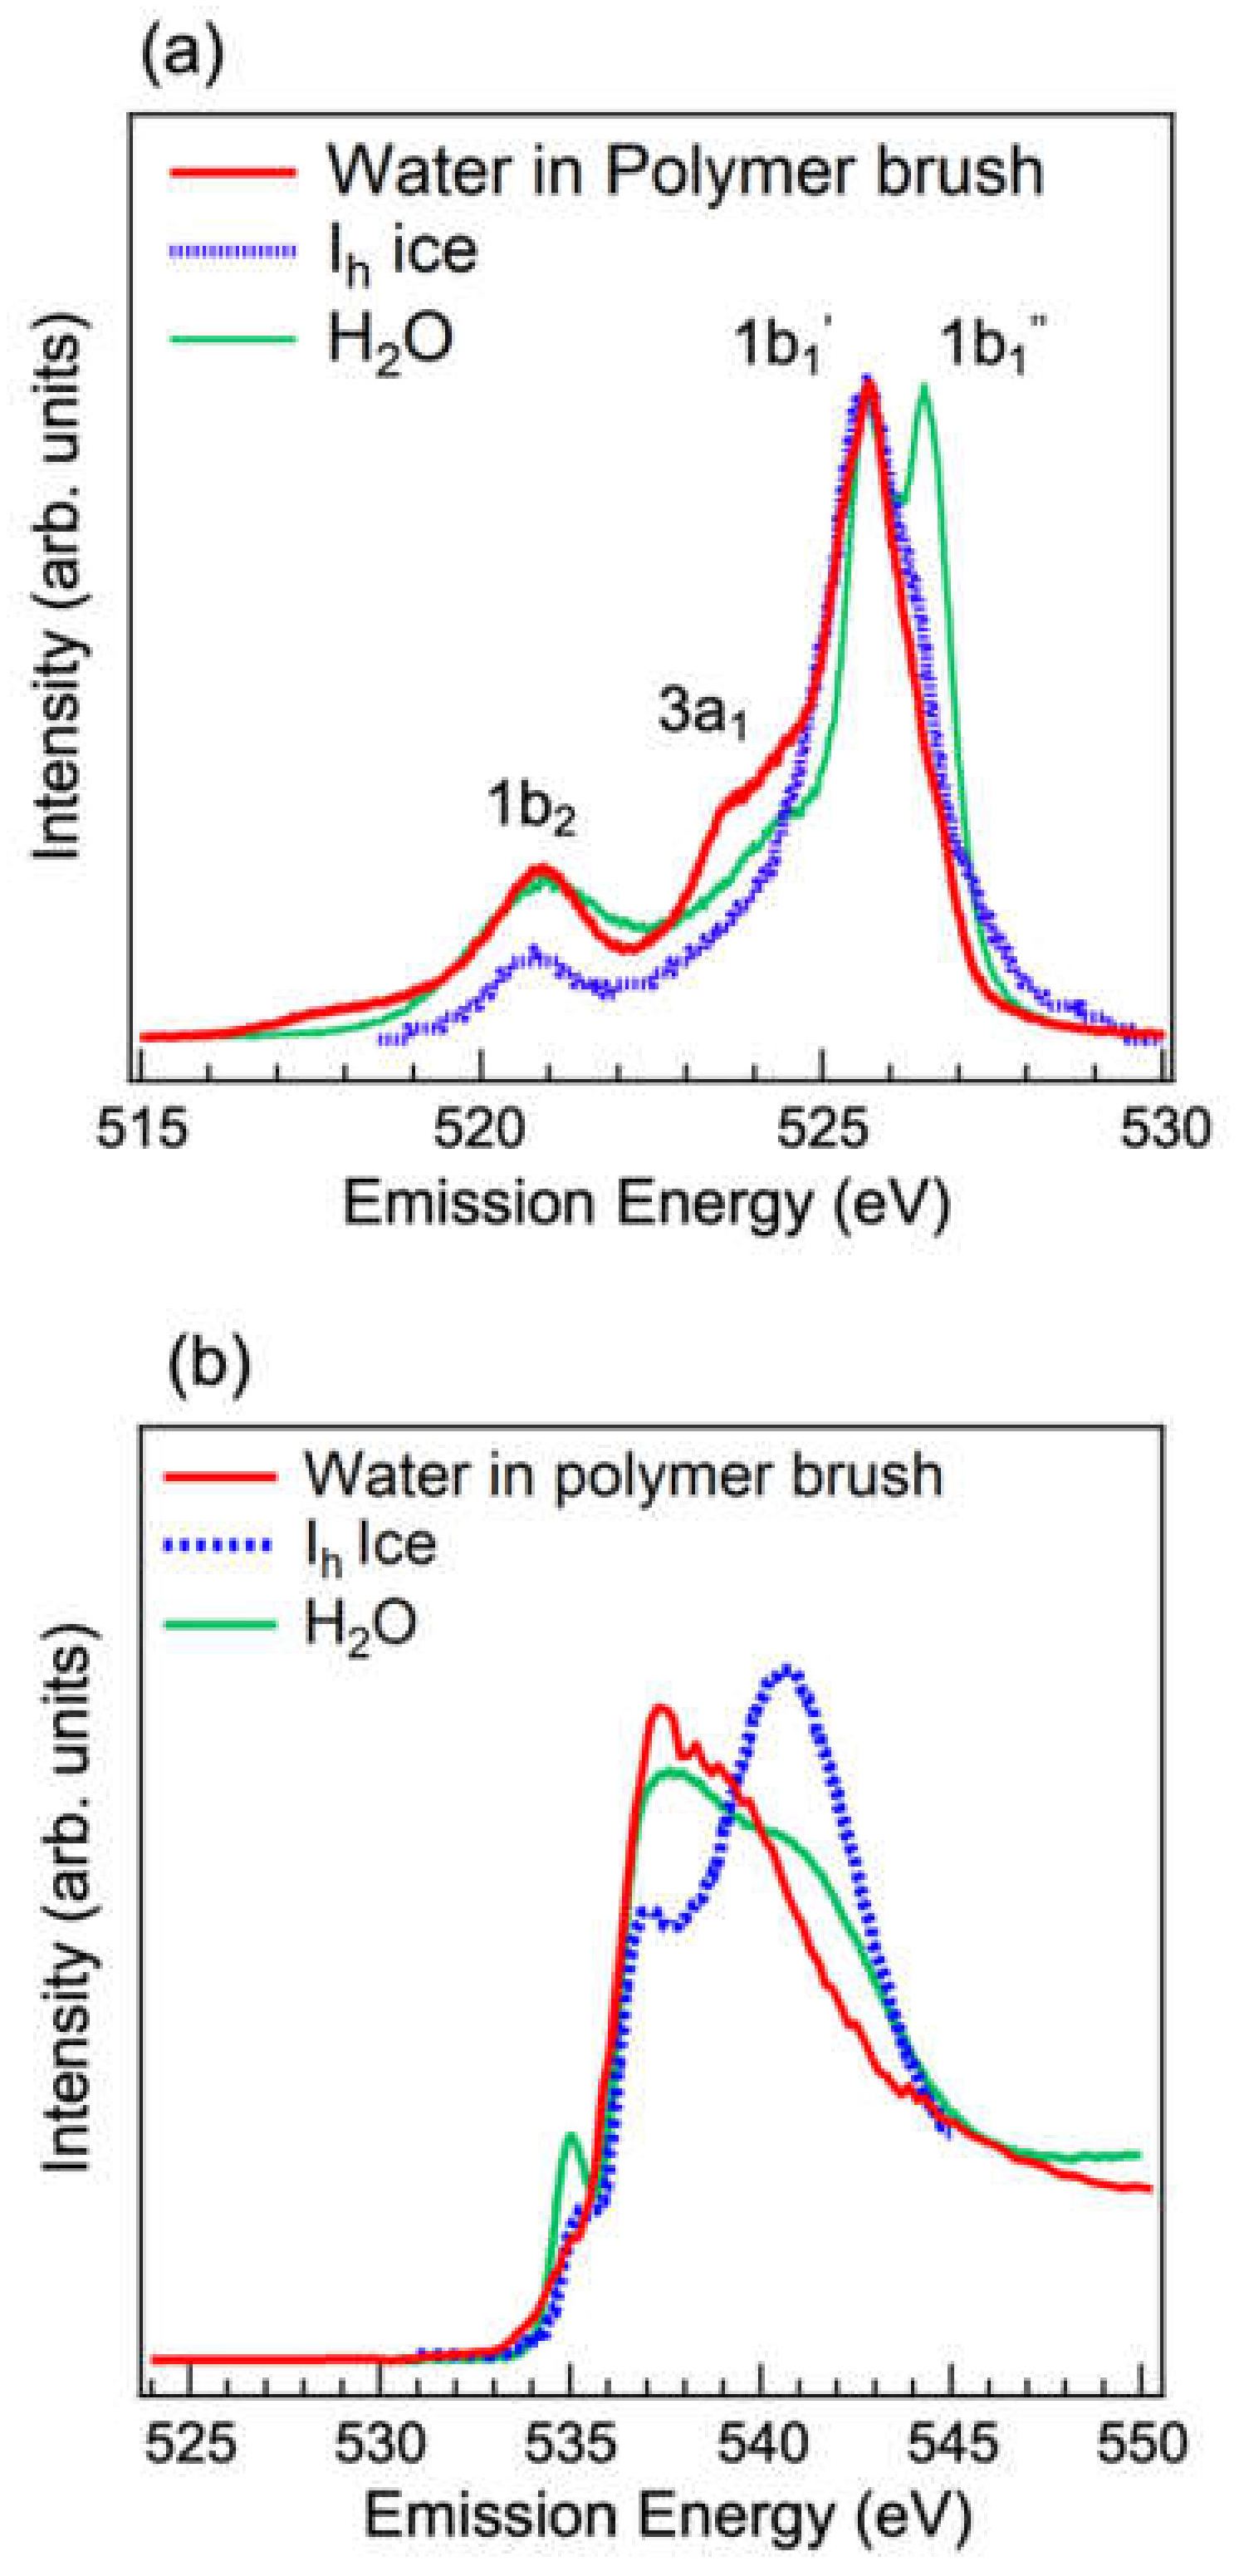
3.2. Analysis of Hydrogen-Bonded Network of Water Confined in Polyelectrolyte Brushes by Soft X-ray Absorption and Emission Spectroscopies
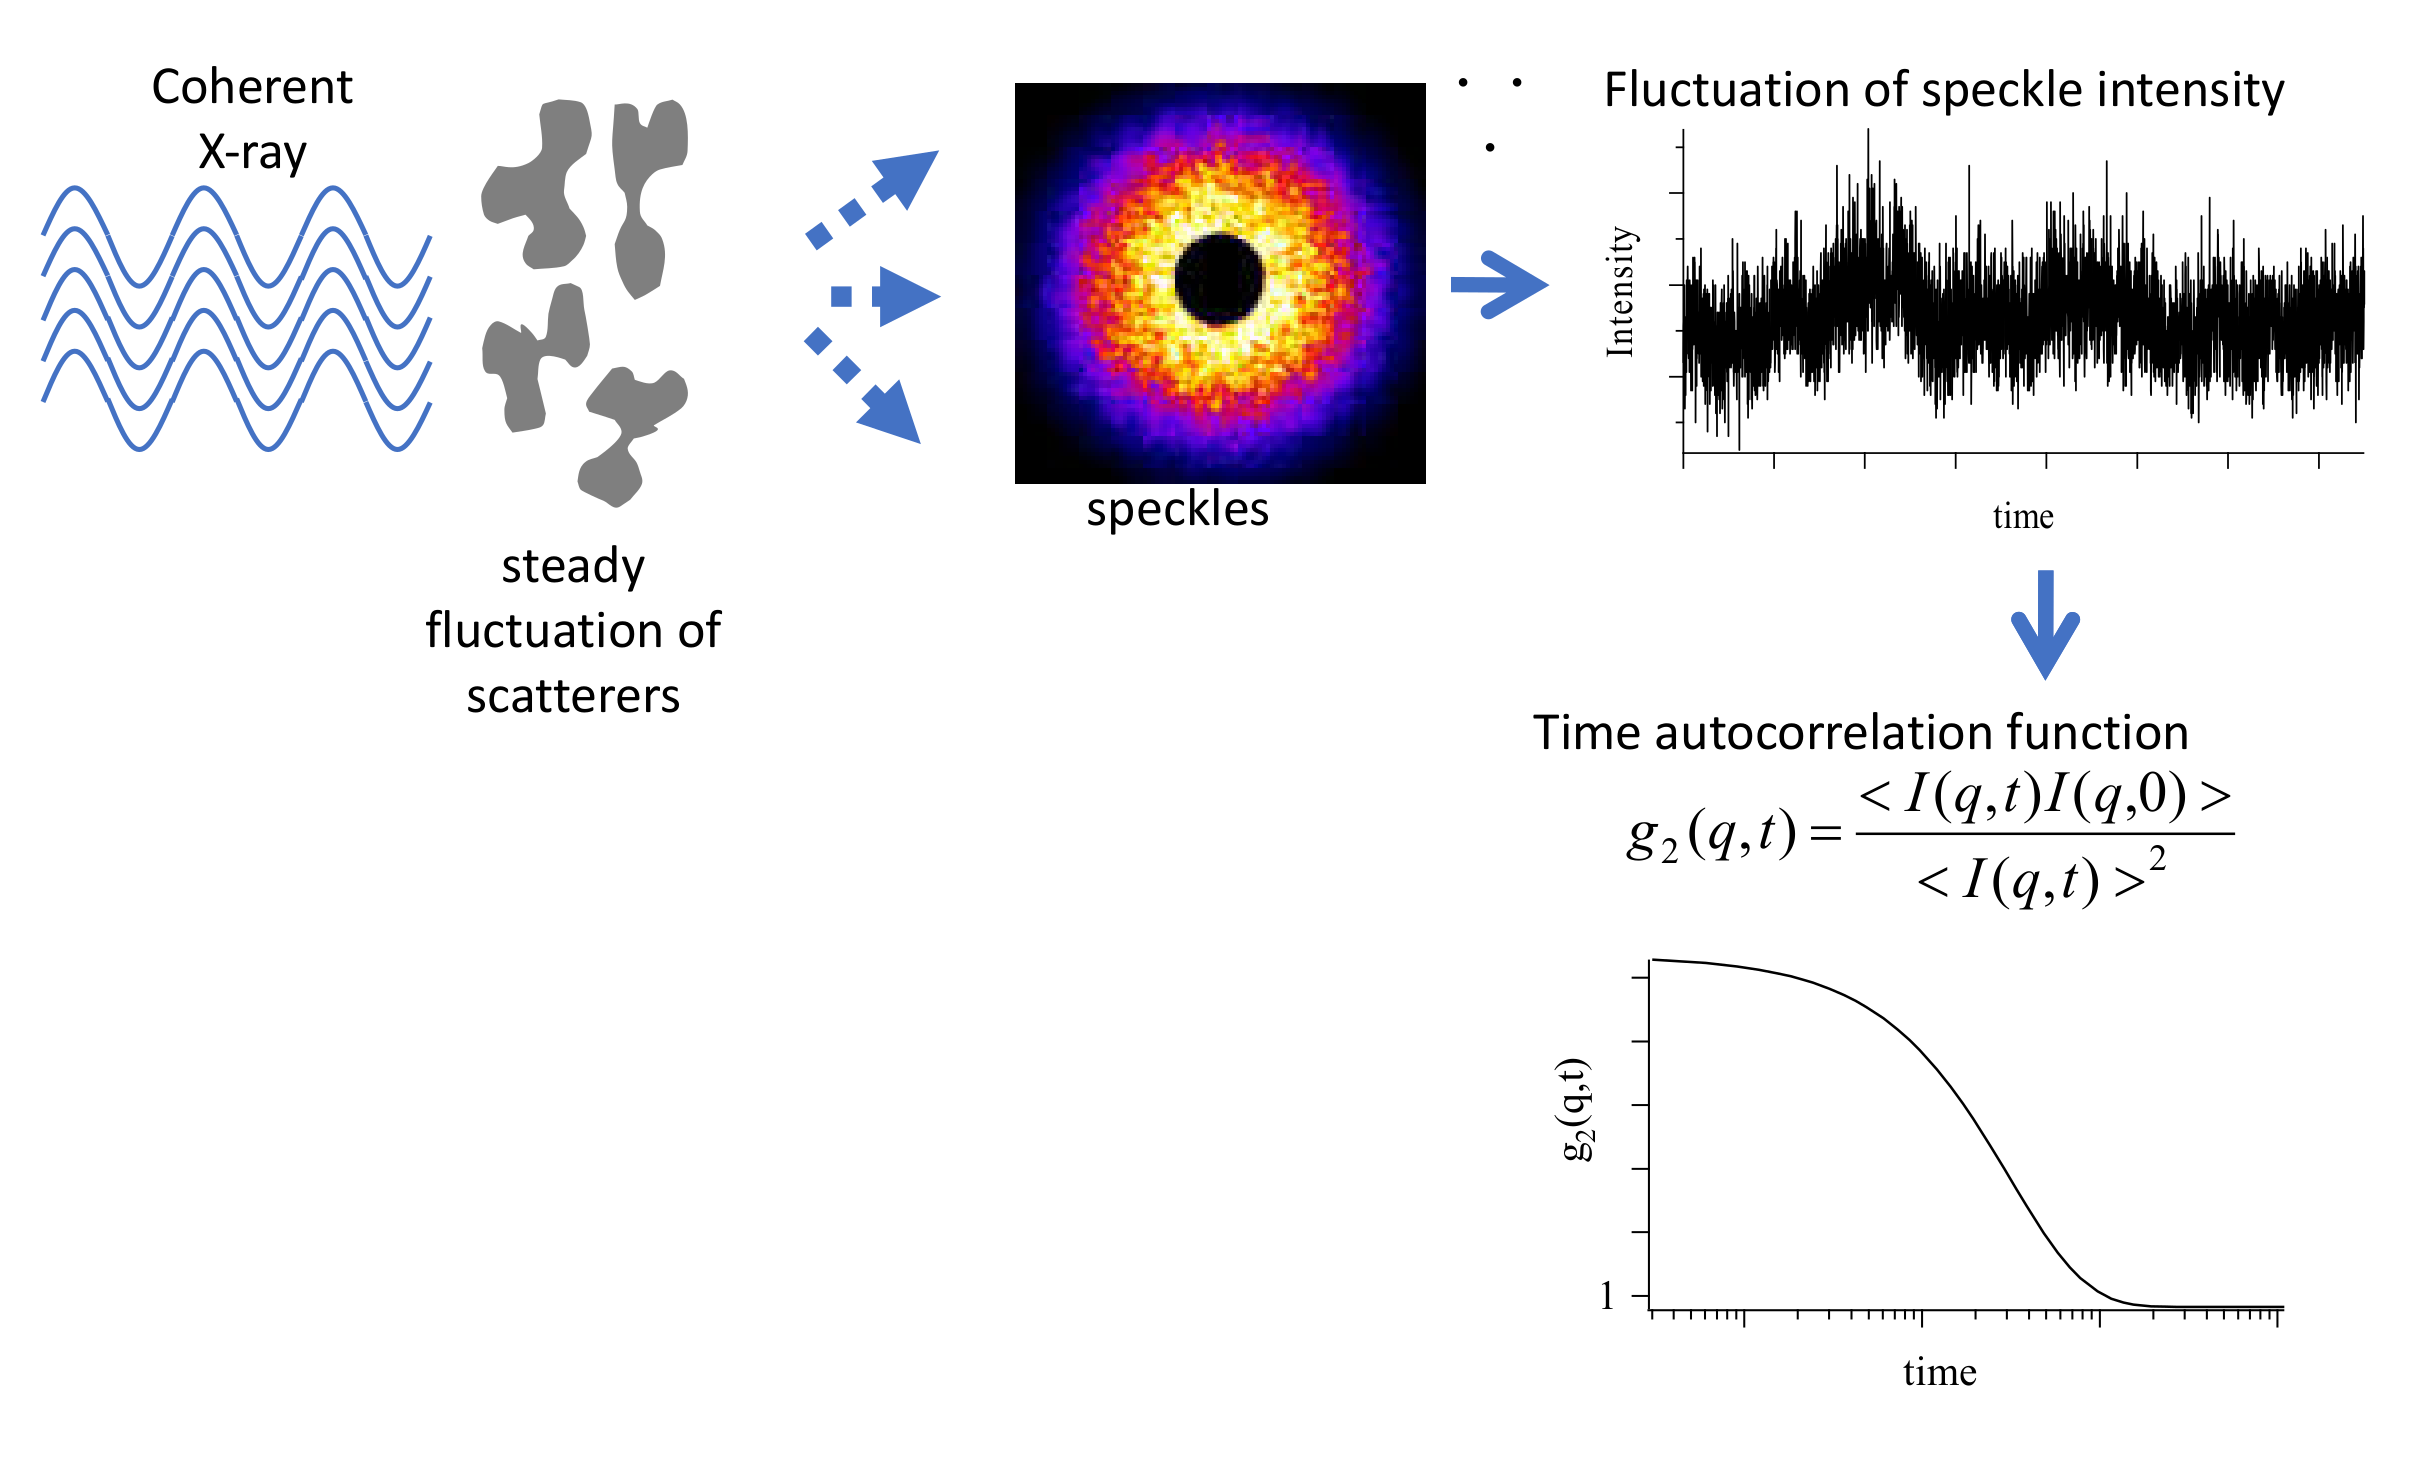
3.3. Analysis of Diffusion Behavior of Polystyrene-Grafted Nanoparticles in a Polystyrene Matrix by X-ray Photon Correlation Spectroscopy
4. Conclusions
Author Contributions
Funding
Acknowledgments
Conflicts of Interest
References
- Jeu, W.H.d. Basic X-Ray Scattering for Soft Matter; Oxford University Press: Oxford, UK, 2016. [Google Scholar]
- Als-Nielsen, J.; McMorrow, D. Elements of Modern X-Ray Physics; Wiley: New York, NY, USA, 2001. [Google Scholar]
- Roe, R.J. Methods of X-Ray and Neutron Scattering in Polymer Science; Oxford University Press: New York, NY, USA, 2000. [Google Scholar]
- Schneider, K.; Zafeiropoulos, N.E.; Stamm, M. In situ investigation of structural changes during deformation and fracture of polymers by synchrotron SAXS and WAXS. Adv. Eng. Mater. 2009, 11, 502–506. [Google Scholar] [CrossRef]
- Nozue, Y.; Shinohara, Y.; Ogawa, Y.; Sakurai, T.; Hori, H.; Kasahara, T.; Yamaguchi, N.; Yagi, N.; Amemiya, Y. Deformation Behavior of Isotactic Polypropylene Spherulite during Hot Drawing Investigated by Simultaneous Microbeam SAXS-WAXS and POM Measurement. Macromolecules 2007, 40, 2036–2045. [Google Scholar] [CrossRef]
- Portale, G.; Hermida-Merino, D.; Bras, W. Polymer research and synchrotron radiation perspectives. Eur. Polym. J. 2016, 81, 415–432. [Google Scholar] [CrossRef]
- Ishige, R. Precise structural analysis of polymer materials using synchrotron X-ray scattering and spectroscopic methods. Polym. J. 2020. [Google Scholar] [CrossRef]
- Hsieh, Y.-T.; Ishige, R.; Higaki, Y.; Woo, E.M.; Takahara, A. Microscopy and microbeam X-ray analyses in poly(3-hydroxybutyrate-co-3-hydroxyvalerate) with amorphous poly(vinyl acetate). Polymer 2014, 55, 6906–6914. [Google Scholar] [CrossRef]
- Kobayashi, D.; Hsieh, Y.-T.; Takahara, A. Interphase structure of carbon fiber reinforced polyamide 6 revealed by microbeam X-ray diffraction with synchrotron radiation. Polymer 2016, 89, 154–158. [Google Scholar] [CrossRef]
- Reynolds, J.R.; Thompson, B.C.; Skotheim, T.A. Conjugated Polymers: Properties, Processing, and Applications; CRC Press: Boca Raton, FL, USA, 2019. [Google Scholar]
- Williams, G.A.; Ishige, R.; Cromwell, O.R.; Chung, J.; Takahara, A.; Guan, Z. Mechanically Robust and Self-Healable Superlattice Nanocomposites by Self-Assembly of Single-Component “Sticky” Polymer-Grafted Nanoparticles. Adv. Mater. 2015, 27, 3934–3941. [Google Scholar] [CrossRef]
- Ohno, K.; Morinaga, T.; Takeno, S.; Tsujii, Y.; Fukuda, T. Suspensions of Silica Particles Grafted with Concentrated Polymer Brush: A New Family of Colloidal Crystals. Macromolecules 2006, 39, 1245–1249. [Google Scholar] [CrossRef]
- Ohno, K.; Morinaga, T.; Takeno, S.; Tsujii, Y.; Fukuda, T. Suspensions of Silica Particles Grafted with Concentrated Polymer Brush: Effects of Graft Chain Length on Brush Layer Thickness and Colloidal Crystallization. Macromolecules 2007, 40, 9143–9150. [Google Scholar] [CrossRef]
- Huang, Y.; Ishige, R.; Tsujii, Y.; Ohno, K. Synthesis of Iron Oxide Rods Coated with Polymer Brushes and Control of Their Assembly in Thin Films. Langmuir 2015, 31, 1172–1179. [Google Scholar] [CrossRef]
- Alder, B.J.; Wainwright, T.E. Phase transition for a hard-sphere system. J. Chem. Phys. 1957, 27, 1208. [Google Scholar] [CrossRef] [Green Version]
- Maes, J.; Castro, N.; De Nolf, K.; Walravens, W.; Abecassis, B.; Hens, Z. Size and concentration determination of colloidal nanocrystals by small-angle x-ray scattering. Chem. Mater. 2018, 30, 3952–3962. [Google Scholar] [CrossRef]
- Li, T.; Senesi, A.J.; Lee, B. Small Angle X-ray Scattering for Nanoparticle Research. Chem. Rev. 2016, 116, 11128–11180. [Google Scholar] [CrossRef] [PubMed]
- Yamamoto, S.; Ejaz, M.; Tsujii, Y.; Fukuda, T. Surface Interaction Forces of Well-Defined, High-Density Polymer Brushes Studied by Atomic Force Microscopy. 2. Effect of Graft Density. Macromolecules 2000, 33, 5608–5612. [Google Scholar] [CrossRef]
- Ishige, R.; Williams, G.A.; Higaki, Y.; Ohta, N.; Sato, M.; Takahara, A.; Guan, Z. In situ ultra-small-angle X-ray scattering study under uniaxial stretching of colloidal crystals prepared by silica nanoparticles bearing hydrogen-bonding polymer grafts. IUCrJ 2016, 3, 211–218. [Google Scholar] [CrossRef] [Green Version]
- Keiichi, O.; Takuya, M.; Yosuke, T.; Daisuke, I.; Masugu, S.; Norimichi, S. High-throughput and automated SAXS/USAXS experiment for industrial use at BL19B2 in SPring-8. AIP Conf. Proc. 2016, 1741. [Google Scholar] [CrossRef] [Green Version]
- Nakanishi, Y.; Ishige, R.; Ogawa, H.; Sakakibara, K.; Ohno, K.; Morinaga, T.; Sato, T.; Kanaya, T.; Tsujii, Y. USAXS analysis of concentration-dependent self-assembling of polymer-brush-modified nanoparticles in ionic liquid: [I] concentrated-brush regime. J. Chem. Phys. 2018, 148, 124902/124901–124902/124909. [Google Scholar] [CrossRef]
- Shimamoto, H.; Cheng, C.-H.; Kamitani, K.; Kojio, K.; Higaki, Y.; Takahara, A. Nanocomposite Elastomers Composed of Silica Nanoparticles Grafted with a Comb-Shaped Copolymer Brush. Macromolecules 2019, 52, 5963–5970. [Google Scholar] [CrossRef]
- Yang, X. (Ed.) Semiconducting Polymer Composites: Principles, Morphologies, Properties and Applications; Wiley-VCH Verlag GmbH & Co. KGaA: Weinheim, Germany, 2012. [Google Scholar]
- Sommer, M.; Lang, A.S.; Thelakkat, M. Crystalline-crystalline donor-acceptor block copolymers. Angew. Chem. Int. Ed. 2008, 47, 7901–7904. [Google Scholar] [CrossRef]
- Kim, Y.Y.; Ree, B.J.; Kido, M.; Ko, Y.G.; Ishige, R.; Hirai, T.; Wi, D.; Kim, J.; Kim, W.J.; Takahara, A.; et al. High-Performance n-Type Electrical Memory and Morphology-Induced Memory-Mode Tuning of a Well-Defined Brush Polymer Bearing Perylene Diimide Moieties. Adv. Electron. Mater. 2015, 1. [Google Scholar] [CrossRef]
- Kido, M.; Nojima, S.; Ishige, R.; White, K.L.; Kamitani, K.; Ohta, N.; Hirai, T.; Takahara, A. Effect of Molecular Weight on Microcrystalline Structure Formation in Polymer with Perylenediimide Side Chain. J. Polym. Sci. Partb Polym. Phys. 2016, 54, 2275–2283. [Google Scholar] [CrossRef]
- Mueller-Buschbaum, P. GISAXS and GISANS as metrology technique for understanding the 3D morphology of block copolymer thin films. Eur. Polym. J. 2016, 81, 470–493. [Google Scholar] [CrossRef]
- Smilgies, D.M.; Busch, P.; Papadakis, C.M.; Posselt, D. Characterization of Polymer Thin Films with Small-Angle X-ray Scattering under Grazing Incidence (GISAXS). Synchrotron Radiat. News 2002, 15. [Google Scholar] [CrossRef]
- Kamitani, K.; Hamada, A.; Yokomachi, K.; Ninomiya, K.; Uno, K.; Mukai, M.; Konishi, Y.; Ohta, N.; Nishibori, M.; Hirai, T.; et al. Depth-Resolved Characterization of Perylenediimide Side-Chain Polymer Thin Film Structure Using Grazing-Incidence Wide-Angle X-ray Diffraction with Tender X-rays. Langmuir 2018, 34, 8516–8521. [Google Scholar] [CrossRef]
- Smilgies, D.-M. Scherrer grain-size analysis adapted to grazing-incidence scattering with area detectors. J. Appl. Crystallogr. 2013, 46, 286. [Google Scholar] [CrossRef] [Green Version]
- Yokoyama, A.; Miyakoshi, R.; Yokozawa, T. Chain-growth polymerization for poly(3-hexylthiophene) with a defined molecular weight and a low polydispersity. Macromolecules 2004, 37, 1169–1171. [Google Scholar] [CrossRef]
- Sheina, E.E.; Liu, J.S.; Iovu, M.C.; Laird, D.W.; McCullough, R.D. Chain growth mechanism for regioregular nickel-initiated cross-coupling polymerizations. Macromolecules 2004, 37, 3526–3528. [Google Scholar] [CrossRef]
- Sugimoto, R.; Takeda, S.; Gu, H.B.; Yoshino, K. Preparation of soluble polythiophene derivatives utilizing transition metal halides as catalysts and their property. Chem. Express 1986, 1, 635–638. [Google Scholar]
- Hirai, T.; Sato, M.; Kido, M.; Nagae, Y.; Kaetsu, K.; Kiyoshima, Y.; Fujii, S.; Ohishi, T.; White, K.L.; Higaki, Y.; et al. X-Ray Absorption Fine Structure Study on the Role of Solvent on Polymerization of 3-Hexylthiophene with Solid FeCl3 Particles. J. Polym. Sci. Part A Polym. Chem. 2015, 53, 2075–2078. [Google Scholar] [CrossRef]
- Hirai, T.; Nagae, Y.; White, K.L.; Kamitani, K.; Kido, M.; Uchiyama, T.; Nishibori, M.; Konishi, Y.; Yokomachi, K.; Sugimoto, R.; et al. Solvent free oxidative coupling polymerization of 3-hexylthiophene (3HT) in the presence of FeCl3 particles. Rsc Adv. 2016, 6, 111993–111996. [Google Scholar] [CrossRef]
- Ball, P. Water as an Active Constituent in Cell Biology. Chem. Rev. 2008, 108, 74–108. [Google Scholar] [CrossRef] [PubMed]
- Akira Suzuki, H.Y. Crystallization of Confined Water Pools with Radii Greater Than 1 nm in AOT Reverse Micelles. Langmuir 2014, 30, 7274–7282. [Google Scholar] [CrossRef] [PubMed]
- Bernardina, S.D.; Paineau, E.; Brubach, J.-B.; Judeinstein, P.; Rouziere, S.; Launois, P.; Roy, P. Water in Carbon Nanotubes: The Peculiar Hydrogen Bond Network Revealed by Infrared Spectroscopy. J. Am. Ceram. Soc. 2016, 138, 10437–10443. [Google Scholar] [CrossRef] [PubMed]
- Nijem, N.; Canepa, P.; Kaipa, U.; Tan, K.; Roodenko, K.; Tekarli, S.; Halbert, J.; Oswald, I.W.H.; Arvapally, R.K.; Yang, C.; et al. Water Cluster Confinement and Methane Adsorption in the Hydrophobic Cavities of a Fluorinated Metal−Organic Framework. J. Am. Chem. Soc. 2013, 135, 12615–12626. [Google Scholar] [CrossRef] [PubMed]
- Imada, H.; Kimura, K.; Onishi, H. Water and 2-Propanol Structured on Calcite (104) Probed by Frequency-Modulation Atomic Force Microscopy. Langmuir 2013. [Google Scholar] [CrossRef]
- Mondal, J.A.; Nihonyanagi, S.; Yamaguchi, S.; Tahara, T. Structure and Orientation of Water at Charged Lipid Monolayer/Water Interfaces Probed by Heterodyne-Detected Vibrational Sum Frequency Generation Spectroscopy. J. Am. Chem. Soc. 2010, 132, 10656–10657. [Google Scholar] [CrossRef]
- Yamazoe, K.; Higaki, Y.; Inutsuka, Y.; Miyawaki, J.; Cui, Y.-T.; Takahara, A.; Harada, Y. Enhancement of the Hydrogen-Bonding Network of Water Confined in a Polyelectrolyte Brush. Langmuir 2017, 33, 3954–3959. [Google Scholar] [CrossRef]
- Tokushima, T.; Harada, Y.; Takahashi, O.; Senba, Y.; Ohashi, H.; Pettersson, L.G.M.; Nilsson, A.; Shin, S. High resolution X-ray emission spectroscopy of liquid water: The observation of two structural motifs. Chem. Phys. Lett. 2008, 460, 387–400. [Google Scholar] [CrossRef]
- Huang, C.; Wikfeldt, K.T.; Tokushima, T.; Nordlund, D.; Harada, Y.; Bergmann, U.; Niebuhr, M.; Weiss, T.M.; Horikawa, Y.; Leetmaa, M.; et al. The inhomogeneous structure of water at ambient conditions. Proc. Natl. Acad. Sci. USA 2009, 106, 15214–15218. [Google Scholar] [CrossRef] [Green Version]
- Nilsson, A.; Nordlund, D.; Waluyo, I.; Huang, N.; Ogasawara, H.; Kaya, S.; Bergmann, U.; Näslund, L.Ã.N.; Öström, H.; Wernet, P.; et al. X-ray absorption spectroscopy and X-ray Raman scattering of water and ice;an experimental view. J. Electron. Spectrosc. Relat. Phenom. 2010, 177, 99–129. [Google Scholar] [CrossRef] [Green Version]
- Nilsson, A.; Pettersson, L.G.M. The structural origin of anomalous properties of liquid water. Nat. Commun. 2015, 6, 8998. [Google Scholar] [CrossRef] [PubMed] [Green Version]
- Fransson, T.; Harada, Y.; Kosugi, N.; Nicholas, A.B.; Winter, B.; Rehr, J.J.; Pettersson, L.G.M.; Nilsson, A. X--ray and Electron Spectroscopy of Water. Chem. Rev. 2016, 116, 7551–7569. [Google Scholar] [CrossRef] [PubMed]
- Kobayashi, M.; Terayama, Y.; Kikuchi, M.; Takahara, A. Chain dimensions and surface characterization of superhydrophilic polymer brushes with zwitterion side groups. Soft Matter 2013, 9, 5138–5148. [Google Scholar] [CrossRef]
- Kobayashi, M.; Terayama, Y.; Yamaguchi, H.; Terada, M.; Murakami, D.; Ishihara, K.; Takahara, A. Wettability and Antifouling Behavior on the Surfaces of Superhydrophilic Polymer Brushes. Langmuir 2012, 28, 7212–7222. [Google Scholar] [CrossRef] [PubMed]
- Harada, Y.; Kobayashi, M.; Niwa, H.; Senba, Y.; Ohashi, H.; Tokushima, T.; Horikawa, Y.; Shin, S.; Oshima, M. Ultrahigh resolution soft x-ray emission spectrometer at BL07LSU in SPring-8. Rev. Sci. Instrum. 2012, 83, 013116/013111–013116/013116. [Google Scholar] [CrossRef] [Green Version]
- Murakami, D.; Kobayashi, M.; Moriwaki, T.; Ikemoto, Y.; Jinnai, H.; Takahara, A. Spreading and Structuring of Water on Superhydrophilic Polyelectrolyte Brush Surfaces. Langmuir 2013, 29, 1148–1151. [Google Scholar] [CrossRef]
- Borsali, R.; Pecora, R. Soft-Matter Characterization, 1st ed.; Springer: New York, NY, USA, 2008. [Google Scholar]
- Hoshino, T.; Kikuchi, M.; Murakami, D.; Harada, Y.; Mitamura, K.; Ito, K.; Tanaka, Y.; Sasaki, S.; Takata, M.; Jinnai, H.; et al. X-ray photon correlation spectroscopy using a fast pixel array detector with a grid mask resolution enhancer. J. Synchrotron Radiat. 2012, 19, 988–993. [Google Scholar] [CrossRef] [Green Version]
- Duri, A.; Cipelletti, L. Length scale dependence of dynamical heterogeneity in a colloidal fractal gel. Europhys. Lett. 2006, 76, 972–978. [Google Scholar] [CrossRef] [Green Version]
- Hoshino, T.; Murakami, D.; Tanaka, Y.; Takata, M.; Jinnai, H.; Takahara, A. Dynamical crossover between hyperdiffusion and subdiffusion of polymer-grafted nanoparticles in a polymer matrix. Phys. Rev. E 2013, 88, 032602/032601–032602/032607. [Google Scholar] [CrossRef]


| Incidence Angle °/Penetration Depth nm | (I)/% | (II)/% | (III)/% | (IV)/% | (V)/% | (VI)/% |
|---|---|---|---|---|---|---|
| 0.2°/4 nm | 100 | 0.0 | 0.0 | 0.0 | 0.0 | 0.0 |
| 0.4°/8 nm | 100 | 0.0 | 0.0 | 0.0 | 0.0 | 0.0 |
| 0.45°/11 nm | 93.6 | 0.0 | 6.4 | 0.0 | 0.0 | 0.0 |
| 0.5°/25 nm | 84.3 | 1.9 | 13.8 | 0.0 | 0.0 | 0.0 |
| 0.55°/50 nm | 56.1 | 2.9 | 3.5 | 0.7 | 26.4 | 10.5 |
| 0.6°/120 nm | 17.8 | 1.0 | 2.4 | 0.8 | 49.6 | 28.4 |
© 2020 by the authors. Licensee MDPI, Basel, Switzerland. This article is an open access article distributed under the terms and conditions of the Creative Commons Attribution (CC BY) license (http://creativecommons.org/licenses/by/4.0/).
Share and Cite
Takahara, A.; Higaki, Y.; Hirai, T.; Ishige, R. Application of Synchrotron Radiation X-ray Scattering and Spectroscopy to Soft Matter. Polymers 2020, 12, 1624. https://doi.org/10.3390/polym12071624
Takahara A, Higaki Y, Hirai T, Ishige R. Application of Synchrotron Radiation X-ray Scattering and Spectroscopy to Soft Matter. Polymers. 2020; 12(7):1624. https://doi.org/10.3390/polym12071624
Chicago/Turabian StyleTakahara, Atsushi, Yuji Higaki, Tomoyasu Hirai, and Ryohei Ishige. 2020. "Application of Synchrotron Radiation X-ray Scattering and Spectroscopy to Soft Matter" Polymers 12, no. 7: 1624. https://doi.org/10.3390/polym12071624