1. Introduction
Complex mixtures of soft materials, used in industrial formulations, are often plagued by the migration of the small molecular weight component to the interface open to atmosphere [
1]. Such “surface segregation” of the active ingredients in a formulation leads to loss of function in a variety of our daily products [
2,
3] e.g., adhesive loss in feminine and hygiene care products, flaking behaviour of paints, and blooming of fat in chocolate. The basic phenomenology of surface segregation/wetting can be understood in a model binary polymer mixture of different molecular weights and a surface exposed to atmosphere. The surface composition of a mixture is determined by the balance between their relative surface energies and the the inter-facial energy between the two phases [
4]. A loss of entropy and gain in surface energy of a molecule dictates the equilibrium surface fraction.
For well-mixed systems having a free surface, the segregation profile with oligomer concentration monotonically decreasing as a function of depth
is observed. In contrast, a macroscopic wetting layer forms, with wetting layer thickness
100–200 nm, for systems for which the bulk thermodynamic phase is de-mixed [
5,
6,
7]. The classic experiments demonstrating surface directed spinodal decomposition (SDSD) were performed on an unstable polymer mixture of PEP and dPEP having a free surface, which preferentially attracts dPEP [
8,
9,
10]. While these experiments have been performed for 50:50 polymeric mixtures, where both polymers have similar lengths, we are interested in studying migration kinetics in asymmetric mixtures (both in terms of chain length and composition), where the oligomer concentration is small. Mean field (MFT) [
11] and self-consistent field theories (SCFT) that combine the bulk thermodynamics of polymer mixtures with that of a surface expressed in terms of phenomenological free energy functionals have been employed to compute the surface migrant fraction and wetting layer thickness for well mixed and de-mixed systems with moderate success. These thermodynamic theories, however, do not describe how the migrant concentration profiles and wetting layers evolve as a function of time [
12,
13].
The kinetics of surface-directed spinodal decomposition (SDSD) is a rich non-equilibrium, many-body phenomena where the dynamic effects of surface wetting and bulk phase separation are coupled in a non-trivial fashion [
14,
15,
16,
17,
18,
19]. An early time surface interaction specific growth law that leads to late time LSW kinetics is observed for the minority component being attracted by the surface [
19]. Experiments for SDSD for
systems show that the wetting layer thickness grows logarithmically as a function of time for a shallow quench and follows [
20,
21] LSW growth for a deep quench. Several factors, e.g., surface adsorption [
22,
23], surface roughness [
24,
25], and confinement, can modify surface migration kinetics in polymer mixtures leading to novel phenomena, e.g., lateral phase separation [
25,
26].
Within the biological milieu, the phase separation of proteins within living cells is a very active area of research [
27,
28]. While the physics of droplet growth is well studied when the surrounding matrix is a simple liquid, relatively little is known about droplet growth kinetics in an elastic environment like the cell cytoplasm. This is an exciting recent area with lots of experimental activity [
29,
30] but relatively scant theoretical understanding. In an earlier theoretical study [
31], we showed that increasing the bulk modulus of a gel–oligomer mixture causes a dramatic reduction in the surface fraction of migrant molecules. The wetting transition observed for de-mixed systems can also be avoided. This study was based on a mean field analysis of a phenomenological free energy functional. We augment this study with CGMD simulations which gives a more accurate representation of the physical situation particularly near a phase transition.
In this paper, we report the kinetics of surface migration of small molecules (oligomers) in an (
a) oligomer–polymer (
) and (
b) oligomer–gel (
) mixture undergoing phase separation following an instantaneous temperature quench that renders the mixed phase unstable. The surface free energy difference preferentially attracts oligomers. We (i) compute dynamic surface concentration profiles of oligomers, (ii) quantify the difference in bulk coarsening phenomena as a function of depth of quench
and gel bulk modulus B, and (iii) conclusively demonstrate that surface migration of oligomers in an end-linked polymer gel is suppressed in comparison to a polymer–oligomer mixture using (i) coarse grained molecular dynamics (CGMD) and (ii) mesoscale hydrodynamics (CHC) simulations (see
Supplementary Materials for details).
2. Materials and Methods
We perform CGMD simulations of 10:90 (i.e.,
oligomer)
and
systems using a Kremer–Grest type bead spring model [
32] using GROMACS [
33]. The gel matrix of the
system is constructed by permanently cross-linking terminal beads of two polymers that lie within a distance
, where
is the bond distance, (see
Supplementary Materials for details). The mesh size of such a system is tuned by changing the relative volume fraction of polymers that make up the network. Interaction strengths among
A and
B polymers are chosen such that
. This choice of energy-scales ensure that the mixture spontaneously phase separate upon a quench from the initial high temperature to its final low temperature configuration. The system is equilibrated in a box following a temperature quench with periodic boundary conditions along
x and
y directions and two walls placed at
and
. The wall at
preferentially attracts the oligomers (modeling differing surface free energies of oligomers) while the wall at
is neutral to both species (see
Supplementary Materials).
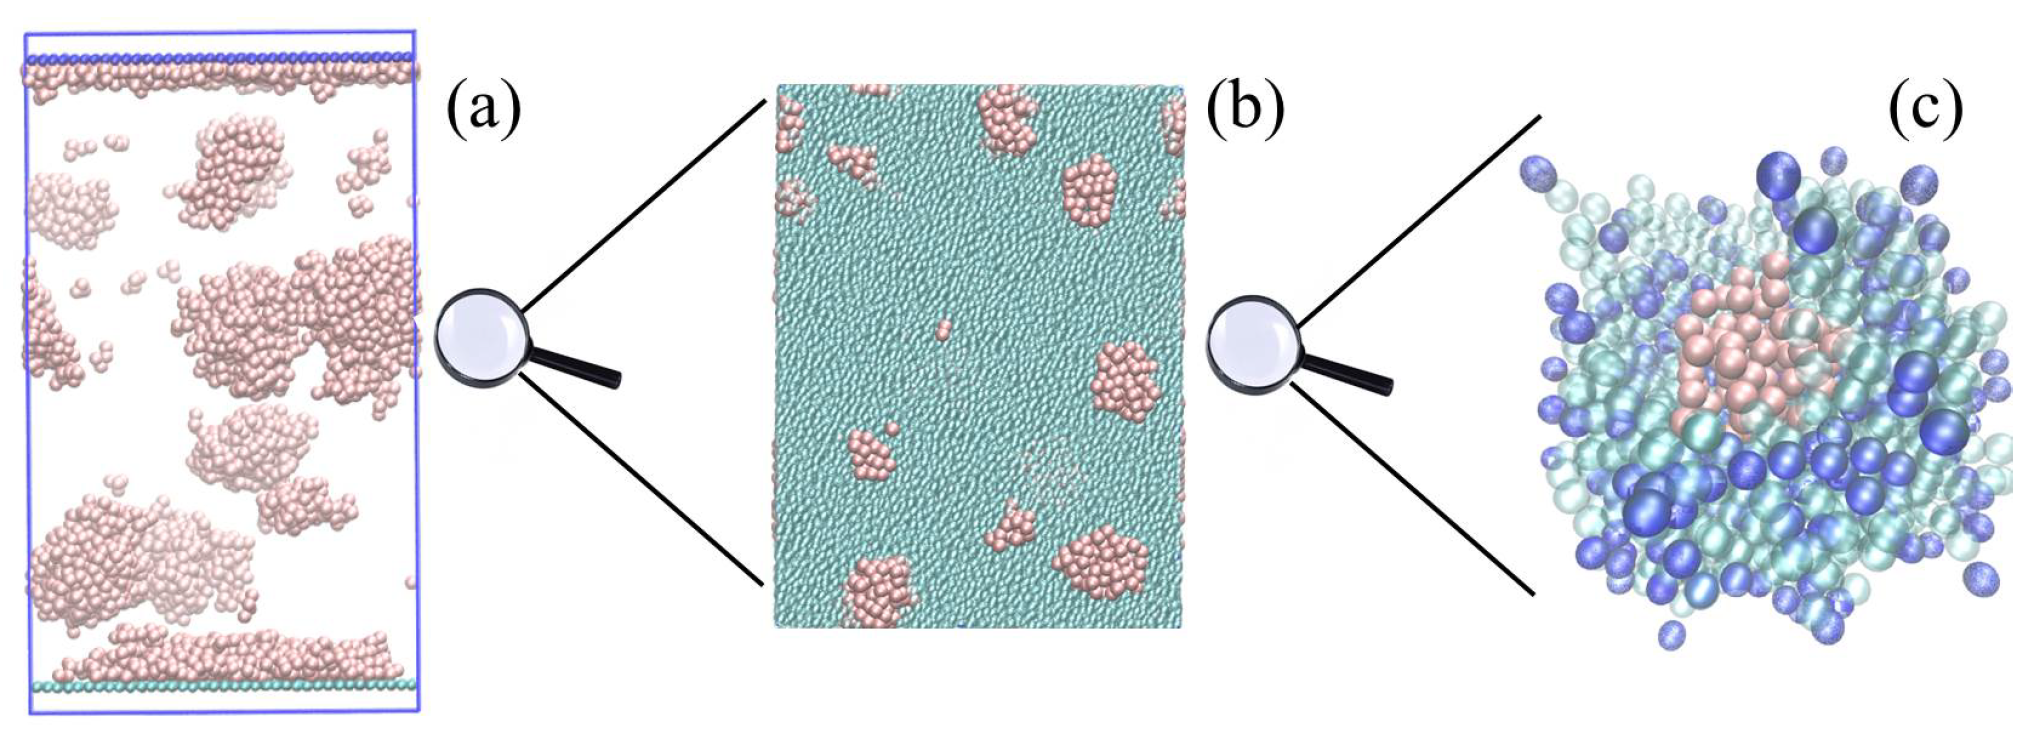
Configuration snapshots of
system undergoing simultaneous phase separation and surface migration, obtained from CGMD simulations at different scales of resolution, are shown in
Figure 1. The system is quenched from a high temperature
to
(in dimensionless units) and evolved for
to ensure thermodynamic equilibrium. Compared to the
system (see
Supplementary Materials movies), the phase-separation and thereby surface migration process in arrested in gels. This is evidenced by the presence of (
a) more oligomer droplets that are smaller in size in comparison to
systems, (
b) thinner wetting layer, and (
c) a narrower depletion region just below the wetting layer (see final configuration of oligomers in
Supplementary Materials movies). The arrested coarsening and migration behavior is seen in panels (b) and (c) where the oligomer droplets are stuck in a cage formed by end linked polymers.
Since phase separation is inherently a “slow” phenomena, it is difficult to faithfully model it for experimental time scales using detailed CGMD simulations. Meso-scale simulations, however, access much larger length-scales and longer time-scales. We therefore augment our CGMD simulations with a mesoscale model of phase separation dynamics with the Flory–Huggins free energy functional describing the bulk thermodynamics and local potentials mimicking the preferential surface affinity of oligomers. As the oligomers do not evaporate out of the system, the number of polymers and oligomers in our system is conserved. We therefore employ a time-dependent Ginzburg–Landau formalism using model
B dynamics that takes into account the conserved nature of the order parameter [
34,
35]. We solve the nonlinear diffusion equation for the order-parameter field, i.e., dynamic oligomer concentration profiles with appropriate boundary conditions to match against similar data obtained from CGMD simulations.
The dynamic concentration profiles of oligomers
for a polymer–oligomer and gel–oligomer system satisfies
where
M is the mobility, assumed to be composition independent and the local chemical potential
. An additive vectorial conserved noise
in Equation (
1) modelling solvent effects, satisfying
= 0, and
ensures thermodynamic equilibrium at long times. Since the average concentration of polymers/gel and oligomers in our system is far from the symmetry point
and in this regime domain coarsening occurs primarily via diffusion, we do not include explicit hydrodynamics interactions [
36] in our meso-scale model.
The free energy functional for an in-compressible binary fluid mixture, in two space dimensions, confined between selectively attracting walls (surfaces), located at
and
is given by
where
F is the free-energy, and
z and
x are the coordinates perpendicular and parallel to the wall, respectively, and
a is the Flory–Huggins lattice spacing. The first term in Equation (
2) is the bulk free energy and the second term accounts for energy costs associated with the spatial gradients of the composition field with a stiffness coefficient
. Note that surface free-energies
and
have dimensions of length such that
is dimensionless. The functional forms of
and
, respectively. As in our CGMD simulations, the wall at
attracts the oligomer
B while the wall at
is neutral to both the components. We study the approach to equilibrium, when this mixture is quenched to the two phase region, starting from an initial uniform phase, which is thermodynamically unstable, for a
and
mixture, with the component
A (having local composition
denoting the polymer with degree of polymerisation,
or the gel, and an oligomer
B (with local composition
), with degree of polymerisation,
, respectively.
The dimensionless Flory–Huggins free energy for a polymer–oligomer mixture is given by, Equation (
3),
and the Flory–Rehner free energy describing the gel–oligomer mixture is given by, Equation (
4),
where
is the Flory–Huggins interaction parameter. The bulk concentration of the polymers that make up the gel is denoted by
, which is identified here as the region in the vicinity of
, and
B denotes the bulk modulus of the gel. The precise connection between the bulk modulus and the microscopic gel architecture is not known, to the best of our knowledge. Therefore, we use values of the bulk modulus which are similar to those used in earlier calculations on the thermodynamics of phase separation in mixtures of small molecules and gels [
31]. In an ongoing work, we are investigating the effects of gel elasticity on the domain coarsening length scale and how this depends on the gel fraction or the cross-link density of the mesh structure. We set the value of the Flory–Huggins
parameter to 1.1
, where
is its value at the spinodal. This choice makes the initial uniform state unstable and the system evolves to its new phase-separated equilibrium state in the presence of the external surface that prefers one of the components. We numerically integrate Equation (
1) for both forms of the free energies Equations (
3) and (
4) with the boundary conditions described earlier (see
Supplementary Materials for details). For bulk simulations, we impose a periodic boundary condition along all directions, while in the presence of walls we impose a zero flux boundary condition at the walls and periodic boundary condition along the lateral dimensions. This ensures that the order parameter is conserved throughout the evolution process. The initial
field configuration for meso-scale simulations on a (
) lattice with
is chosen to be
=
+
, with
being the initial concentration of a polymer/gel and
is a uniformly distributed random number in the interval
.
is set to 0.7, which signifies a 30:70 mixture of oligomer–polymer and oligomer–gel.
and
are chosen as 100 and 50, respectively.
We coarse-grain particulate configuration snapshots of
simulations [
37] to obtain oligomer concentration
to compare against
results following a majority rule. The simulation box is divided into cubes of size
, where
b is the bead diameter and the number of monomers belonging to polymer
and oligomer
counted. The coarse-grained order parameter field for the
i-th cell
if
, otherwise
. For the simulations in the presence of walls, the coarse-grained
’s, the one-dimensional density of oligomers, as a function of the depth from the upper wall, is obtained by performing an average over the two lateral dimensions. The equal time spatial correlation function in bulk mixtures
where
r is the radial distance between the centres of two cubes, and
is the time elapsed since the instantaneous quench, is used to study the phase-separation dynamics. The angular brackets in Equation (
5) indicate averaging over independent initial configurations and the first zero crossing of
determines the domain size
.
3. Results
The time-dependence of the coarsening length-scale is shown in
Figure 2, with (a) and (b) showing results from bulk MD simulations and bulk mesoscale simulations, respectively, with filled circles denoting coarsening in polymer–oligomer mixture and filled squared denoting coarsening in a gel–oligomer mixture with bulk modulus,
. In both cases, the domain size initially grows as a function of time as
following a Lifshitz–Slyozov law (see Materials and Methods for a definition of
). At longer times, the phase separation process is arrested in gels showing
saturating as a function of
(see the blue squares in panels (a) and (b) of
Figure 2). The saturation value and the time at which
saturates depend on the elasticity of the gel-matrix. Recent experiments on arrested droplet growth in the presence of an elastic matrix show how the saturation size of the droplets monotonically increases as the matrix becomes softer [
30].
In order to match our results with CGMD simulations, we also perform meso-scale simulations, where we simulate the phase separation kinetics in a 30:70 asymmetric mixture of oligomers and polymers/gel having polymerisation index
, and
, respectively (see Materials and Methods for a description of the system). For this composition, the parameter
is set to 0.7 in the gel–oligomer free-energy in Equation (
4). We set
, where
corresponds to the value of the Flory parameter at the spinodal, for the above parameters and
. Two values of bulk modulus
and
have been used and the computed thermodynamic quantities are averaged over
different initial configurations. We numerically integrate the non-dimensionalised version of Equation (
1) accounting for the conserved noise following a forward Euler scheme (see
Supplementary Materials).
In presence of a top surface at
, which preferentially attracts the oligomers a complete wetting transition is observed for the
system while partial wetting is observed for the
systems. The migrant concentration configurations, in the meso-scale description, close to equilibrium having a small chemical potential gradient
, obtained by numerically integrating Equation (
1) for long times
for both systems are shown in
Figure 3. At long times, the phase separation is nearly complete for
systems resulting in the formation of a thick wetting layer. In contrast, the coarsening process is arrested in gels resulting in a diffuse thin wetting layer that decreases monotonically on increasing the bulk modulus, (c) and (d). These results can be understood from the variation of the bulk free energy as a function of the oligomer concentration
for both systems. In the absence of elastic interactions, the system admits two minima, with well separated
values, corresponding to an equilibrium phases that are
rich. For a gel, elastic interactions result in lowering the free energy of an oligomer rich state. If the surface affinity of the oligomers (set by
,
,
and
(see Materials and Methods for a definition of these quantities)) is insufficient to overcome the cost of elastically deforming a polymeric cage that traps the oligomer droplets, the equilibrium state is one with oligomers inside the gel resulting in a thinner and diffuse wetting layer.
Figure 4 shows the time evolution of oligomer concentration with an attractive surface. Panels (a) and (b), respectively, show profiles obtained from MD simulations for a gel-fraction of 0.9, following an instantaneous quench from an initial temperature
to
. The migrant density in the vicinity of the upper wall at
is
for the
mixture in panel (a), whereas,
for the
system in panel (b). Similarly, (c) and (d) of
Figure 4 show density profiles obtained from mesoscale simulations for parameters (
, and
) as described above. The characteristic time and space discretisation scales of the mesoscale simulations are dependent on the thermodynamic state point (see
Supplementary Materials). When comparing results from different simulations, we have rescaled the raw data such that all temporal and spatial scales in
Figure 4 are equal. These profiles clearly show that the surface migration is indeed significantly suppressed due to the gelation, both in the CGMD description (compare profiles in panels (a) and (b) of
Figure 4) and the meso-scale description (compare profiles in panels (c) and (d) of
Figure 4). Experiments on the SDSD in mixtures of poly(ethylene-propylene)(PEP) and per-deuterated poly(ethylene-propylene) (d-PEP) [
8] show surface segregation profiles which are very similar to the profiles obtained via our simulations.
The oligomer density profiles shown in
Figure 4 are used to compute the migrant fraction at the attractive surface as a function of time. In CGMD simulations, this is computed by counting the number of particles between
and the first minimum of the density profile
at
. In meso-scale simulations, the measure of the migrant fraction is provided by the expression:
, i.e., the area of
above the line
and
is the thickness of the wetting layer in the meso-scale simulations, which is defined as the distance from the surface when
falls below 0.5 in (c) and (d) of
Figure 4.
Figure 5a,b shows the time variation of the migrant fraction for the
and
systems by the CGMD and the meso-scale simulations, respectively. These results corroborate the results shown in
Figure 4 and panel (a) clearly demonstrates that the migrant fraction at the longest simulated time decreases almost by a factor of two for the
, relative to the
system in our CGMD simulations. In panel (b), the results from meso-scale simulation confirm this observation and we further observe that the migrant fraction at the longest time reduces as one increases the stiffness of the gel, which is quantified by the value of the bulk modulus. These results are very similar to those observed in the recent experiments on droplet growth within an elastic matrix whose elastic modulus is tuned to control the droplet size [
30]. As evidenced in the oligomer density profiles, increasing the bulk modulus causes a decrease in the migrant fraction. A similar dramatic slow growth of the wetting layer thickness as a function of increasing bulk modulus is observed in CGMD simulations (see
Supplementary Materials Figure S4).


