Polyethylene-Carbon Composite (Velostat®) Based Tactile Sensor

 ,
, 
 ,
,  and
and
Abstract
:
1. Introduction
2. Experimental
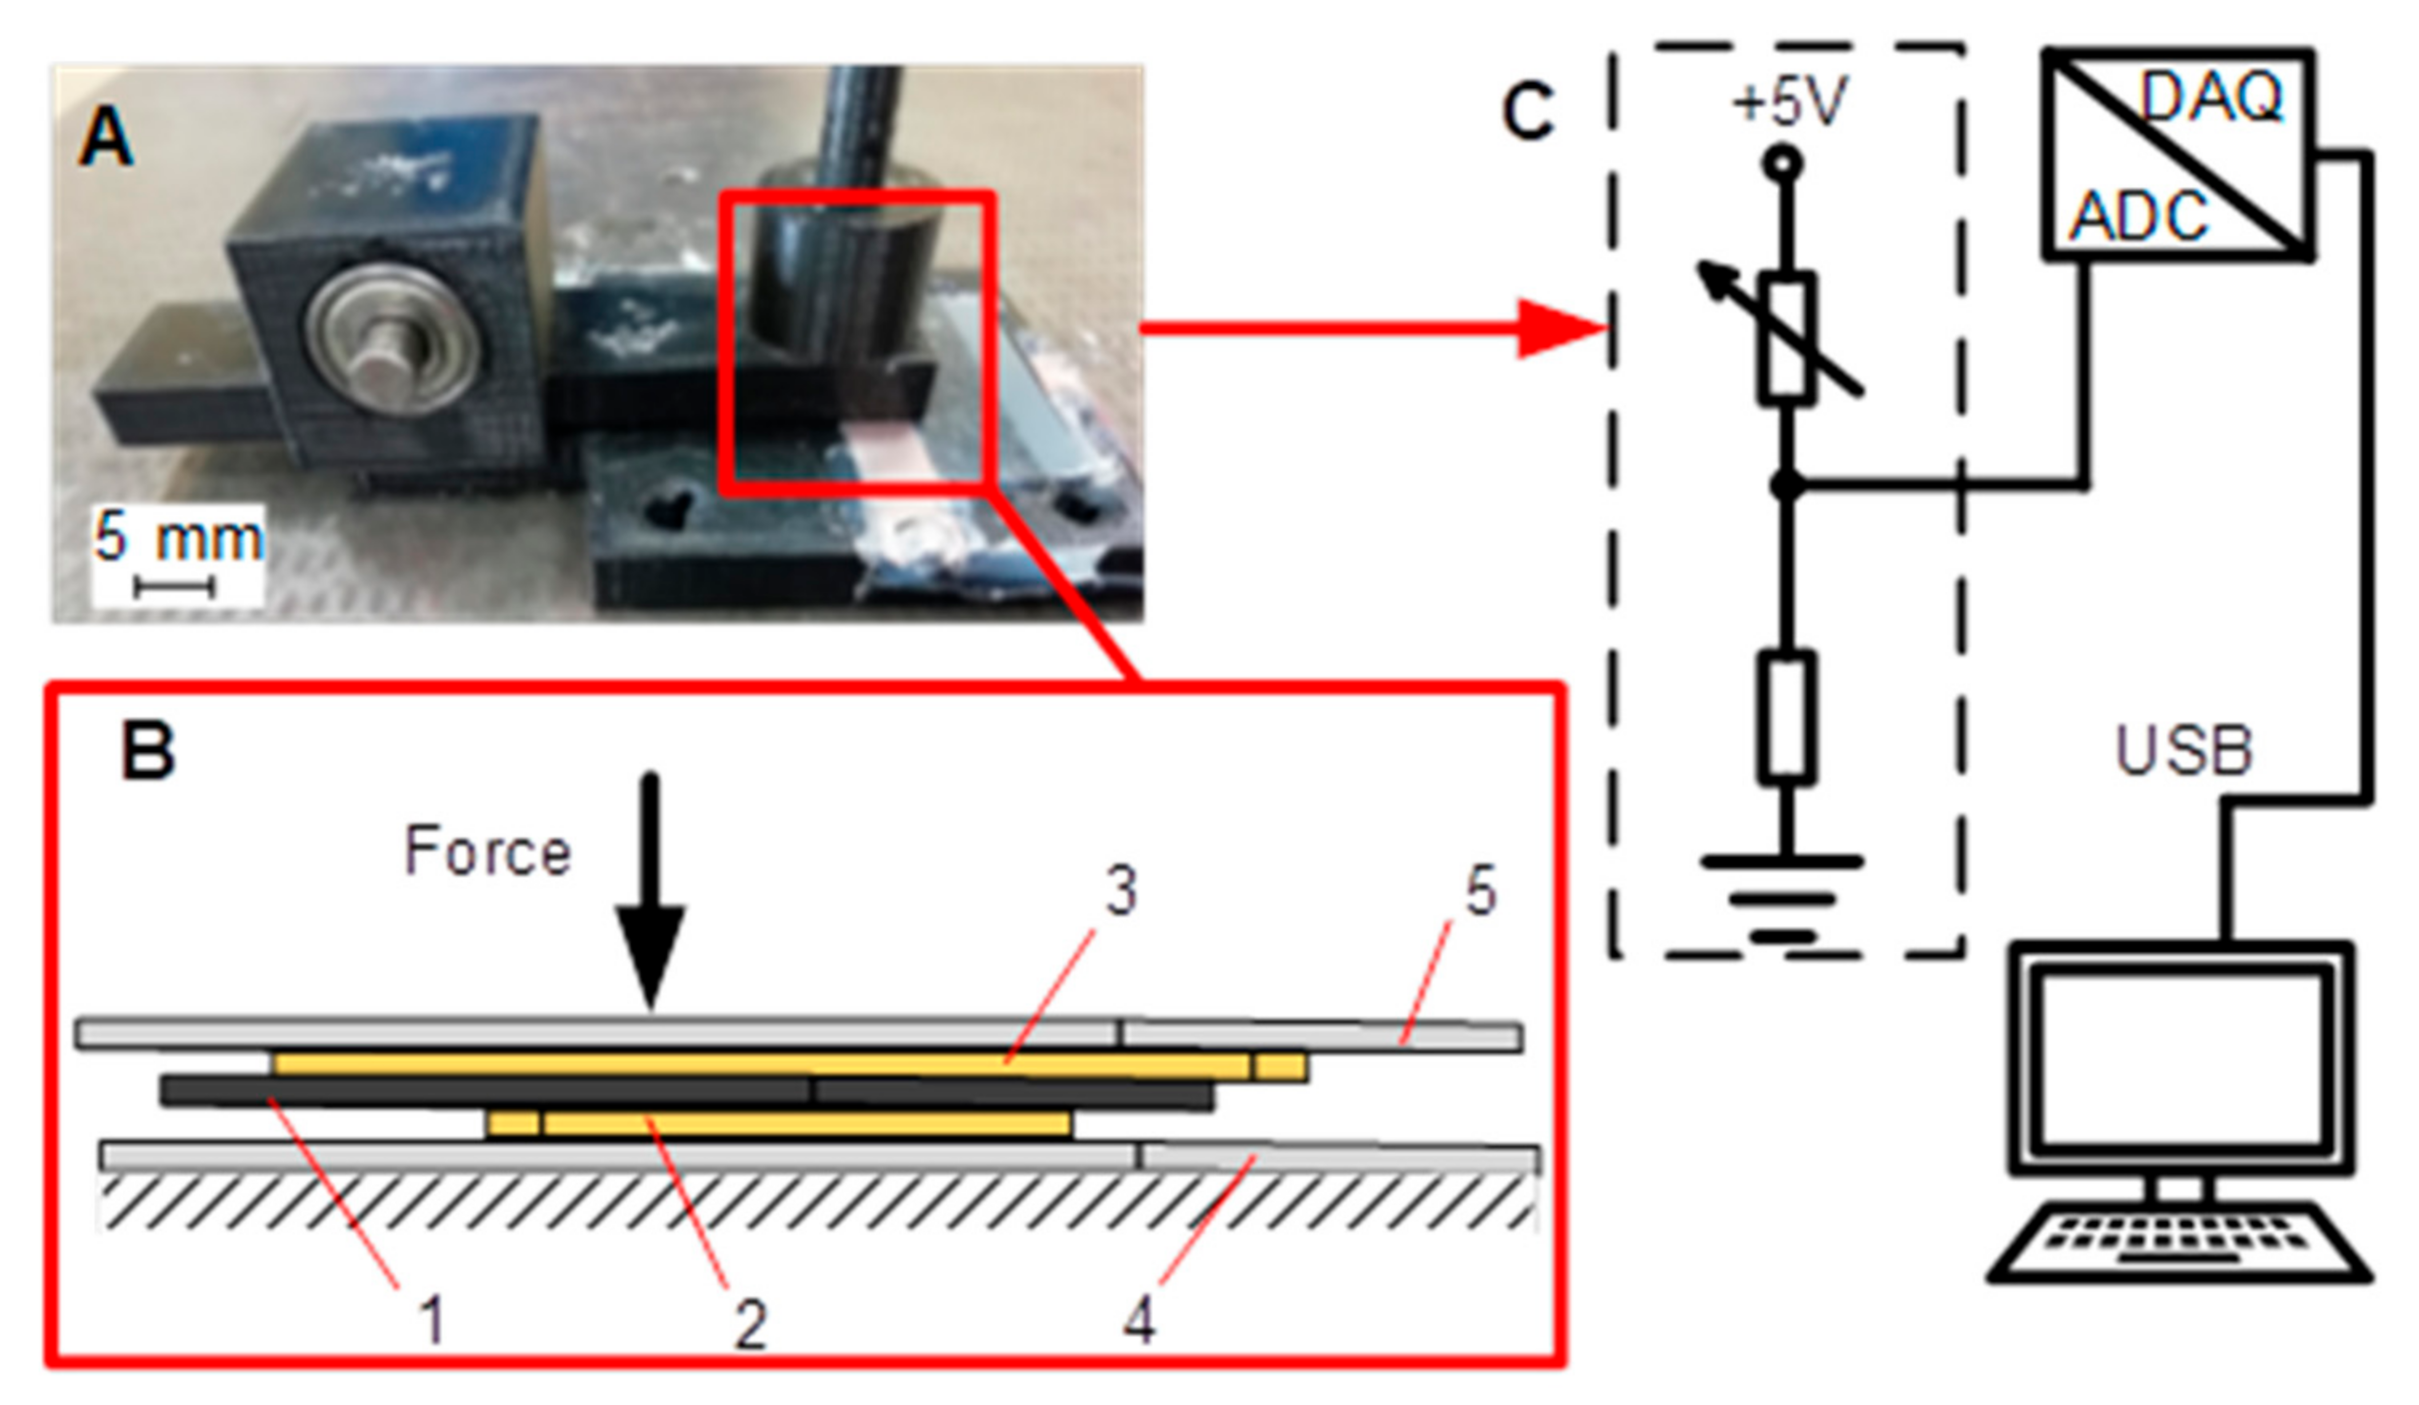
2.1. Equipment
2.2. Methodology
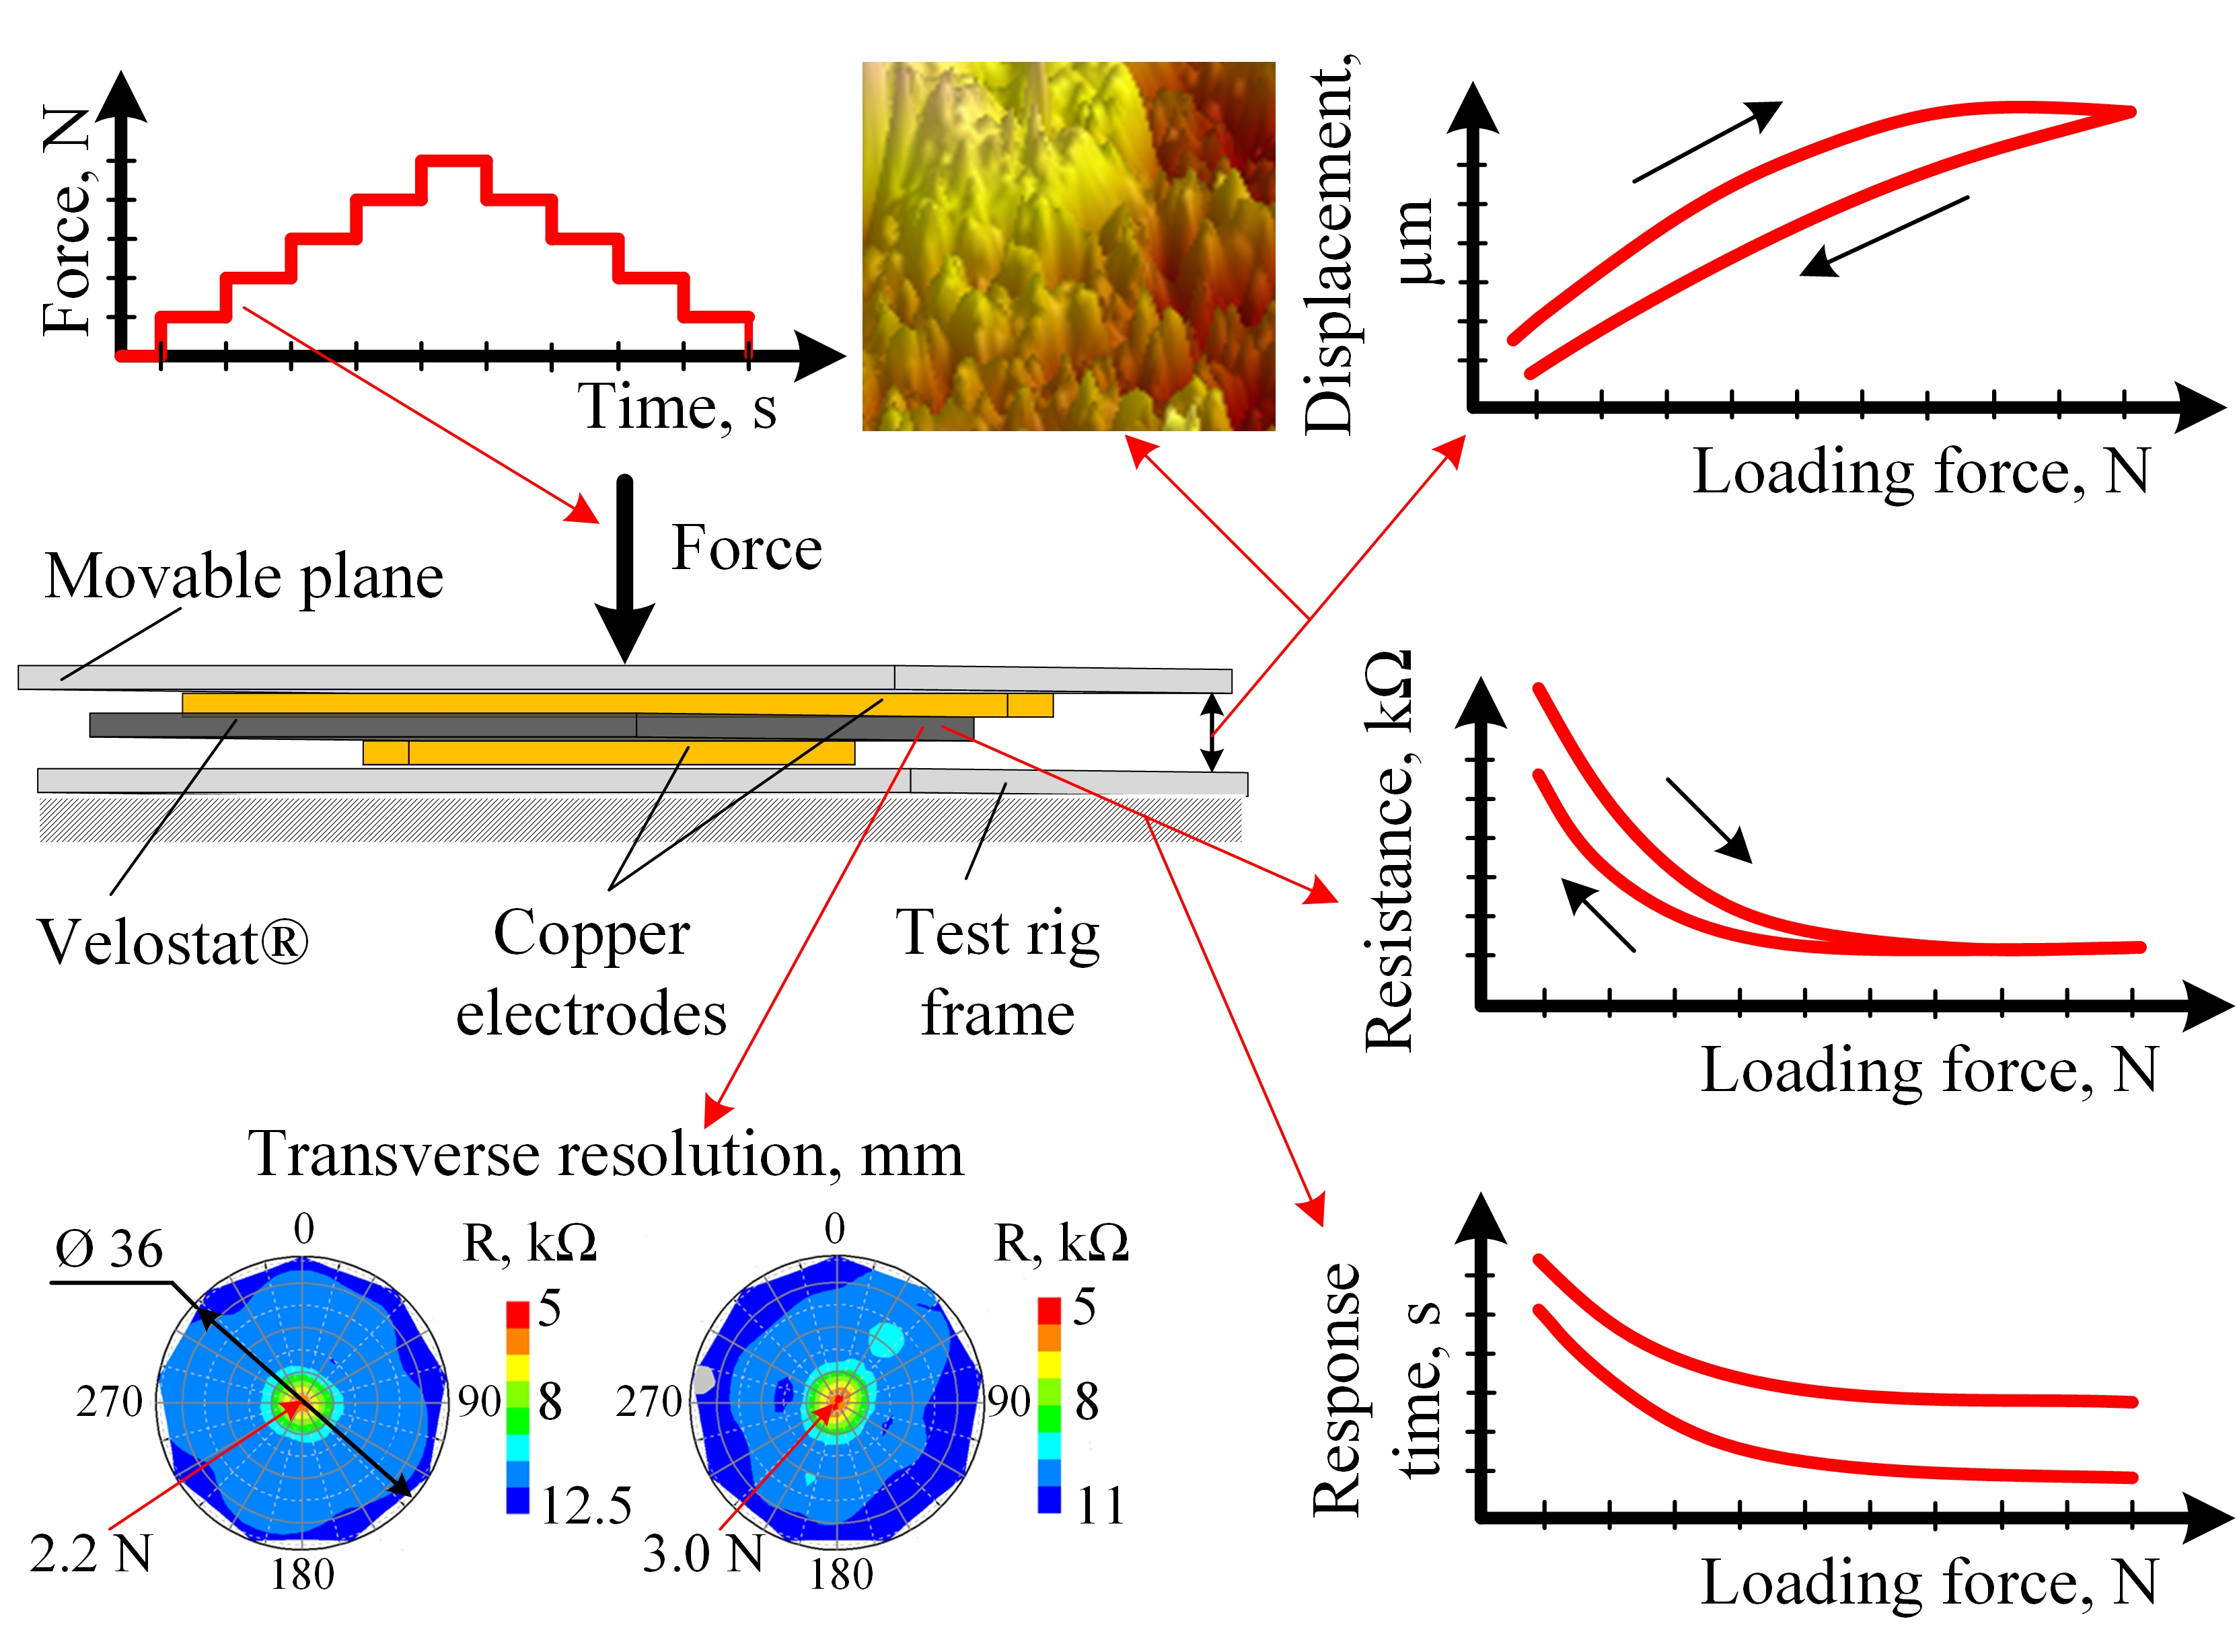
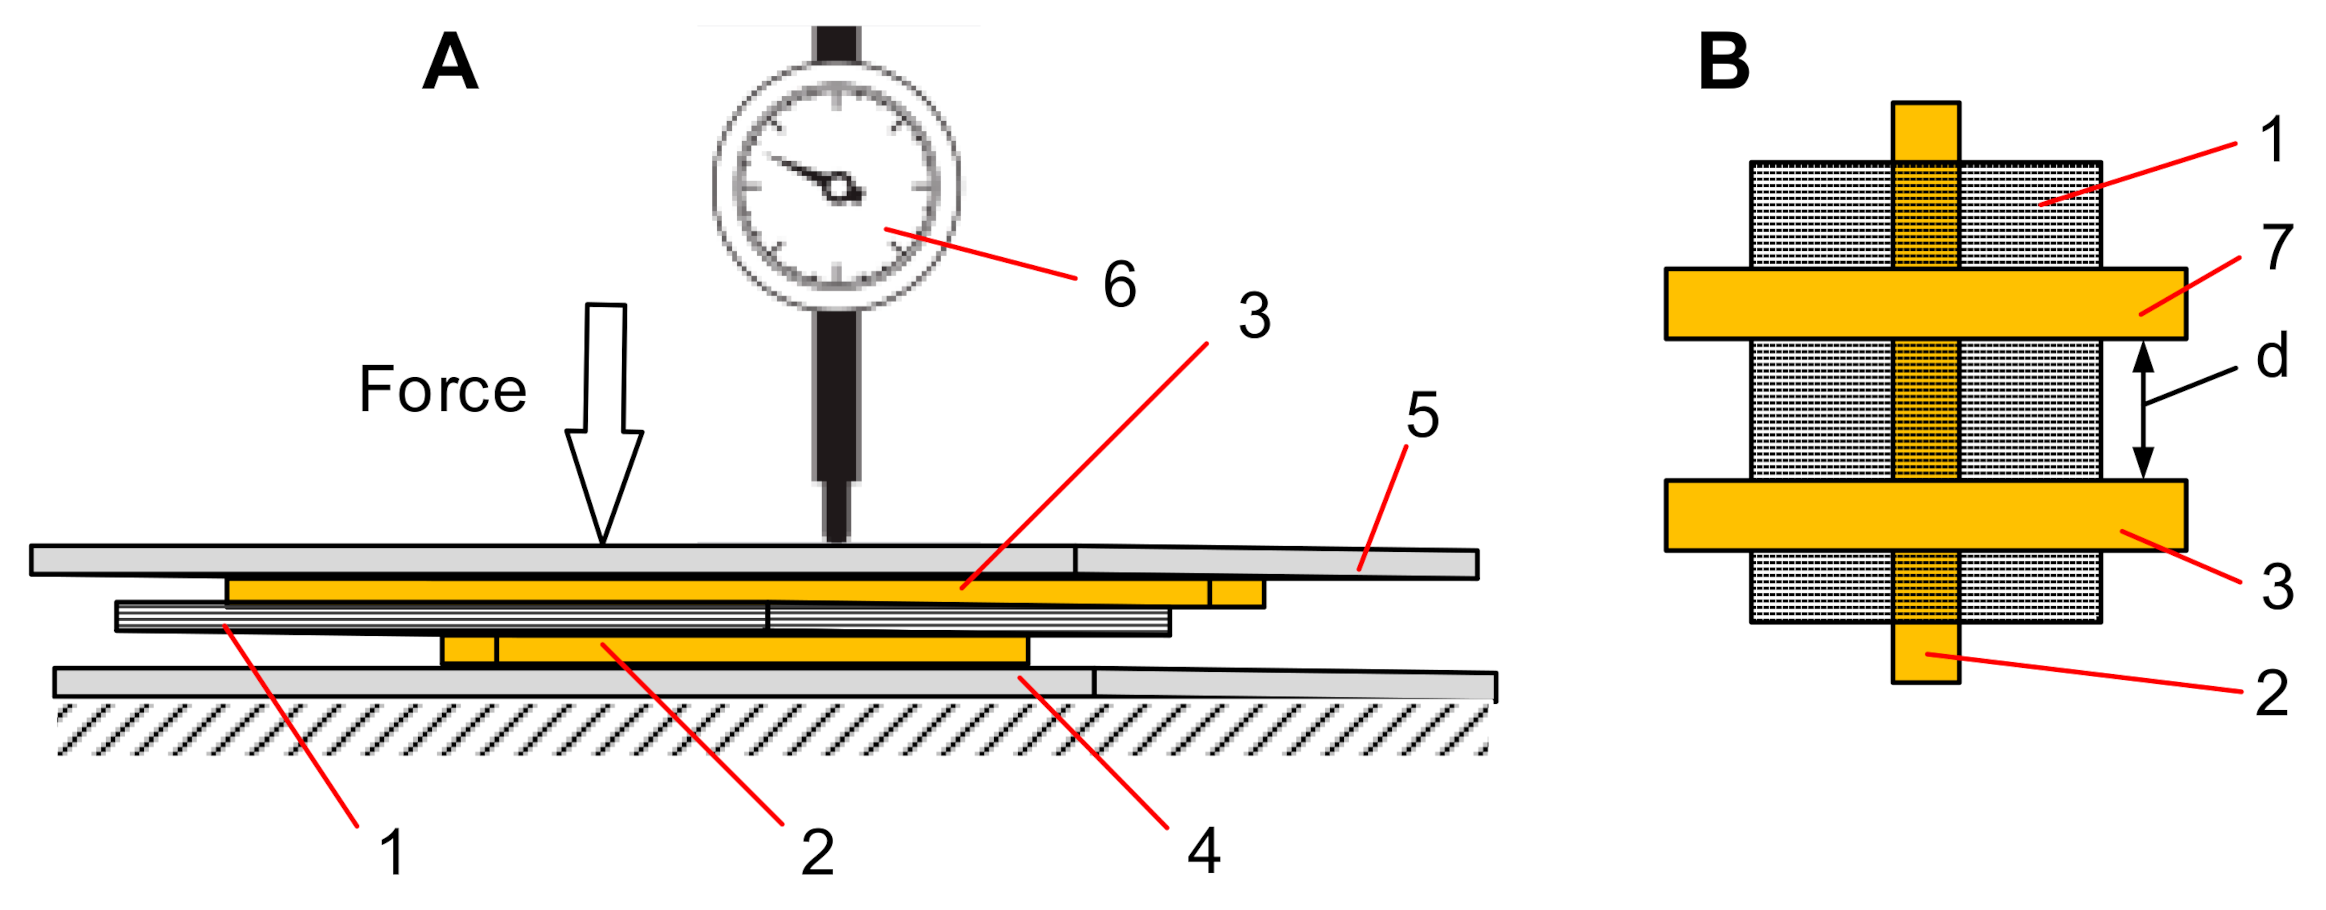
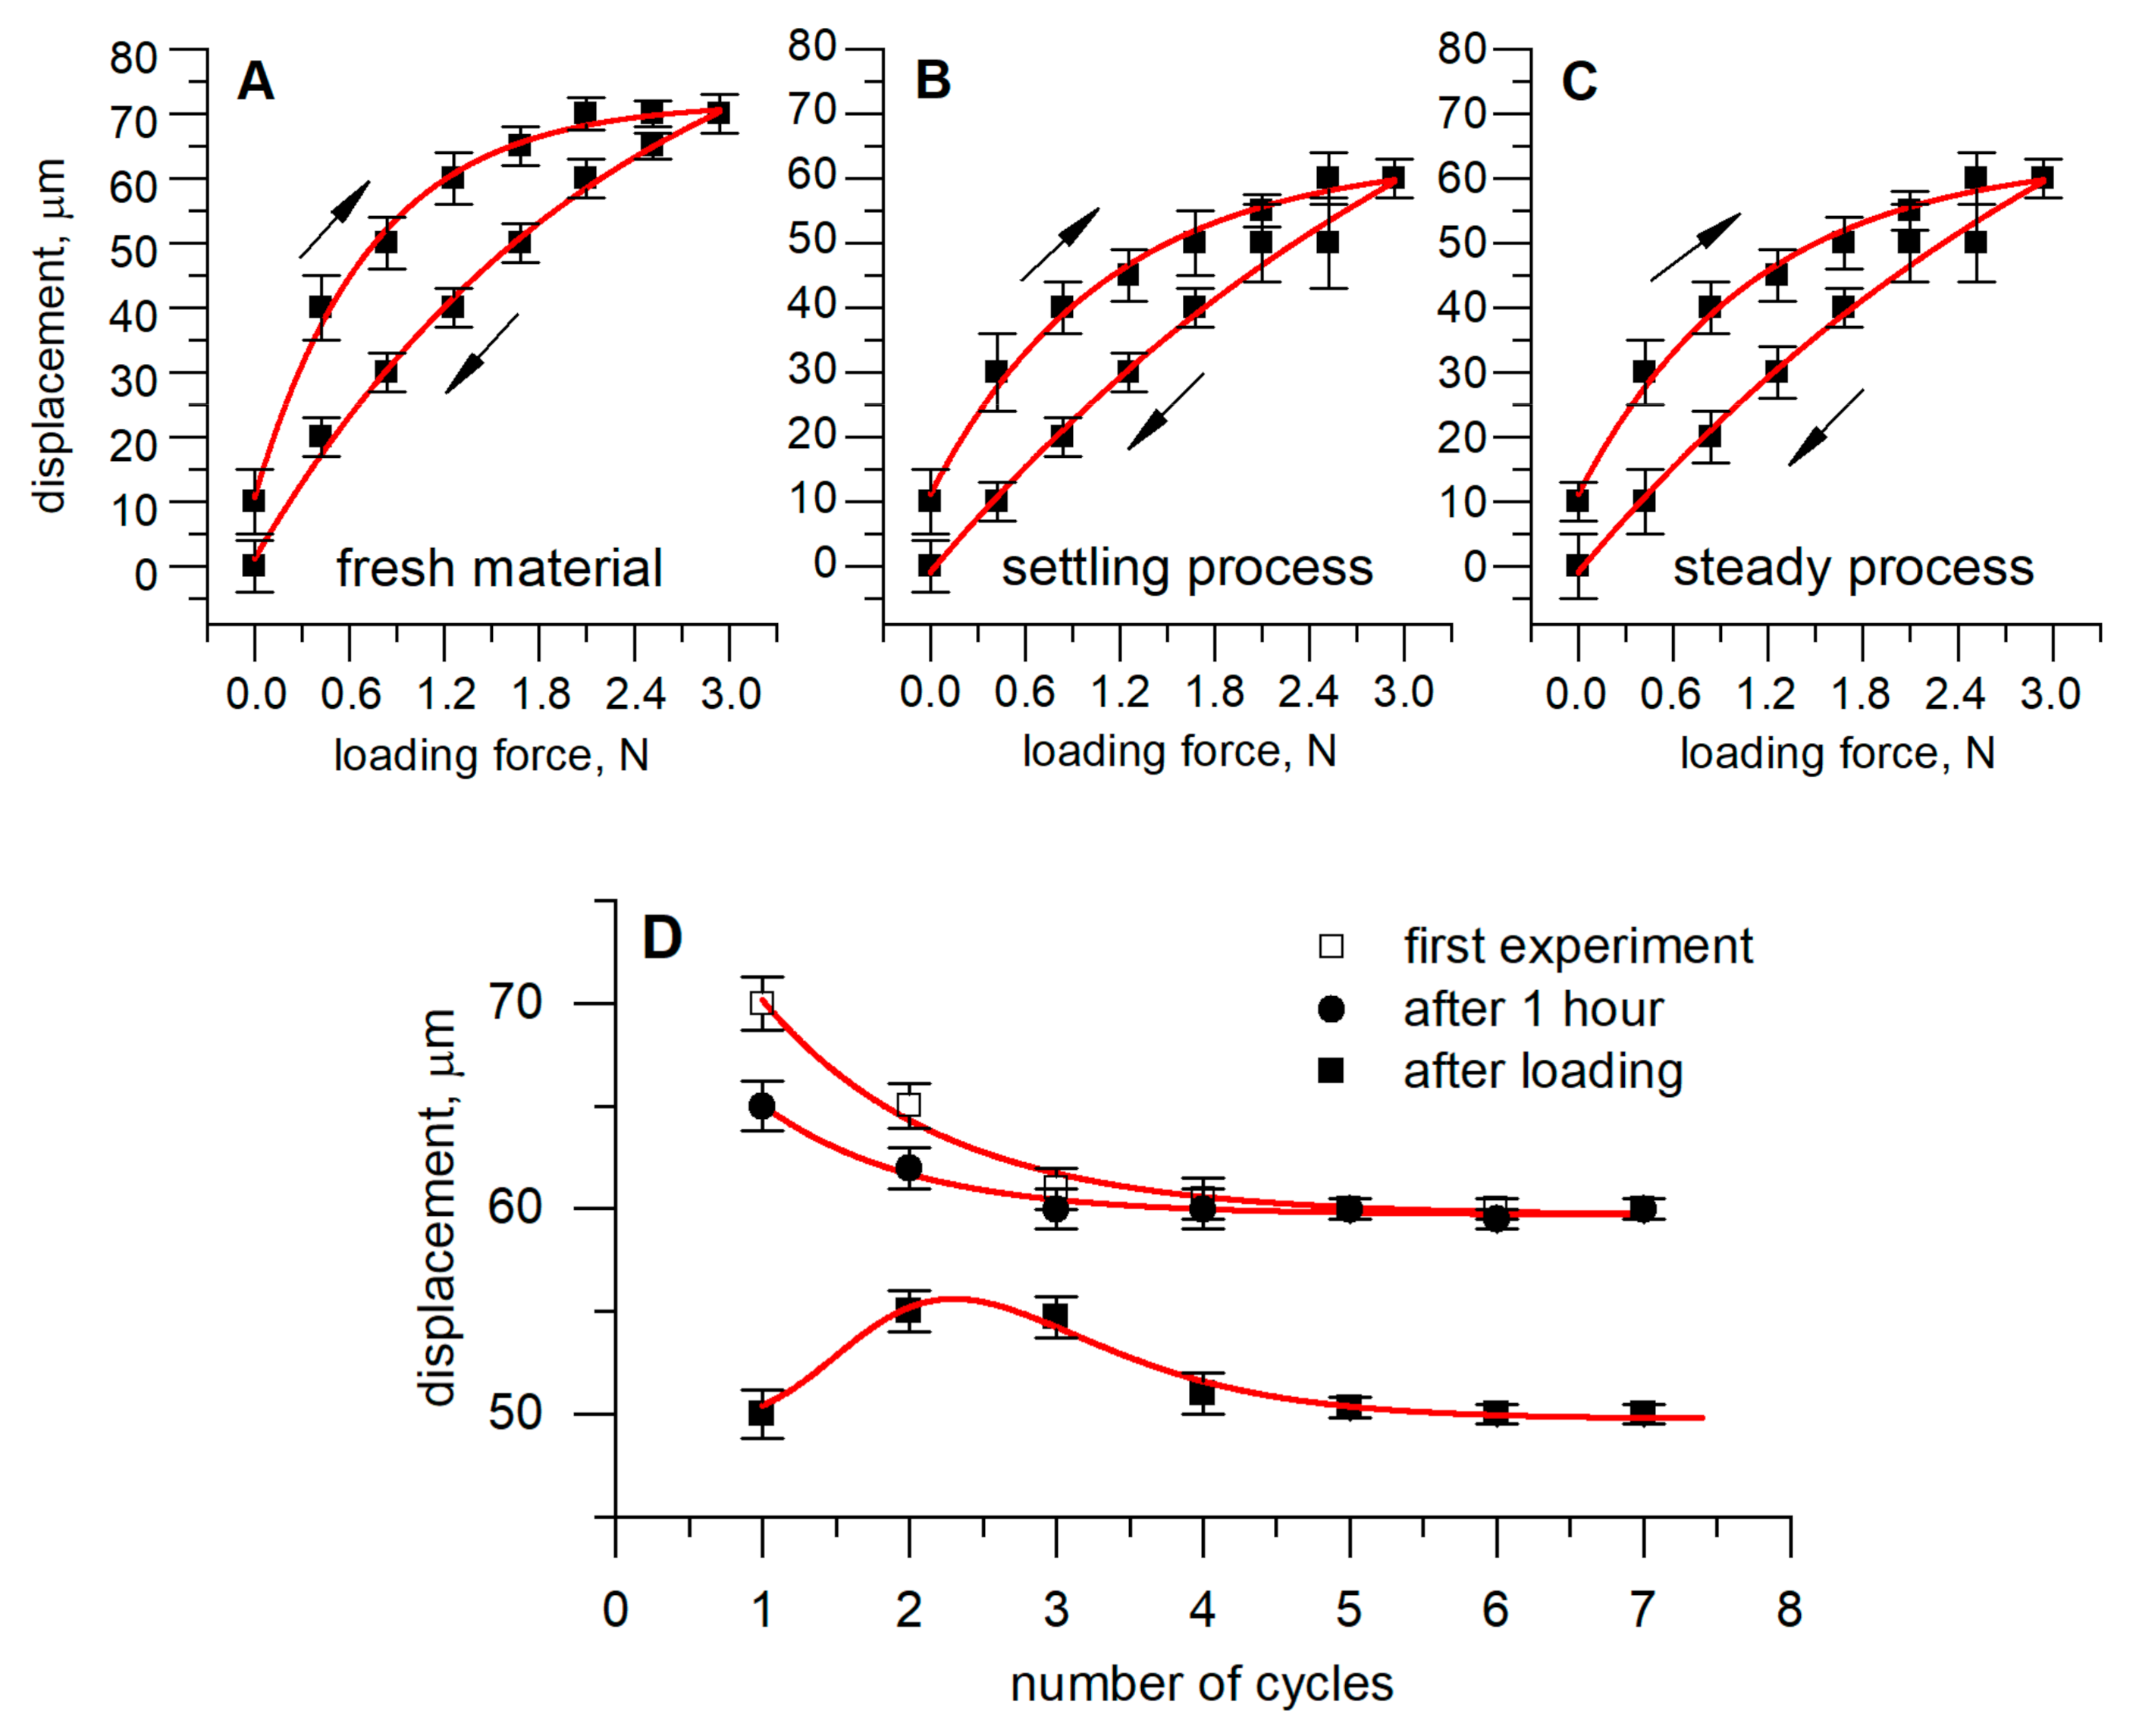
Evaluation of Mechanical Characteristics of the Developed Sensor
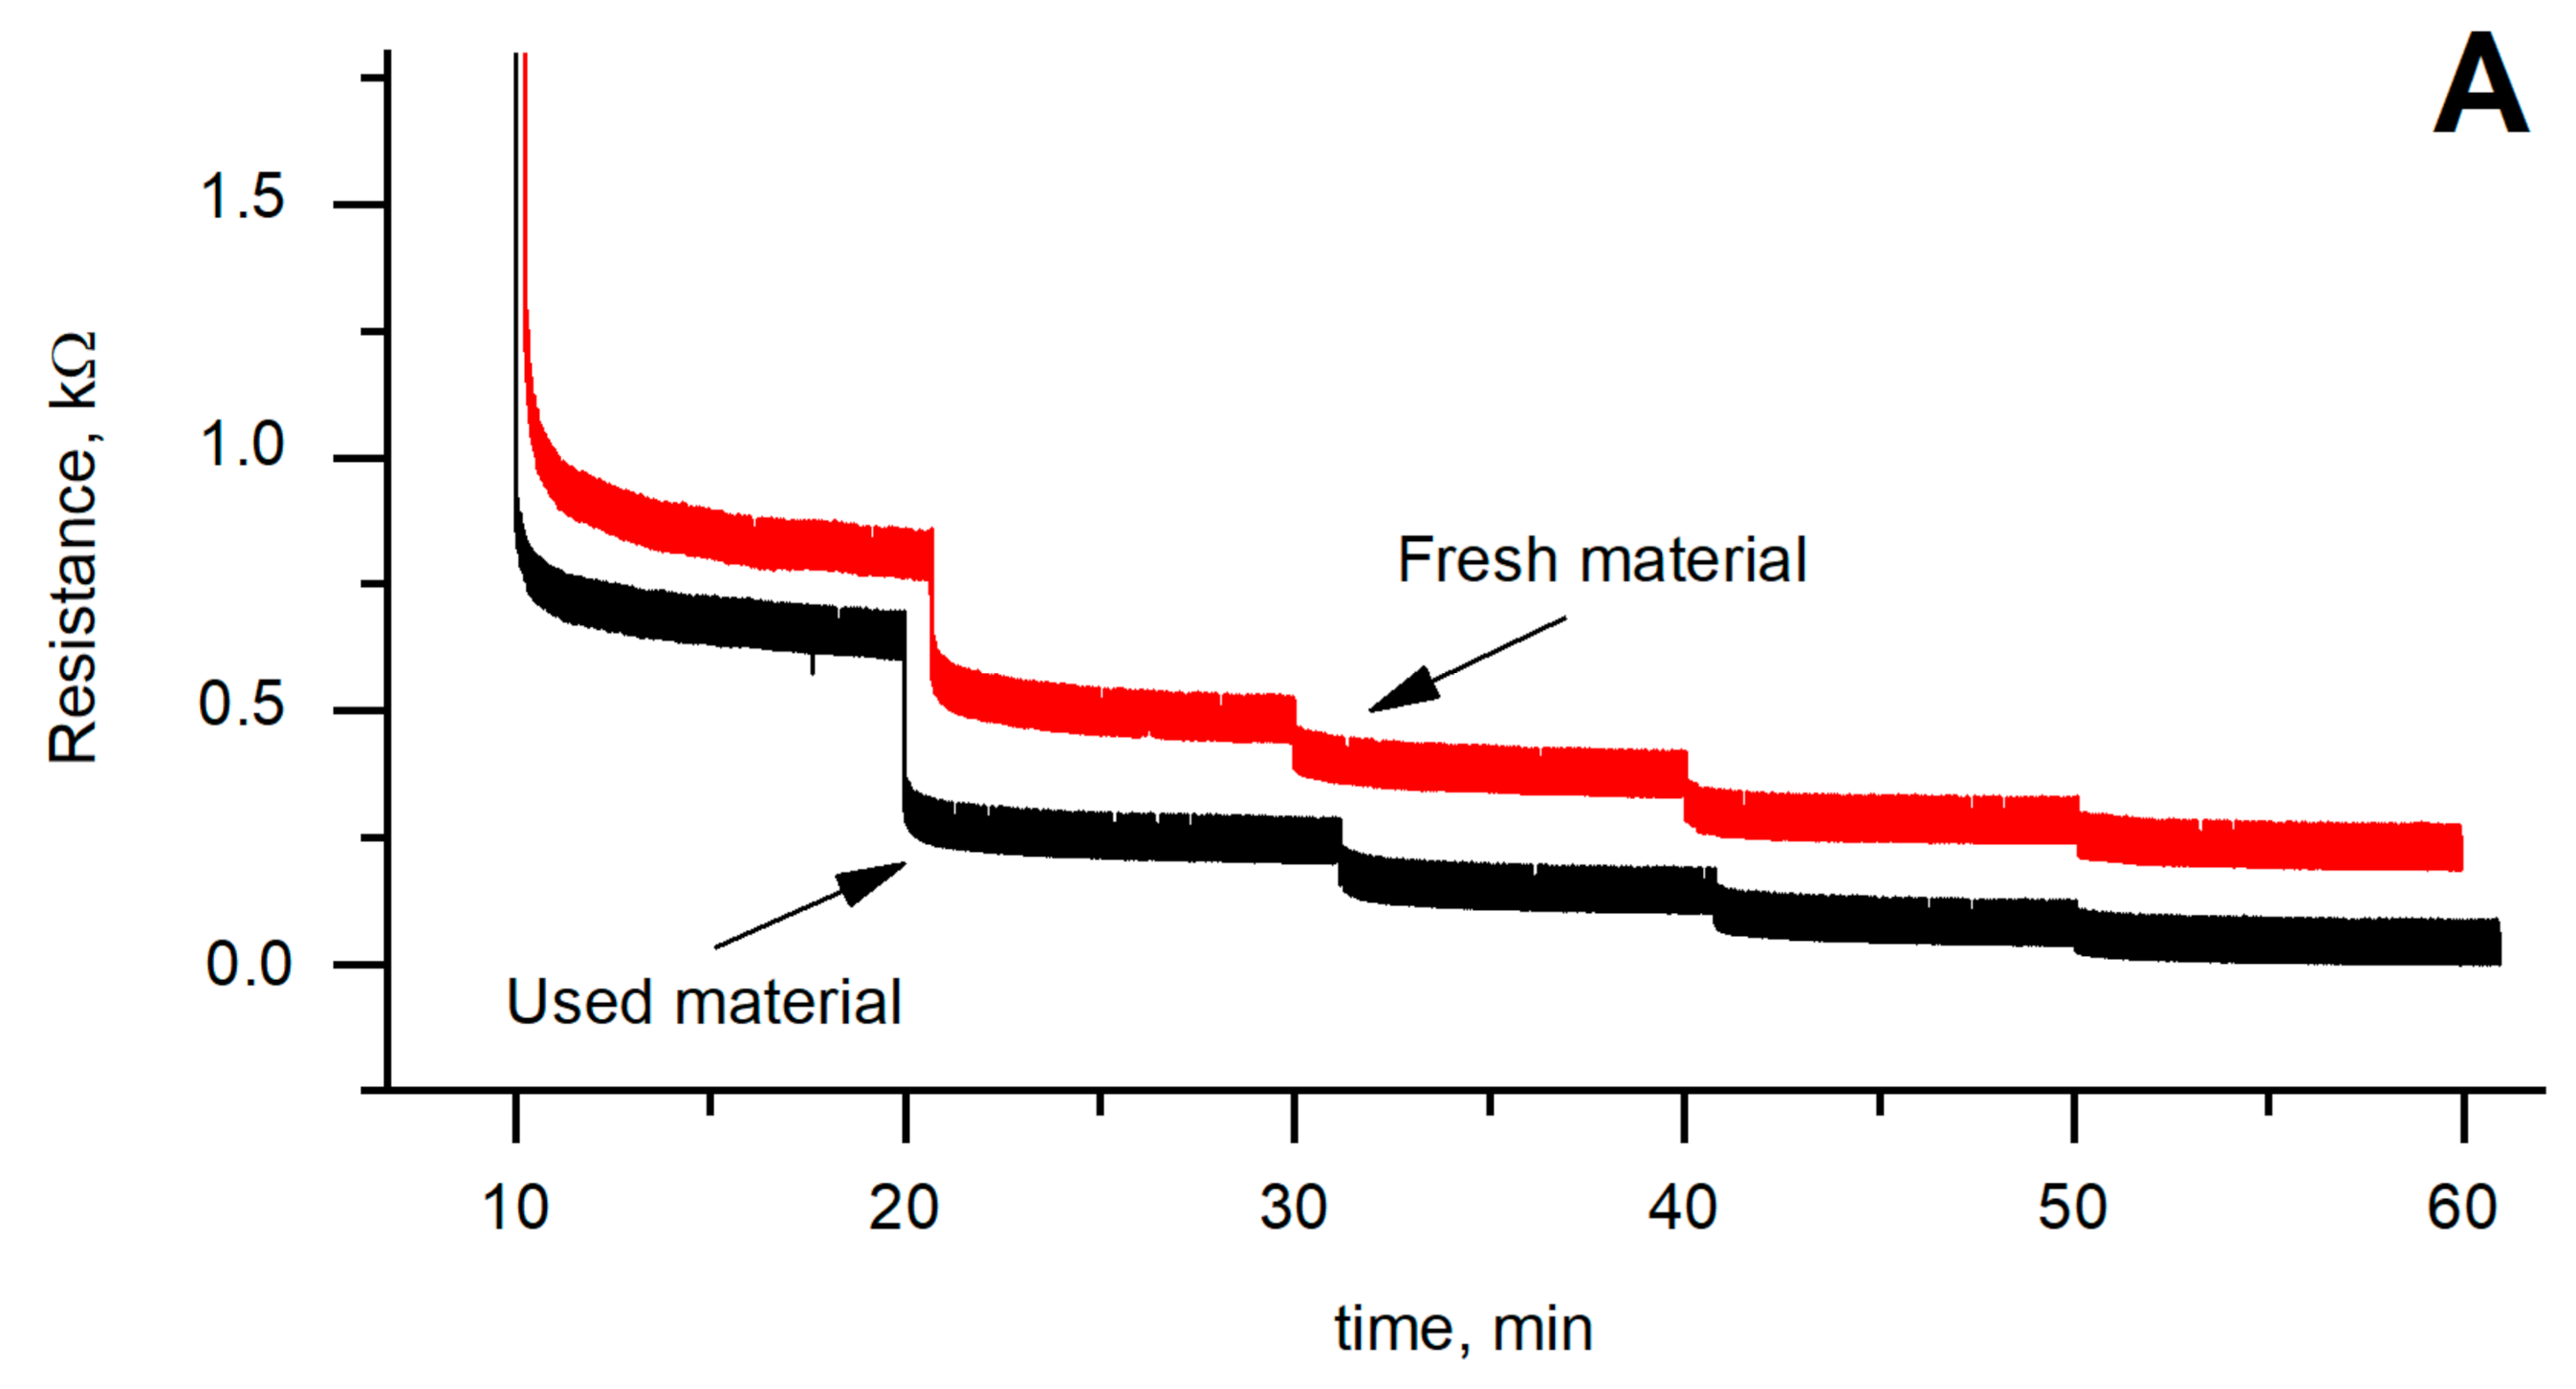
2.3. Evaluation of Sensor Electric Properties
2.3.1. Evaluation of Sensor Sensitivity
2.3.2. Evaluation of Sensor Response Time
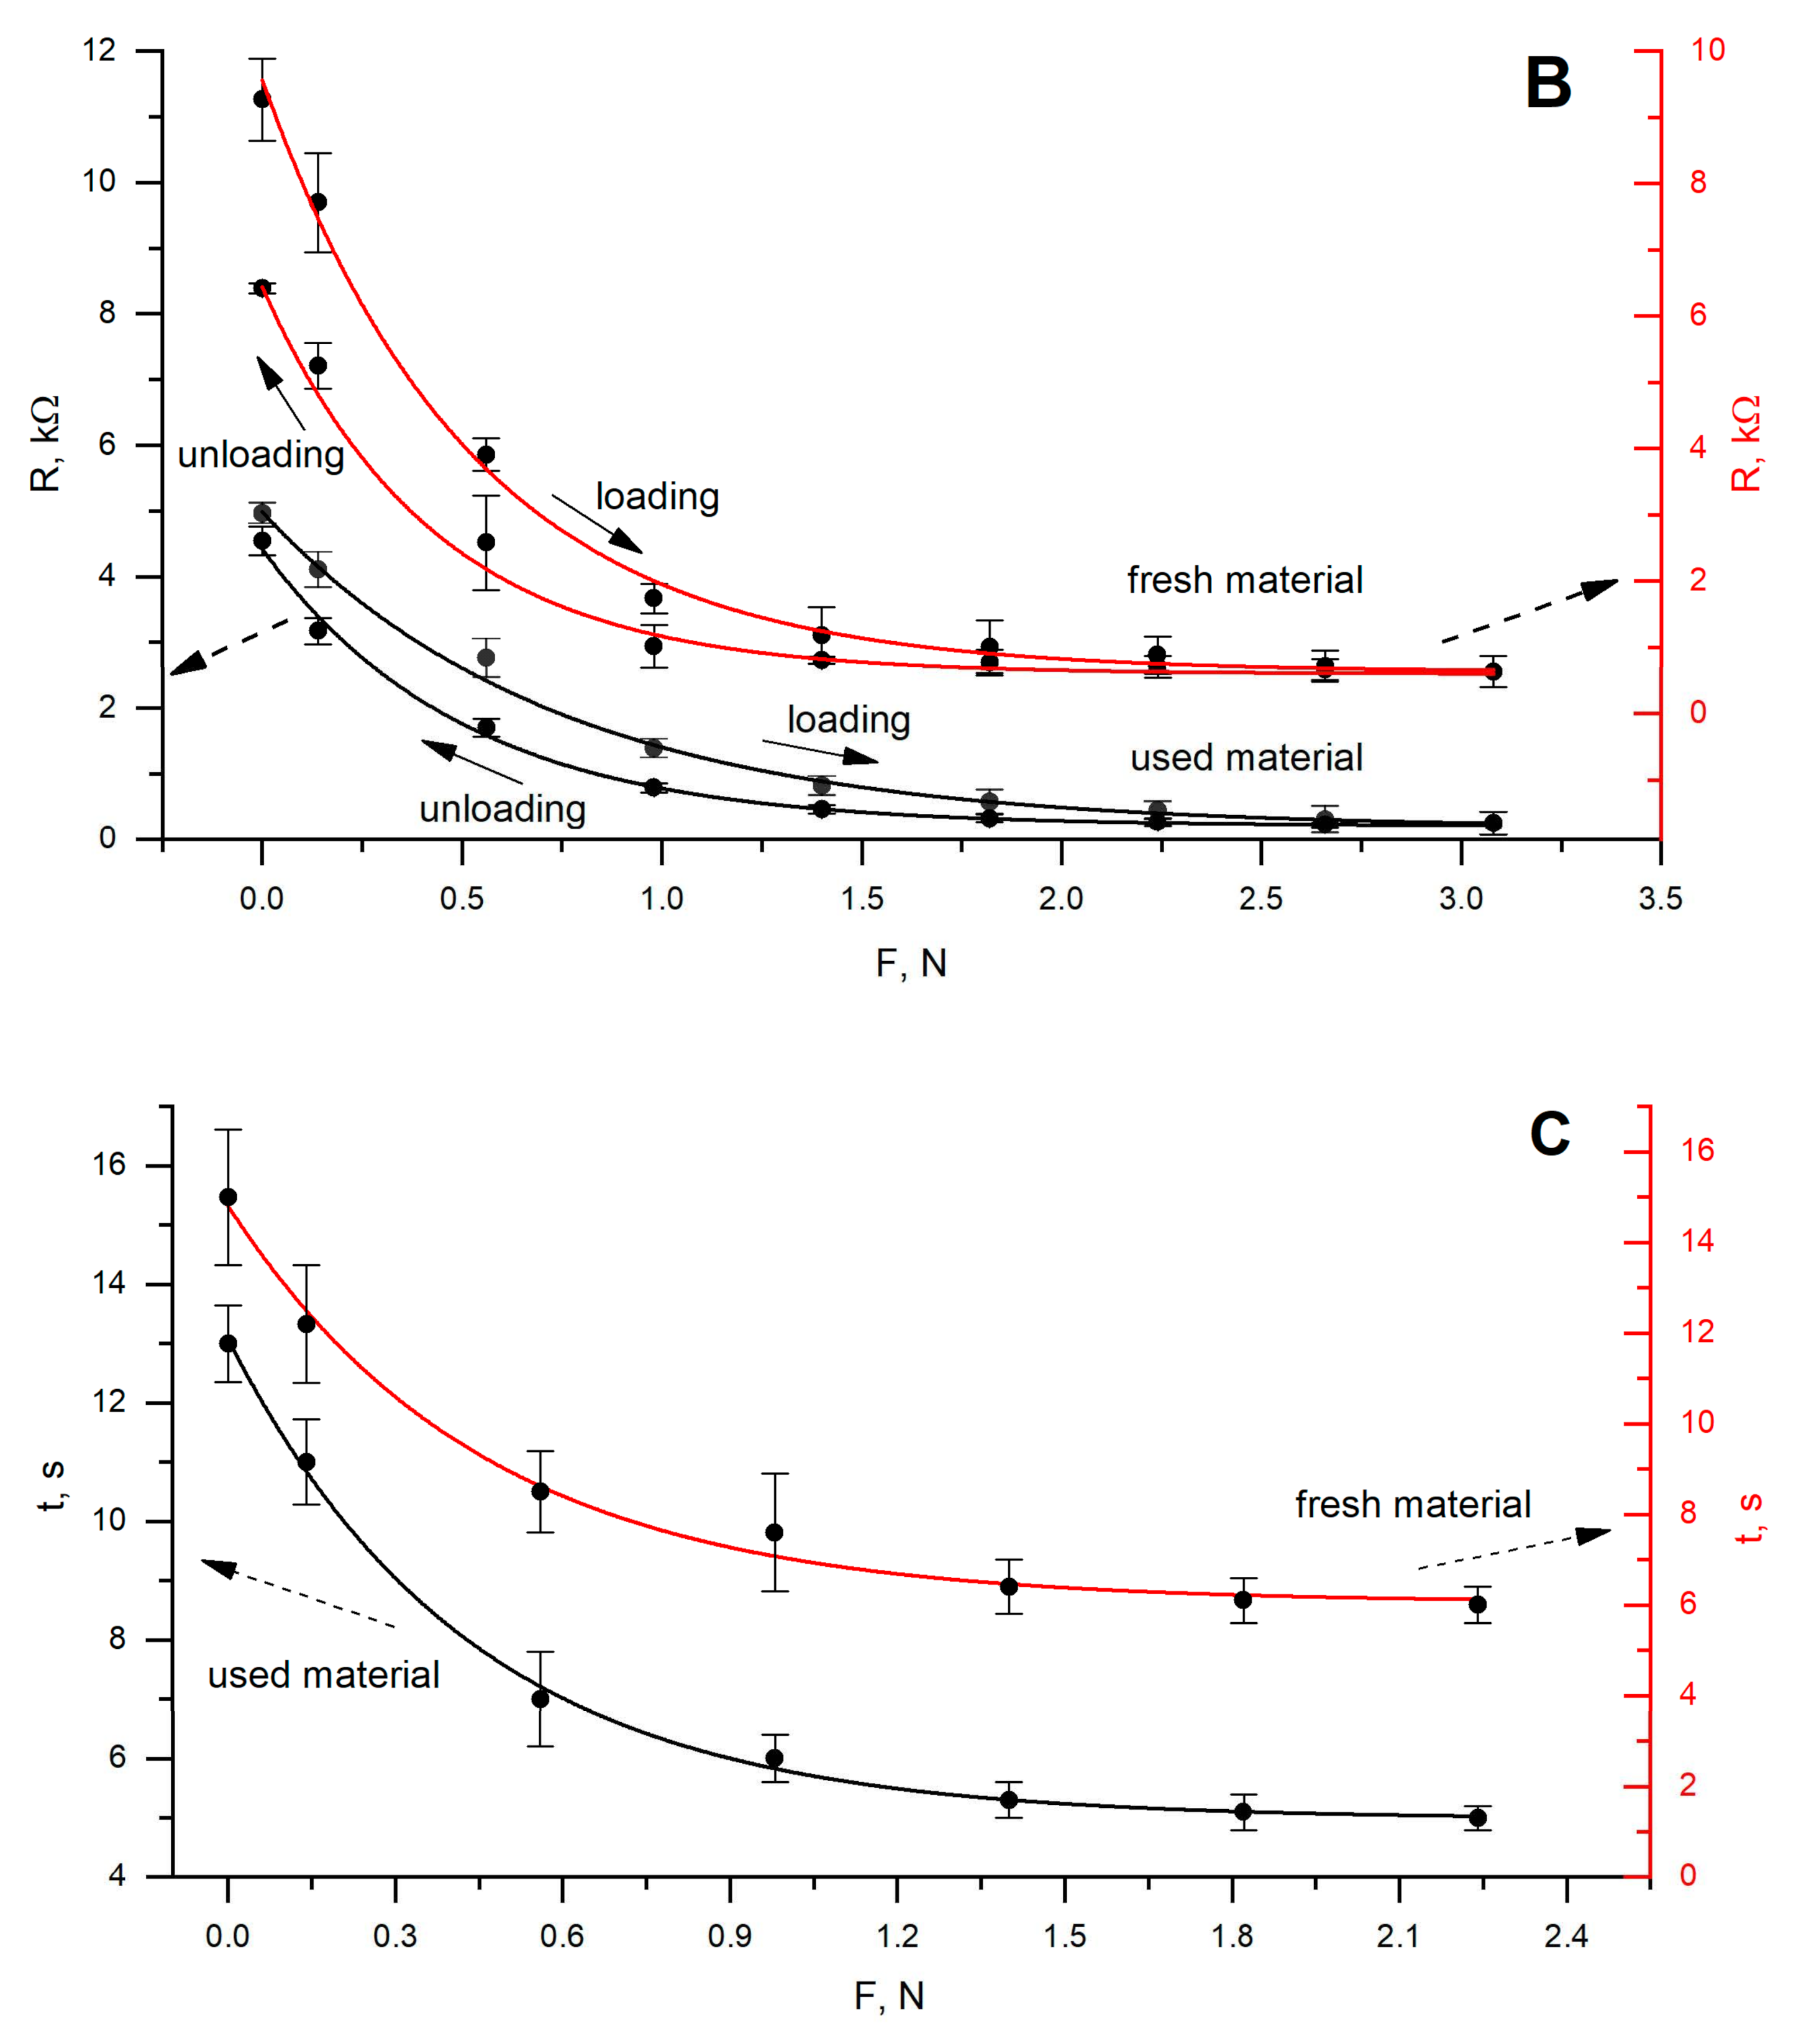
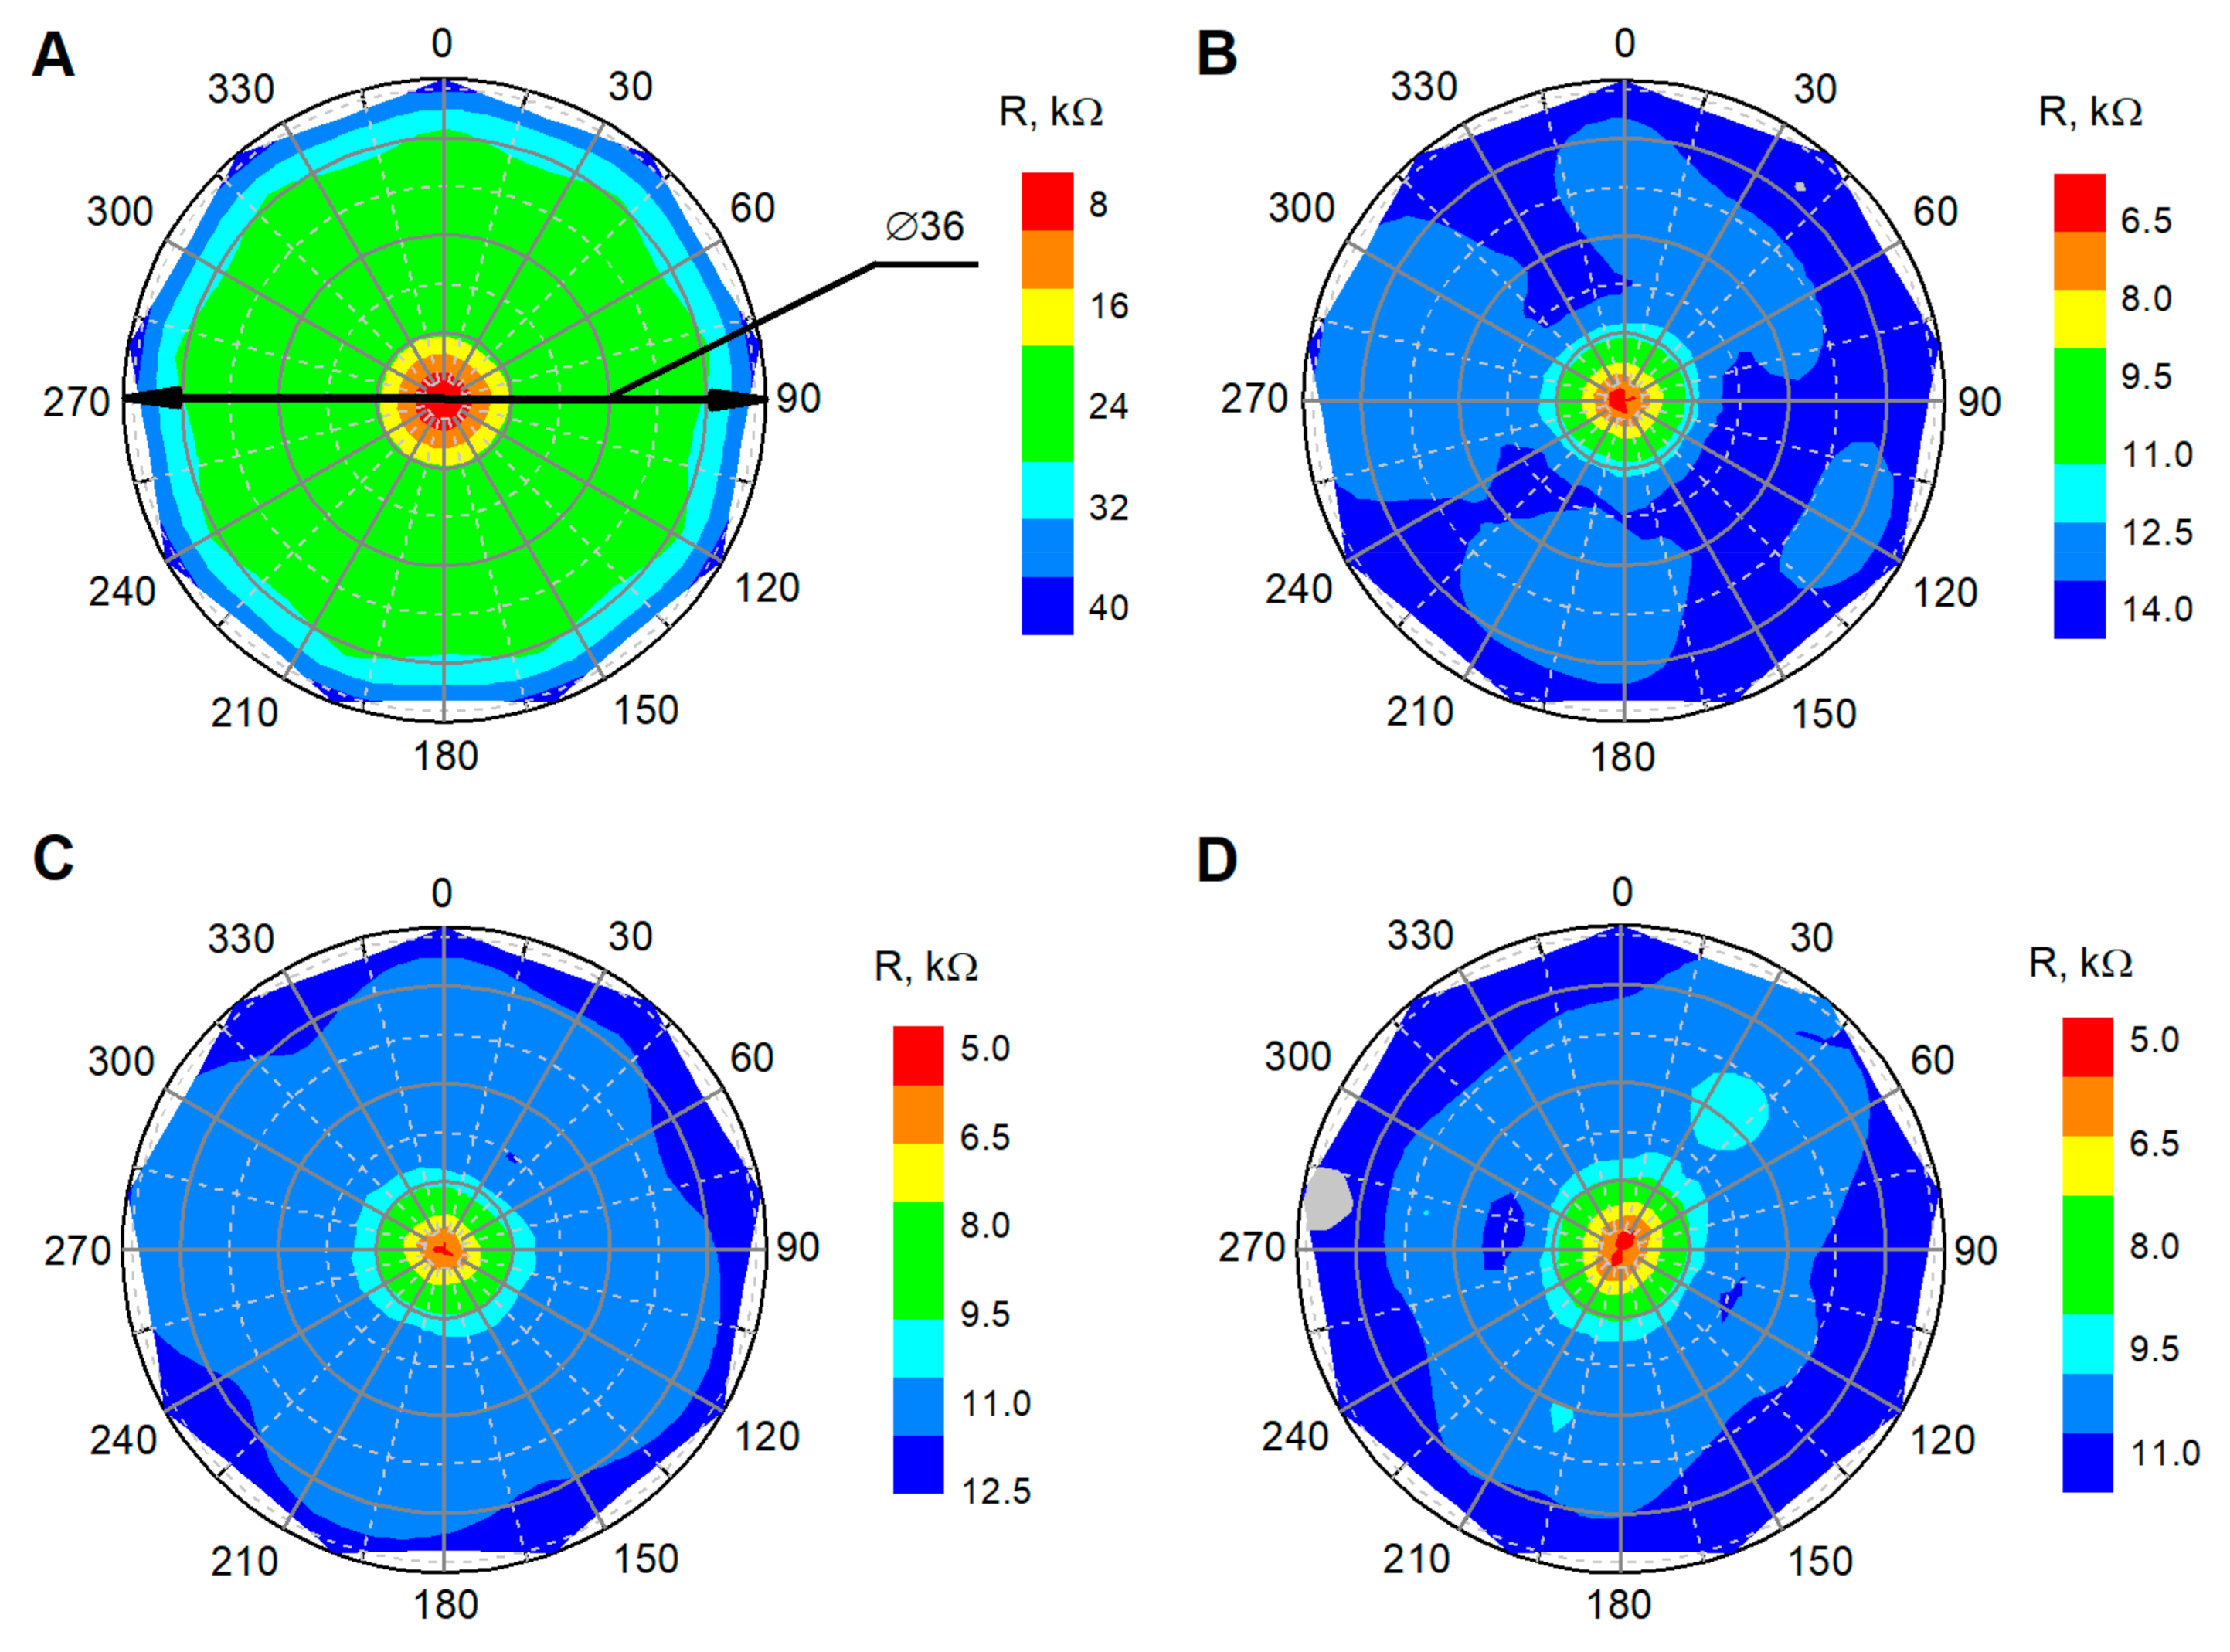
2.3.3. Evaluation of Transverse Sensor Resolution
2.4. Calculations
3. Results of Experimental Research
4. Conclusions
Author Contributions
Funding
Conflicts of Interest
References
- Kim, K.; Lee, K.R.; Kim, W.H.; Park, K.B.; Kim, T.H.; Kim, J.S.; Pak, J.J. Polymer-based flexible tactile sensor up to 32 × 32 arrays integrated with interconnection terminals. Sens. Actuators A Phys. 2009, 156, 284–291. [Google Scholar] [CrossRef]
- Eun-Soo, H.; Jeong-Hoon, S.; Yong-Jun, K. A Polymer-Based Flexible Tactile Sensor for Normal and Shear Load Detection. In Proceedings of the 19th IEEE International Conference on Micro Electro Mechanical Systems, Istanbul, Turkey, 22–26 January 2006; pp. 714–717. [Google Scholar]
- Ules, T.; Hausberger, A.; Grießer, M.; Schlögl, S.; Gruber, D.P. Introduction of a new in-situ measurement system for the study of touch-feel relevant surface properties. Polym. 2020, 12, 1380. [Google Scholar] [CrossRef] [PubMed]
- Ates, B.; Koytepe, S.; Ulu, A.; Gurses, C.; Thakur, V.K. Chemistry, structures, and advanced applications of nanocomposites from biorenewable resources. Chem. Rev. 2020, 120, 9304–9362. [Google Scholar] [CrossRef] [PubMed]
- Samukaite-Bubniene, U.; Valiūnienė, A.; Bucinskas, V.; Genys, P.; Ratautaite, V.; Ramanaviciene, A.; Aksun, E.; Tereshchenko, A.; Zeybek, B.; Ramanavicius, A. Towards supercapacitors: Cyclic voltammetry and fast Fourier transform electrochemical impedance spectroscopy based evaluation of polypyrrole electrochemically deposited on the pencil graphite electrode. Colloids Surf. A Phys. Eng. Asp. 2020, 125750. [Google Scholar] [CrossRef]
- German, N.; Ramanaviciene, A.; Ramanavicius, A. Formation of Polyaniline and Polypyrrole Nanocomposites with Embedded Glucose. Polymers 2019, 11, 377. [Google Scholar] [CrossRef] [Green Version]
- German, N.; Popov, A.; Ramanaviciene, A.; Ramanavicius, A. Enzymatic formation of polyaniline, polypyrrole, and polythiophene nanoparticles with embedded glucose oxidase. Nanomaterials 2019, 9, 806. [Google Scholar] [CrossRef] [Green Version]
- Muhulet, A.; Miculescu, F.; Voicu, S.I.; Schütt, F.; Thakur, V.K.; Mishra, Y.K. Fundamentals and scopes of doped carbon nanotubes towards energy and biosensing applications. Mater. Today Energy 2018, 9, 154–186. [Google Scholar] [CrossRef]
- Barba, R.; De Madrid, Á.P.; Boticario, J.G. Development of an inexpensive sensor network for recognition of sitting posture. Int. J. Distrib. Sens. Netw. 2015, 2015, 969237. [Google Scholar] [CrossRef] [Green Version]
- Giovanelli, D.F.E.; Farella, E. Force sensing resistor and evaluation of technology for wearable body pressure sensing. J. Sens. 2016, 2016, 1–14. [Google Scholar] [CrossRef] [Green Version]
- Ramya, P.; Padmapriya, B.; Poornachandra, S. Foot pressure monitoring using single layer carbon loaded piezoresistive material. Microprocess. Microsyst. 2020, 79, 103263. [Google Scholar] [CrossRef]
- Ahmad, J.; Andersson, H.; Sidén, J. Screen-printed piezoresistive sensors for monitoring pressure distribution in wheelchair. IEEE Sens. J. 2019, 19, 2055–2063. [Google Scholar] [CrossRef]
- Zhang, Y.; Li, L. Modelling and design of MEMS piezoresistive out-of-plane shear and normal stress sensors. Sensors 2018, 18, 3737. [Google Scholar] [CrossRef] [PubMed] [Green Version]
- Palmer, M.C.; O’Rourke, T.D.; Olson, N.A.; Abdoun, T.; Ha, D.; O’Rourke, M.J. Tactile pressure sensors for soil-structure interaction assessment. J. Geotech. Geoenviron. Eng. 2009, 135, 1638–1645. [Google Scholar] [CrossRef] [Green Version]
- Wakabayashi, S.; Arie, T.; Akita, S.; Takei, K. Very thin, macroscale, flexible, tactile pressure sensor sheet. ACS Omega 2020, 5, 17721–17725. [Google Scholar] [CrossRef] [PubMed]
- Li, J.; Chen, S.; Peng, Z.; Deng, Z.; Xing, S.; Wu, Y.; Liu, S.; Liu, L. A multidimensional hierarchical structure designed for lateral strain-isolated ultrasensitive pressure sensing. J. Mater. Chem. C 2020, 8, 922–929. [Google Scholar] [CrossRef]
- Stassi, S.; Cauda, V.; Canavese, G.; Pirri, C.F. Flexible tactile sensing based on piezoresistive composites: A review. Sensors 2014, 14, 5296–5332. [Google Scholar] [CrossRef] [Green Version]
- Yousef, H.; Boukallel, M.; Althoefer, K. Tactile sensing for dexterous in-hand manipulation in robotics—A review. Sens. Actuators A Phys. 2011, 167, 171–187. [Google Scholar] [CrossRef]
- Zhang, Y.; Ye, J.; Lin, Z.; Huang, S.; Wang, H.; Wu, H. A piezoresistive tactile sensor for a large area employing neural network. Sensors 2018, 19, 27. [Google Scholar] [CrossRef] [Green Version]
- Hopkins, M.; Vaidyanathan, R.; McGregor, A.H. Examination of the performance characteristics of velostat as an in-socket pressure sensor. IEEE Sens. J. 2020, 20, 6992–7000. [Google Scholar] [CrossRef]
- Wen, F.; Sun, Z.; He, T.; Shi, Q.; Zhu, M.; Zhang, Z.; Li, L.; Zhang, T.; Lee, C. Machine learning glove using self-powered conductive superhydrophobic triboelectric textile for gesture recognition in VR/AR applications. Adv. Sci. 2020, 7, 2000261. [Google Scholar] [CrossRef]
- Regtien, P.P.L. Sensors for Mechatronics, 2nd ed.; Elsevier: Amsterdam, The Netherlands, 2012. [Google Scholar]
- Tihak, A.; Bošković, D. Experimental evaluation of challenges in designing a resistive pressure sensors. In Proceedings of the EUROCON 2019—18th International Conference on Smart Technologies, Novi Sad, Serbia, 1–4 July 2019; Institute of Electrical and Electronics Engineers Inc.: Piscataway, NJ, USA, 2019; pp. 1–6. [Google Scholar]
- Medrano-Sanchez, C.; Igual-Catalan, R.; Rodriguez-Ontiveros, V.H.; Plaza-Garcia, I. Circuit analysis of matrix-like resistor networks for eliminating crosstalk in pressure sensitive mats. IEEE Sens. J. 2019, 19, 8027–8036. [Google Scholar] [CrossRef]
- Katunin, A.; Krukiewicz, K. Electrical percolation in composites of conducting polymers and dielectrics. J. Polym. Eng. 2015, 35, 731–741. [Google Scholar] [CrossRef]
- Kalaitzidou, K.; Fukushima, H.; Drzal, L.T. A route for polymer nanocomposites with engineered electrical conductivity and percolation threshold. Materials 2010, 3, 1089–1103. [Google Scholar] [CrossRef]
- Liang, J.Z.; Yang, Q.Q. Effects of carbon fiber content and size on electric conductive properties of reinforced high density polyethylene composites. Compos. Part B Eng. 2017, 114, 457–466. [Google Scholar] [CrossRef]
- Modine, F.A.; Duggal, A.R.; Robinson, D.N.; Churnetski, E.L.; Bartkowiak, M.; Mahan, G.D.; Levinson, L.M. Electrical properties of polyethylene highly filled with carbon. J. Mater. Res. 1996, 11, 2889–2894. [Google Scholar] [CrossRef]
- Li, Y.; Nie, M.; Wang, Q. Facile fabrication of electrically conductive low-density polyethylene/carbon fiber tubes for novel smart materials via multiaxial orientation. ACS Appl. Mater. Interfaces 2018, 10, 1005–1016. [Google Scholar] [CrossRef]
- Gupta, T.K.; Kumar, S.; Khan, A.Z.; Varadarajan, K.M.; Cantwell, W.J. Self-sensing performance of MWCNT-low density polyethylene nanocomposites. Mater. Res. Express 2018, 5, 015703. [Google Scholar] [CrossRef]
- Gubbels, F.; Jerome, R.; Vanlathem, E.; Deltour, R.; Blacher, S.; Brouers, F. Kinetic and thermodynamic control of the selective localization of carbon black at the interface of immiscible polymer blends. Chem. Mater. 1998, 10, 1227–1235. [Google Scholar] [CrossRef]
- Gong, T.; Peng, S.P.; Bao, R.Y.; Yang, W.; Xie, B.H.; Yang, M.B. Low percolation threshold and balanced electrical and mechanical performances in polypropylene/carbon black composites with a continuous segregated structure. Compos. Part B Eng. 2016, 99, 348–357. [Google Scholar] [CrossRef]
- Clingerman, M.L.; King, J.A.; Schulz, K.H.; Meyers, J.D. Evaluation of electrical conductivity models for conductive polymer composites. J. Appl. Polym. Sci. 2002, 83, 1341–1356. [Google Scholar] [CrossRef]
- Suprapto, S.S.; Setiawan, A.W.; Zakaria, H.; Adiprawita, W.; Supartono, B. Low-cost pressure sensor matrix using velostat. In Proceedings of the 2017 5th International Conference on Instrumentation, Communications Information Technolology and Biomedical Engeneering ICICI-BME 2017, Bandung, Indonesia, 6–7 November 2017; pp. 137–140. [Google Scholar] [CrossRef]
- Johnson, S. Surfaces and their measurement. Tribol. Int. 2003, 36, 213–214. [Google Scholar] [CrossRef]
- Kim, B.; Lee, S.B.; Lee, J.; Cho, S.; Park, H.; Yeom, S.; Park, S.H. A comparison among Neo-Hookean model, Mooney-Rivlin model, and Ogden model for Chloroprene rubber. Int. J. Precis. Eng. Manuf. 2012, 13, 759–764. [Google Scholar] [CrossRef]
- Del Prete, Z.; Monteleone, L.; Steindler, R. A novel pressure array sensor based on contact resistance variation: Metrological properties. Rev. Sci. Instrum. 2001, 72, 1548–1553. [Google Scholar] [CrossRef]
- Lin, X.; Seet, B.C. A linear wide-range textile pressure sensor integrally embedded in regular fabric. IEEE Sens. J. 2015, 15, 5384–5385. [Google Scholar] [CrossRef]
- Duc, C.K.; Hoang, V.P.; Nguyen, D.T.; Dao, T.T. A low-cost, flexible pressure capacitor sensor using polyurethane for wireless vehicle detection. Polymers 2019, 11, 1247. [Google Scholar] [CrossRef] [Green Version]
- Janczak, D.; Słoma, M.; Wróblewski, G.; Młożniak, A.; Jakubowska, M. Screen-printed resistive pressure sensors containing graphene nanoplatelets and carbon nanotubes. Sensors 2014, 14, 17304–17312. [Google Scholar] [CrossRef] [Green Version]
- Kalantari, M.; Dargahi, J.; Kövecses, J.; Mardasi, M.G.; Nouri, S. A new approach for modeling piezoresistive force sensors based on semiconductive polymer composites. IEEE ASME Trans. Mechatron. 2012, 17, 572–581. [Google Scholar] [CrossRef] [Green Version]
- Lee, B.W.; Shin, H. Feasibility study of sitting posture monitoring based on piezoresistive conductive film-based flexible force sensor. IEEE Sens. J. 2015, 16, 15–16. [Google Scholar] [CrossRef]
- Pizarro, F.; Villavicencio, P.; Yunge, D.; Rodríguez, M.; Hermosilla, G.; Leiva, A. Easy-to-build textile pressure sensor. Sensors 2018, 18, 1190. [Google Scholar] [CrossRef] [Green Version]
- Salibindla, S.; Ripoche, B.; Lai, D.T.H.; Maas, S. Characterization of a new flexible pressure sensor for body sensor networks. In Proceedings of the 2013 IEEE 8th International Conference on Intelligent Sensors, Sensor Networks and Information Processing: Sensing the Future, ISSNIP 2013, Melbourne, Australia, 2–5 April 2013; Volume 1, pp. 27–31. [Google Scholar]
- Ferreira, A.G.; Catarino, A.P.; Monteiro, J.L.; Rocha, A.M. Textile-based pressure sensors for step detection: A preliminary assessment. In Proceedings of the IOP Conference Series: Materials Science and Engineering, Lesvos, Greece, 5–7 September 2018; Institute of Physics Publishing: Bristol, UK, 2018; Volume 459. [Google Scholar]
- Test and fabrication of piezoresistive sensors for contact pressure measurement. Rev. Fac. Ing. 2017, 2017, 47–52. [CrossRef] [Green Version]
- Ahmad, J.; Andersson, H.; Siden, J. Sitting posture recognition using screen printed large area pressure sensors. In Proceedings of the IEEE Sensors, Glagow, UK, 29 October–1 November 2017; Volume 2017, pp. 1–3. [Google Scholar]


| Material, Electrode | Measured Quantity, Contact Area, mm2 | Evaluated Characteristics | Ref. |
|---|---|---|---|
| Velostat®, copper | Force (0–3 N), 25 | Sensitivity, hysteresis, mechanical compression, response time, transverse resolution | This work |
| Velostat®, - | Pressure (0–250 kPa), 100 | Sensitivity, repeatability, time drift, hysteresis, dynamic response, sensitivity threshold | [37] |
| Velostat®, copper | Pressure (0–0.27 kPa), 450 | settling time, dynamic response | [10] |
| Velostat®, silver-covered polyamide | Pressure (0–1000 kPa), 100 | Sensitivity, | [38] |
| Polyurethane film, Aluminum foil | Pressure (0–650 KPa), 4900 | Sensitivity, cycle test | [39] |
| Graphene nanoplatelets and carbon nanotubes, PMMA and PVDF, Silver | Pressure (0–100 000 kPa), - | Sensitivity, | [40] |
| Linqstat, copper | Force (0–5 N), - | Resolution | [41] |
| Velostat®, aluminum foil | Force (0–40 N), 10150 and 2040 | Replicability, repeatability | [9] |
| Velostat®, copper | Force (10–100 N), 219.8 | Sensitivity, | [42] |
| LDPE, Shieldex NoraDell woven fabric sheets | Pressure (1–10 kPa), 342 | Sensitivity, recovery time | [43] |
| Velostat®, several different materials | Force (0–20 N), 1000 | Sensitivity, | [44] |
| Velostat®, Satatex Techniktex P-130 | Force (2–136 N, 2–173 N, and 2–210 N), 56.25 | Cyclic, time | [45] |
| Velostat® and EX-STATIC fabric, copper | Force (0–500 N), 100 | Sensitivity, time drift | [46] |
| Polyethylene Terapthalate, silver | Force (0–53 N), - | Sensitivity, time drift | [47] |
| Velostat®, - | Force (0–16 N) - | Sensitivity, time drift | [34] |
Publisher’s Note: MDPI stays neutral with regard to jurisdictional claims in published maps and institutional affiliations. |
© 2020 by the authors. Licensee MDPI, Basel, Switzerland. This article is an open access article distributed under the terms and conditions of the Creative Commons Attribution (CC BY) license (http://creativecommons.org/licenses/by/4.0/).
Share and Cite
Dzedzickis, A.; Sutinys, E.; Bucinskas, V.; Samukaite-Bubniene, U.; Jakstys, B.; Ramanavicius, A.; Morkvenaite-Vilkonciene, I. Polyethylene-Carbon Composite (Velostat®) Based Tactile Sensor. Polymers 2020, 12, 2905. https://doi.org/10.3390/polym12122905
Dzedzickis A, Sutinys E, Bucinskas V, Samukaite-Bubniene U, Jakstys B, Ramanavicius A, Morkvenaite-Vilkonciene I. Polyethylene-Carbon Composite (Velostat®) Based Tactile Sensor. Polymers. 2020; 12(12):2905. https://doi.org/10.3390/polym12122905
Chicago/Turabian StyleDzedzickis, Andrius, Ernestas Sutinys, Vytautas Bucinskas, Urte Samukaite-Bubniene, Baltramiejus Jakstys, Arunas Ramanavicius, and Inga Morkvenaite-Vilkonciene. 2020. "Polyethylene-Carbon Composite (Velostat®) Based Tactile Sensor" Polymers 12, no. 12: 2905. https://doi.org/10.3390/polym12122905