Interior of Amylopectin and Nano-Sized Amylopectin Fragments Probed by Viscometry, Dynamic Light Scattering, and Pyrene Excimer Fluorescence


Abstract
:
1. Introduction
2. Experimental Section
2.1. Instrumentation
2.2. Chemicals
2.3. Purification of the NAFs by Precipitation
2.4. Dynamic Light Scattering (DLS)
2.5. Viscometry
2.6. Density of PEO(5.0K) Solutions in DMSO
2.7. Degradation of NAF57 by Nitric Acid
2.8. Synthesis of Pyrene-Labeled NAFs (Py-NAFs)
2.9. Deformability of the Polysaccharides
2.10. Fluorescence Blob Model (FBM) Analysis of the Fluorescence Decays of Py(4.8)-NAF57
3. Results and Discussion
3.1. Viscometry and DLS Experiments
3.2. Steady-State Fluorescence of the Pyrene-Labeled NAFs and Amylopectin
3.3. Osmotic Pressure Experiments
3.4. Time-Resolved Fluorescence of Py(4.8)-NAF57
4. Conclusions
Supplementary Materials
Author Contributions
Funding
Acknowledgments
Conflicts of Interest
References
- Le Corre, D.; Bras, J.; Dufresne, A. Starch Nanoparticles: A Review. Biomacromolecules 2010, 11, 1139–1153. [Google Scholar] [CrossRef] [PubMed]
- Delcour, J.A.; Bruneel, C.; Derde, L.J.; Gomand, S.V.; Pareyt, B.; Putseys, J.A.; Wilderjans, E.; Lamberts, L. Fate of Starch in Food Processing: From Raw Materials to Final Food Products. Ann. Rev. Food Sci. Technol. 2010, 1, 87–111. [Google Scholar] [CrossRef] [PubMed]
- Giezen Franciscus, E.; Jongboom Remigius Oene, J.; Feil, H.; Gotlieb Kornelis, F.; Boersma, A. Biopolymer Nanoparticles. U.S. Patent US 6677386 B1, 13 January 2004. [Google Scholar]
- Hancock, R.D.; Tarbet, B.J. The Other Double Helix—The Fascinating Chemistry of Starch. J. Chem. Educ. 2000, 77, 988–992. [Google Scholar] [CrossRef]
- Campos, E.; Branquinho, J.; Carreira, A.S.; Carvalho, A.; Coimbra, P.; Ferreira, P.; Gil, M.H. Designing Polymeric Microparticles for Biomedical and Industrial Applications. Eur. Polym. J. 2013, 49, 2005–2021. [Google Scholar] [CrossRef]
- Rayner, M.; Marku, D.; Eriksson, M.; Sjöö, M.; Dejmek, P.; Wahlgren, M. Biomass-Based Particles for the Formulation of Pickering Type Emulsions in Food and Topical Applications. Colloids Surf. A 2014, 458, 48–62. [Google Scholar] [CrossRef]
- Pei, X.; Tan, Y.; Xu, K.; Liu, C.; Lu, C.; Wang, P. Pickering Polymerization of Styrene Stabilized by Starch-Based Nanospheres. Polym. Chem. 2016, 7, 3325–3333. [Google Scholar] [CrossRef]
- Ye, F.; Miao, M.; Lu, K.; Jiang, B.; Li, X.; Cui, S.W. Structure and Physicochemical Properties for Modified Starch-Based Nanoparticle from Different Maize Varieties. Food Hydrocoll. 2017, 67, 37–44. [Google Scholar] [CrossRef]
- Simi, C.K.; Emilia Abraham, T. Hydrophobic Grafted and Cross-Linked Starch Nanoparticles for Drug Delivery. Bioprocess Biosyst. Eng. 2007, 30, 173–180. [Google Scholar] [CrossRef]
- Pei, X.; Zhai, K.; Tan, Y.; Xu, K.; Lu, C.; Wang, P.; Wang, T.; Chen, C.; Tao, Y.; Dai, L.; et al. Synthesis of Monodisperse Starch-Polystyrene Core-Shell Nanoparticles via Seeded Emulsion Polymerization without Stabilizer. Polymer 2017, 108, 78–86. [Google Scholar] [CrossRef]
- Kang, B.G.; Yoon, S.H.; Lee, S.H.; Yie, J.E.; Yoon, B.S.; Suh, M.H. Studies on the Physical Properties of Modified Starch-Filled HDPE Film. J. Appl. Polym. Sci. 1996, 60, 1977–1984. [Google Scholar] [CrossRef]
- Kim, D.; Amos, R.; Gauthier, M.; Duhamel, J. Applications of Pyrene Fluorescence to the Characterization of Hydrophobically Modified Starch Nanoparticles. Langmuir 2018, 34, 8611–8621. [Google Scholar] [CrossRef] [PubMed]
- Kim, D.; Amos, R.C.; Gauthier, M.; Duhamel, J. Assemblies of Hydrophobically Modified Starch Nanoparticles Probed by Surface Tension and Pyrene Fluorescence. In ACS Symposium Series Nanoparticles and Molecular Assemblies; Nagarajan, R., Ed.; American Chemical Society: Washington, DC, USA, 2020. [Google Scholar]
- Wildi, R.H.; Van Egdob, E.; Bloembergen, S. Process for Producing Biopolymer Nanoparticles. U.S. Patent PCT/US2007/075901, 21 February 2008. [Google Scholar]
- Li, L.; Kim, D.; Zhai, X.; Duhamel, J. A Pyrene Excimer Fluorescence (PEF) Study of the Interior of Amylopectinin Dilute Solution. Macromolecules 2020, 53, 6850–6860. [Google Scholar] [CrossRef]
- Winnik, F.M. Photophysics of Preassociated Pyrenes in Aqueous Polymer Solutions and in Other Organized Media. Chem. Rev. 1993, 93, 587–614. [Google Scholar] [CrossRef]
- Cuniberti, C.; Perico, A. Intramolecular Excimer Formation in Polymers Pyrene-Labeled Polyvinylacetate. Eur. Polym. J. 1980, 16, 887–893. [Google Scholar] [CrossRef]
- Millard, M.M.; Dintzis, F.R.; Willett, J.J.; Klavons, J.A. Light Scattering Molecular Weights and Intrinsic Viscosities of Processed Waxy Maize Starches in 90% Dimethyl Sulfoxide and H2O. Cereal Chem. 1997, 74, 687–691. [Google Scholar] [CrossRef]
- Li, L.; Duhamel, J. Conformation of Pyrene-Labeled Amylose in DMSO Characterized with the Fluorescence Blob Model. Macromolecules 2016, 49, 7965–7974. [Google Scholar] [CrossRef] [Green Version]
- Bastide, J.; Candau, S.; Leibler, L. Osmotic De-Swelling of Gels by Polymer-Solutions. Macromolecules 1981, 14, 719–726. [Google Scholar] [CrossRef]
- Inomata, H.; Nagahama, K.; Saito, S. Measurement and Correlation of the Swelling Pressure of N-Isopropylacrylamide Gel. Macromolecules 1994, 27, 6459–6464. [Google Scholar] [CrossRef]
- Nagahama, K.; Inomata, H.; Saito, S. Measurement of Osmotic-Pressure in Aqueous-Solutions of Poly (Ethylene Glycol) and Poly (N-Isopropylacrylamide). Fluid Phase Equilib. 1994, 96, 203–214. [Google Scholar] [CrossRef]
- Ishidao, T.; Akagi, M.; Sugimoto, H.; Iwai, Y.; Arai, Y. Swelling Behaviors of Poly (N-Isopropylacrylamide) Gel in Poly (Ethylene Glycol)—Water Mixtures. Macromolecules 1993, 26, 7361–7362. [Google Scholar] [CrossRef]
- Ishidao, T.; Akagi, M.; Sugimoto, H.; Onoue, Y.; Iwai, Y.; Arai, Y. Swelling Equilibria of Poly (N-Isopropylacrylamide) Gel in Aqueous Polymer-Solutions. Fluid Phase Equilib. 1995, 104, 119–129. [Google Scholar] [CrossRef]
- Saunders, B.R.; Vincent, B. Thermal and Osmotic Deswelling of Poly (NIPAM) Microgel Particles. J. Chem. Soc. Faraday Trans. 1996, 92, 3385–3389. [Google Scholar] [CrossRef]
- Flory, P.J. Principles of Polymer Chemistry; Cornell University Press: Ithaca, NY, USA, 1953; p. 672. [Google Scholar]
- Pattanyek, S.K.; Juvekar, V.A. Prediction of Adsorption of Nonionic Polymers from Aqueous Solutions to Solid Surfaces. Macromolecules 2002, 35, 9574–9585. [Google Scholar] [CrossRef]
- Perez, S.; Bertoft, E. The Molecular Structures of Starch Components and Their Contribution to the Architecture of Starch Granules: A Comprehensive Review. Starch Stärke 2010, 62, 389–420. [Google Scholar] [CrossRef]

 ) the NAFs, (
  ) NAF57, (
  ) the degraded NAF57 samples, and (
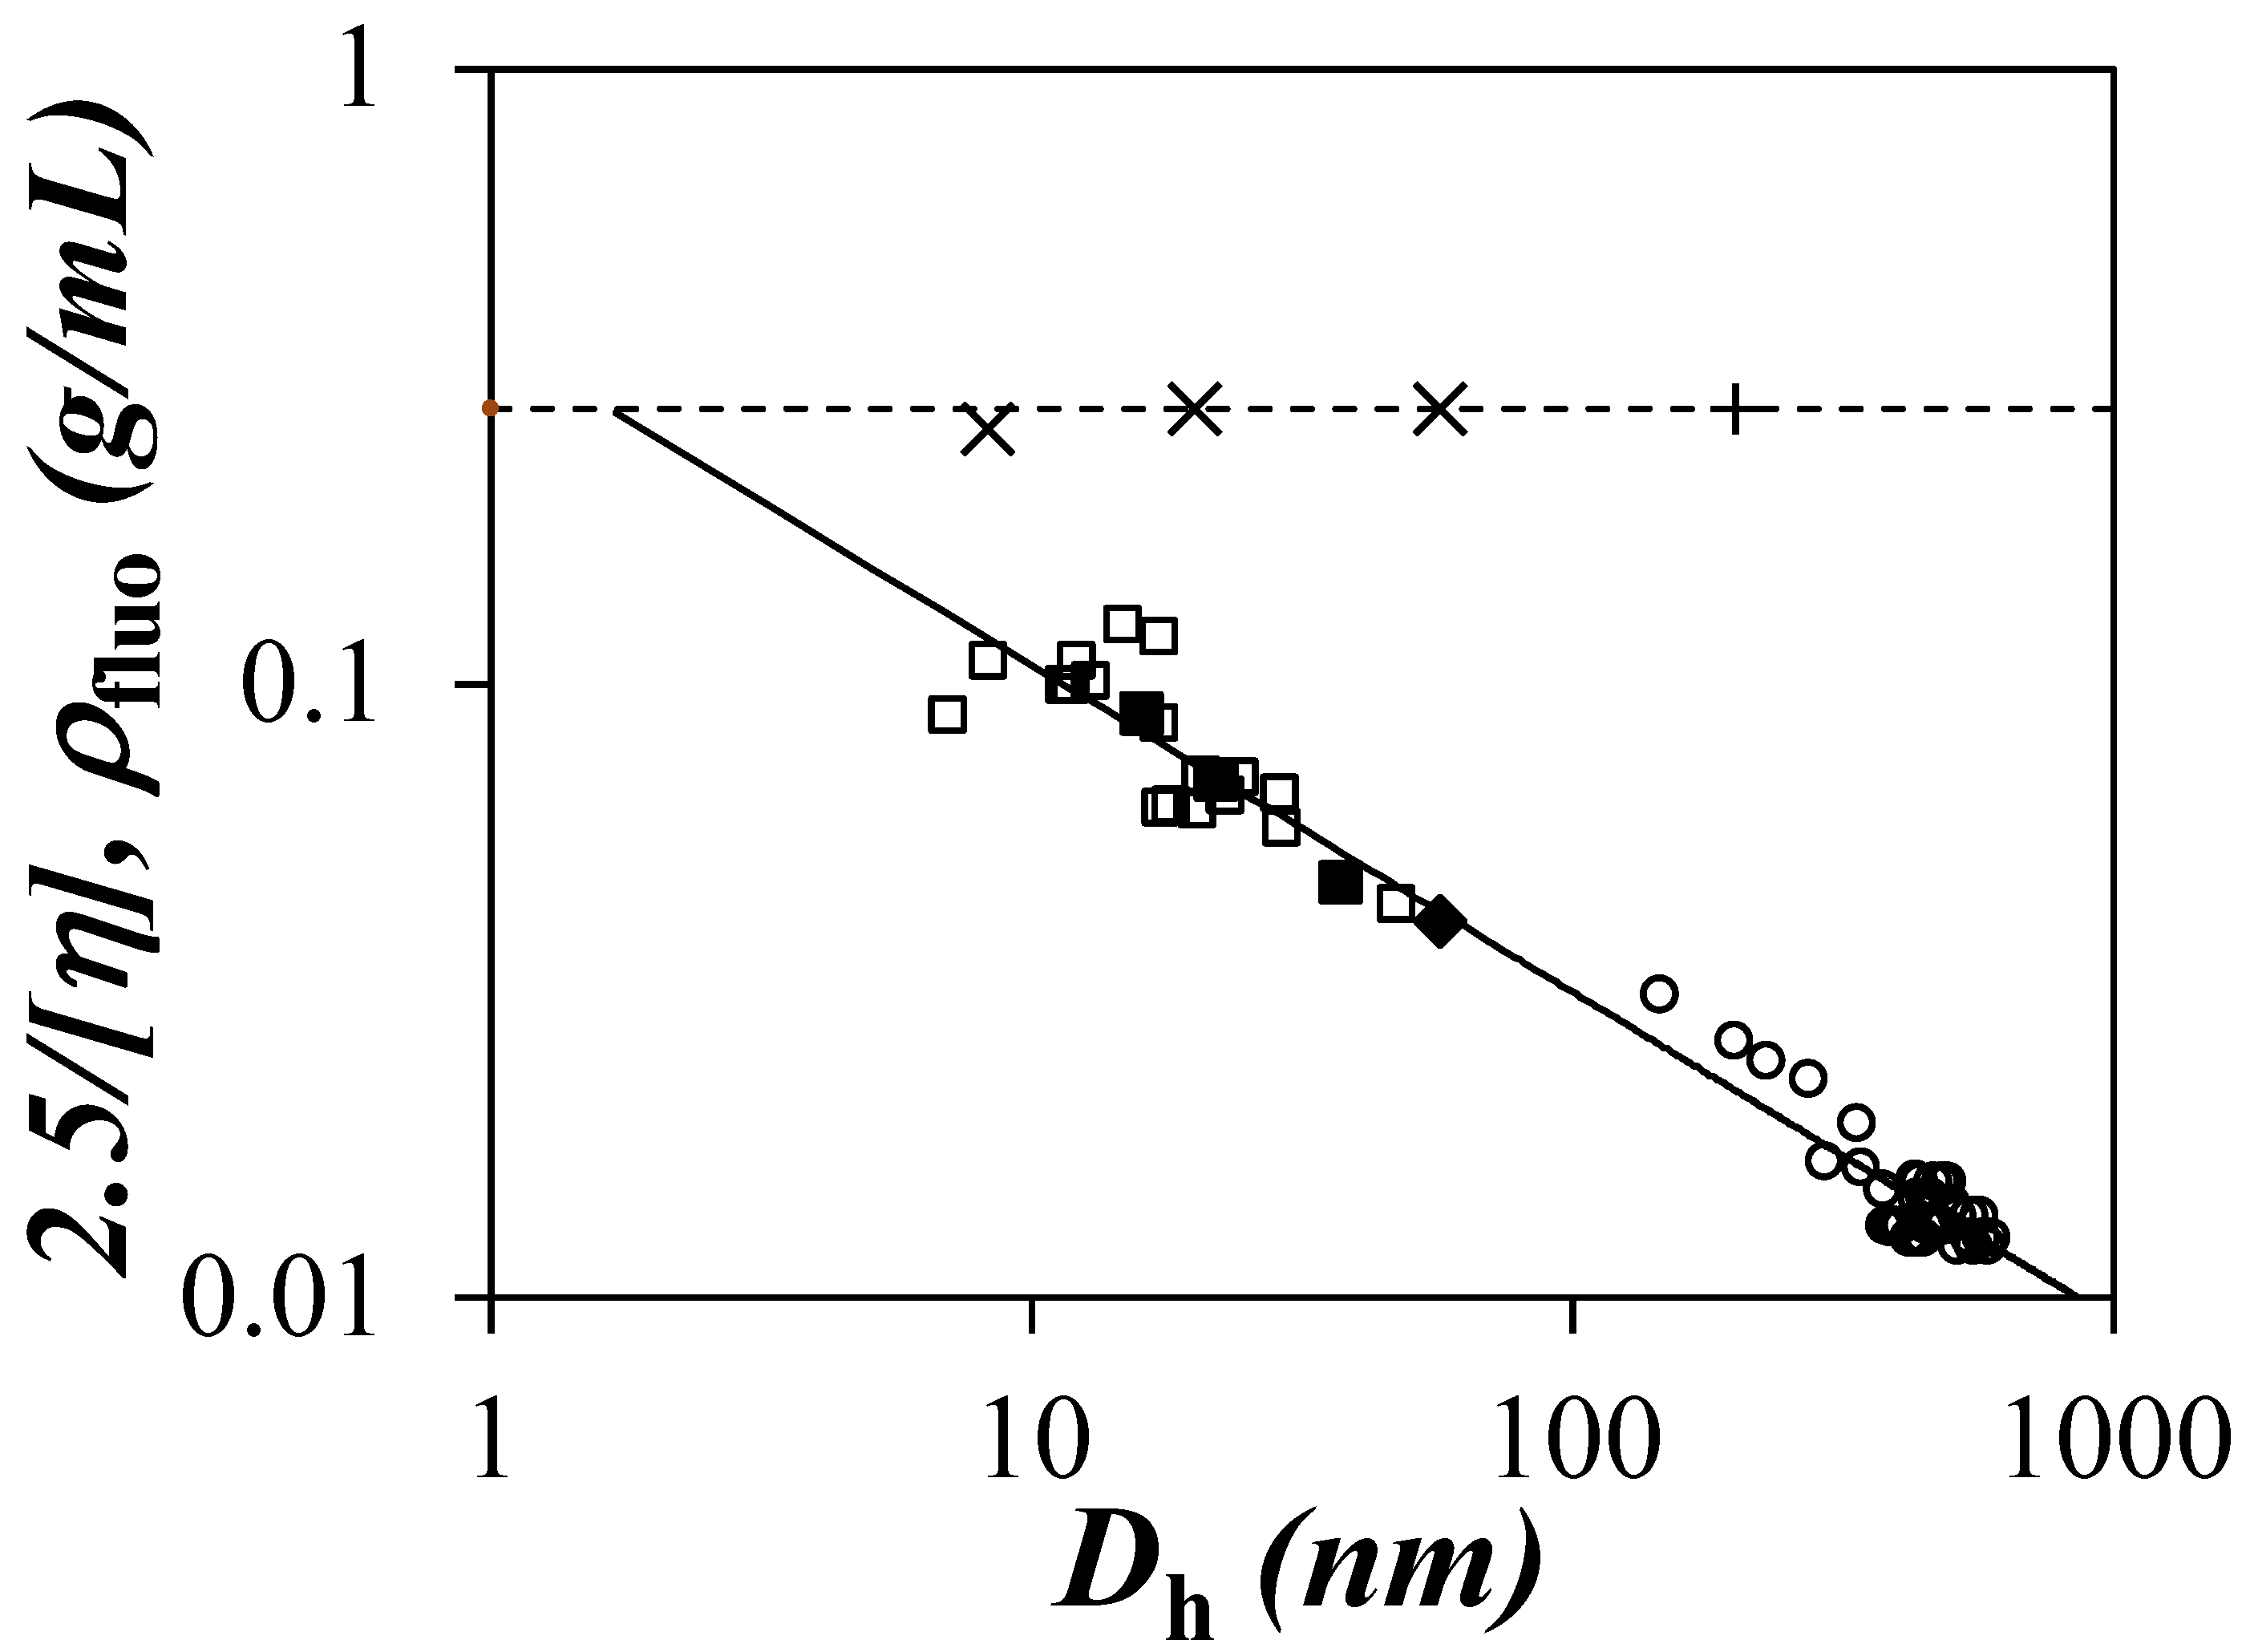
  ) a series of samples derived from amylopectin in dimethyl sulfoxide (DMSO). Data for ρfluo: (×) NAFs and (+) amylopectin [12]. [η] = 6.9 × Dh0.53.
) the NAFs, ( ) NAF57, ( ) the degraded NAF57 samples, and ( ) a series of samples derived from amylopectin in dimethyl sulfoxide (DMSO). Data for ρfluo: (×) NAFs and (+) amylopectin [12]. [η] = 6.9 × Dh0.53.
) a series of samples derived from amylopectin in dimethyl sulfoxide (DMSO). Data for ρfluo: (×) NAFs and (+) amylopectin [12]. [η] = 6.9 × Dh0.53.
) the NAFs, ( ) NAF57, ( ) the degraded NAF57 samples, and ( ) a series of samples derived from amylopectin in dimethyl sulfoxide (DMSO). Data for ρfluo: (×) NAFs and (+) amylopectin [12]. [η] = 6.9 × Dh0.53.
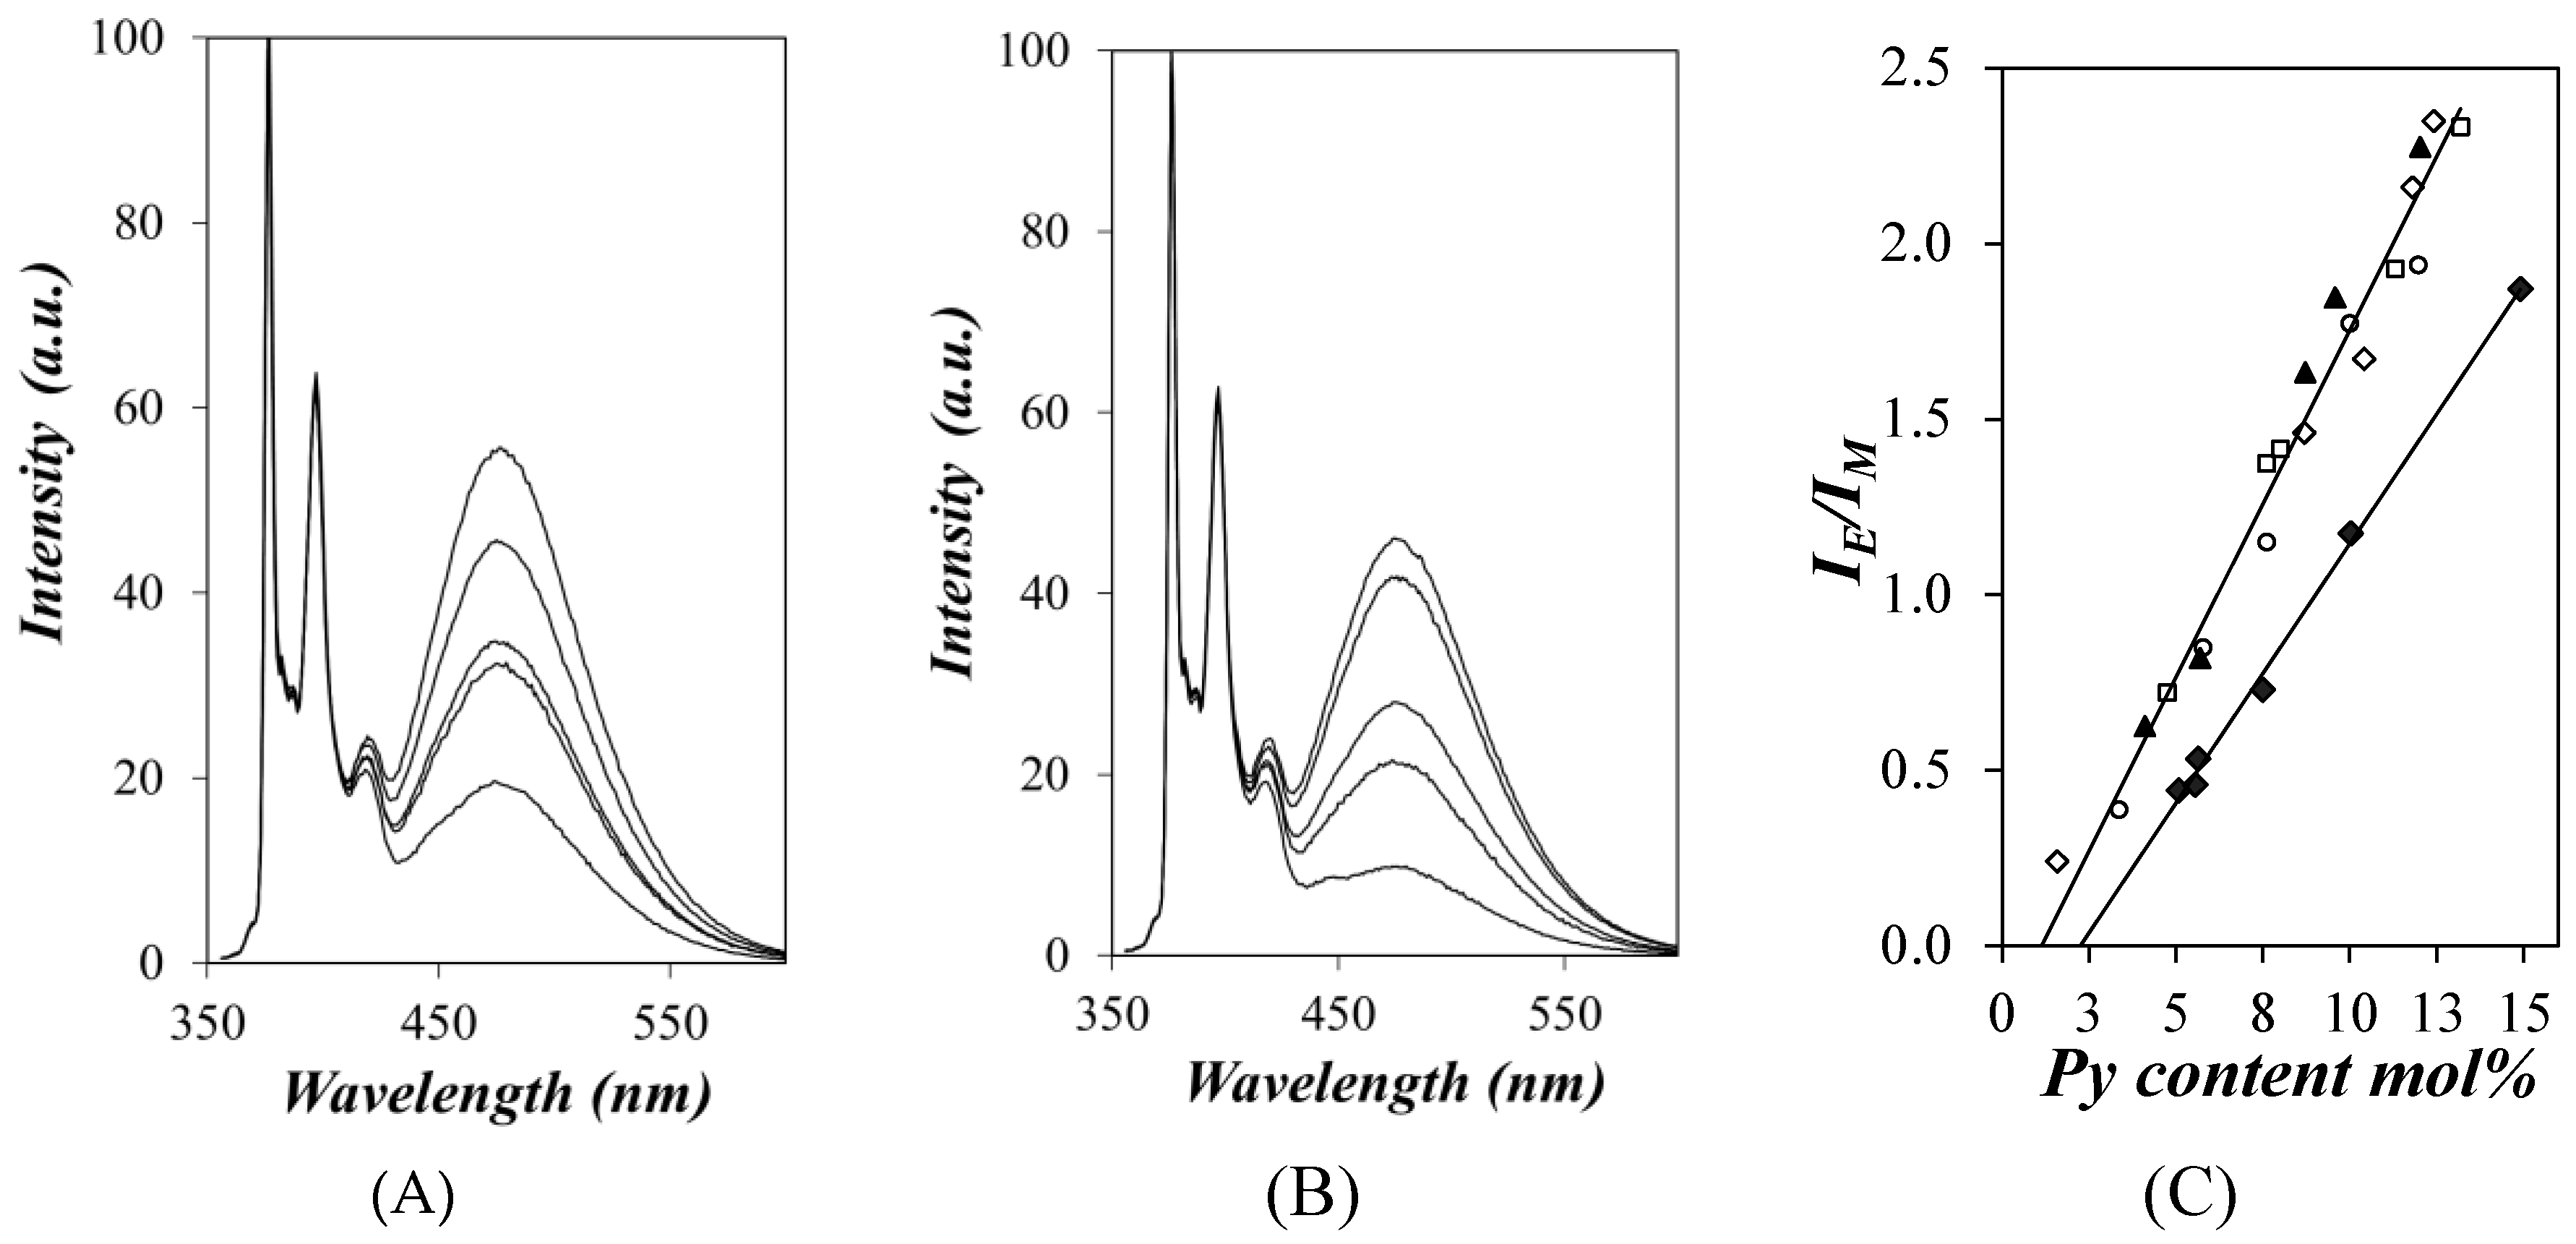
 ) Py-Amylopectin [15], (
  ) Py-NAF57, (
  ) Py-NAF20, (
  ) Py-NAF8.3, and (
  ) Py-Amylose [19].
) Py-Amylopectin [15], ( ) Py-NAF57, ( ) Py-NAF20, ( ) Py-NAF8.3, and ( ) Py-Amylose [19].
) Py-Amylose [19].
) Py-Amylopectin [15], ( ) Py-NAF57, ( ) Py-NAF20, ( ) Py-NAF8.3, and ( ) Py-Amylose [19].
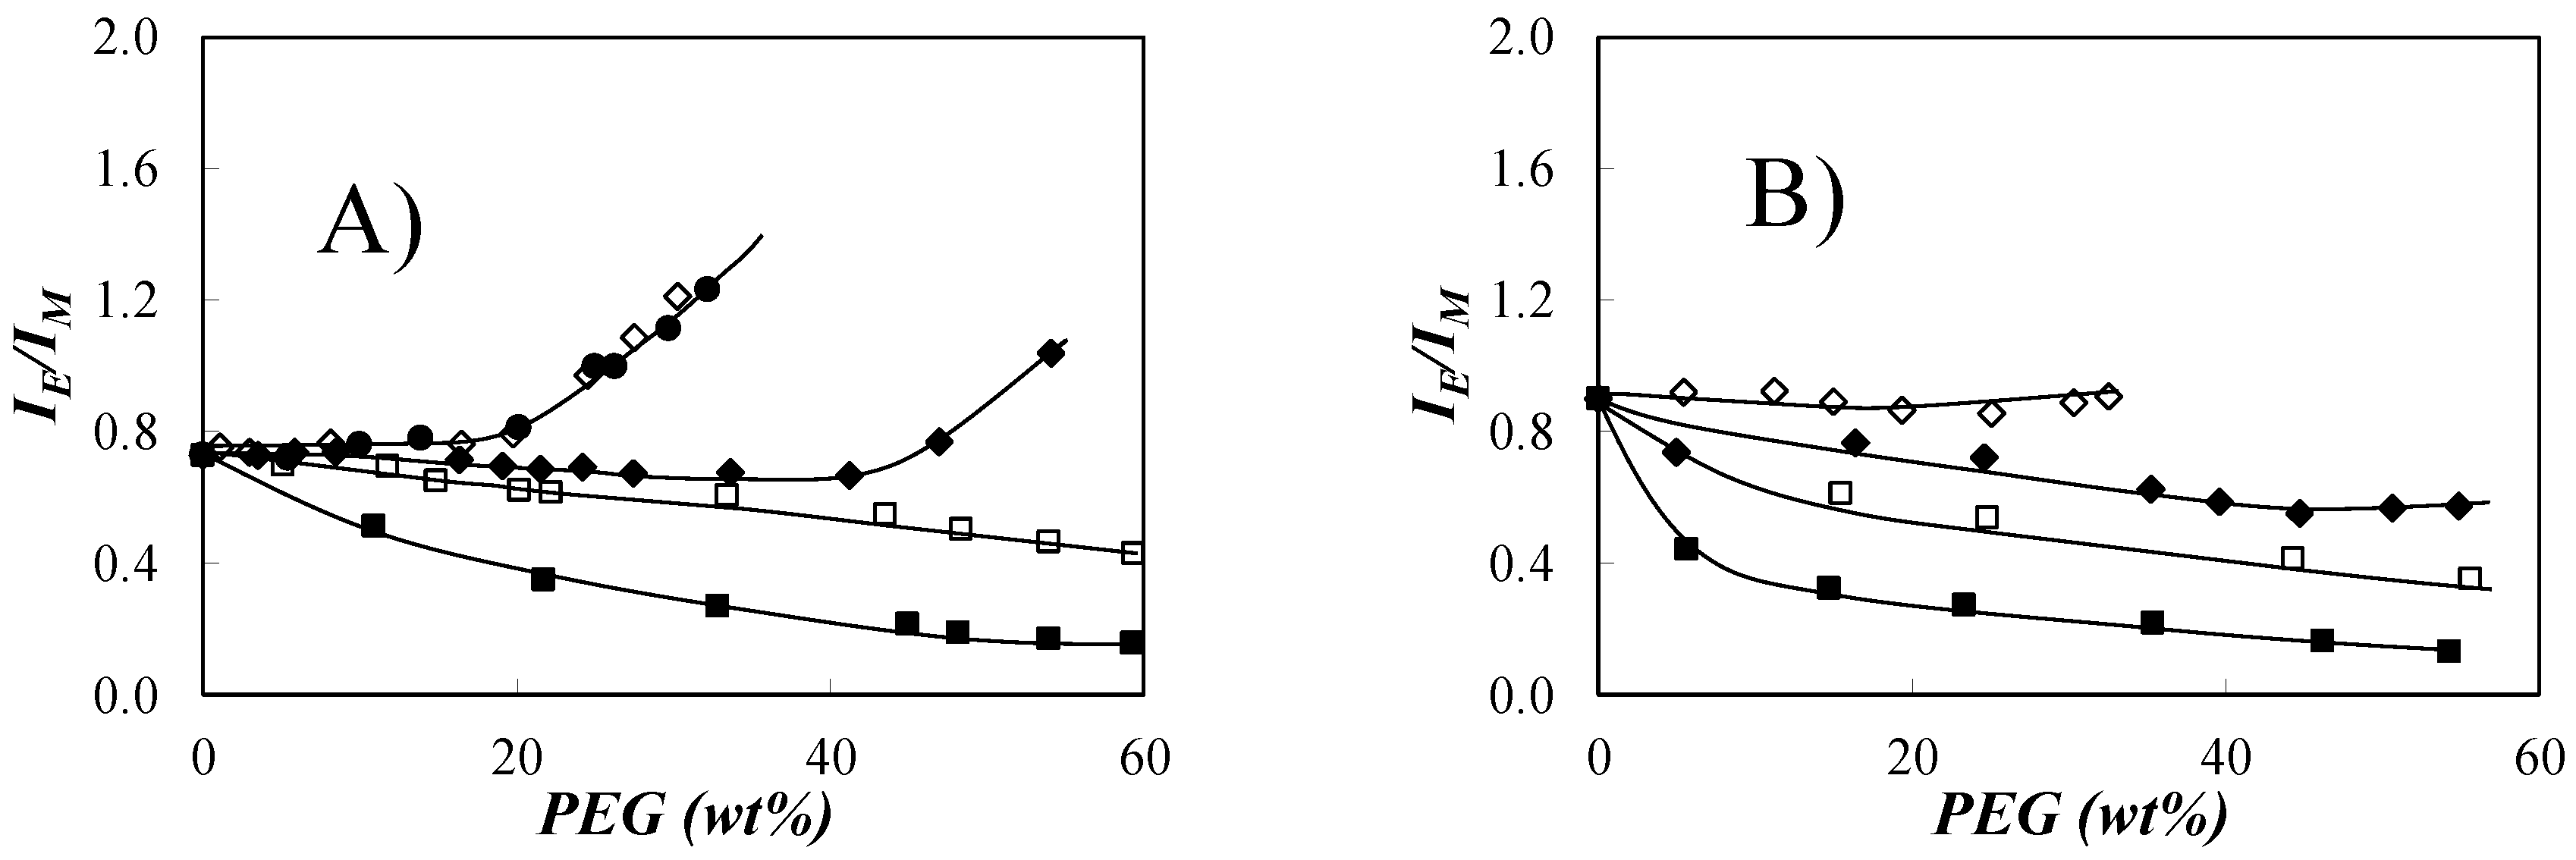
 ) 0.2, (
  ) 0.4, (
  ) 2.0, (
  ) 5.0, and (
  ) 10 K. [Py(4.8)-NAF57] = 9.1 mg/L, [Py(5.8)-NAF8.3] = 7.7 mg/L.
) 0.2, ( ) 0.4, ( ) 2.0, ( ) 5.0, and ( ) 10 K. [Py(4.8)-NAF57] = 9.1 mg/L, [Py(5.8)-NAF8.3] = 7.7 mg/L.
) 10 K. [Py(4.8)-NAF57] = 9.1 mg/L, [Py(5.8)-NAF8.3] = 7.7 mg/L.
) 0.2, ( ) 0.4, ( ) 2.0, ( ) 5.0, and ( ) 10 K. [Py(4.8)-NAF57] = 9.1 mg/L, [Py(5.8)-NAF8.3] = 7.7 mg/L.
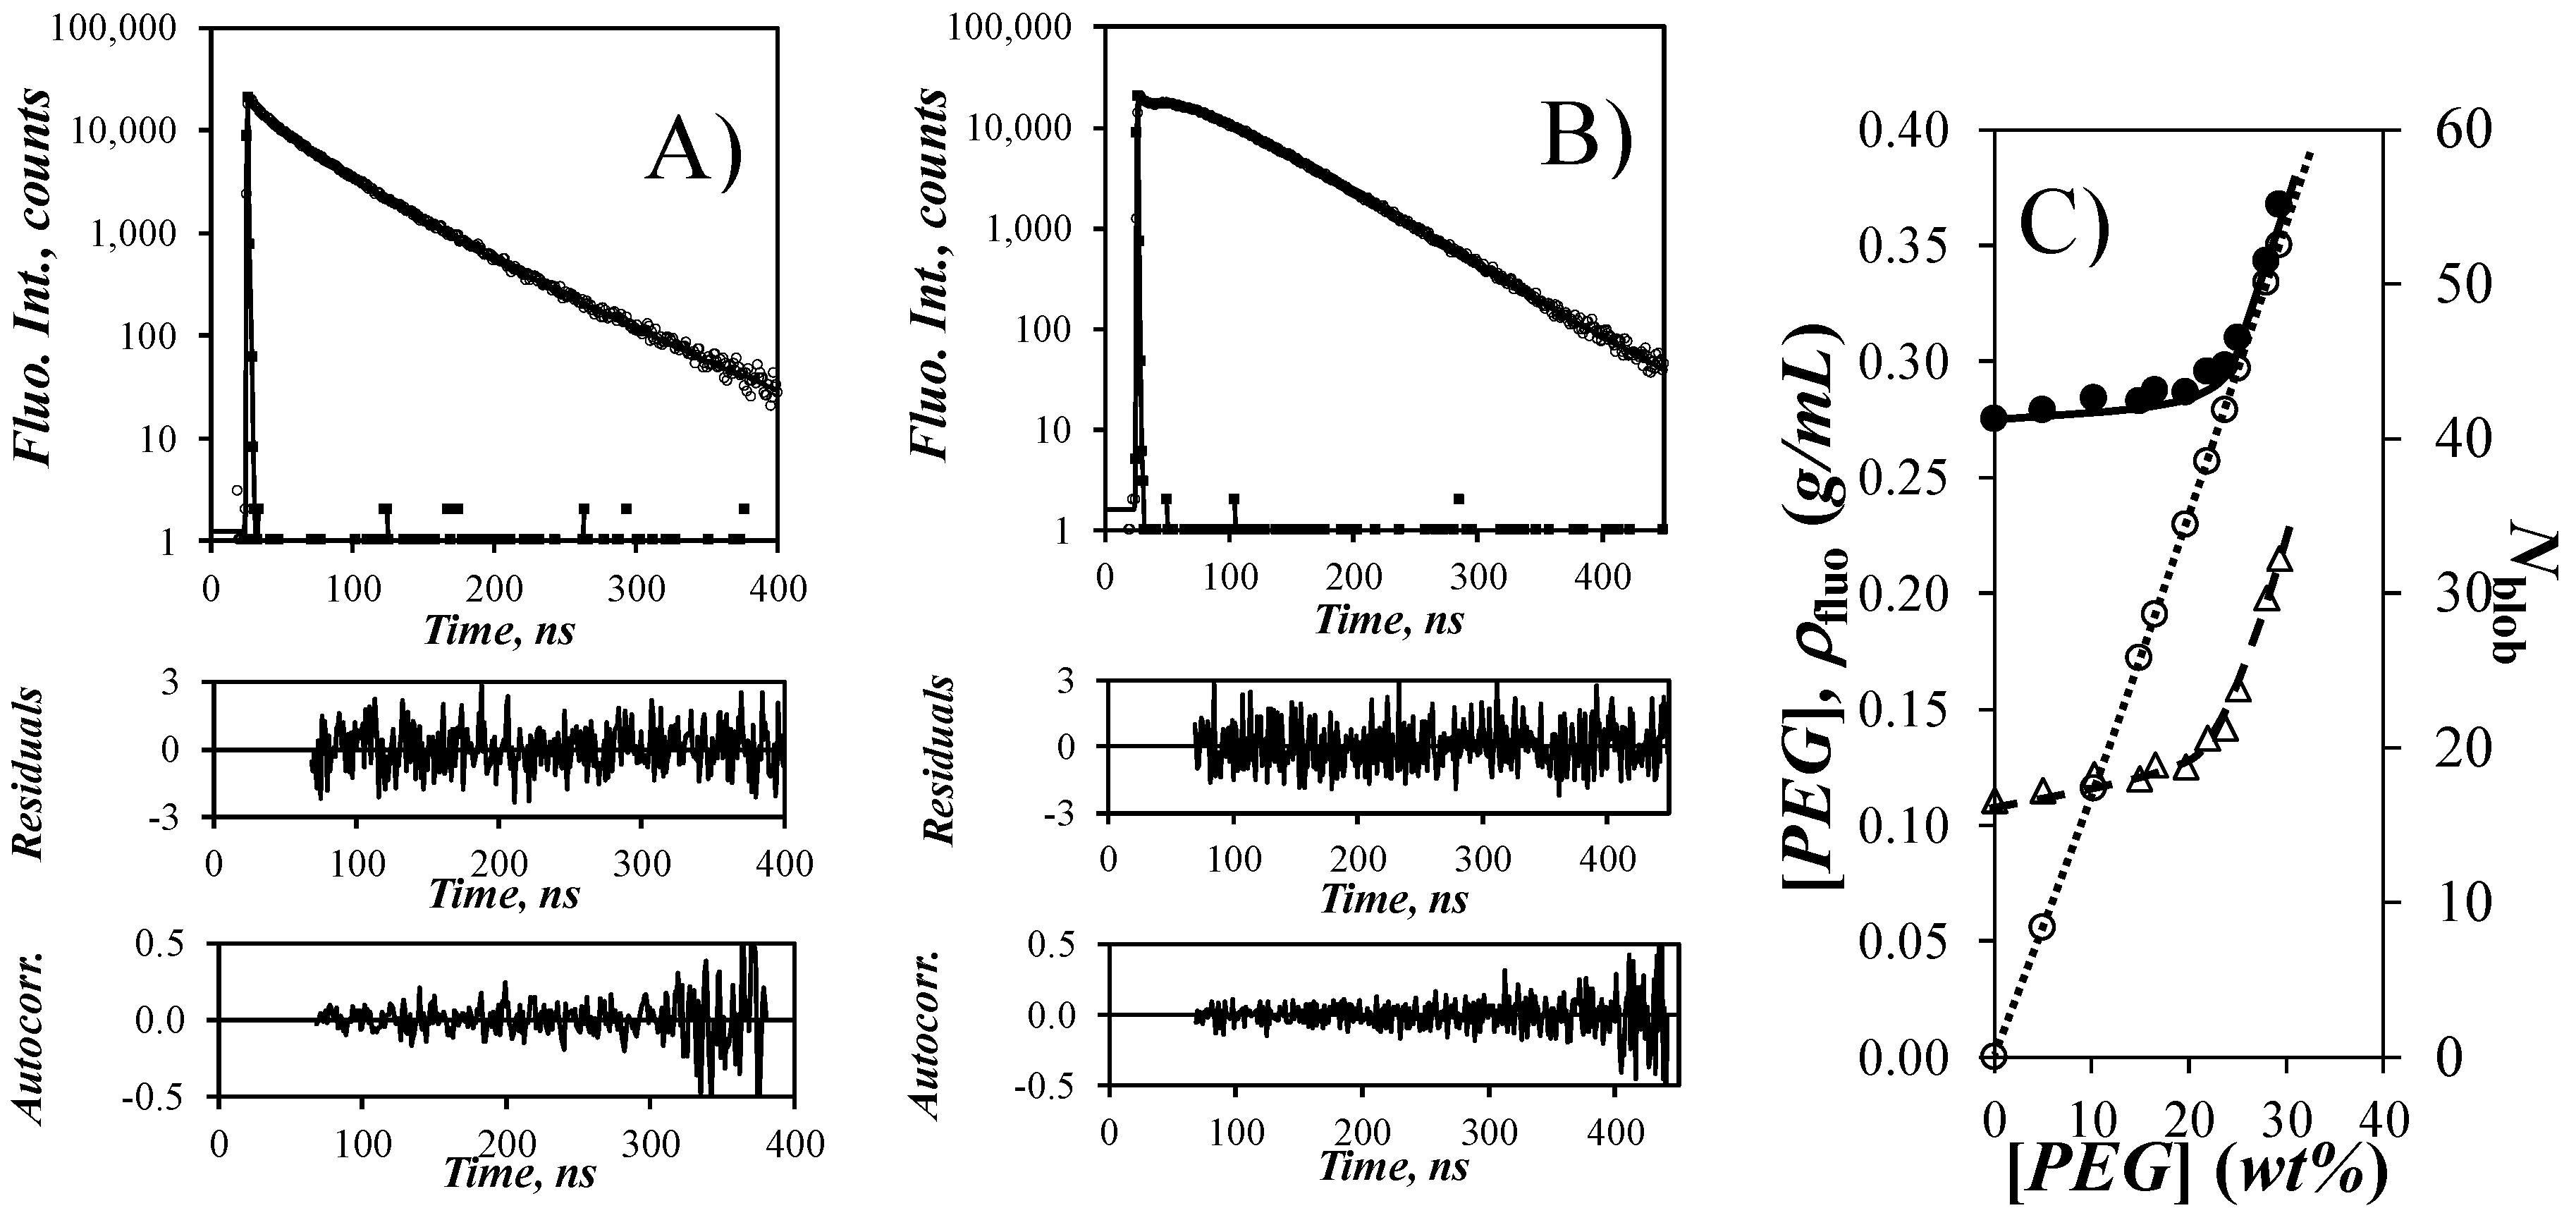
 , right axis) Nblob, (
  ) PEG(5.0K) concentration, and (
  ) ρfluo as a function of PEG(5.0K) wt%. [Py(4.8)-NAF57] = 9.1 mg/L.
, right axis) Nblob, ( ) PEG(5.0K) concentration, and ( ) ρfluo as a function of PEG(5.0K) wt%. [Py(4.8)-NAF57] = 9.1 mg/L.
) ρfluo as a function of PEG(5.0K) wt%. [Py(4.8)-NAF57] = 9.1 mg/L.
, right axis) Nblob, ( ) PEG(5.0K) concentration, and ( ) ρfluo as a function of PEG(5.0K) wt%. [Py(4.8)-NAF57] = 9.1 mg/L.
Publisher’s Note: MDPI stays neutral with regard to jurisdictional claims in published maps and institutional affiliations. |
© 2020 by the authors. Licensee MDPI, Basel, Switzerland. This article is an open access article distributed under the terms and conditions of the Creative Commons Attribution (CC BY) license (http://creativecommons.org/licenses/by/4.0/).
Share and Cite
Li, L.; Duhamel, J. Interior of Amylopectin and Nano-Sized Amylopectin Fragments Probed by Viscometry, Dynamic Light Scattering, and Pyrene Excimer Fluorescence. Polymers 2020, 12, 2649. https://doi.org/10.3390/polym12112649
Li L, Duhamel J. Interior of Amylopectin and Nano-Sized Amylopectin Fragments Probed by Viscometry, Dynamic Light Scattering, and Pyrene Excimer Fluorescence. Polymers. 2020; 12(11):2649. https://doi.org/10.3390/polym12112649
Chicago/Turabian StyleLi, Lu, and Jean Duhamel. 2020. "Interior of Amylopectin and Nano-Sized Amylopectin Fragments Probed by Viscometry, Dynamic Light Scattering, and Pyrene Excimer Fluorescence" Polymers 12, no. 11: 2649. https://doi.org/10.3390/polym12112649