Self-Nitrogen-Doped Nanoporous Carbons Derived from Poly(1,5-diaminonaphthalene) for the Removal of Toxic Dye Pollutants from Wastewater: Non-Linear Isotherm and Kinetic Analysis


Abstract
:
1. Introduction
2. Materials and Methods
2.1. Materials
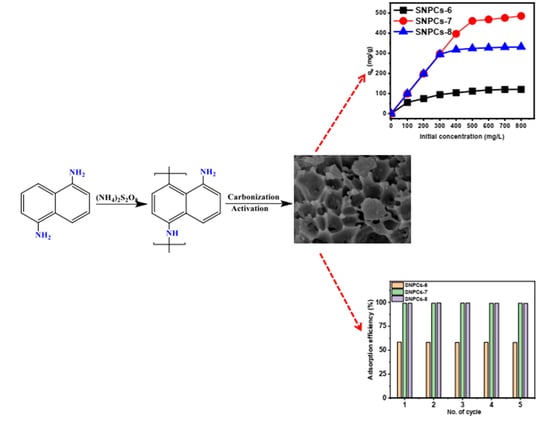
2.2. Preparation of Poly(1,5-diaminonaphthalene) (P(1,5-DANPh))
2.3. Preparation of Self-Nitrogen-Doped Porous Carbons (SNPCs)
2.4. Characterization Self-Nitrogen-Doped Porous Carbons (SNPCs)
2.5. Adsorption Study
2.6. Desorption Study
2.7. Error Analysis
3. Results & Discussion
3.1. Characterization of Self-Nitrogen-Doped Porous Carbons (SNPCs)
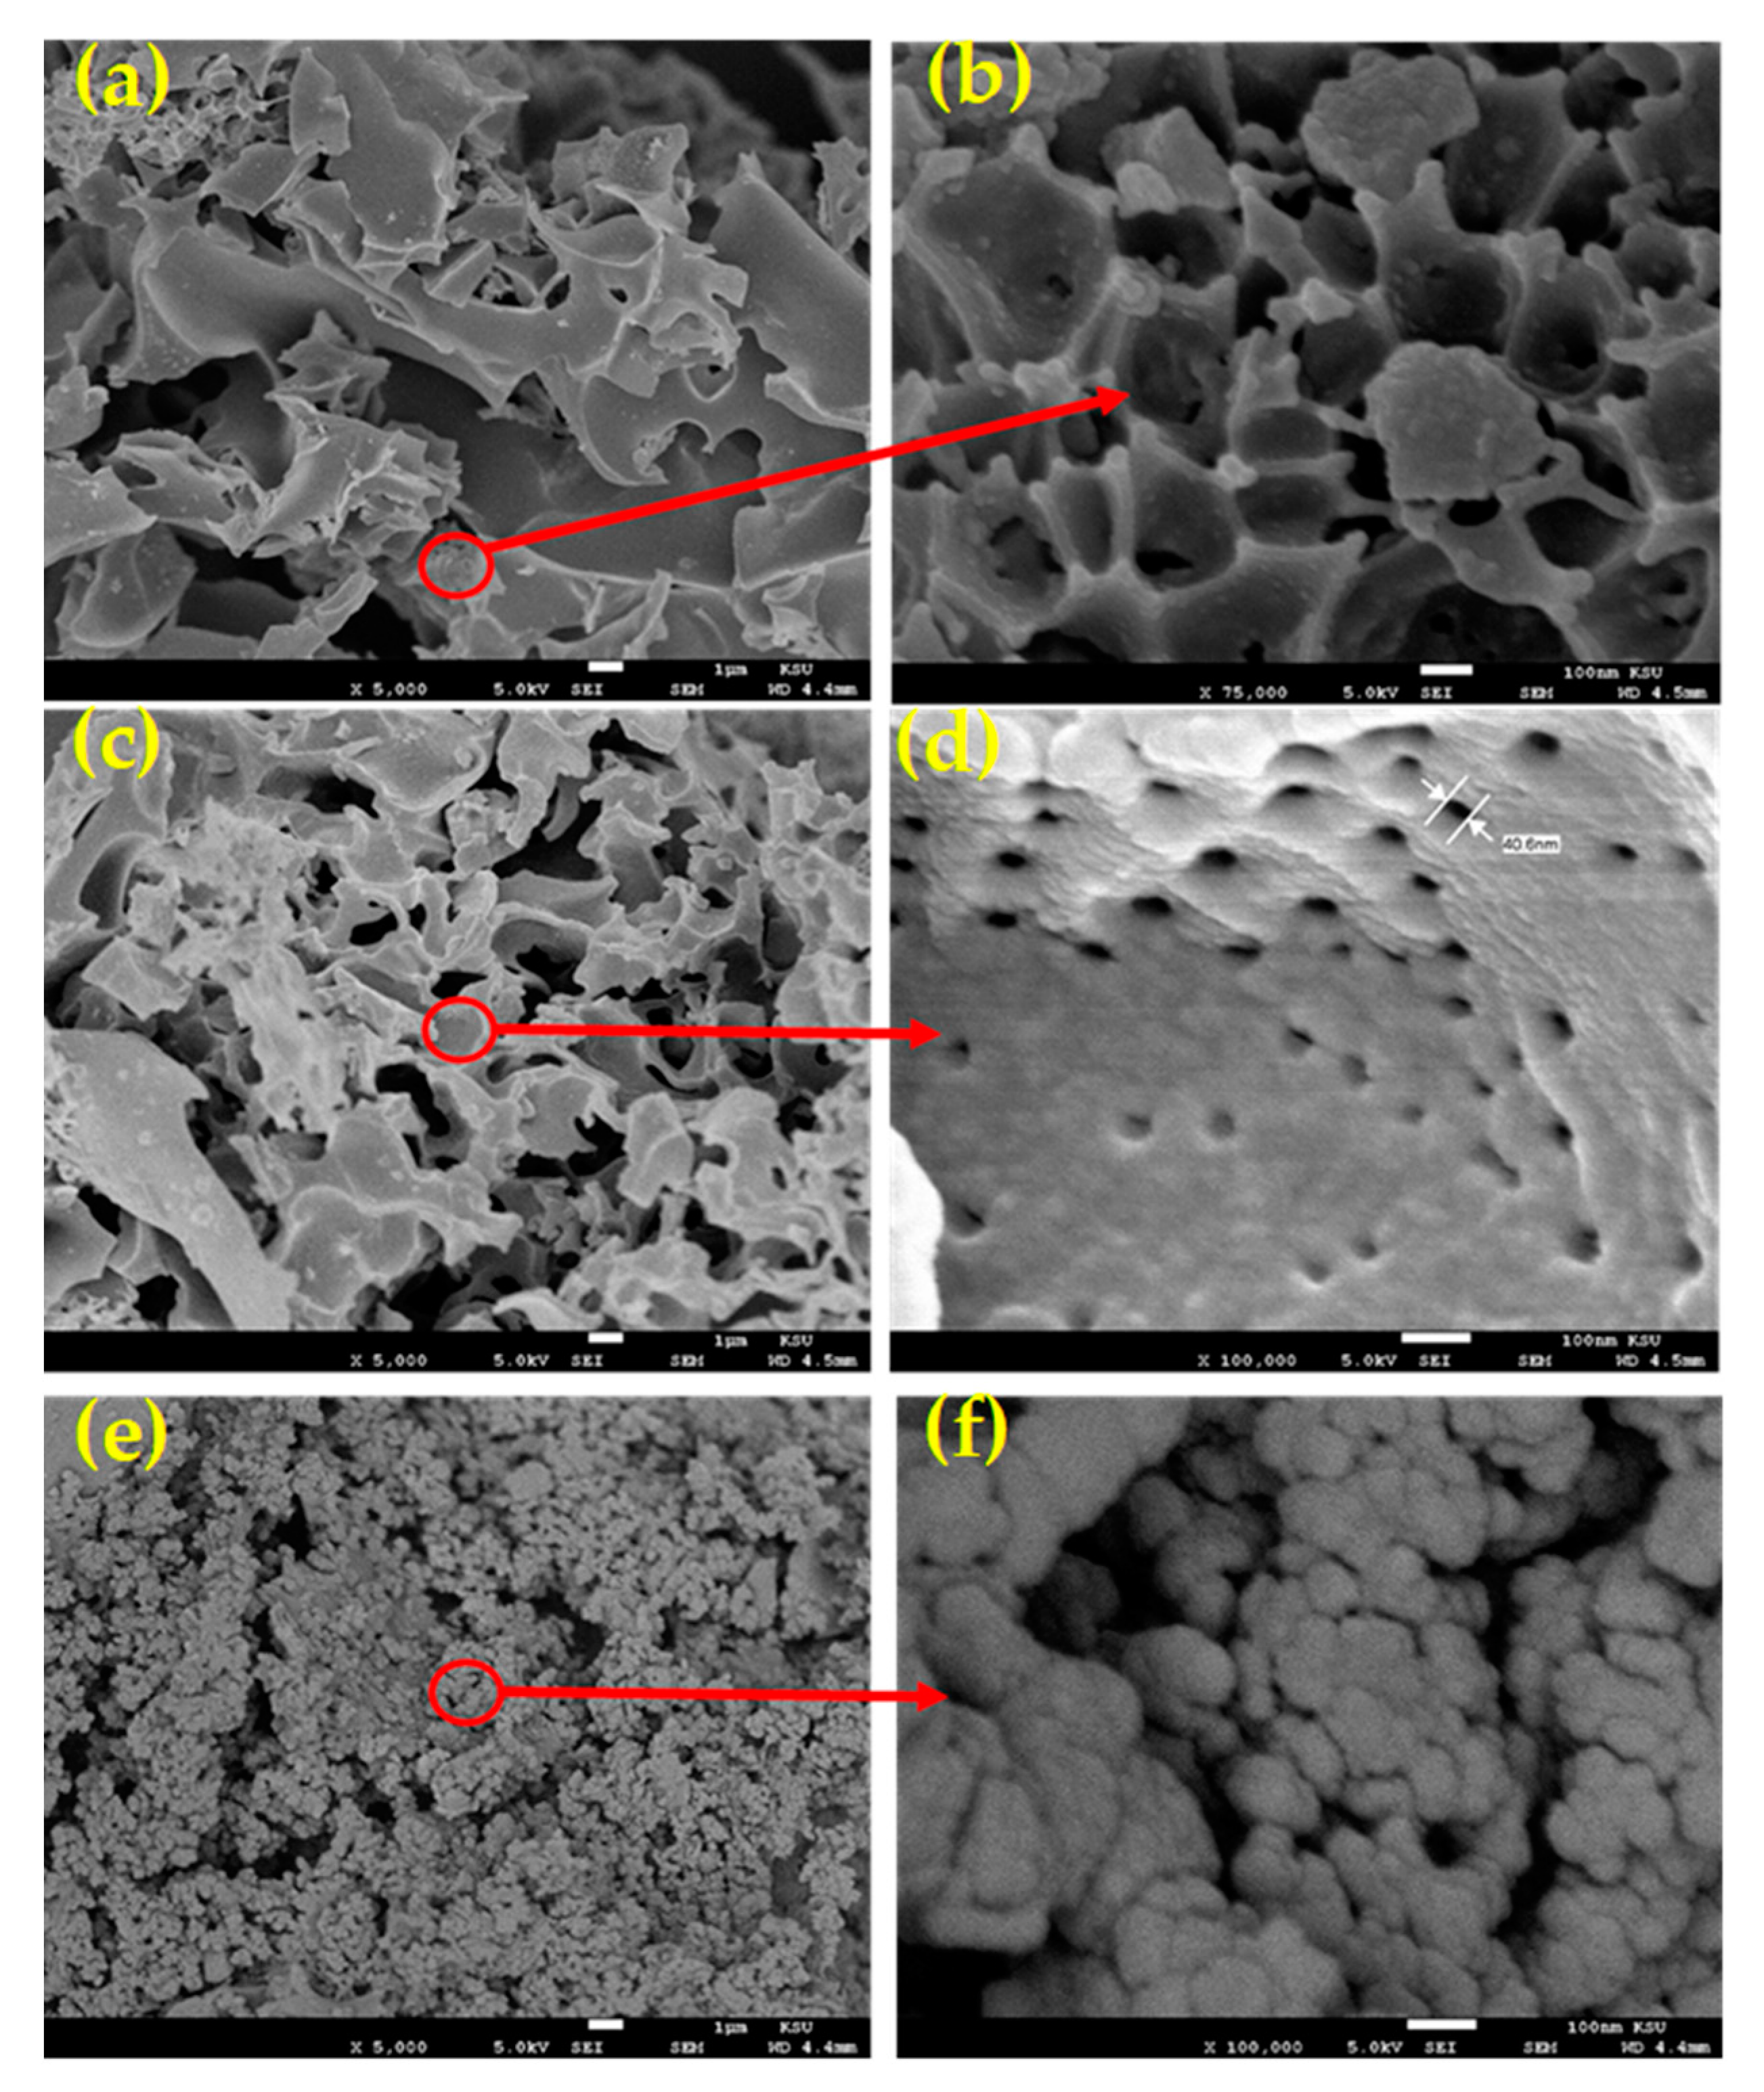
3.1.1. Morphology of (SNPCs)
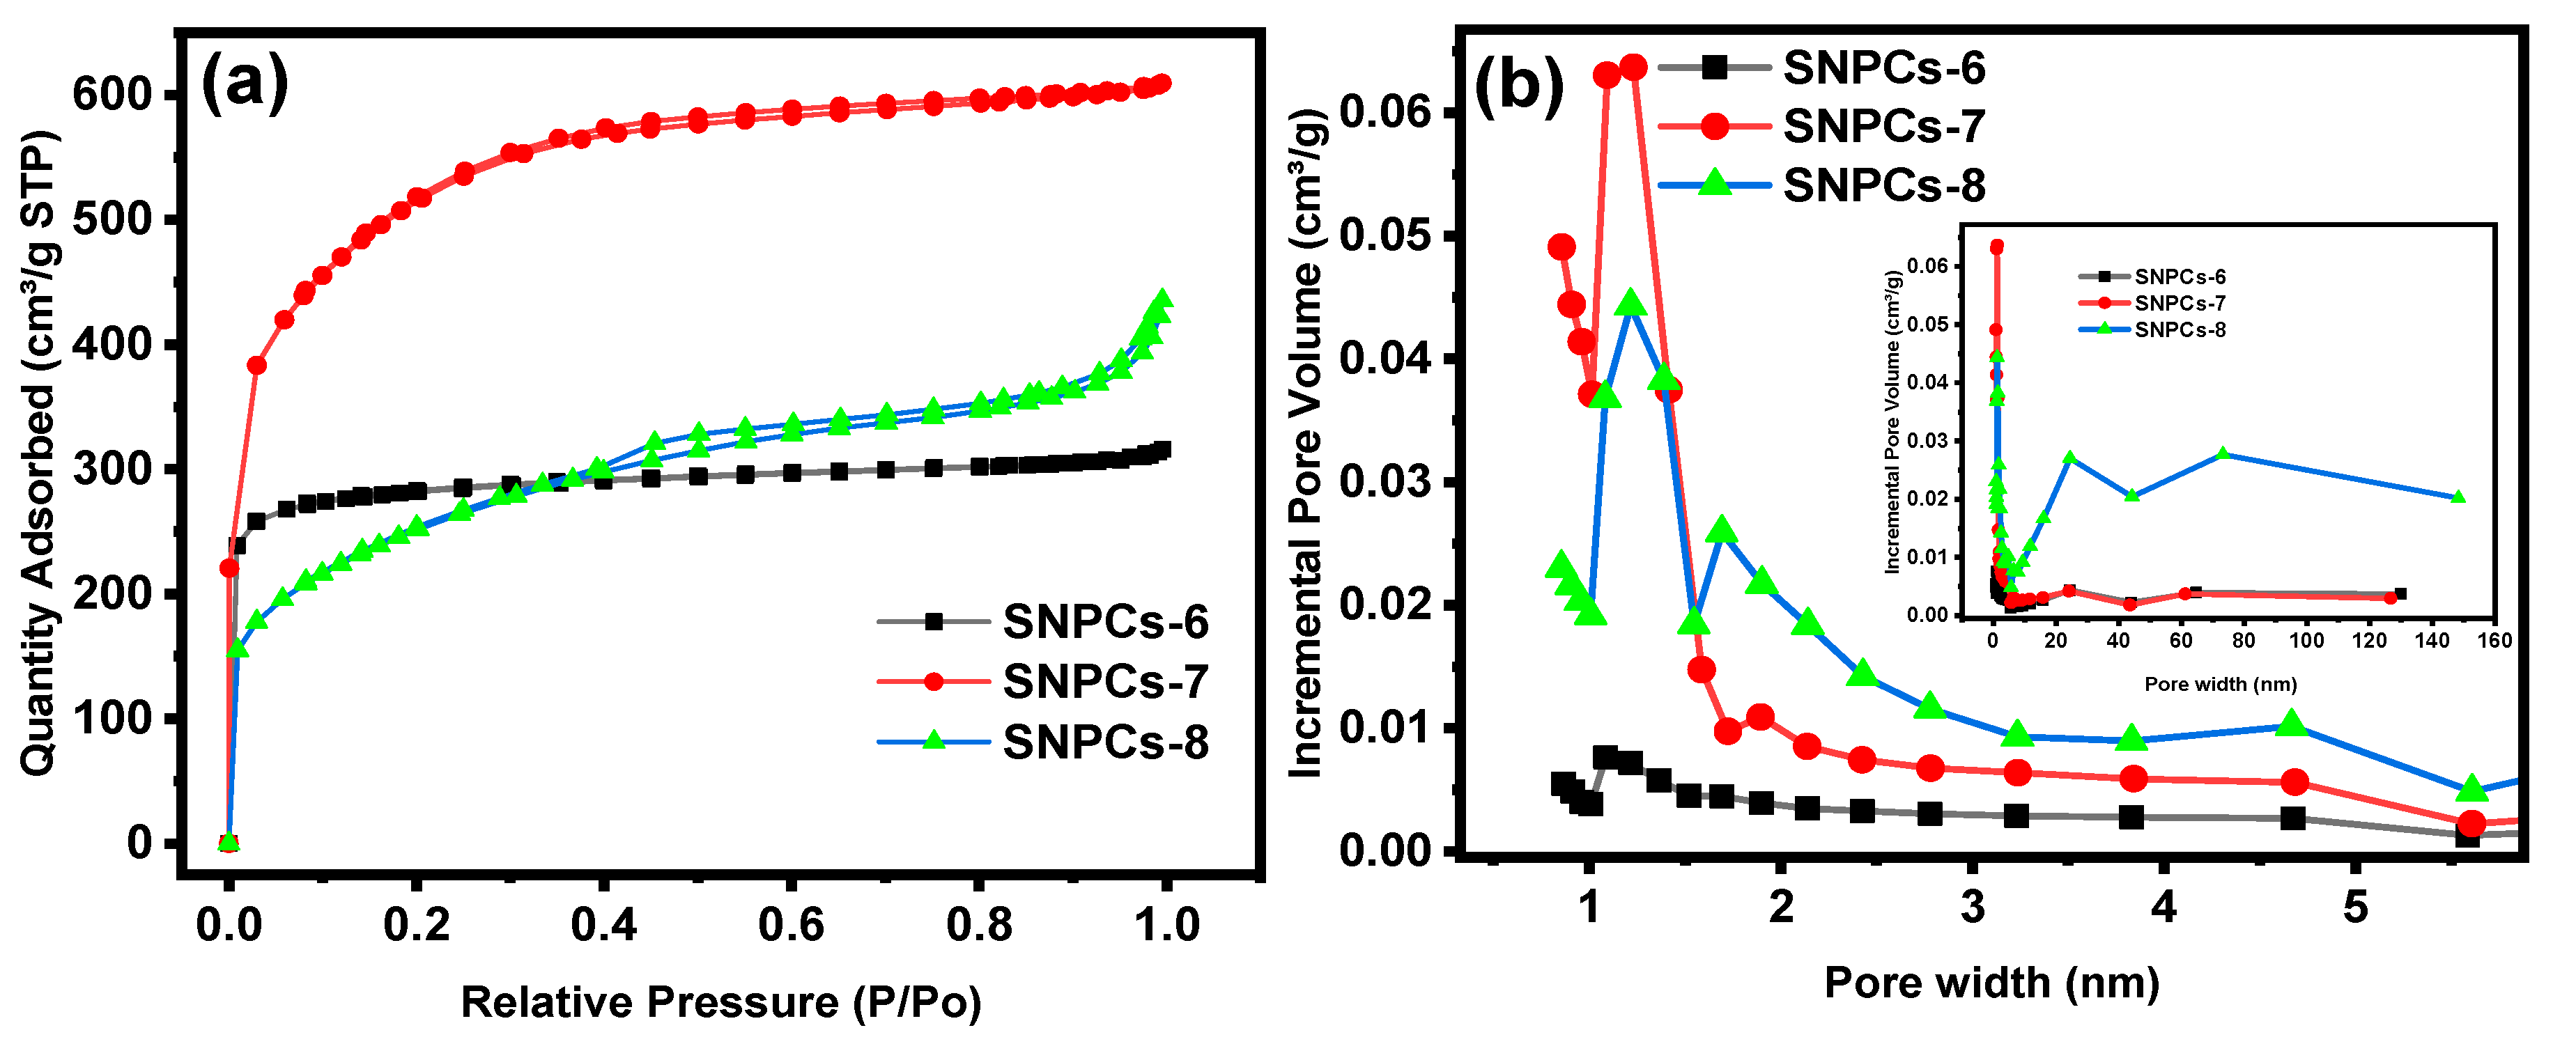
3.1.2. BET Analysis
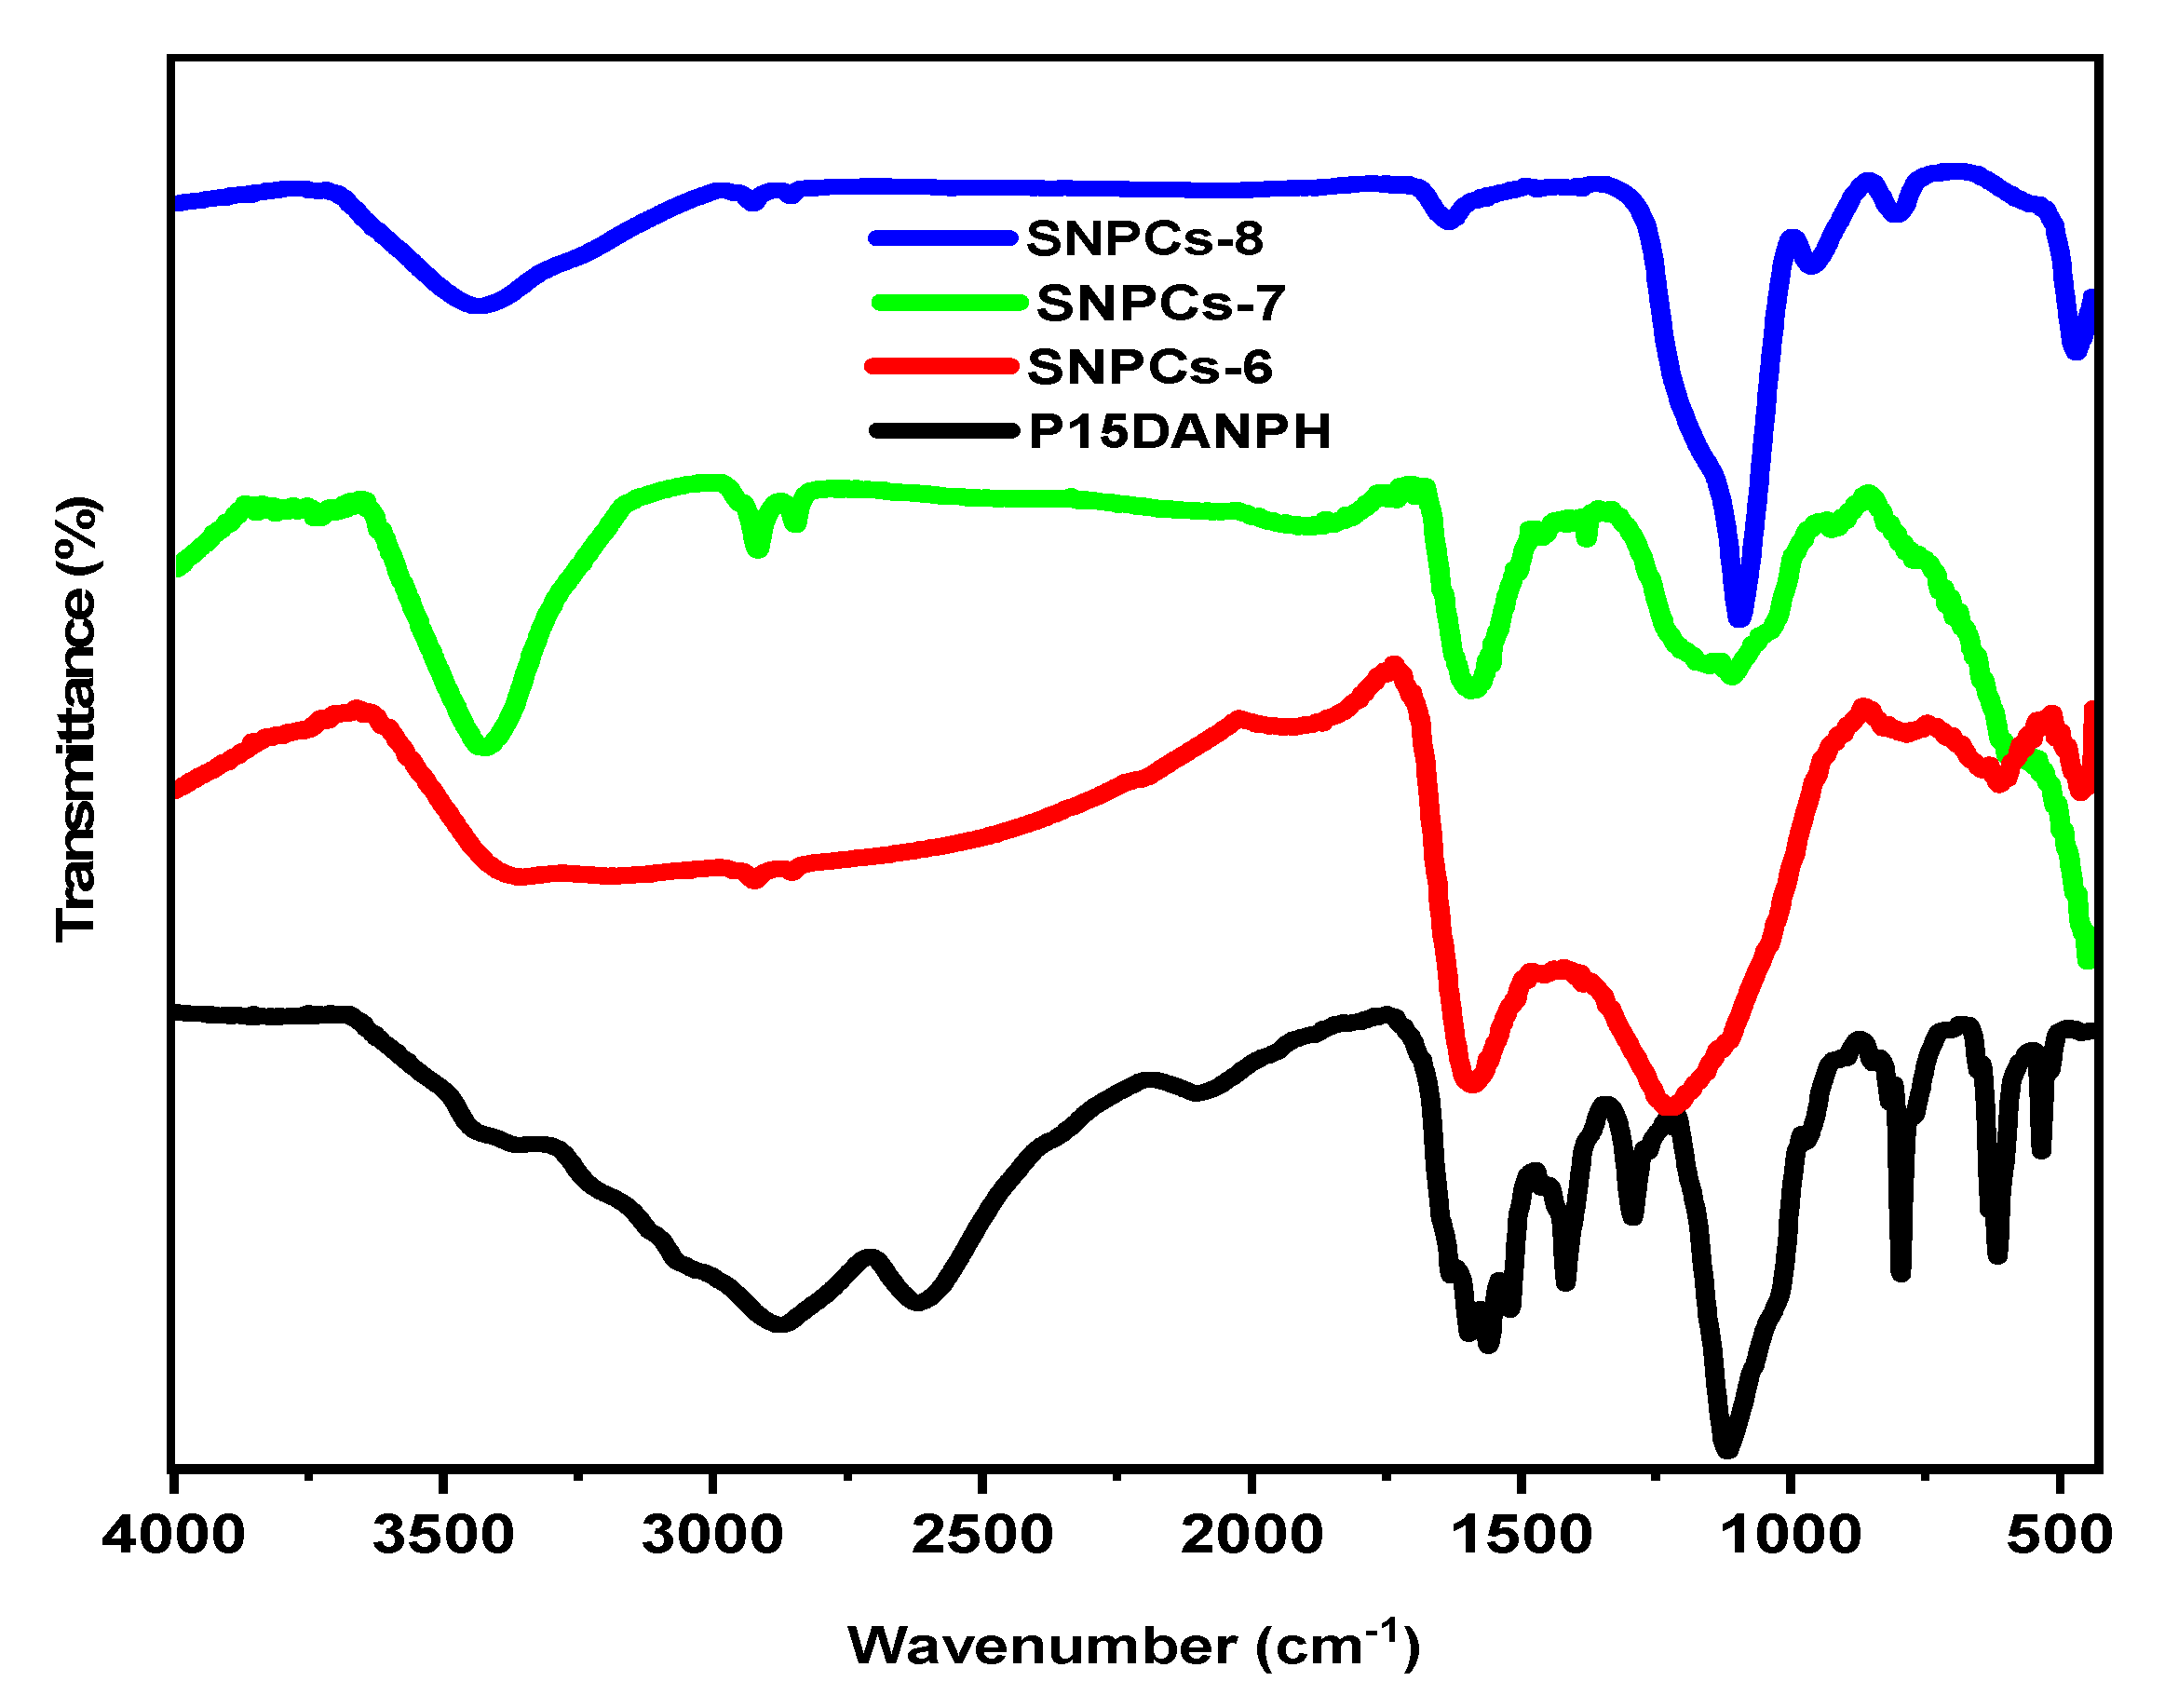
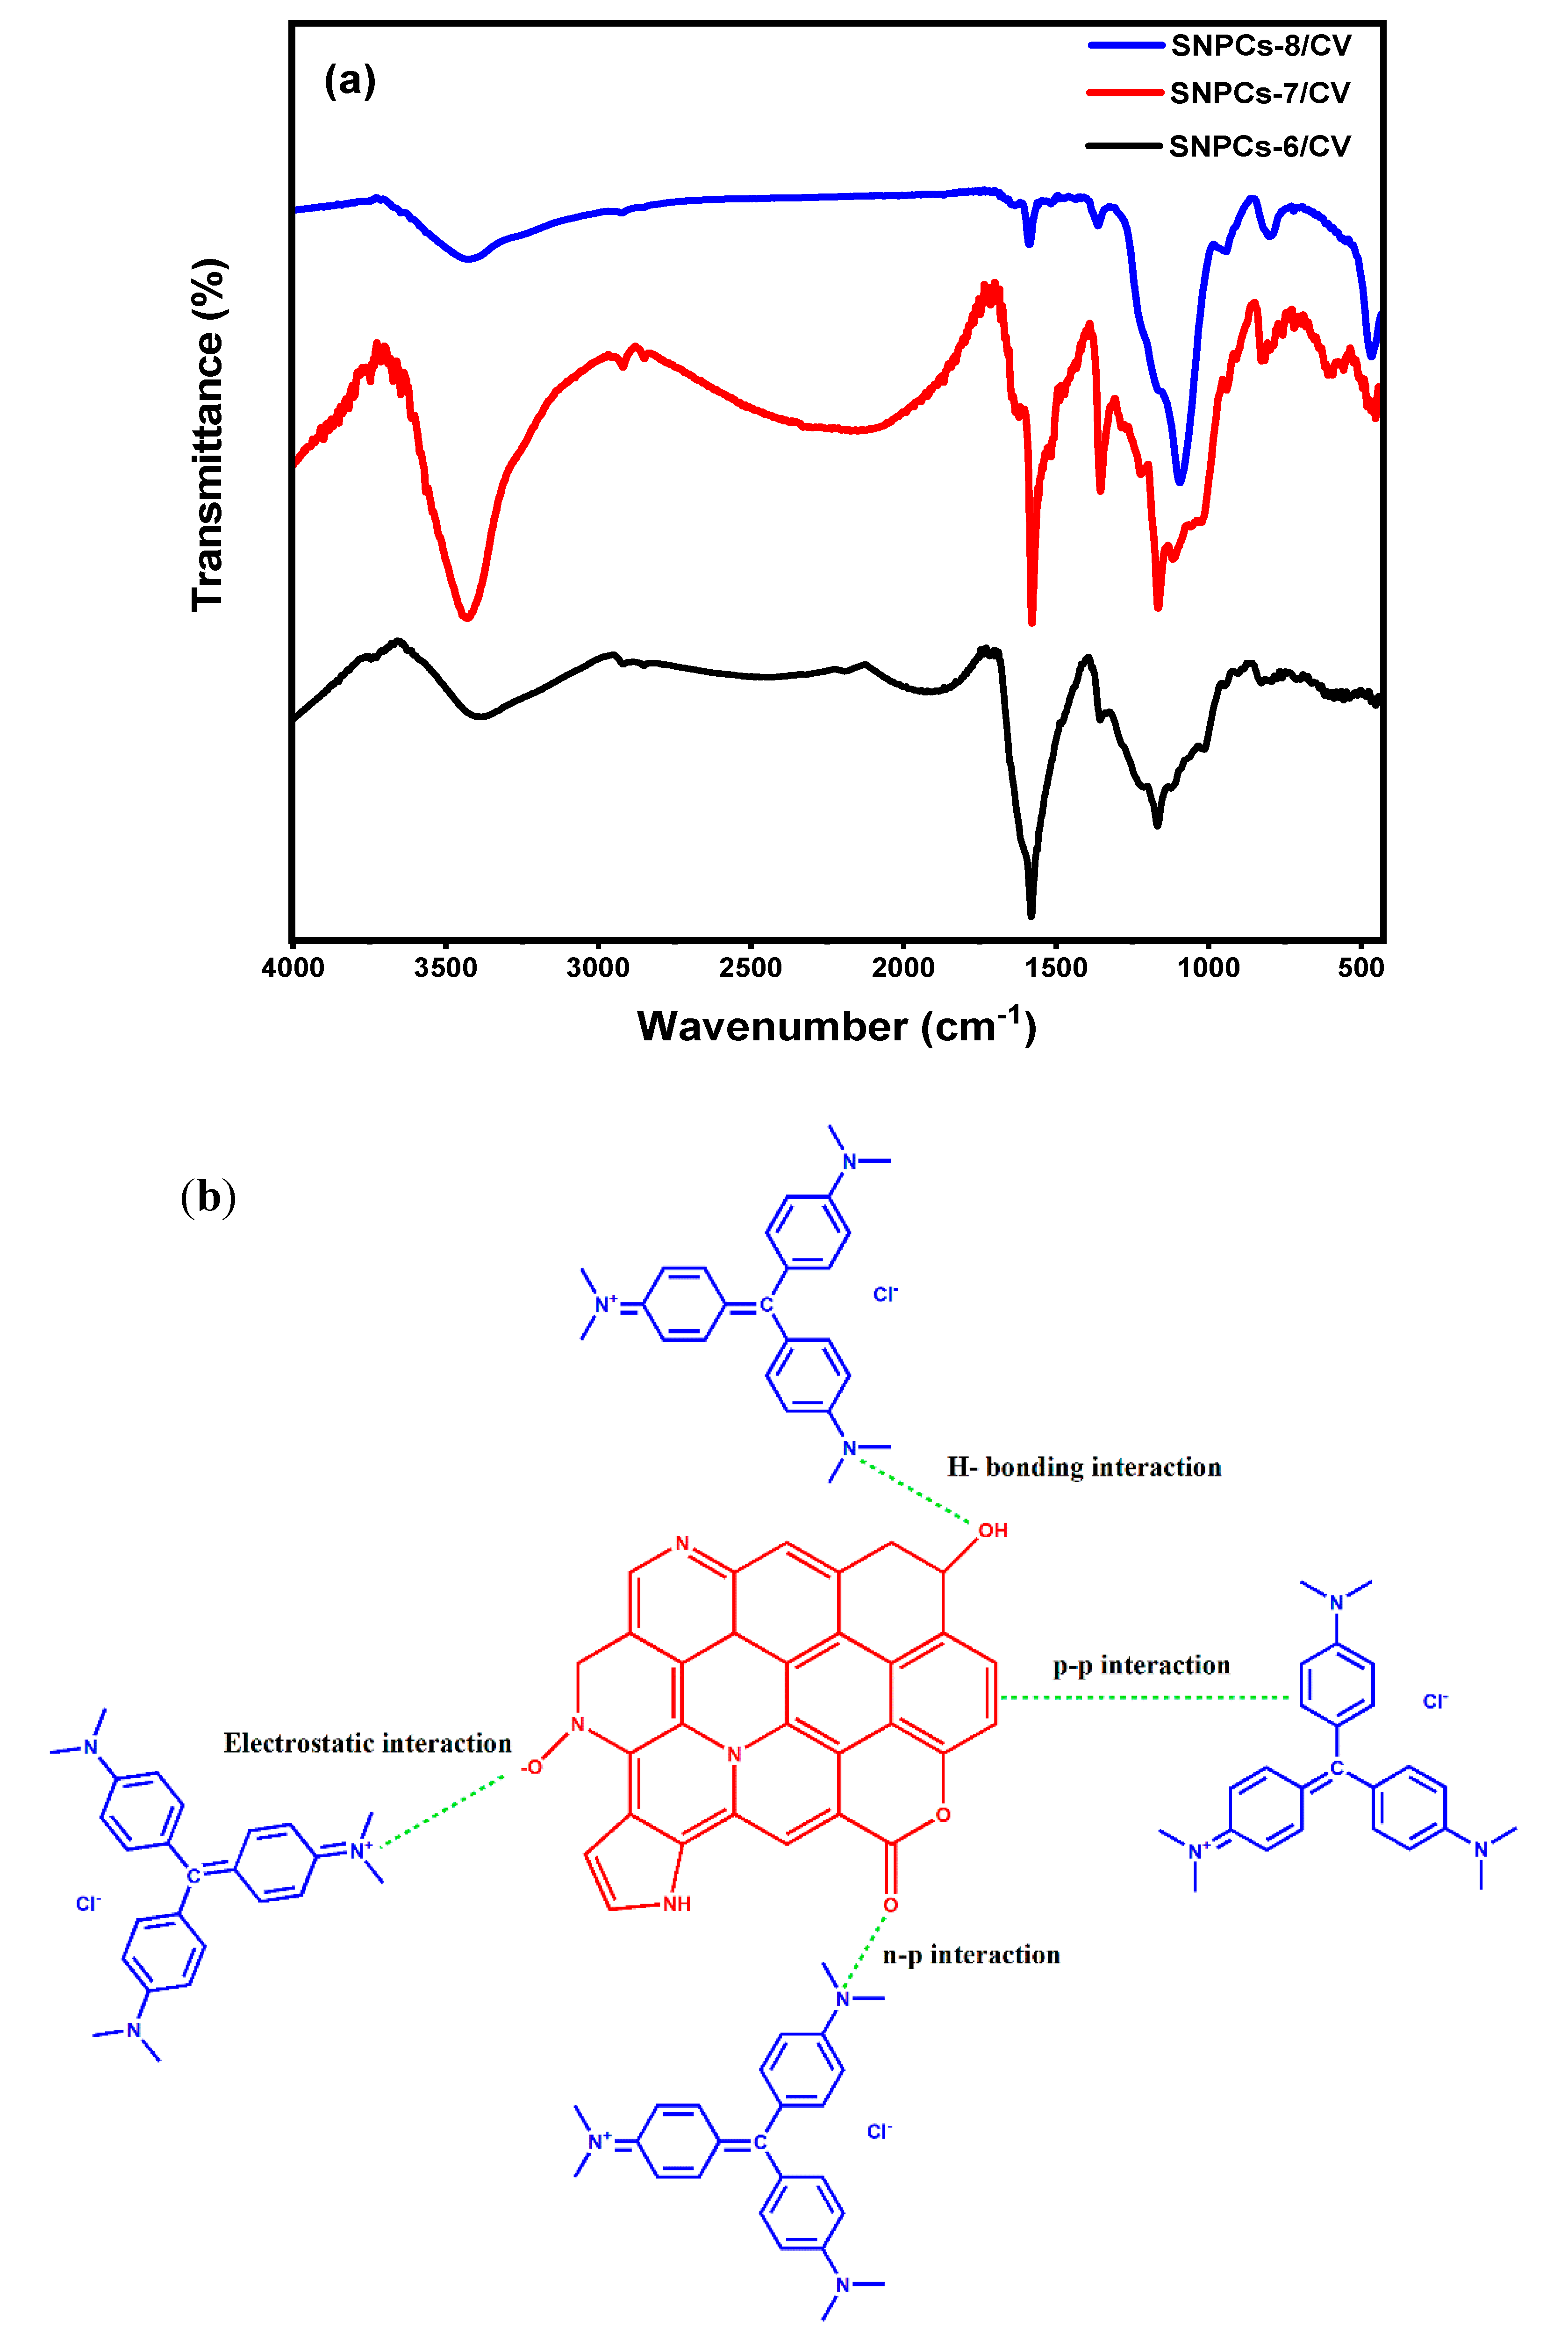
3.1.3. FTIR Spectra
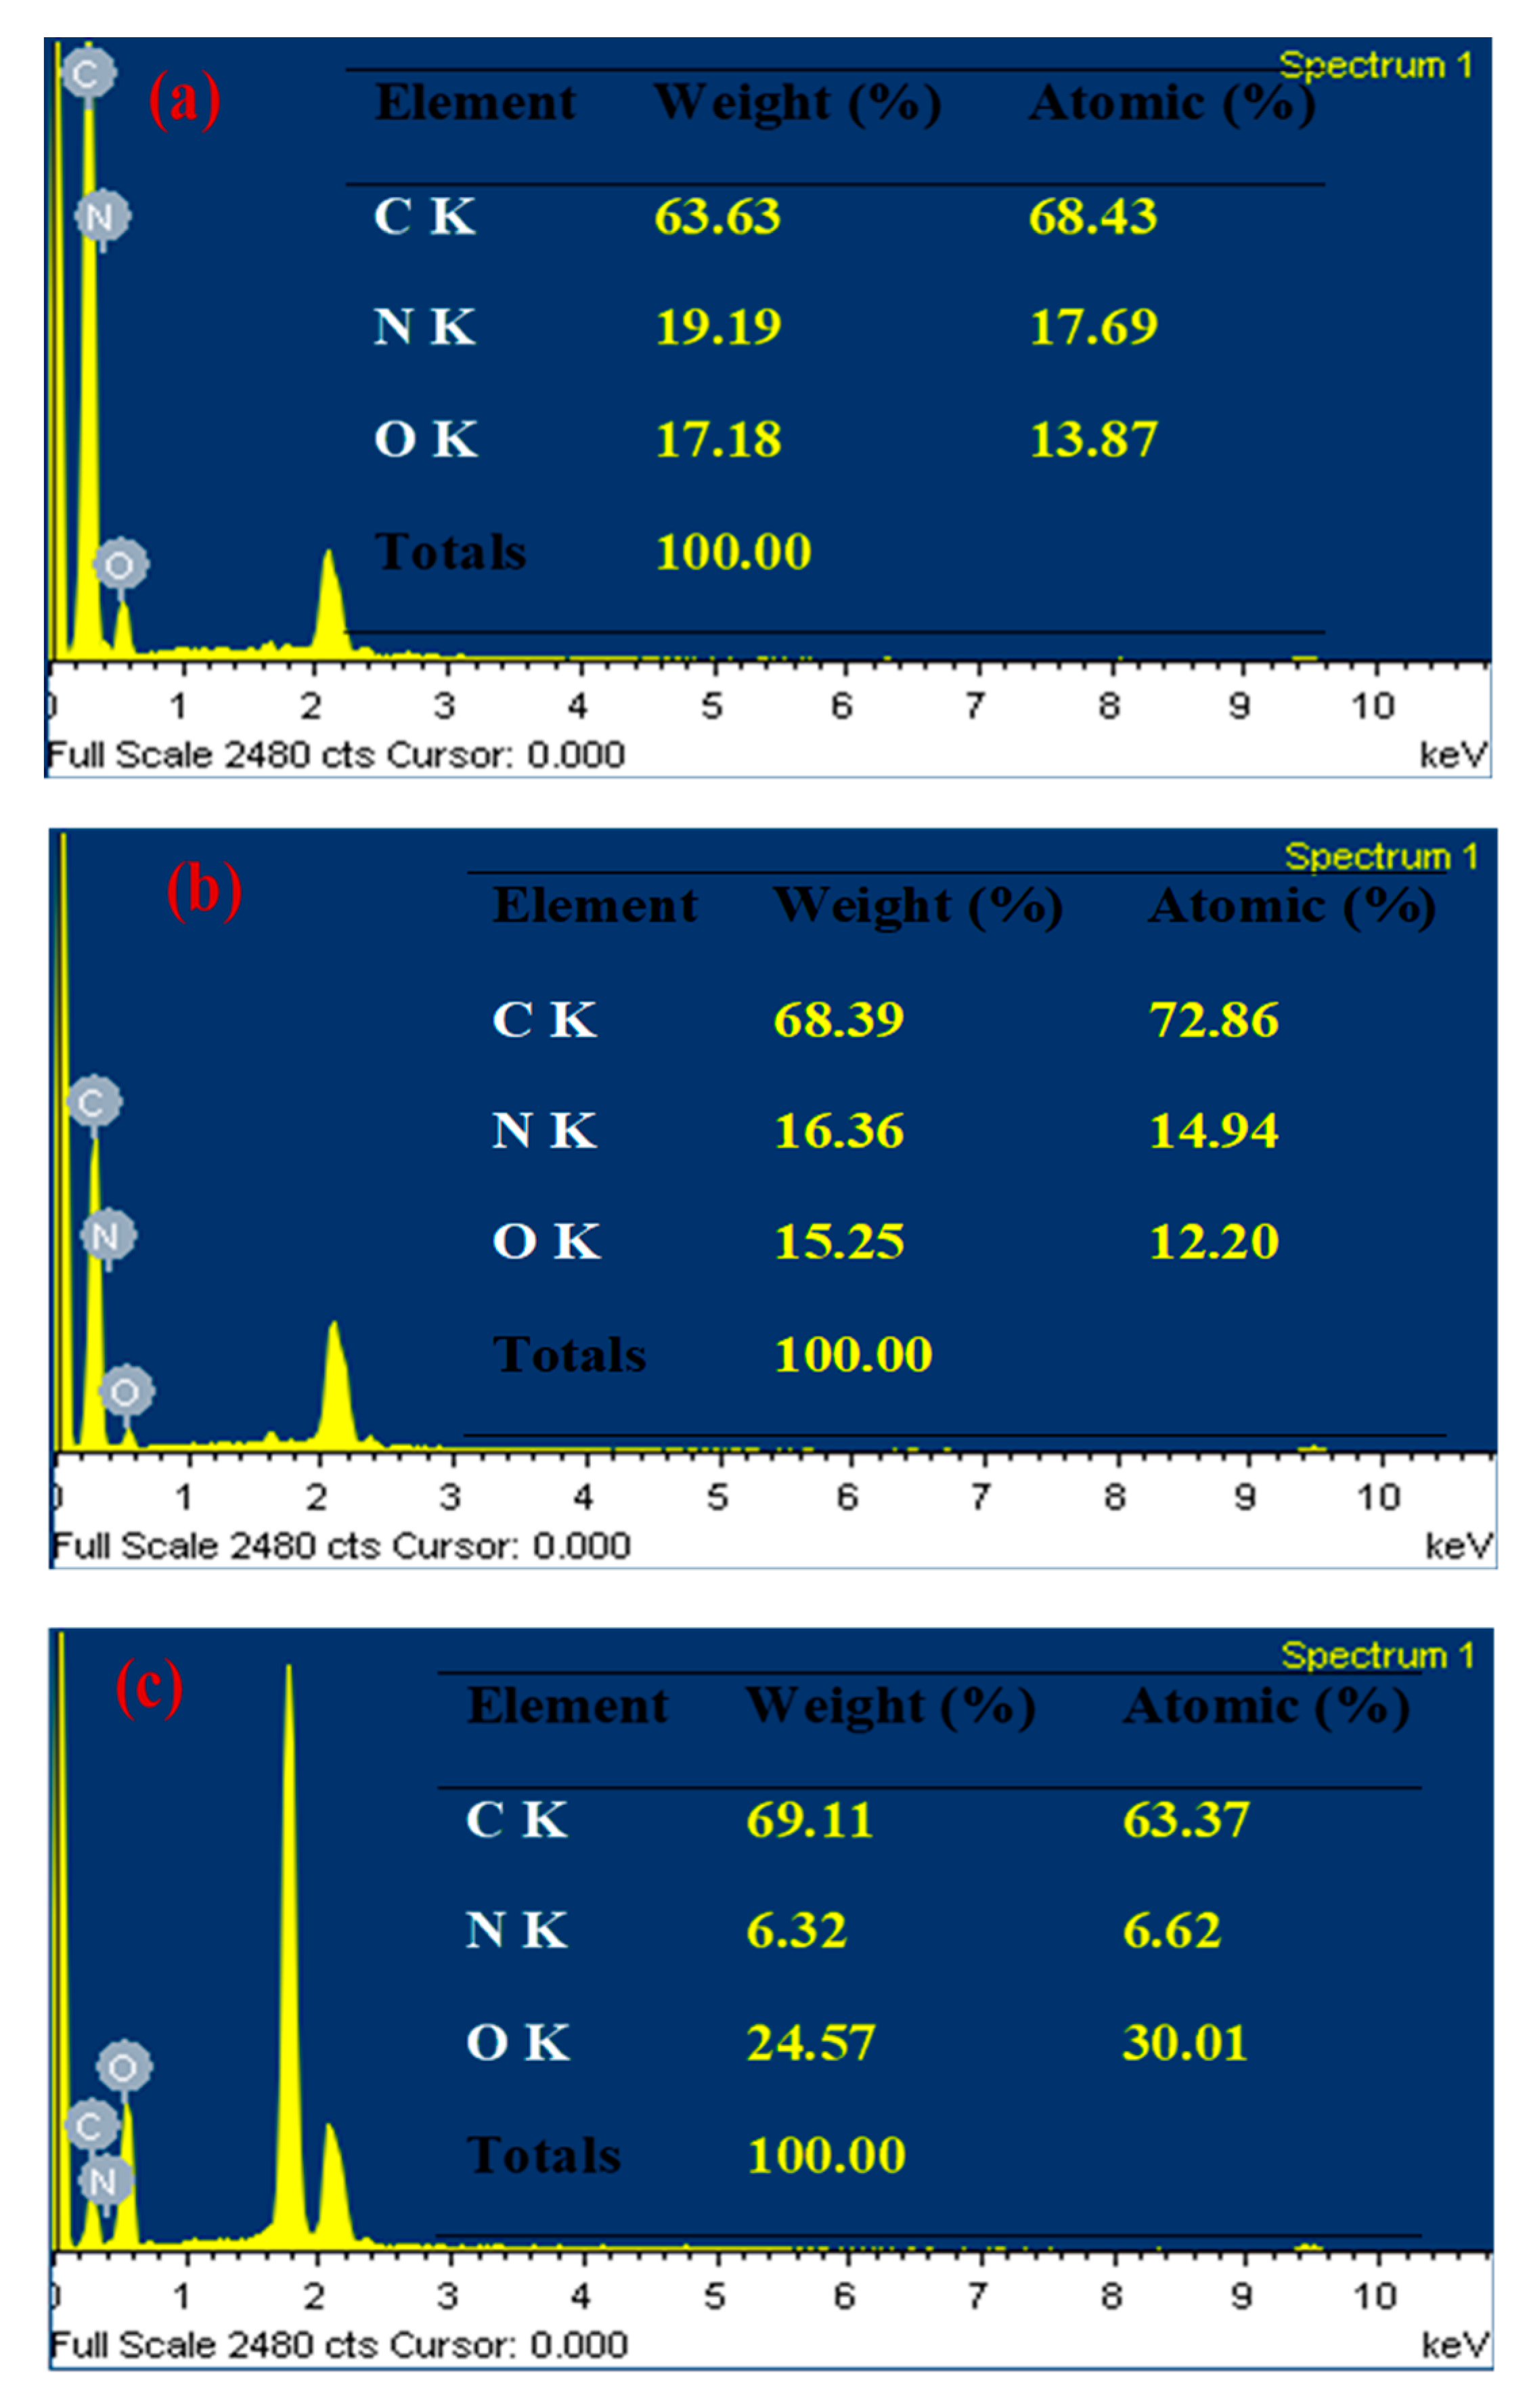
3.1.4. EDX Analysis
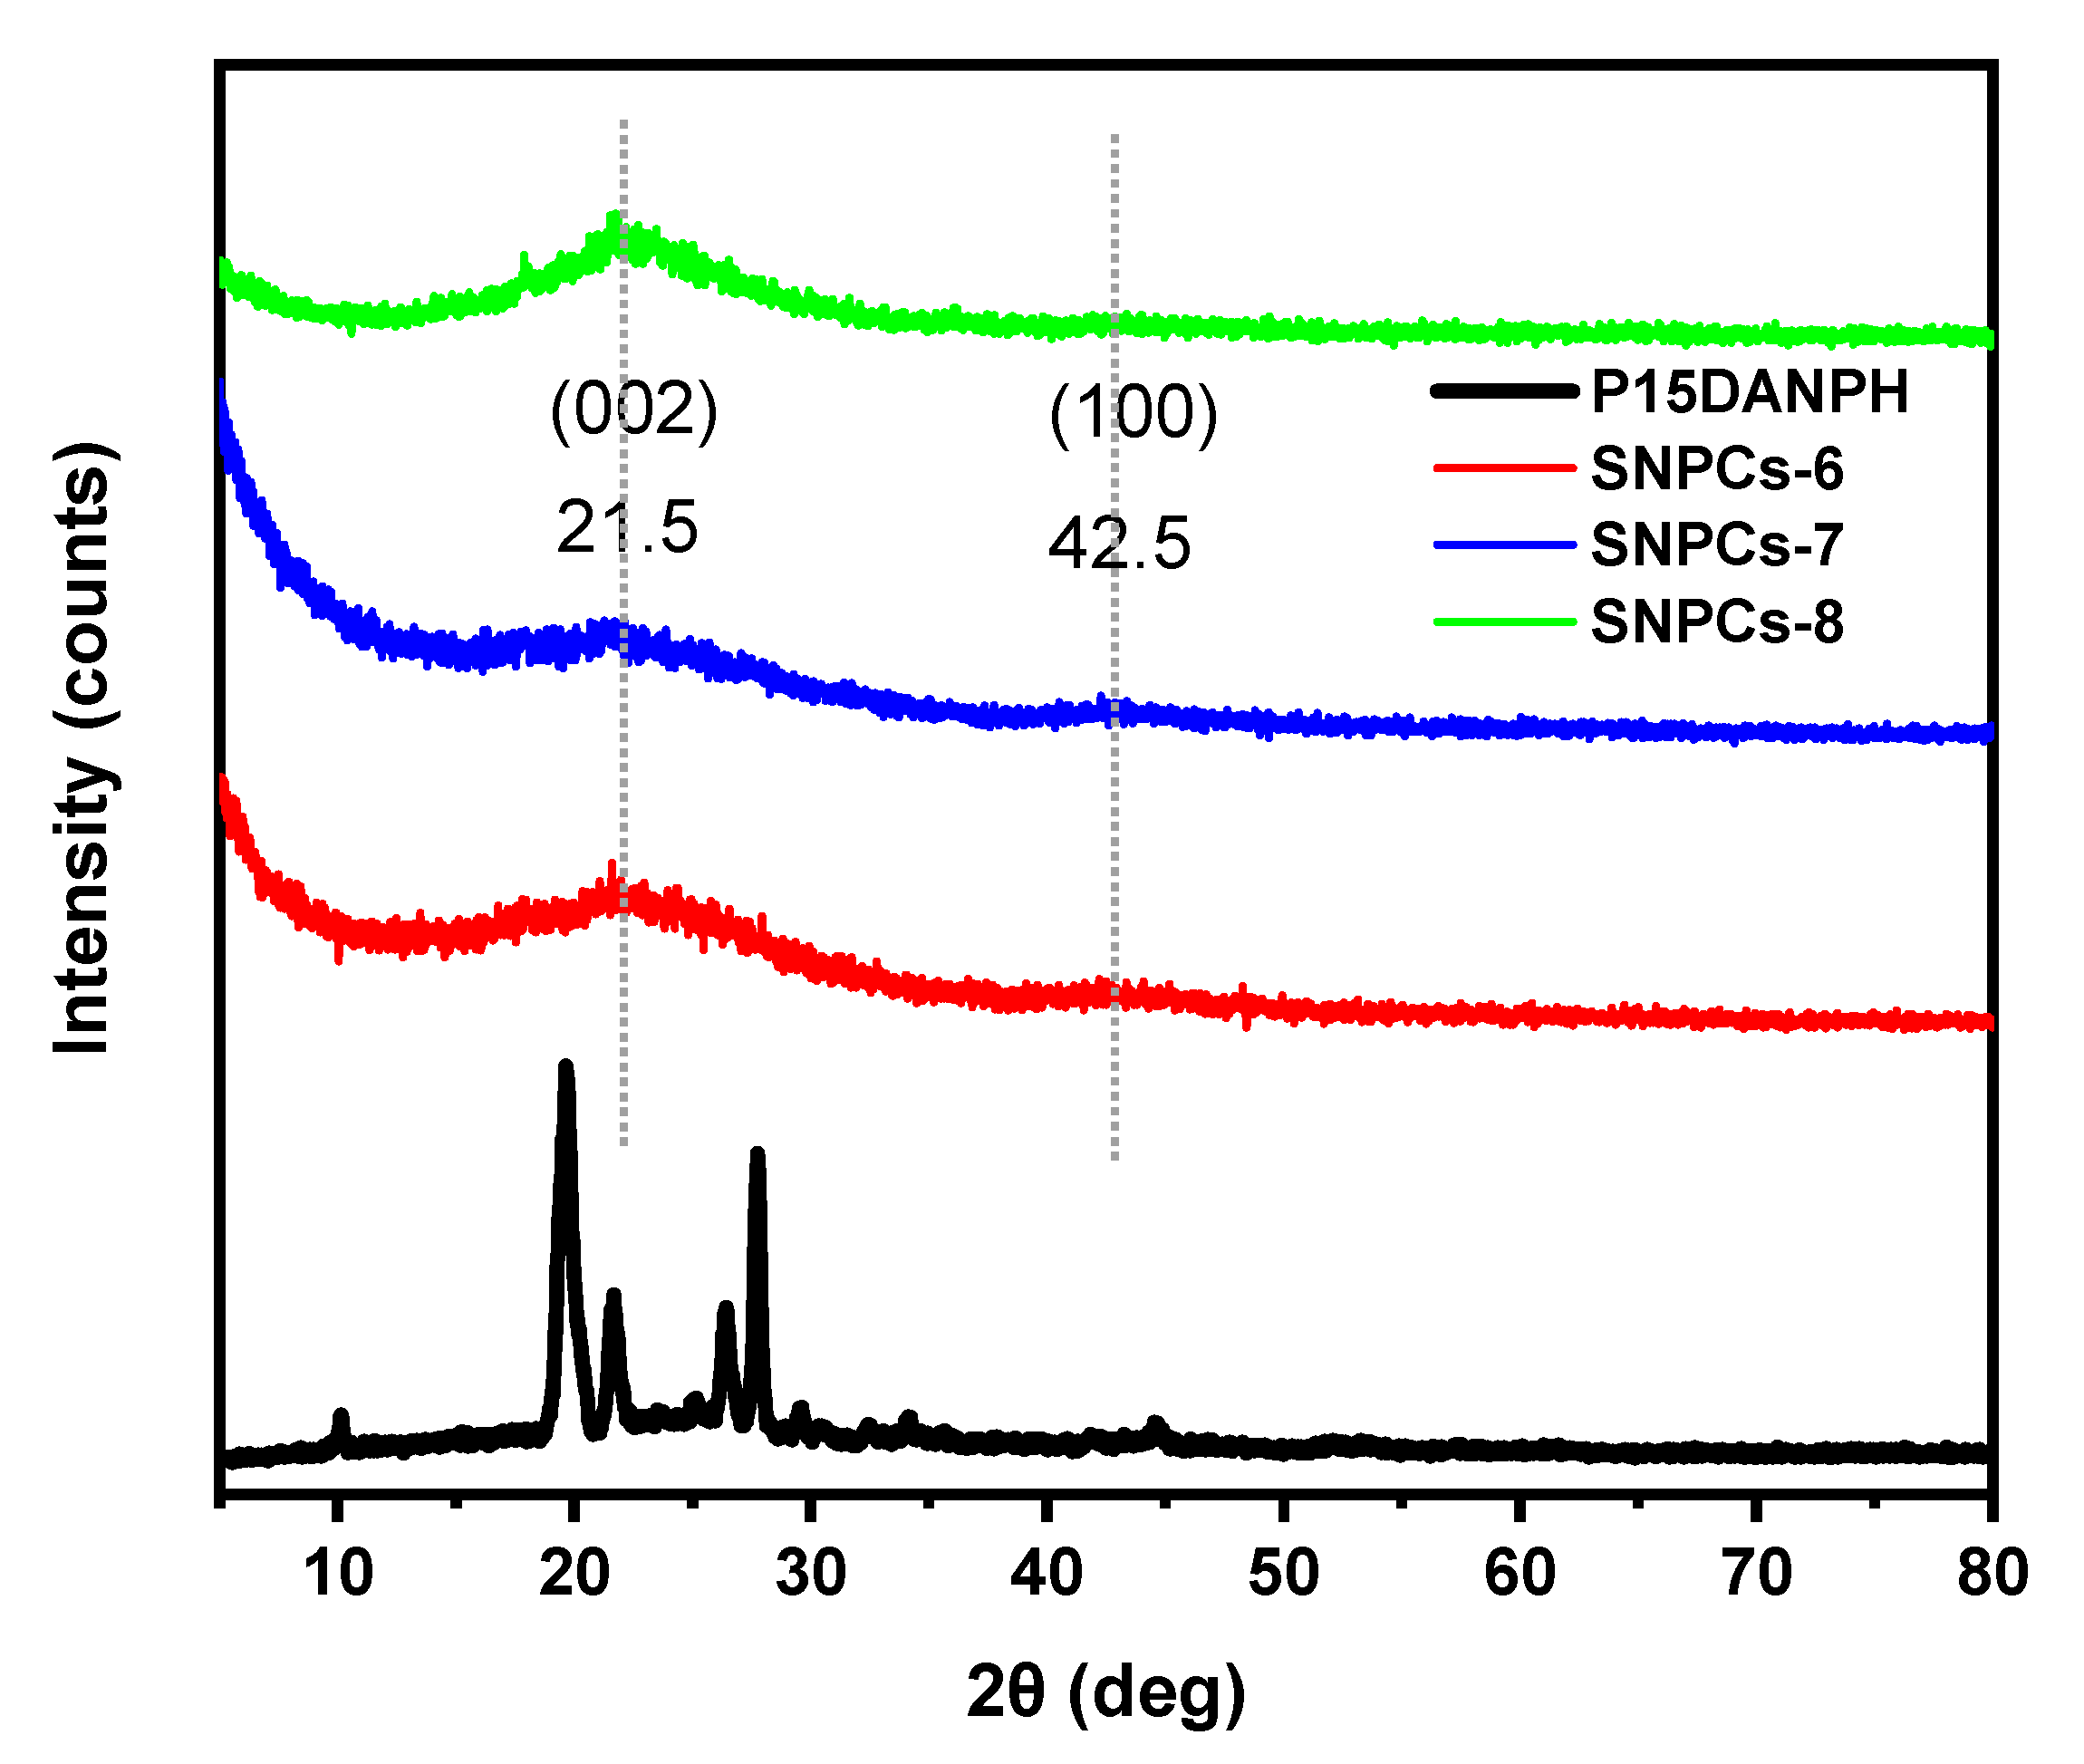
3.1.5. XRD Analysis
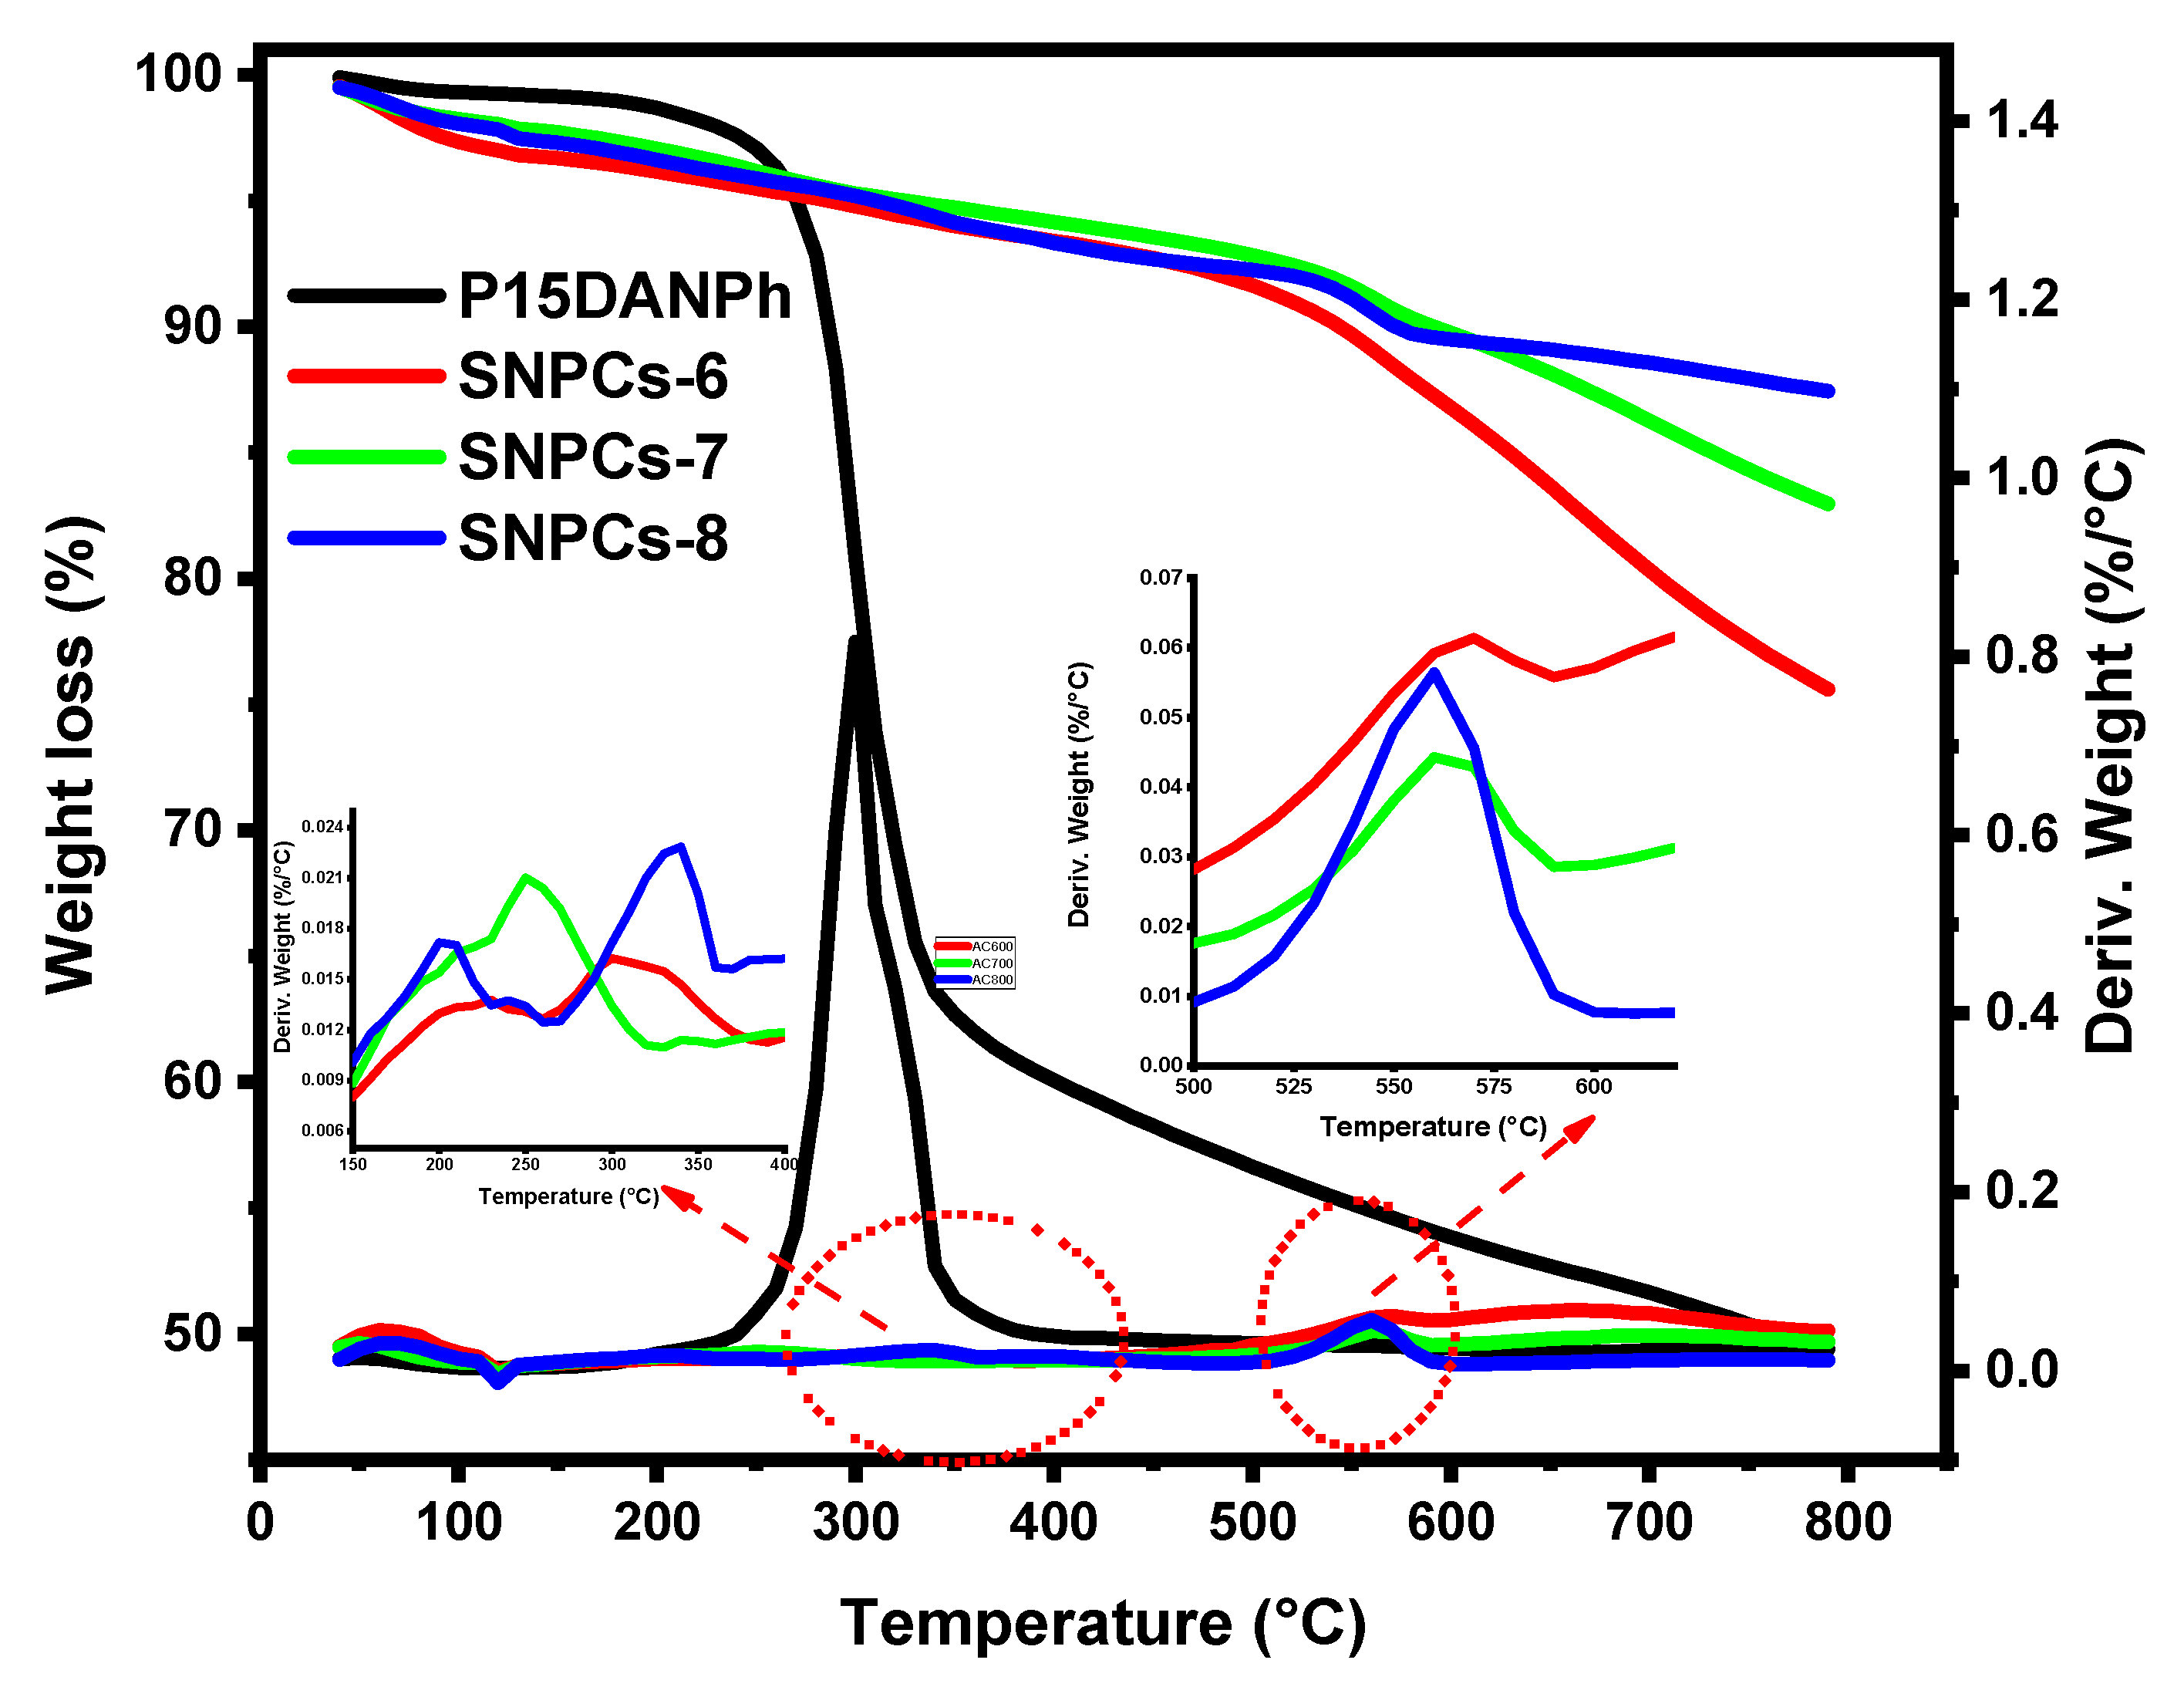
3.1.6. Thermogravimetric Analysis
3.2. Adsorption Study
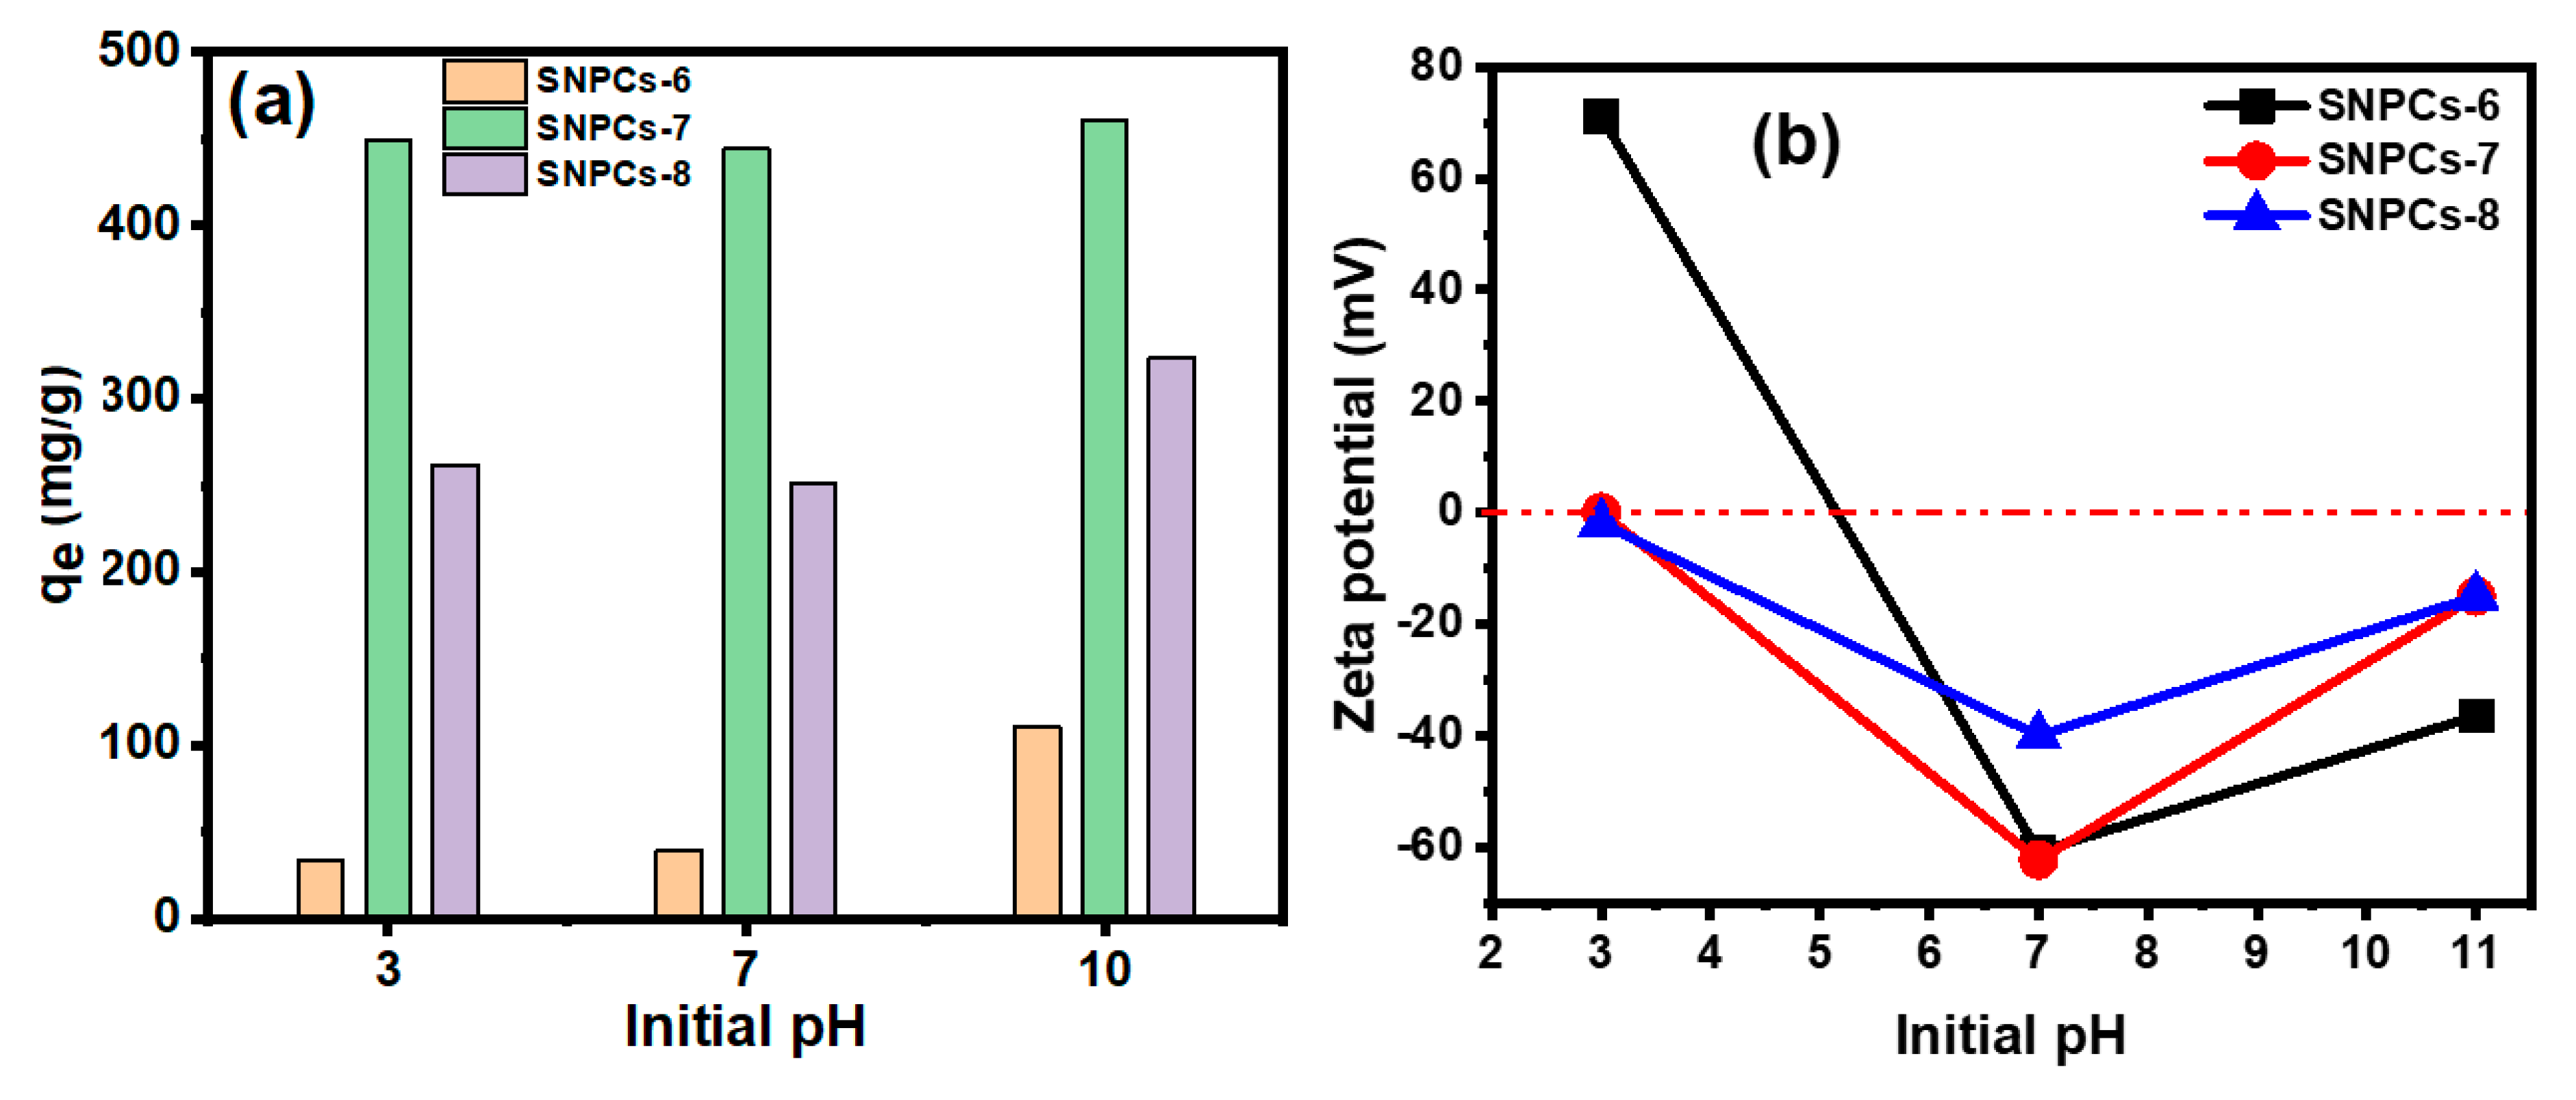
3.2.1. Effect of pH
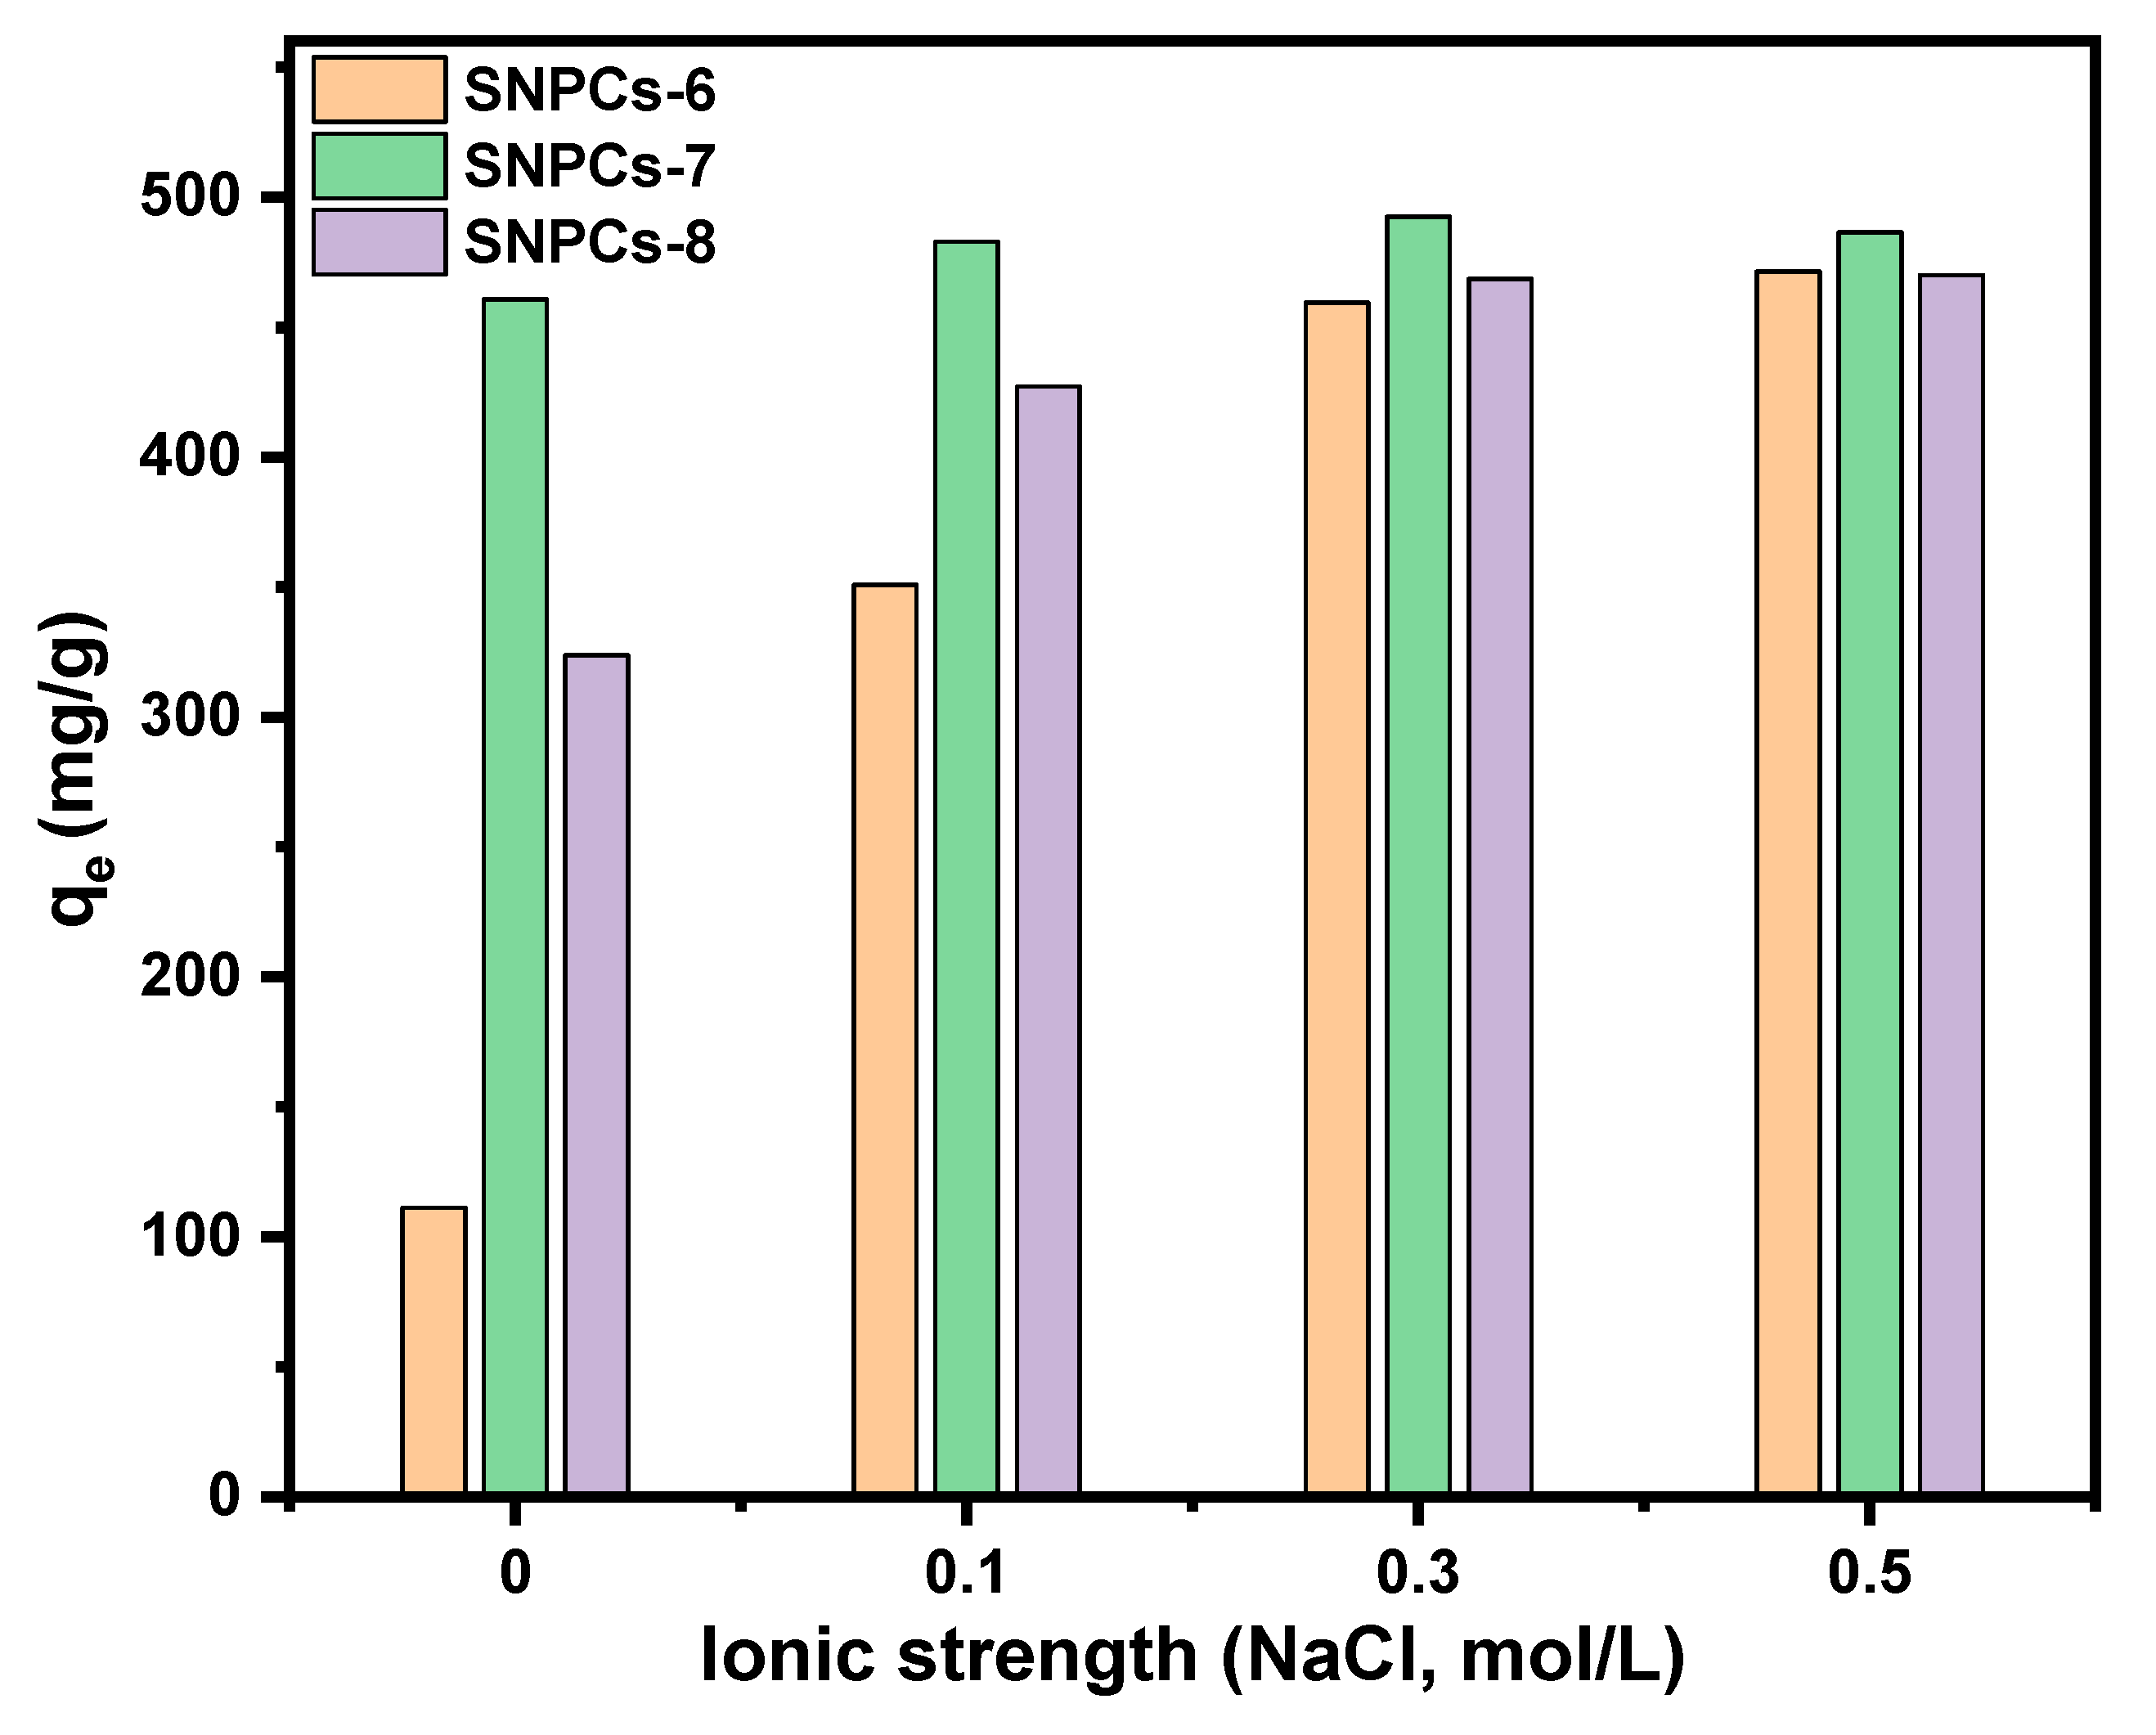
3.2.2. Effect of Ionic Strength
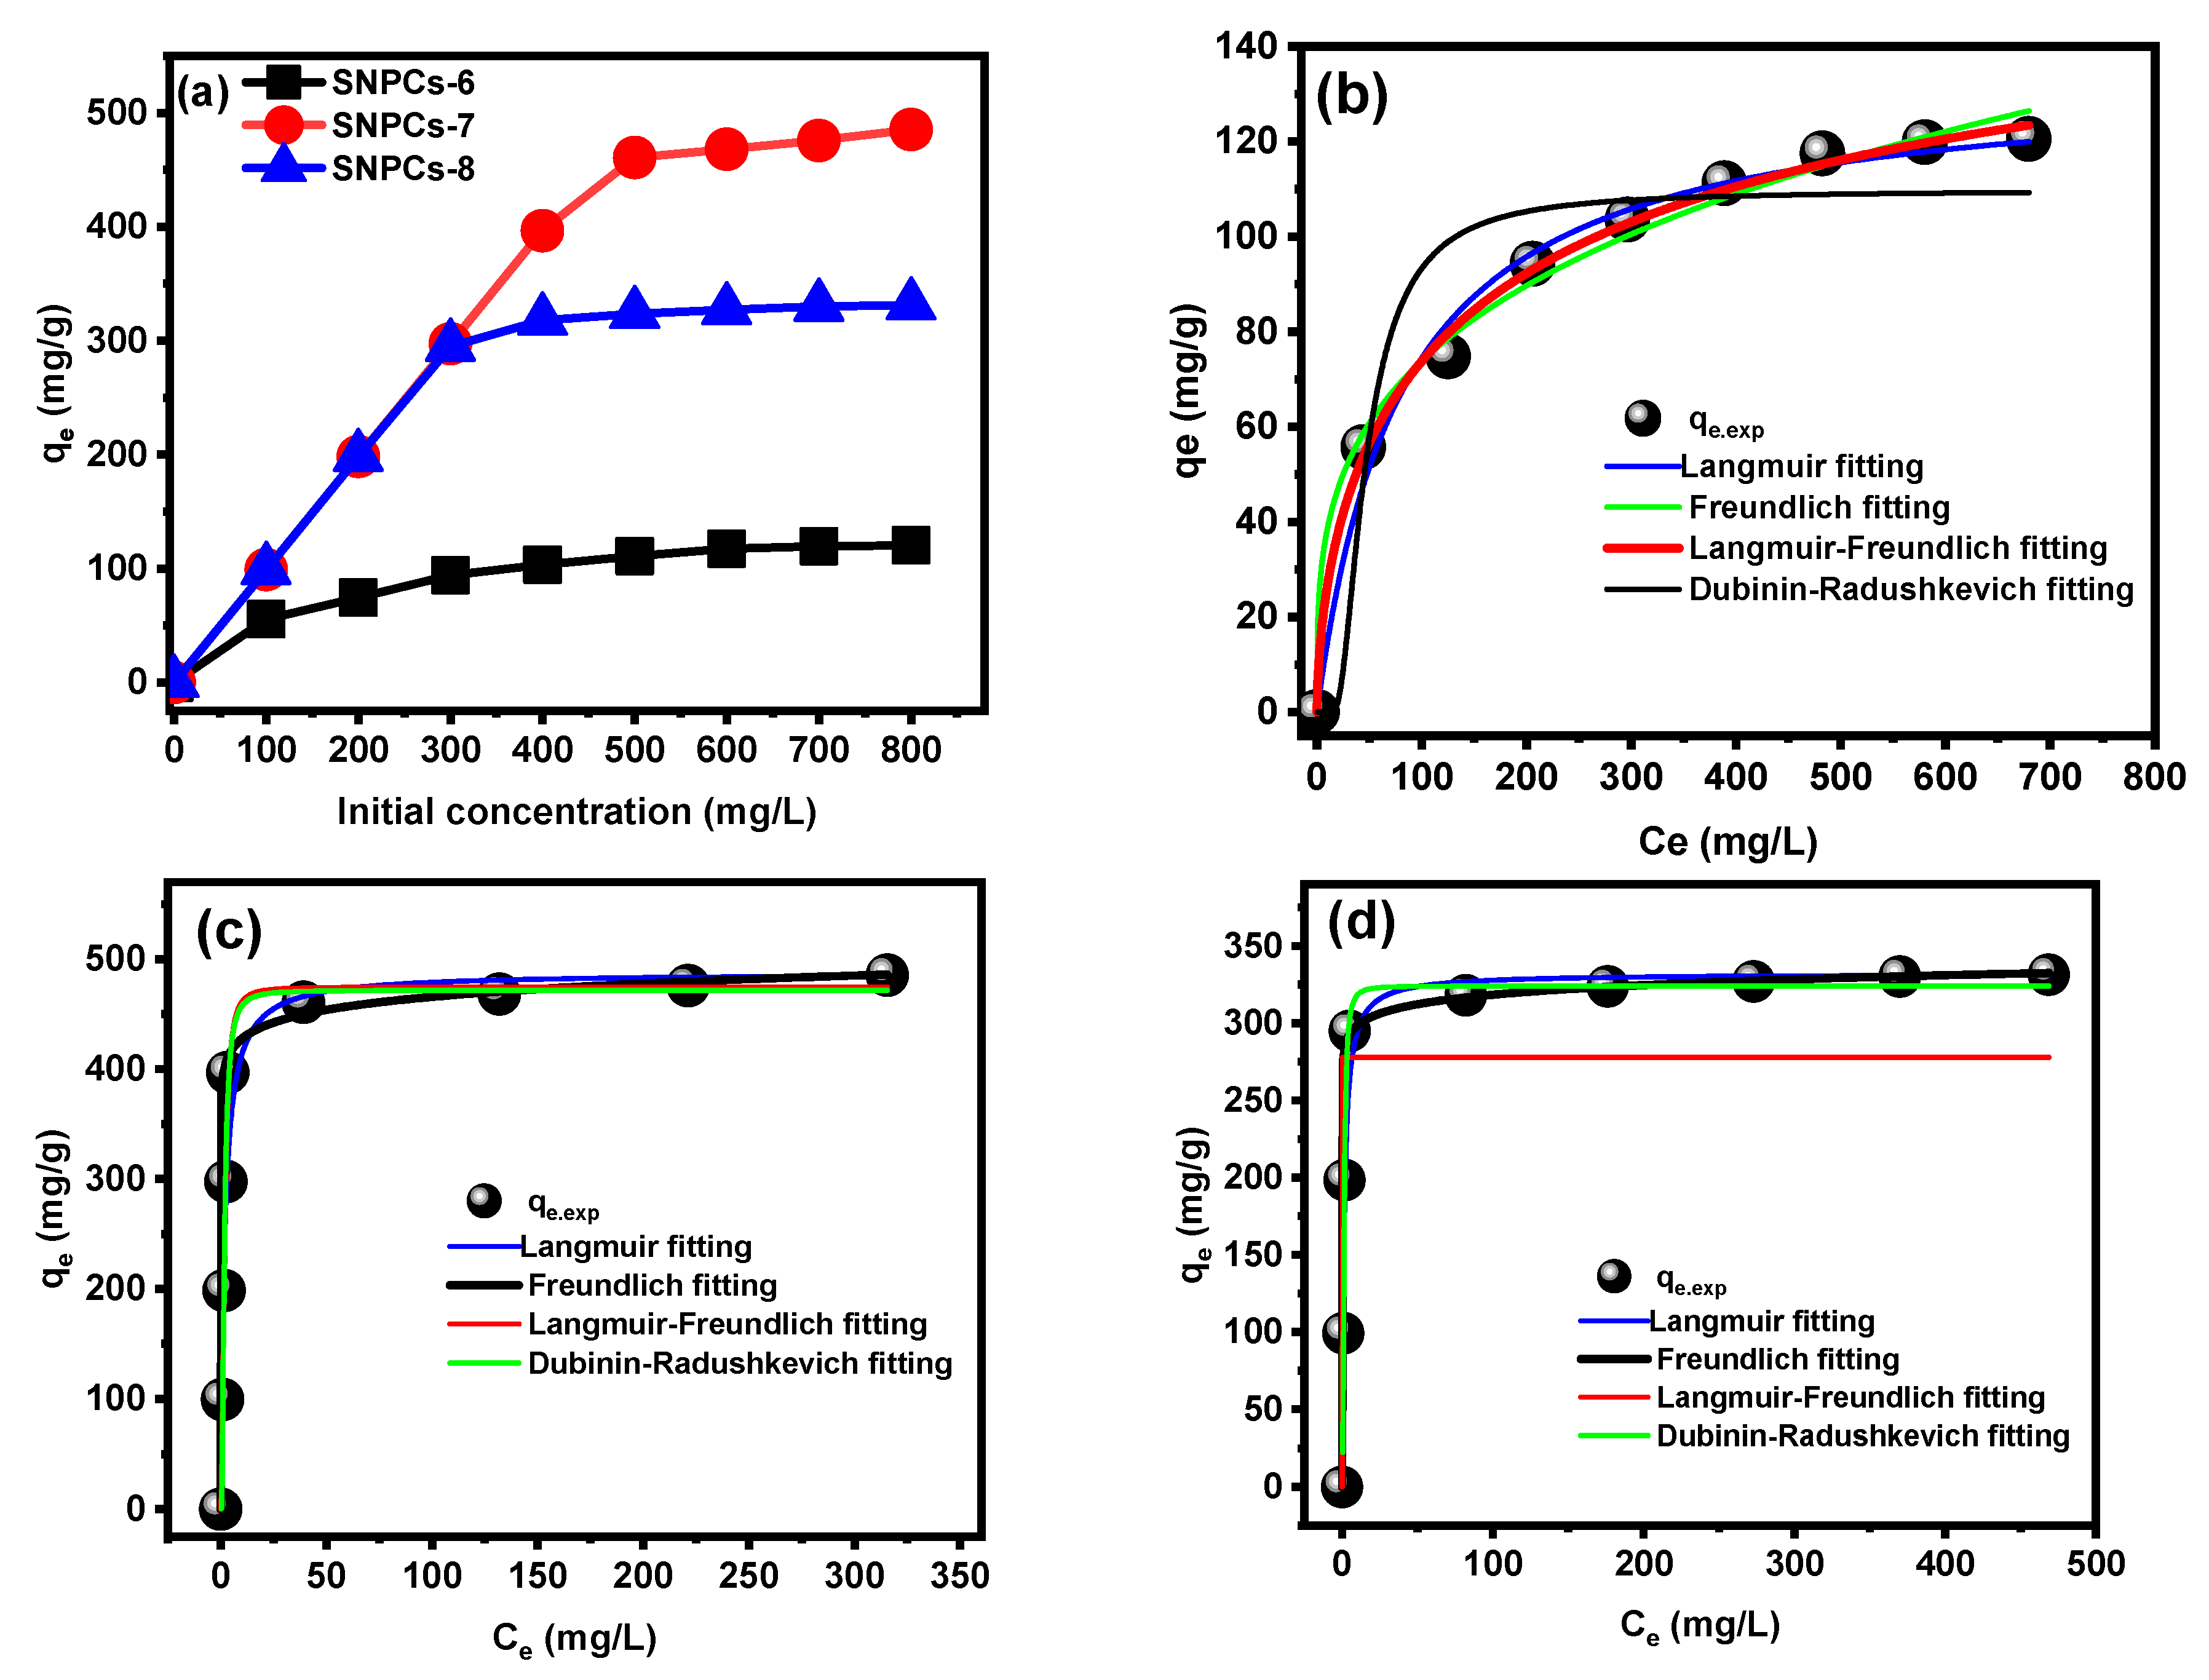
3.2.3. Effect of Initial Concentration and Adsorption Isotherm Study
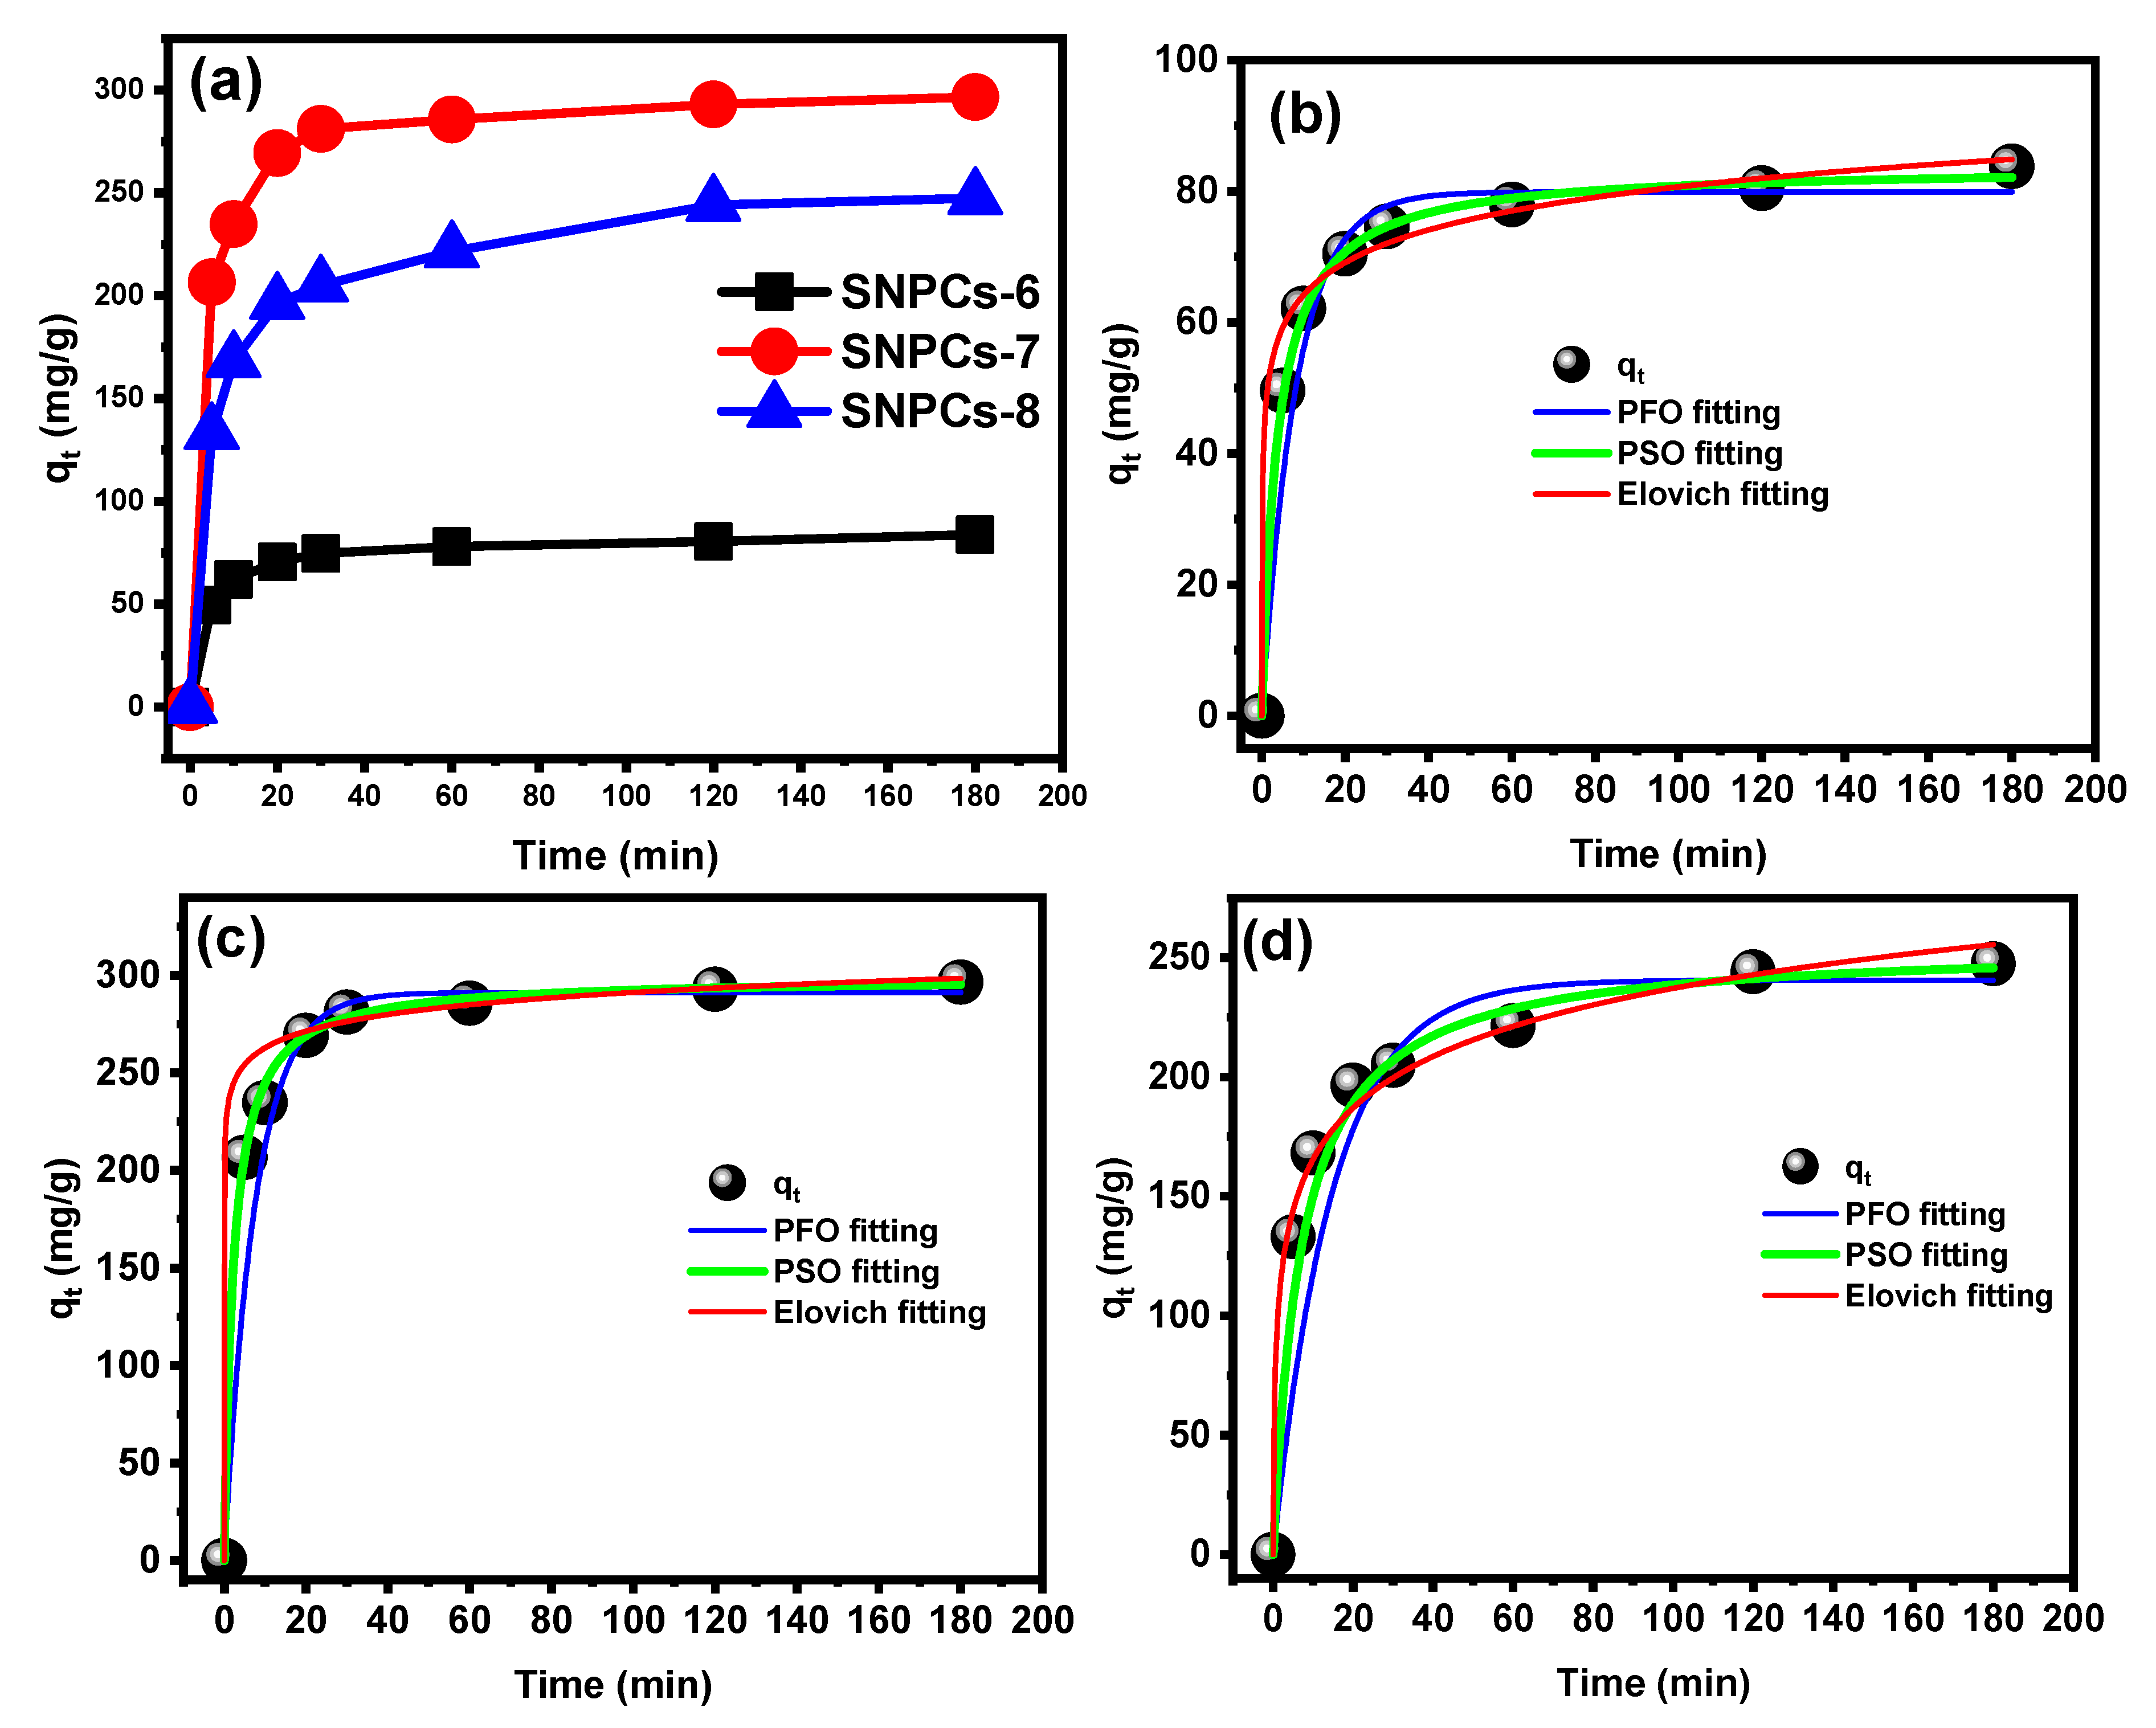
3.2.4. Effect of Contact Time and Kinetic Study
3.2.5. Effect of Temperature and Thermodynamic Studies
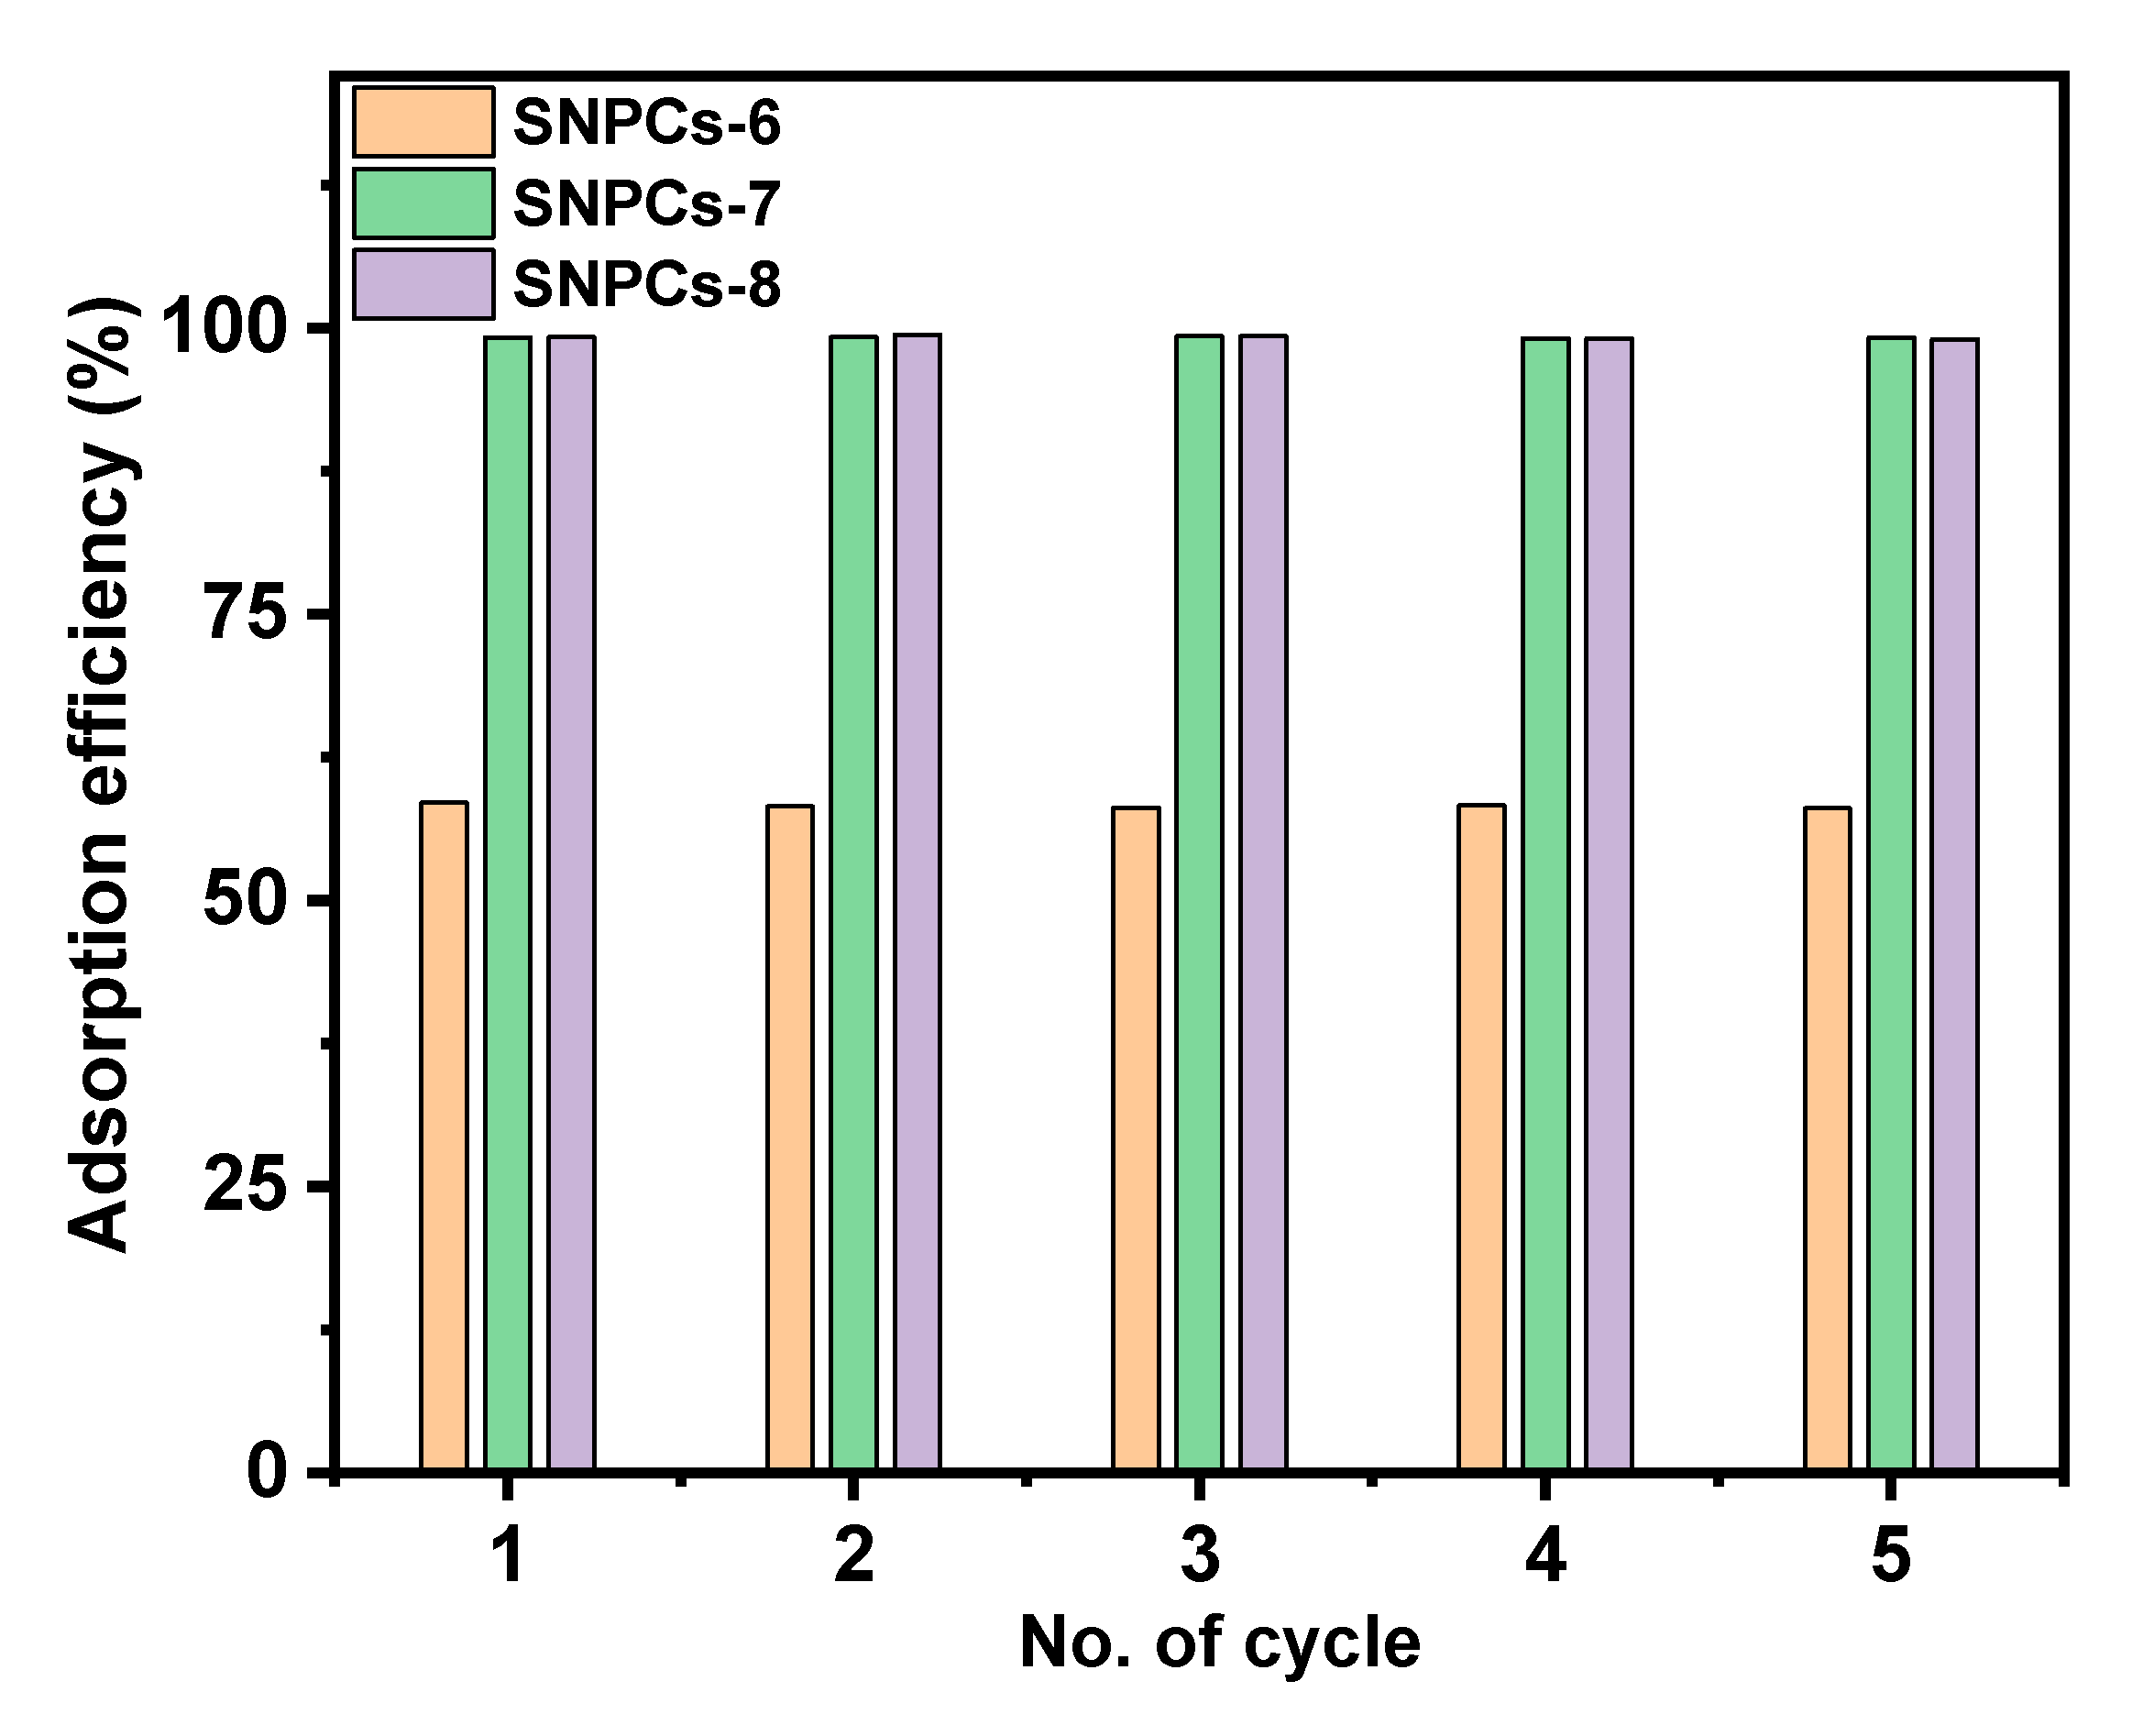
3.2.6. Recycle Study
3.2.7. Proposed Mechanism of Adsorption
3.2.8. Comparison with Other Adsorbents
4. Conclusions
Supplementary Materials
Author Contributions
Funding
Acknowledgments
Conflicts of Interest
References
- Tzanakakis, V.A.; Paranychianakis, N.V.; Angelakis, A.N. Water Supply and Water Scarcity. Water 2020, 12, 2347. [Google Scholar] [CrossRef]
- Arenas-Sánchez, A.; Rico, A.; Vighi, M. Effects of water scarcity and chemical pollution in aquatic ecosystems: State of the art. Sci. Total Environ. 2016, 572, 390–403. [Google Scholar] [CrossRef] [PubMed]
- Garcia, X.; Pargament, D. Reusing wastewater to cope with water scarcity: Economic, social and environmental considerations for decision-making. Resour. Conserv. Recycl. 2015, 101, 154–166. [Google Scholar] [CrossRef]
- Lu, X.; Liu, L.; Liu, R.; Chen, J. Textile wastewater reuse as an alternative water source for dyeing and finishing processes: A case study. Desalination 2010, 258, 229–232. [Google Scholar] [CrossRef]
- Hussain, T.; Wahab, A. A critical review of the current water conservation practices in textile wet processing. J. Clean. Prod. 2018, 198, 806–819. [Google Scholar] [CrossRef]
- Thamer, B.M.; El-Hamshary, H.; Al-Deyab, S.S.; El-Newehy, M.H. Functionalized electrospun carbon nanofibers for removal of cationic dye. Arab. J. Chem. 2019, 12, 747–759. [Google Scholar] [CrossRef]
- Thamer, B.M.; Aldalbahi, A.; Moydeen, A.M.; El-Hamshary, H.; Al-Enizi, A.M.; El-Newehy, M.H. Effective adsorption of Coomassie brilliant blue dye using poly(phenylene diamine)grafted electrospun carbon nanofibers as a novel adsorbent. Mater. Chem. Phys. 2019, 234, 133–145. [Google Scholar] [CrossRef]
- Sadri Moghaddam, S.; Alavi Moghaddam, M.R.; Arami, M. Coagulation/flocculation process for dye removal using sludge from water treatment plant: Optimization through response surface methodology. J. Hazard. Mater. 2010, 175, 651–657. [Google Scholar] [CrossRef]
- Zhu, M.X.; Lee, L.; Wang, H.H.; Wang, Z. Removal of an anionic dye by adsorption/precipitation processes using alkaline white mud. J. Hazard. Mater. 2007, 149, 735–741. [Google Scholar] [CrossRef]
- Ayodhya, D.; Veerabhadram, G. A review on recent advances in photodegradation of dyes using doped and heterojunction based semiconductor metal sulfide nanostructures for environmental protection. Mater. Today Energy 2018, 9, 83–113. [Google Scholar] [CrossRef]
- Ali, H. Biodegradation of synthetic dyes—A review. Water. Air. Soil Pollut. 2010, 213, 251–273. [Google Scholar] [CrossRef]
- Thamer, B.M.; Aldalbahi, A.; Moydeen, A.M.; Al-Enizi, A.M.; El-Hamshary, H.; Singh, M.; Bansal, V.; El-Newehy, M.H. Alkali-activated electrospun carbon nanofibers as an efficient bifunctional adsorbent for cationic and anionic dyes. Colloids Surf. A Physicochem. Eng. Asp. 2019, 582, 123835. [Google Scholar] [CrossRef]
- Thamer, B.M.; Aldalbahi, A.; Moydeen, A.M.; Al-Enizi, A.M.; El-Hamshary, H.; El-Newehy, M.H. Fabrication of functionalized electrospun carbon nanofibers for enhancing lead-ion adsorption from aqueous solutions. Sci. Rep. 2019, 9, 1–15. [Google Scholar] [CrossRef]
- Ahmad, A.; Mohd-Setapar, S.H.; Chuong, C.S.; Khatoon, A.; Wani, W.A.; Kumar, R.; Rafatullah, M. Recent advances in new generation dye removal technologies: Novel search for approaches to reprocess wastewater. RSC Adv. 2015, 5, 30801–30818. [Google Scholar] [CrossRef]
- Şen, F.; Demirbaş, Ö.; Çalımlı, M.H.; Aygün, A.; Alma, M.H.; Nas, M.S. The dye removal from aqueous solution using polymer composite films. Appl. Water Sci. 2018, 8, 206. [Google Scholar] [CrossRef] [Green Version]
- Khan, N.A.; Hasan, Z.; Jhung, S.H. Adsorptive removal of hazardous materials using metal-organic frameworks (MOFs): A review. J. Hazard. Mater. 2013, 244–245, 444–456. [Google Scholar] [CrossRef]
- Santoso, E.; Ediati, R.; Kusumawati, Y.; Bahruji, H.; Sulistiono, D.O.; Prasetyoko, D. Review on recent advances of carbon based adsorbent for methylene blue removal from waste water. Mater. Today Chem. 2020, 16, 100233. [Google Scholar] [CrossRef]
- Kausar, A.; Iqbal, M.; Javed, A.; Aftab, K.; Nazli, Z.I.H.; Bhatti, H.N.; Nouren, S. Dyes adsorption using clay and modified clay: A review. J. Mol. Liq. 2018, 256, 395–407. [Google Scholar] [CrossRef]
- Zare, K.; Gupta, V.K.; Moradi, O.; Makhlouf, A.S.H.; Sillanpää, M.; Nadagouda, M.N.; Sadegh, H.; Shahryari-ghoshekandi, R.; Pal, A.; Wang, Z.; et al. A comparative study on the basis of adsorption capacity between CNTs and activated carbon as adsorbents for removal of noxious synthetic dyes: A review. J. Nanostructure Chem. 2015, 5, 227–236. [Google Scholar] [CrossRef] [Green Version]
- Karimifard, S.; Alavi Moghaddam, M.R. Enhancing the adsorption performance of carbon nanotubes with a multistep functionalization method: Optimization of Reactive Blue 19 removal through response surface methodology. Process Saf. Environ. Prot. 2016, 99, 20–29. [Google Scholar] [CrossRef]
- Tian, W.; Zhang, H.; Duan, X.; Sun, H.; Shao, G.; Wang, S. Porous Carbons: Structure-Oriented Design and Versatile Applications. Adv. Funct. Mater. 2020, 30, 1909265. [Google Scholar] [CrossRef]
- Wang, D.; Wang, Y.; Yang, J.; He, X.; Wang, R.-J.; Lu, Z.-S.; Qiao, Y. Cellulose Aerogel Derived Hierarchical Porous Carbon for Enhancing Flavin-Based Interfacial Electron Transfer in Microbial Fuel Cells. Polymers 2020, 12, 664. [Google Scholar] [CrossRef] [PubMed] [Green Version]
- Park, H.Y.; Lee, C.H.; Cho, D.W.; Lee, C.H.; Park, J.H. Synthesis of porous carbon derived from poly(vinylidenefluoride) and its adsorption characteristics for CO2 and CH4. Microporous Mesoporous Mater. 2020, 299, 110121. [Google Scholar] [CrossRef]
- Zheng, Z.; Gao, Q. Hierarchical porous carbons prepared by an easy one-step carbonization and activation of phenol-formaldehyde resins with high performance for supercapacitors. J. Power Sources 2011, 196, 1615–1619. [Google Scholar] [CrossRef]
- Liu, Y.; Kumar, S. Recent progress in fabrication, structure, and properties of carbon fibers. Polym. Rev. 2012, 52, 234–258. [Google Scholar] [CrossRef]
- Li, Y.; Xu, X.; He, Y.; Jiang, Y.; Lin, K. Nitrogen Doped Macroporous Carbon as Electrode Materials for High Capacity of Supercapacitor. Polymers 2017, 9, 2. [Google Scholar] [CrossRef] [Green Version]
- Wang, H.; Shao, Y.; Mei, S.; Lu, Y.; Zhang, M.; Sun, J.K.; Matyjaszewski, K.; Antonietti, M.; Yuan, J. Polymer-Derived Heteroatom-Doped Porous Carbon Materials. Chem. Rev. 2020, 120, 9363–9419. [Google Scholar] [CrossRef]
- Xu, F.; Wu, D.; Fu, R.; Wei, B. Design and preparation of porous carbons from conjugated polymer precursors. Mater. Today 2017, 20, 629–656. [Google Scholar] [CrossRef]
- Khan, N.A.; An, H.J.; Yoo, D.K.; Jhung, S.H. Polyaniline-derived porous carbons: Remarkable adsorbent for removal of various hazardous organics from both aqueous and non-aqueous media. J. Hazard. Mater. 2018, 360, 163–171. [Google Scholar] [CrossRef]
- Tian, X.; Zhu, S.; Peng, J.; Zuo, Y.; Wang, G.; Guo, X.; Zhao, N.; Ma, Y.; Ma, L. Synthesis of micro- and meso-porous carbon derived from cellulose as an electrode material for supercapacitors. Electrochim. Acta 2017, 241, 170–178. [Google Scholar] [CrossRef]
- Pham, M.C.; Oulahyane, M.; Mostefai, M.; Chehimi, M.M. Multiple internal reflection FT-IR spectroscopy (MIRFTIRS) study of the electrochemical synthesis and the redox process of poly(1,5-diaminonaphthalene). Synth. Met. 1998, 93, 89–96. [Google Scholar] [CrossRef]
- Dhawan, R.; Bhasin, K.K.; Goyal, M. Isotherms, kinetics and thermodynamics for adsorption of pyridine vapors on modified activated carbons. Adsorption 2015, 21, 37–52. [Google Scholar] [CrossRef]
- Langmuir The adsorption of gases on plane surfaces of glass, mica and platinum. J. Am. Chem. Soc. 1918, 40, 1361–1403. [CrossRef] [Green Version]
- Freundlich, H. Über die adsorption in lösungen. Zeitschrift Für Phys. Chemie 1907, 57, 385–470. [Google Scholar] [CrossRef]
- Sips, R. Combined form of Langmuir and Freundlich equations. J. Chem. Phys 1948, 16, 490–495. [Google Scholar] [CrossRef]
- Dubinin, M.M. Equation of the characteristic curve of activated charcoal. Chem. Zentr 1947, 1, 857. [Google Scholar]
- Lagergren, S.K. About the theory of so-called adsorption of soluble substances. Sven. Vetenskapsakad. Handingarl 1898, 24, 1–39. [Google Scholar]
- Blanchard, G.; Maunaye, M.; Martin, G. Removal of heavy metals from waters by means of natural zeolites. Water Res. 1984, 18, 1501–1507. [Google Scholar] [CrossRef]
- Chien, S.H.; Clayton, W.R. Application of Elovich Equation to the Kinetics of Phosphate Release and Sorption in Soils. Soil Sci. Soc. Am. J. 1980, 44, 265–268. [Google Scholar] [CrossRef]
- Aichour, A.; Zaghouane-Boudiaf, H. Synthesis and characterization of hybrid activated bentonite/alginate composite to improve its effective elimination of dyes stuff from wastewater. Appl. Water Sci. 2020, 10, 146. [Google Scholar] [CrossRef]
- Tran, H.N.; You, S.J.; Chao, H.P. Insight into adsorption mechanism of cationic dye onto agricultural residues-derived hydrochars: Negligible role of π-π interaction. Korean J. Chem. Eng. 2017, 34, 1708–1720. [Google Scholar] [CrossRef]
- Nsabimana, A.; Kitte, S.A.; Wu, F.; Qi, L.; Liu, Z.; Zafar, M.N.; Luque, R.; Xu, G. Multifunctional magnetic Fe3O4/nitrogen-doped porous carbon nanocomposites for removal of dyes and sensing applications. Appl. Surf. Sci. 2019, 467–468, 89–97. [Google Scholar] [CrossRef]
- Kaur, S.; Rani, S.; Mahajan, R.K. Adsorptive removal of dye crystal violet onto low-cost carbon produced from Eichhornia plant: Kinetic, equilibrium, and thermodynamic studies. Desalin. Water Treat. 2015, 53, 543–556. [Google Scholar] [CrossRef]
- AbdEl-Salam, A.H.; Ewais, H.A.; Basaleh, A.S. Silver nanoparticles immobilised on the activated carbon as efficient adsorbent for removal of crystal violet dye from aqueous solutions. A kinetic study. J. Mol. Liq. 2017, 248, 833–841. [Google Scholar] [CrossRef]
- Rai, P.; Gautam, R.K.; Banerjee, S.; Rawat, V.; Chattopadhyaya, M.C. Synthesis and characterization of a novel SnFe2O4@activated carbon magnetic nanocomposite and its effectiveness in the removal of crystal violet from aqueous solution. J. Environ. Chem. Eng. 2015, 3, 2281–2291. [Google Scholar] [CrossRef]
- Porkodi, K.; Vasanth Kumar, K. Equilibrium, kinetics and mechanism modeling and simulation of basic and acid dyes sorption onto jute fiber carbon: Eosin yellow, malachite green and crystal violet single component systems. J. Hazard. Mater. 2007, 143, 311–327. [Google Scholar] [CrossRef]
- Senthilkumaar, S.; Kalaamani, P.; Subburaam, C.V. Liquid phase adsorption of Crystal violet onto activated carbons derived from male flowers of coconut tree. J. Hazard. Mater. 2006, 136, 800–808. [Google Scholar] [CrossRef]
- Hamidzadeh, S.; Torabbeigi, M.; Shahtaheri, S.J. Removal of crystal violet from water by magnetically modified activated carbon and nanomagnetic iron oxide. J. Environ. Heal. Sci. Eng. 2015, 13. [Google Scholar] [CrossRef] [Green Version]
- Gabal, M.A.; Al-Harthy, E.A.; Al Angari, Y.M.; Abdel Salam, M. MWCNTs decorated with Mn0.8Zn0.2Fe2O4 nanoparticles for removal of crystal-violet dye from aqueous solutions. Chem. Eng. J. 2014, 255, 156–164. [Google Scholar] [CrossRef]
- Chahinez, H.O.; Abdelkader, O.; Leila, Y.; Tran, H.N. One-stage preparation of palm petiole-derived biochar: Characterization and application for adsorption of crystal violet dye in water. Environ. Technol. Innov. 2020, 19, 100872. [Google Scholar] [CrossRef]
- Wathukarage, A.; Herath, I.; Iqbal, M.C.M.; Vithanage, M. Mechanistic understanding of crystal violet dye sorption by woody biochar: Implications for wastewater treatment. Environ. Geochem. Health 2019, 41, 1647–1661. [Google Scholar] [CrossRef] [PubMed]
- Popa, N.; Visa, M.; Patachia, S. Influence of the Cd2+ Ions on the Crystal Violet Dye Adsorption from Aqueous Solutions by Activated Charcoal Obtained from Pine Cones. In Solar Energy Conversion in Communities, Proceedings of the Springer Proceedings in Energy; Springer: Cham, Switzerland, 2020; pp. 327–357. [Google Scholar]
- Sabna, V.; Thampi, S.G.; Chandrakaran, S. Adsorption of crystal violet onto functionalised multi-walled carbon nanotubes: Equilibrium and kinetic studies. Ecotoxicol. Environ. Saf. 2016, 134, 390–397. [Google Scholar] [CrossRef] [PubMed]


| Sample Code | SSA (m2 g−1) | Vtotal (cm3 g−1) | Vmicro (cm3 g−1) | Vmeso (cm3 g−1) | Meso Ratio (%) | A.V. Pore Width (nm) |
|---|---|---|---|---|---|---|
| SNPCs-6 | 857.20 | 0.489 | 0.360 | 0.129 | 26.38 | 2.28 |
| SNPCs-7 | 1678.80 | 0.943 | 0.239 | 0.704 | 74.70 | 2.25 |
| SNPCs-8 | 860.60 | 0.673 | 0.054 | 0.619 | 91.98 | 3.10 |
| Model | Adsorbent | ||
|---|---|---|---|
| SNPCs-6 | SNPCs-7 | SNPCs-8 | |
| Langmuir | |||
| Qo (mg g−1) | 134.08 ± 4.10 | 487.53 ± 21.03 | 332.03 ± 7.93 |
| KL (L mg−1) | 0.0125 ± 0.0017 | 0.5558 ± 0.1135 | 0.7765 ± 0.1204 |
| RL (mg L−1) | |||
| R2red | 0.9880 | 0.9518 | 0.9790 |
| χ2red | 19.03 | 157.16 | 311.97 |
| Freundlich | |||
| KF mg g−1/(mg L−1)n | 20.26 ± 2.45 | 392.48 ± 12.90 | 279.76 ± 2.21 |
| 1/n | 3.56 ± 0.2605 | 26.93 ± 4.69 | 35.59 ± 1.86 |
| R2red | 0.9907 | 0.99975 | 0.9999 |
| χ2red | 14.78 | 19.86 | 1.26 |
| Langmuir-Freundlich | |||
| qmax (mg g−1) | 179.45 ± 32.29 | 474.64 ± 9.24 | 277.86 ± 32.37 |
| KL-F (L mg−1) | 0.0055 ± 0.0035 | 0.5483 ± 0.0291 | 25.75 ± 0.00 |
| m | 0.5997 ± 0.1222 | 2.06 ± 0.2416 | 62.13 ± 0.00 |
| R2red | 0.99518 | 0.9898 | 0.8390 |
| χ2red | 7.67 | 340.18 | 8382.46 |
| Dubinin-Radushkevich | |||
| qs (mg g−1) | 109.61 ± 5.07 | 471.69 ± 11.11 | 324.05 ± 2.84 |
| KD-R (mol2 kJ−2) | 264.73 ± 85.74 | 0.5544 ± 0.0557 | 0.3334 ± 0.0159 |
| E (kJ mol−1) | 0.0434 | 0.9497 | 1.22 |
| R2red | 0.9012 | 0.9837 | 0.9968 |
| χ2red | 157.16 | 540.94 | 46.94 |
| Model | Adsorbent | ||
|---|---|---|---|
| SNPCs-6 | SNPCs-7 | SNPCs-8 | |
| PFO | |||
| qe,exp | 83.80 | 296.60 | 247.41 |
| qe,cal | 79.86 ± 1.49 | 284.28 ± 5.78 | 240.58 ± 5.25 |
| k1 | 0.1207 ± 0.018 | 0.2253 ± 0.0262 | 0.0673 ± 0.0134 |
| R2red | 0.9985 | 0.9836 | 0.9966 |
| χ2red | 7.43 | 161.94 | 64.91 |
| PSO | |||
| qt,cal | 83.80 ± 0.6698 | 298.96 ± 1.39 | 255.31 ± 3.72 |
| K2 | 0.0032 ± 2.82 × 10⁻⁴ | 0.0015 ± 1.54 × 10⁻⁴ | 5.59 × 10⁻⁴ ± 8.58 × 10⁻⁵ |
| R2red | 0.9998 | 0.9995 | 0.9992 |
| χ2red | 0.8179 | 2.94 | 13.81 |
| Elovich | |||
| α | 5572.83 ± 6790.98 | 2.13 × 10⁹ ± 1.02 × 10¹⁰ | 626.02 ± 260.91 |
| β | 0.1396 ± 0.0177 | 0.08094 ± 0.0175 | 0.0321 ± 0.0024 |
| R2red | 0.9990 | 0.9993 | 0.9921 |
| χ2red | 4.67 | 21.80 | 51.76 |
| Intraparticle diffusion | |||
| Kid(1) | 9.14 ± 1.98 | 27.96 ± 1.13 | 27.93 ± 4.49 |
| I | 30.65 ± 6.77 | 144.85 ± 3.84 | 74.00 ± 15.33 |
| R2red | 0.9100 | 0.9968 | 0.9496 |
| Kid(2) | 1.10 ± 0.0932 | 1.99 ± 0.1091 | 5.58 ± 0.9364 |
| I | 68.84 ± 0.9203 | 270.38 ± 1.08 | 177.05 ± 9.25 |
| R2red | 0.9789 | 0.9910 | 0.9199 |
| T (K) | Van’t Hoff Equation | Kc | ΔG° (kJ mol−1) | ΔH° (kJ mol−1) | ΔS° (kJ mol−1) |
|---|---|---|---|---|---|
| SNPCs-6 | |||||
| 298 | y = –1672x + 54.52 R2 = 0.9453 | 0.43 | −0.63 | 134.45 | 0.45 |
| 308 | 1.46 | −5.16 | |||
| 318 | 3.98 | −9.69 | |||
| SNPCs-7 | |||||
| 298 | y = –5831.6x + 20.45 R2 = 0.9221 | 0.96 | −2.17 | 48.48 | 0.17 |
| 308 | 1.28 | −3.87 | |||
| 318 | 2.24 | −5.57 | |||
| SNPCs-8 | |||||
| 298 | y = 13382x + 46.29 R2 = 0.9662 | 1.49 | −3.44 | 111.26 | 0.38 |
| 308 | 2.48 | −7.28 | |||
| 318 | 4.43 | −11.13 | |||
| Adsorbent | Qo (mg g−1) | References |
|---|---|---|
| Fe3O4/Nitrogen-Doped Porous Carbon | 457.12 | [42] |
| Carbon produced from Eichhornia plant | 50.50 | [43] |
| Ag/activated carbon | 87.2 | [44] |
| SnFe2O4@activated carbon | 158.73 | [45] |
| Jute fiber carbon | 27.99 | [46] |
| Activated carbon derived from biomass | 60.42 | [47] |
| Magnetic activated carbon | 44.7 | [48] |
| MWCNTs/Mn0.8Zn0.2Fe2O4 | 5 | [49] |
| Biochar derived from palm petiole | 186 | [50] |
| Woody biochar | 125.5 | [51] |
| Activated Charcoal | 71.94 | [52] |
| Oxidized MWCNTs | 90.52 | [53] |
| Self-nitrogen doped porous carbon (SNPCs) | 487.53 | This study |
Publisher’s Note: MDPI stays neutral with regard to jurisdictional claims in published maps and institutional affiliations. |
© 2020 by the authors. Licensee MDPI, Basel, Switzerland. This article is an open access article distributed under the terms and conditions of the Creative Commons Attribution (CC BY) license (http://creativecommons.org/licenses/by/4.0/).
Share and Cite
Aldalbahi, A.; Thamer, B.M.; Rahaman, M.; El-Newehy, M.H. Self-Nitrogen-Doped Nanoporous Carbons Derived from Poly(1,5-diaminonaphthalene) for the Removal of Toxic Dye Pollutants from Wastewater: Non-Linear Isotherm and Kinetic Analysis. Polymers 2020, 12, 2563. https://doi.org/10.3390/polym12112563
Aldalbahi A, Thamer BM, Rahaman M, El-Newehy MH. Self-Nitrogen-Doped Nanoporous Carbons Derived from Poly(1,5-diaminonaphthalene) for the Removal of Toxic Dye Pollutants from Wastewater: Non-Linear Isotherm and Kinetic Analysis. Polymers. 2020; 12(11):2563. https://doi.org/10.3390/polym12112563
Chicago/Turabian StyleAldalbahi, Ali, Badr M. Thamer, Mostafizur Rahaman, and Mohamed H. El-Newehy. 2020. "Self-Nitrogen-Doped Nanoporous Carbons Derived from Poly(1,5-diaminonaphthalene) for the Removal of Toxic Dye Pollutants from Wastewater: Non-Linear Isotherm and Kinetic Analysis" Polymers 12, no. 11: 2563. https://doi.org/10.3390/polym12112563