Article

Effect of a Modified Silicone as a Thickener on Rheology of Liquid CO2 and Its Fracturing Capacity

1
College of Petroleum Engineering, China University of Petroleum (East China), Qingdao 266580, China
2
College of Science, China University of Petroleum (East China), Qingdao 266580, China
*
Authors to whom correspondence should be addressed.
Polymers 2019, 11(3), 540; https://doi.org/10.3390/polym11030540
Submission received: 2 January 2019 / Revised: 10 March 2019 / Accepted: 19 March 2019 / Published: 21 March 2019
(This article belongs to the Collection Silicon-Containing Polymeric Materials)

Abstract

:
The low viscosity of pure liquid CO2 hindered the development of CO2 fracturing technology. A modified silicone polymer was prepared as a CO2 thickener to investigate the effect of temperature, pressure, shear rate and thickener content (wt.%) on the apparent viscosity and rheology of thickened liquid CO2. In addition, CO2 fracturing capacity was evaluated with the numerical simulation of extended finite element. The results displayed that an apparent viscosity of up to 1.3 mPa·s at 303 K and 18 MPa was attained over liquid CO2 using the thickener of 3 wt.% and Toluene of 9 wt.% as additives. Compared to the commercial linear polydimethylsiloxane, a better apparent viscosity was obtained from the mixture of this prepared thickener, Toluene and CO2. The apparent viscosity decreases with increasing temperature and shear rate. By contrast, an improving apparent viscosity was revealed with an increase in the pressure from 8 to 14 MPa and thickener content from 1 to 3 wt.%. The rheological index decreased with increasing thickener content with pressure but the rise in temperature led to an increasing rheological index. The mesh structure theory of the thickener, CO2 and Toluene molecules was in this paper gives a good explanation for the discrepancy between CO2 viscosity with the thickener content, temperature, pressure, or shear rate. Compared to pure CO2, the numerical simulation of CO2 fracturing demonstrated an excellent fracturing capacity by using the thickened CO2 fracturing fluid in shale reservoirs. This investigation could provide the basic reference for the development of CO2 fracturing technology.

1. Introduction

As greenhouse effect increases, there is much attention focused on carbon use to reduce CO2 emissions [1]. As an important measure to use CO2, CO2 fracturing in oil and gas exploration has been considered as an effective technology to alleviate the greenhouse effect and enhance oil production [2]. In comparison to hydraulic fracturing fluid, CO2 fracturing technology embodies enormous potential in protecting the environment. This will cause minimal damage to the reservoir due to its excellent backflow performance [1,3,4,5]. Low permeability shale reservoirs exhibited the same inclusiveness for hydraulic fracturing and CO2 fracturing, and a proppant was employed to sustain these fractures in ultra-low permeability reservoirs [6]. In hydraulic fracturing stimulation, the low permeability reservoir would be damaged owing to the blockage of chemical additives and water [7,8]. Similarly, because of the low viscosity of pure CO2, the effectiveness of CO2 fracturing is questioned. Typically, the low viscosity may show defects, which consists of the proppant settling, a poor proppant carrying ability and crack support [9]. Many attempts for improving the viscosity of CO2 have been conducted. However, it was also a huge challenge to screen an efficient method for improving the ability to carry proppants.
An approach to enhance the apparent viscosity of CO2 was to use a chemical [10,11,12,13] which can dissolve in pure CO2 at the constant temperature and pressure of a shale reservoir with the low permeability. In previous studies, Fluoropolymers and Hydrocarbon polymers have been of interest to scientists due to their efficient thickening performance and CO2 use [11,12,13]. Despite the success of these projects, polymers lead to many disadvantages which include polymer residue in the reservoir, large pressure required for fracturing, damage of the reservoir caused by large cracks and consumption of polymers by biological organism. Moreover, because of their relatively poor thickening capacity, expensive and hazardous impact on the environment, the use of Fluoropolymers and Hydrocarbon polymers as a CO2 thickener maybe limited. In addition to the above two polymers, siloxane polymers have been investigated as one of excellent candidates for CO2 thickener due to their appropriate thickening performance [14,15], higher backbone flexibility and higher CO2-solubility [16,17]. Moreover, as an inexpensive, environmentally benign polymer, preparation or purchase was relatively convenient. However, the main challenge for siloxane polymers is their thickening performance, large dissolution pressure and high additional amount of thickener with cosolvent [10,18]. To improve the thickening performance of siloxane polymers, many methods have been adopted, and the silicone modification has presented an outstanding ability in improving the apparent viscosity of CO2 [19]. To improve the solubility and interaction of polymers in CO2, these electron-donating groups such as the carbonyl or ether groups [20,21] could be introduced into the silicone polymer. As an electron-donating group, the epoxy group presented the same function as carbonyl and ether group. It should be noted that the epoxy group exhibited excellent stability in the hydrosilylation [22,23,24]. Meanwhile, the rheology of CO2 fracturing fluids has a critical impact on the evaluation of the fracturing property.
In this study, the Epoxy Ether-based Polydimethylsiloxane (EEPDMS) was synthesized. The effect of temperature, pressure, shear rate and EEPDMS content on the apparent viscosity of CO2 was investigated. A mesh structure model was proposed to explain the changing thickening performance of EEPDMS at different conditions. To compare the fracturing difference between pure CO2 and thickened CO2, this paper constructed the shale reservoir model with a low permeability, which was used in observing the CO2 fracturing consequent.

2. Materials and Methods

2.1. Materials

Octamethylcyclotetrasiloxane (99.9%), Tetramethyldisiloxane (99.0%) were purchased from Shenzhen Osbang New Material Co., Ltd. (Shenzhen, China). Glycidyl methacrylate (97.0%) was obtained from Aladdin Reagents (Shanghai, China) Co., Ltd. Other chemicals (Ethanol (99.0%), Toluene (99.5%), Sulfuric acid (98.5%) and Chloroplatinic acid (>99.9%)) were procured from Sinopharm Chemical Reagent Co., Ltd. (Shanghai, China). In this synthesis experiment, all drugs were sampled as received unless otherwise without further purification.

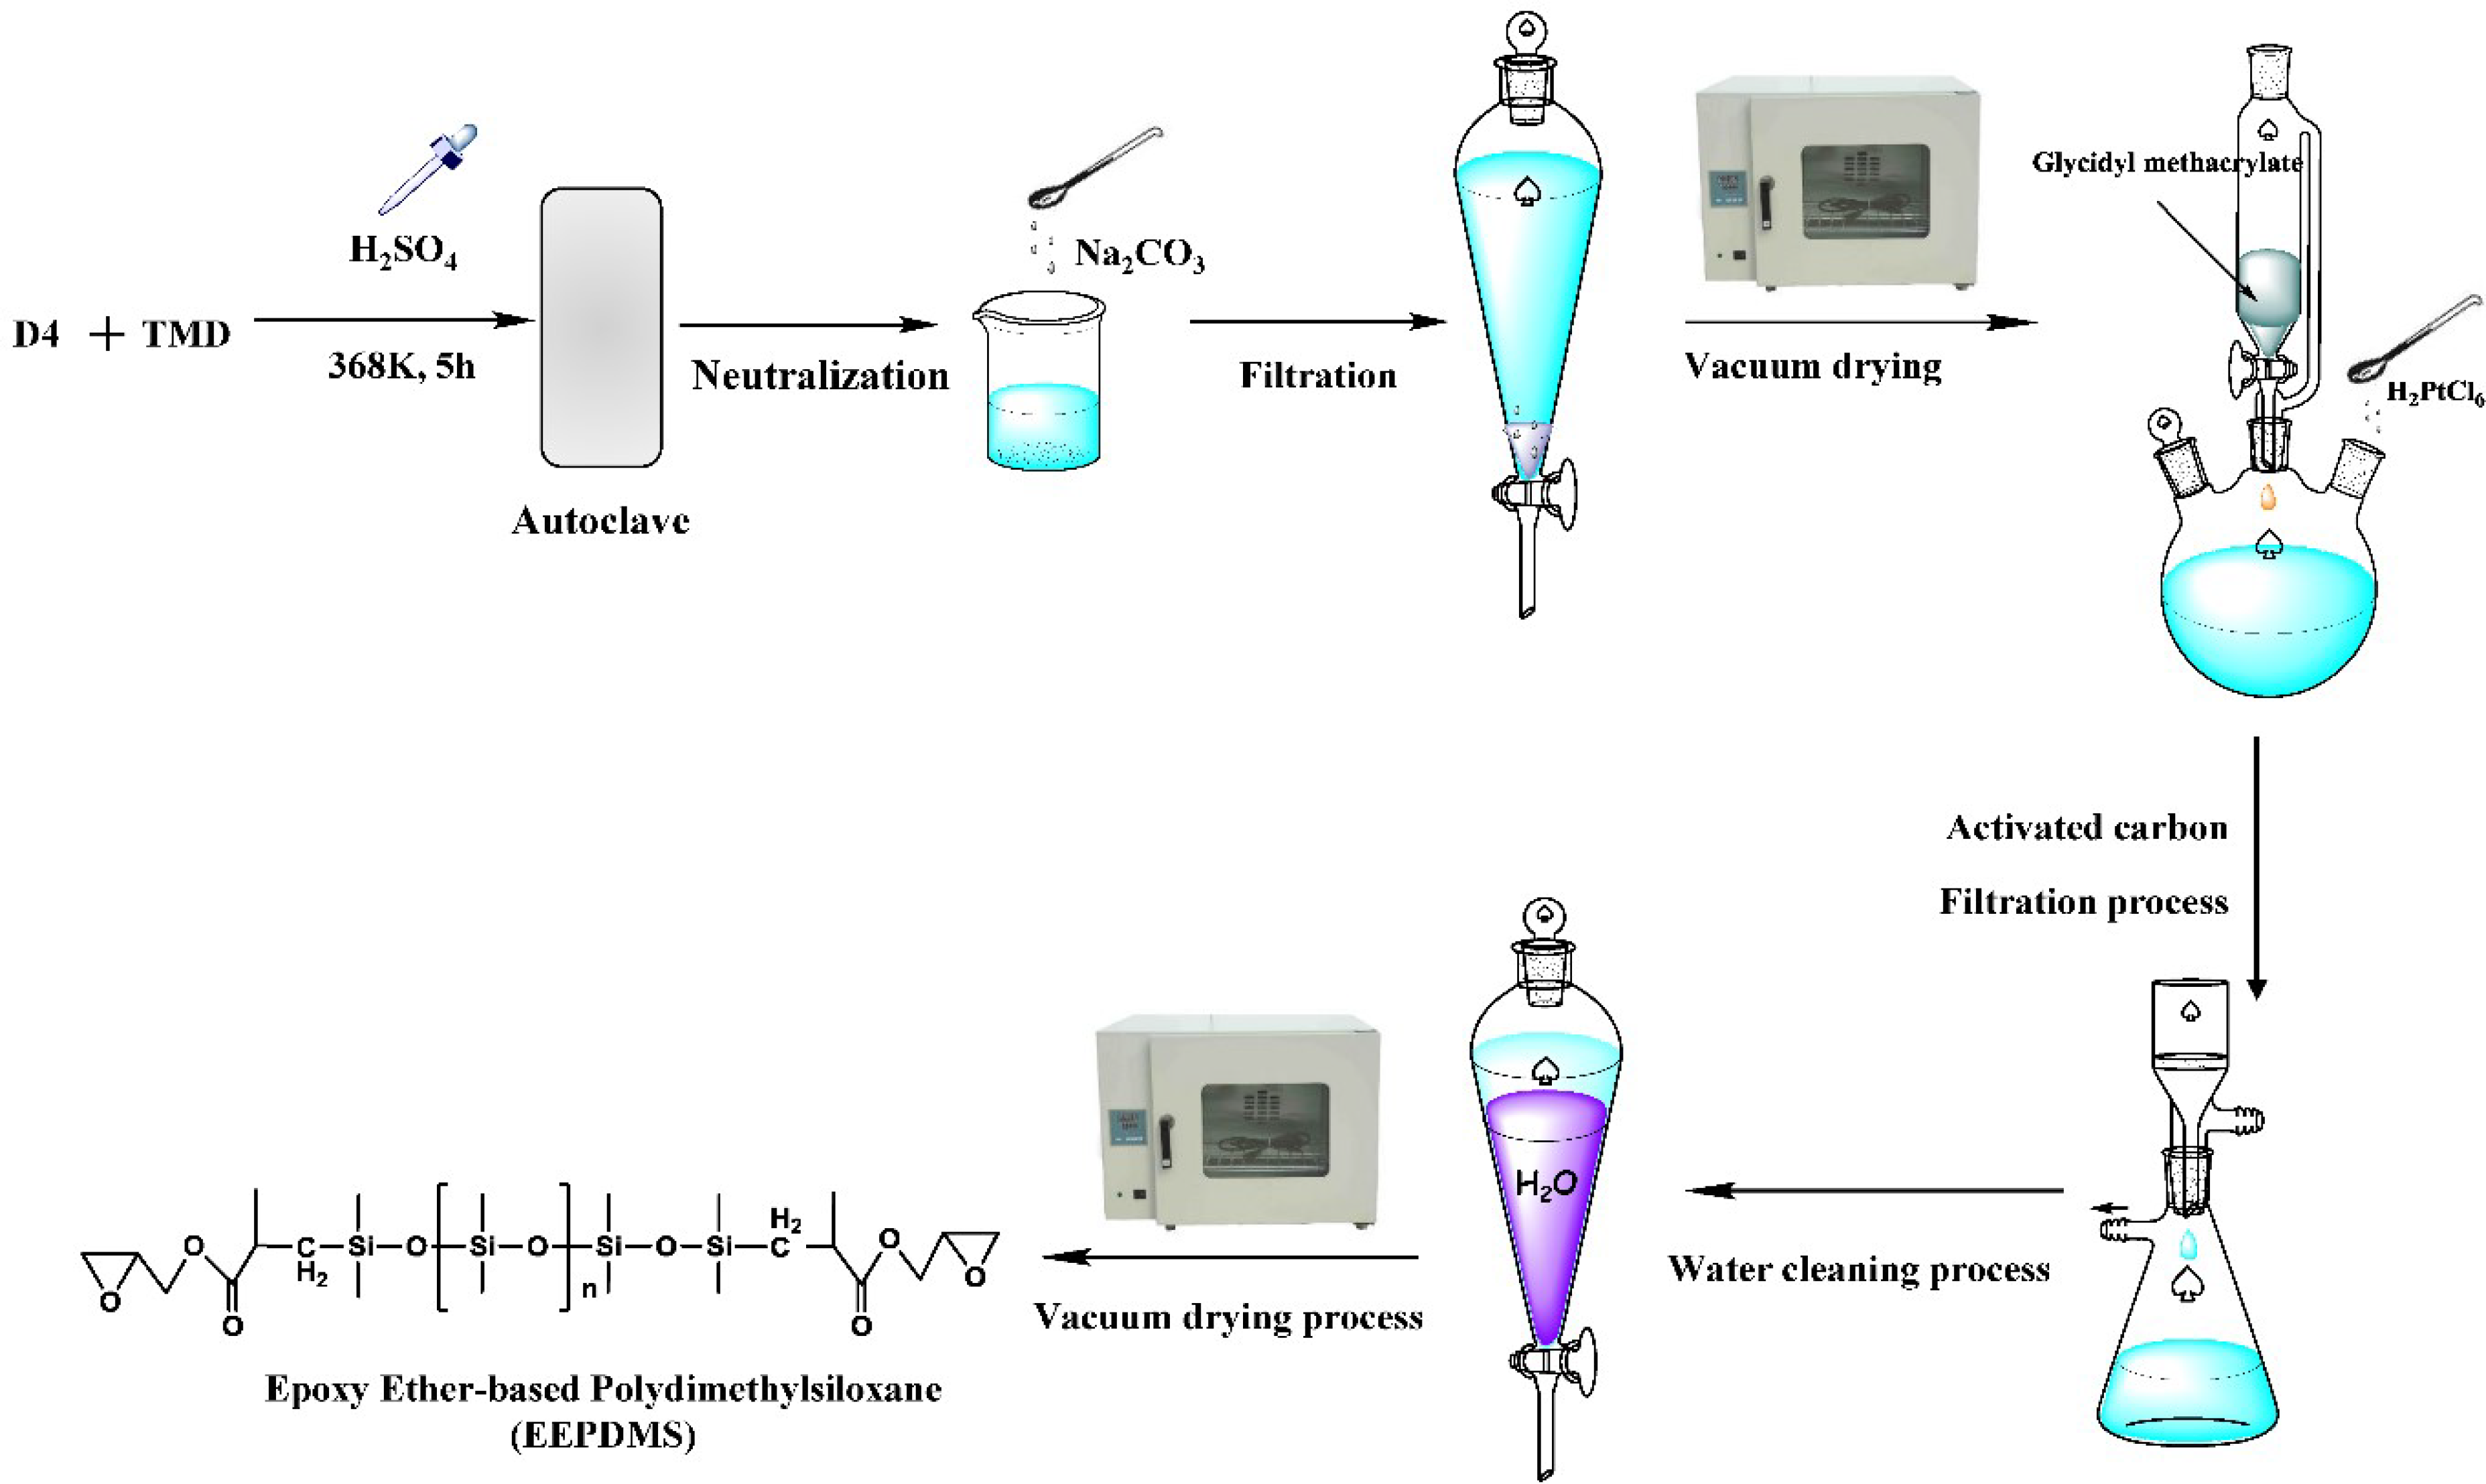
2.2. Preparation of EEPDMS

All chemicals and solvents were sampled as received unless otherwise without further purification and were stored at 278 K and anaerobic environment. For the synthesis of EEPDMS, typical procedures were as follows (Figure 1). At first, Ring opening polymerization [25] was performed in a 500 mL autoclave. 60 g octamethylcyclotetrasiloxane (D4), 5 g Tetramethyldisiloxane (TMD) and 0.2 g sulfuric acid were added to an autoclave. After flushing the autoclave 30 min with N2, the autoclave was closed and put in a roller furnace. Then temperature was controlled to 368K, and stirring operation was conducted by the rotation of the closed autoclave in this roller furnace. After reacting for 5 h, the autoclave was cooled to 298 K. 1 g sodium carbonate was used to remove the sulfuric acid. To remove water and low boilers, the primary product was transferred into a vacuum drying oven at 393 K and 0.09 MPa. Secondly, the pure Hydrogen terminated polydimethylsiloxane (primary product) was poured into a three-necked flask, and hydrosilylation [26] was started with addition of Glycidyl methacrylate (GM) of 4.1 g and Chloroplatinic acid (0.005 wt.%) at 373 K for 3 h. To remove chloroplatinic acid, 2 g activated carbon was added into this secondary product, and then the mixture was purified by repeated-washing by using the distilled water after stopping the hydrosilylation. Water and small molecule compounds were removed by a rotary evaporator at 370 K and a vacuum of 0.06 MPa. The final product was stored in a sealed container under a low temperature (280 K). EEPDMS molecular weight of 21,000 (Mη) was measured by an ubbelohde viscometer [27,28]. It should be noted that the epoxy group was not to be destroyed, and many investigations have been proved this conclusion [22,23,24].

2.3. EEPDMS Characterization

Fourier transform infrared spectroscopy (FT-IR) spectrum was carried out by a Bruker Tensor 27 (Berlin, Germany) equipped with a DLaTGS detector. EEPDMS was smeared on a KBr pill and then scanned from 450 cm−1 to 3500 cm−1 with a resolution of 2 cm−1. In addition, the nuclear magnetic resonance spectroscopy (1H-NMR) was conducted using a Bruker AVANCE III (Berlin, Germany) at a frequency of 400 MHz. Deuterated chloroform was taken as the solvent, and 0.05 mL of EEPDMS was dissolved in 0.15 mL deuterated chloroform for 30 min.

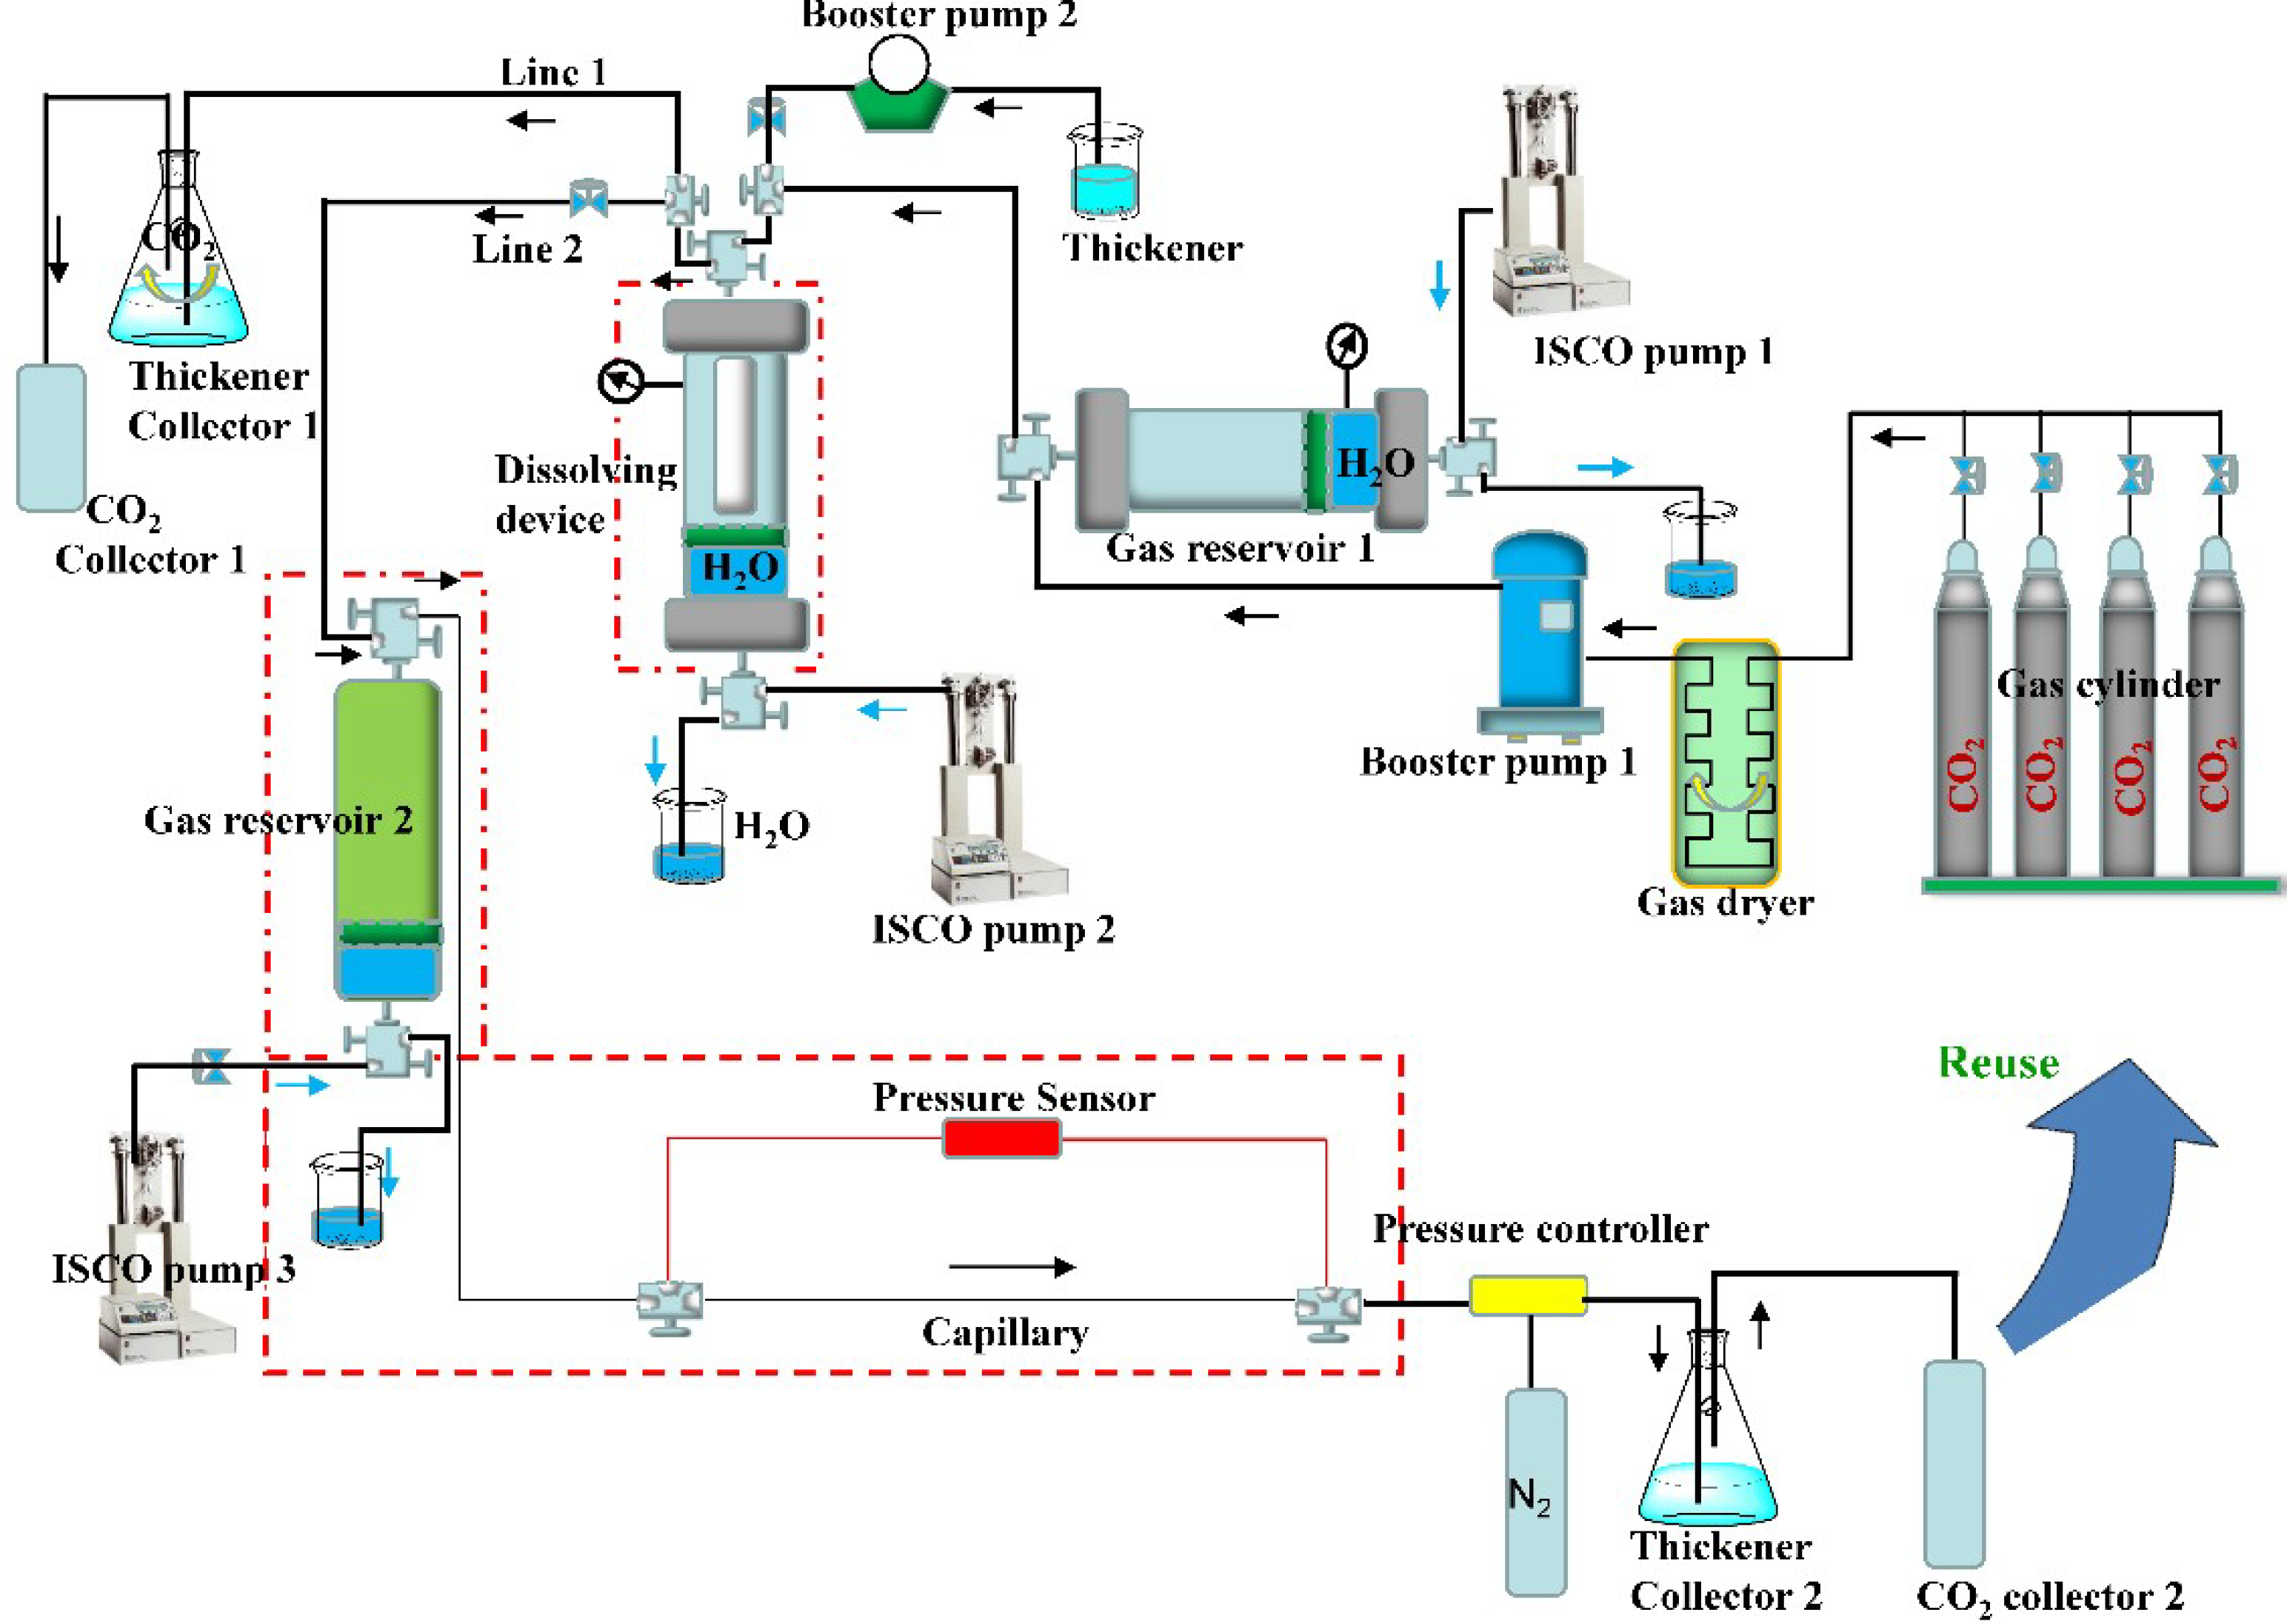
2.4. Measurement Device and Calculation Method

As shown in Figure 2, this investigation was conducted in a self-designed viscosity measuring device, which included a CO2 pressurization system, pressure fine-tuning system, dissolution measurement system, viscosity measurement system, and data acquisition system. This measurement system not only was employed in measuring the viscosity and rheology of thickened CO2, but also obtaining the solubility of EEPDMS in CO2 by observing the appearance of the solution.
The booster pump 1 shown in Figure 2 was used in pressurizing and liquefying CO2. The preliminary pressurized liquid CO2 was stored in the gas reservoir 1 (6 L, radius of 120 mm) immediately fabricated from the stainless steel. A gas dryer, installed in front of booster pump 1, was employed in absorbing moisture from CO2. To add EEPDMS to the dissolving device, a booster pump 2 was designed. Dissolving device with a visible window was a core part of this apparatus, which was used to observe the appearance of thickened liquid CO2 at different pressures and temperatures. Here, the appearance of thickened liquid CO2 mainly consisted of the insoluble state, turbid state, and clarified state. Only the thickened CO2 with a clarified state was pressured into the viscosity measurement system, which included a gas reservoir 2 and capillary (radius of 0.004 mm, length of 5 m). By contrast, other CO2 with the insoluble state or turbid state would be exhausted through the line 1. The ISCO pump 3 displayed schematically in Figure 2 was used in imposing a stable flow rate of the thickened liquid CO2 in the capillary. Hagen–Poiseuille equation was used to calculate the liquid viscosity according to the pressure difference and capillary parameters.
Moreover, The relationship between consistency coefficient K and Rheological index n can be expressed by Equation (1) [9].
lg τ w = lg K ( 3 n + 1 4 n ) n + n lg ( 8 v D )
where 8v/D is the apparent shear rate, s−1, and τw is the wall shear stress, Pa. v is the flow rate, m·s−1, D is the capillary diameter, m. It could be seen that there was a linear relationship was displayed between Logτw and Log(8v/D) herein. n is the slope of the straight line, and the Log ( 3 n + 1 4 n ) n was considered as the intercept. K could be calculated by the intercept value and obtained n value.

2.5. Cosolvent Screening

The screened solvents with different polarities were mixed with EEPDMS to obtain a mixed liquid and placed at a sealed glass vial. The rotary viscometer, operated at room temperature, was used to measure the solution viscosity. In addition, the solubility and phase behavior of EEPDMS in organic solvents was determined via observing the absorbance variation gauged by a UV-visible spectrophotometer [29].

2.6. Phase Behavior for the Thickened Liquid CO2

The phase behavior and solubility of EEPDMS in solvent/CO2 mixtures were measured by using a variable-volume view cell, which is equipped with the pressure-resistant glass window (Figure 2). Here, the phase behavior of the mixture was observed with the judgment to know if there was an excellent solubility of EEPDMS in CO2 at the given temperature and pressure. Generally, an excellent solubility is prerequisite for further measurement of the thickening performance of EEPDMS in solvent/CO2 mixtures [30].
The capillary viscometer mentioned previously was used to assess the viscosity of solution included EEPDMS, solvent, and CO2. The influence of different factors on the viscosity and rheology of thickened liquid CO2 was discussed and interpreted emphatically.

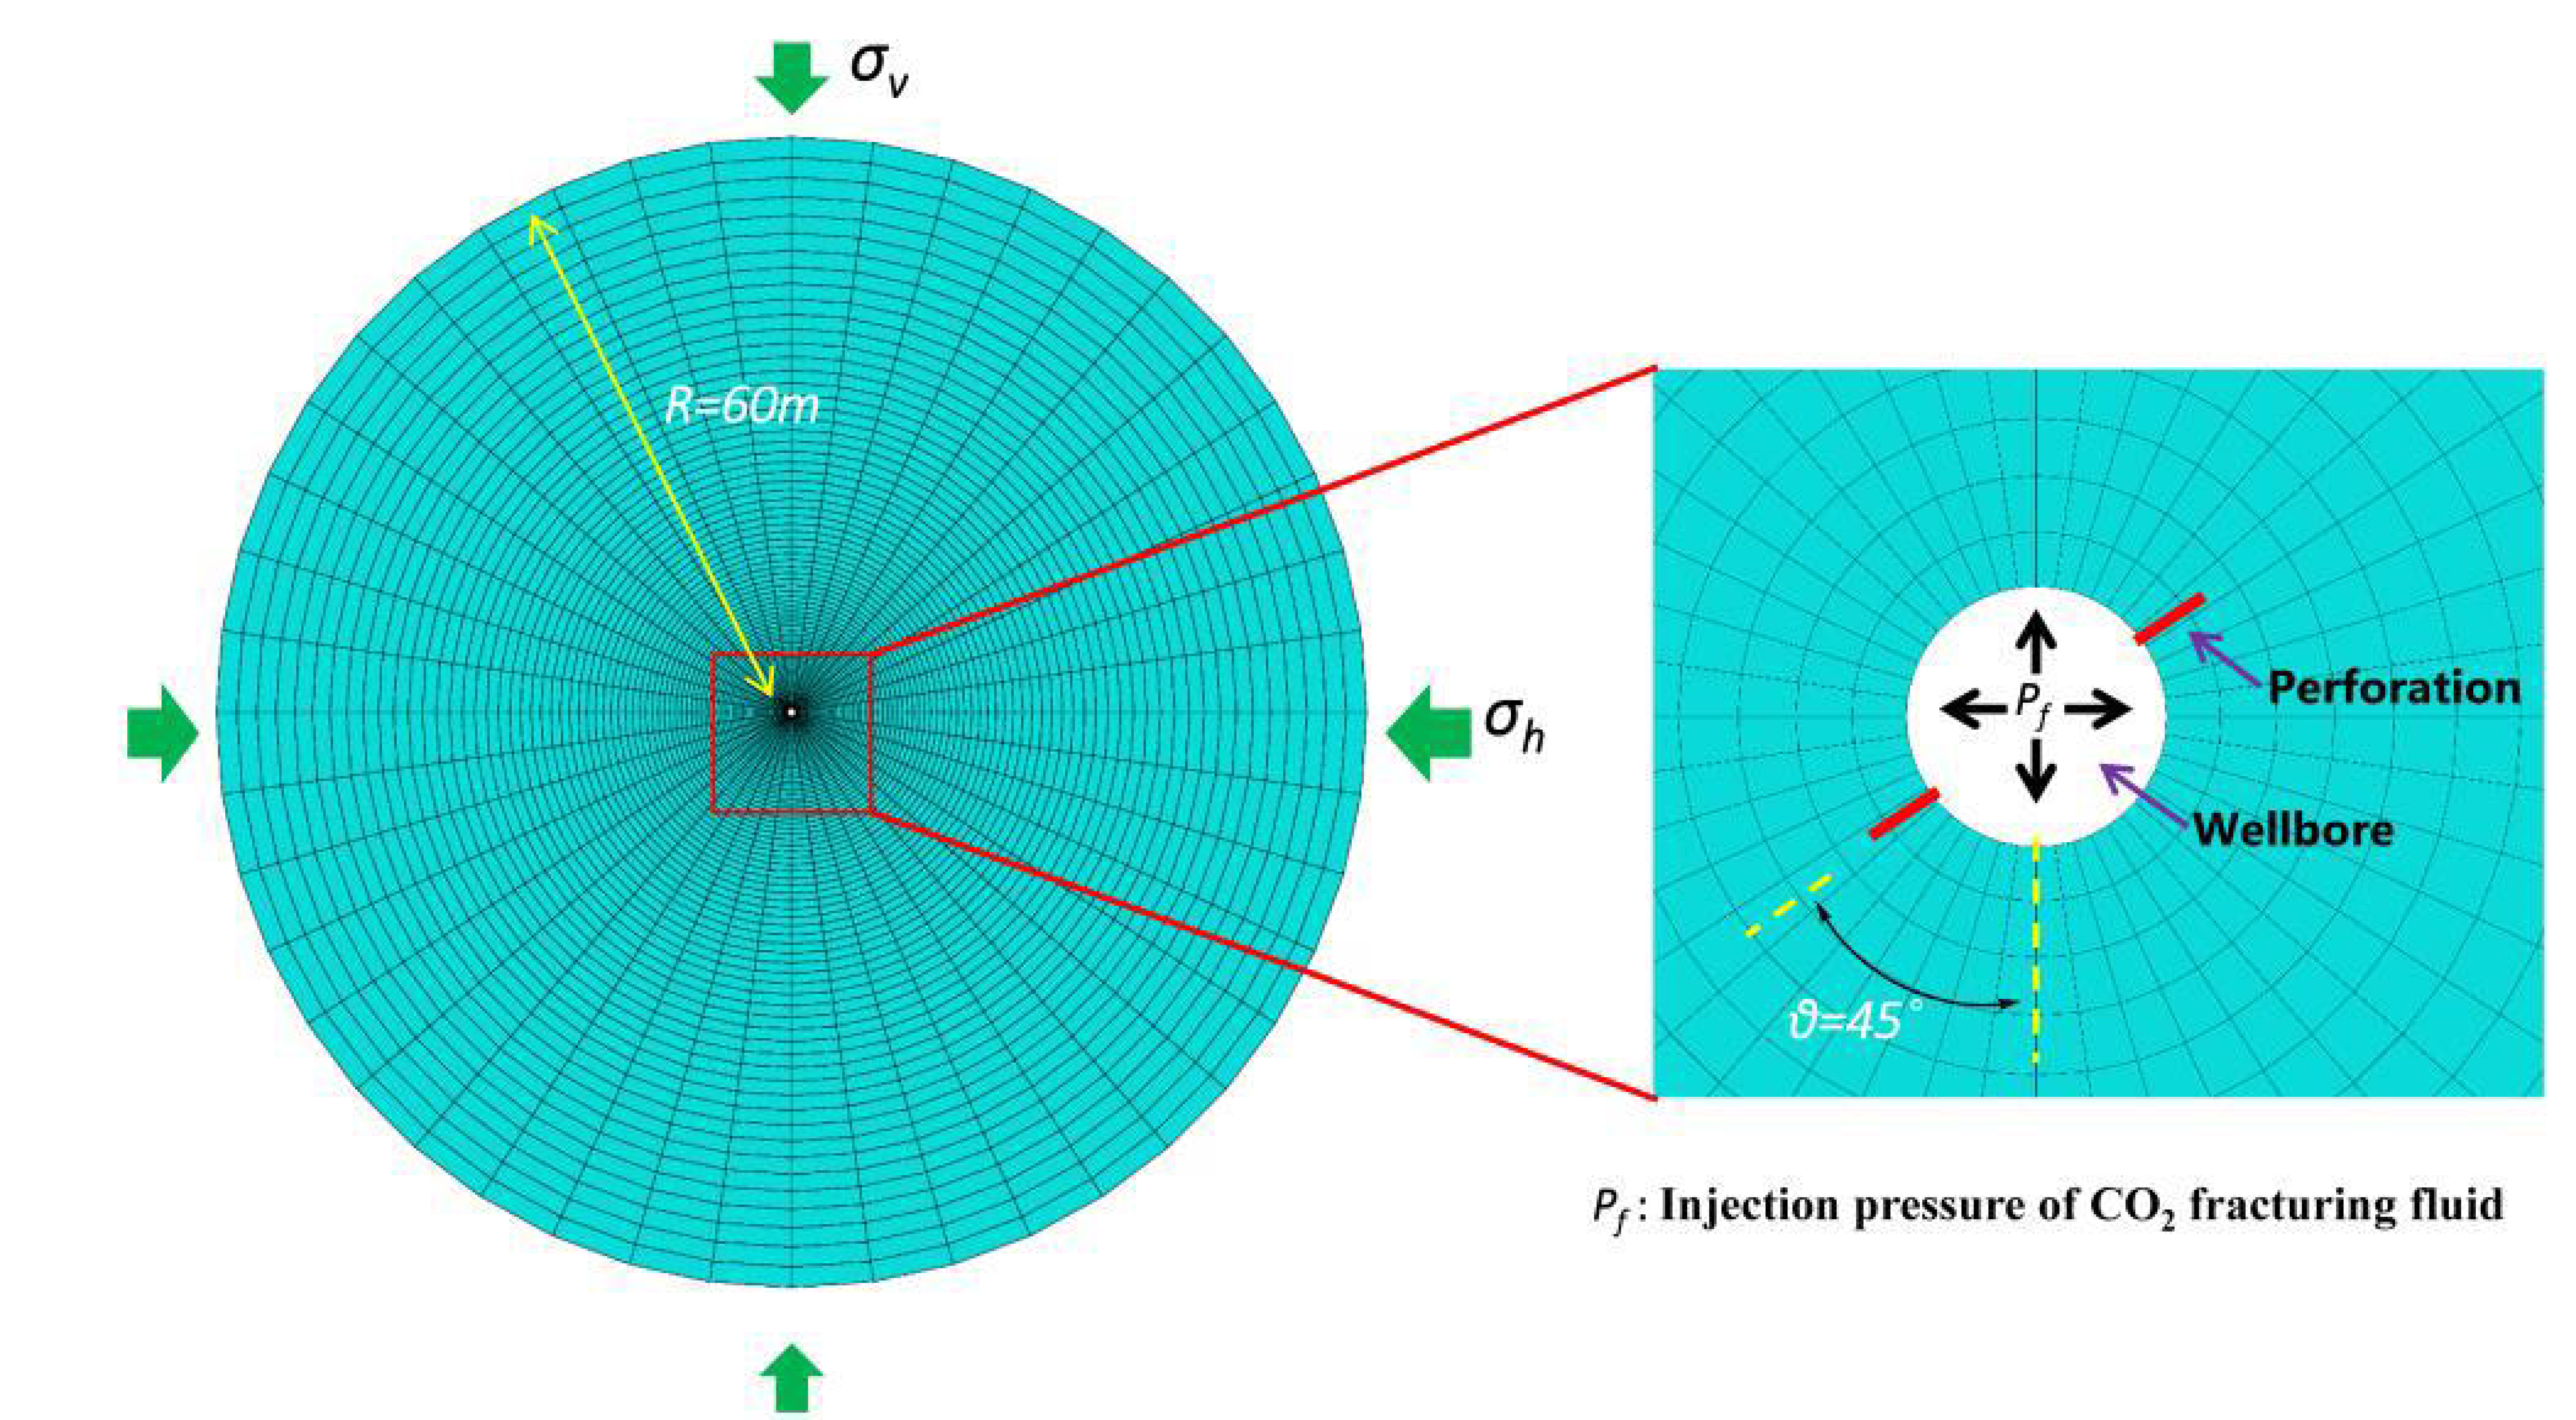
2.7. Numerical Modeling and CO2 Fracturing Simulation

Many attempts to simulate the fracturing process mostly focused on the hydraulic fracturing technology, but there also was a limitation in the study on the initiation and propagation of the CO2-induced fractures in fracturing operation. Given that, the extended finite element method (XFEM), developed from the finite element model (FEM), was used in simulating fractures change in CO2 fracturing process. This fracturing model established here assumed that CO2 fracturing operation was quasi-static and stable, and the shale reservoir was treated as the homogeneous isotropic linear elastic material. Meanwhile, physical parameters of shale reservoirs were not impacted with changing stresses during CO2 fracturing process. Furthermore, a CO2 fracturing model with a large enough size (60 m) was constructed where the boundary conditions were not affected by the CO2 fracturing process. For convenient comparison with the fracture effect difference between the pure CO2 and thickened CO2 fracturing fluid, the viscosity of the fracturing fluid was assumed to be stable consistently. In addition, the CO2 fracturing simulation with the directional fracturing technology applied in the shale reservoirs, was treated as a plane strain problem [31]. As shown in Figure 3, the 2D mesh model with 15,000 CPE4P elements we establish could be used to the CO2 fracturing simulation with the oriented perforation. To improve the model convergence and results accuracy [31,32], the mesh refinement was conducted, especially in the near-wellbore formation. Meanwhile, the established model did not only fix the normal displacement of the wellbore and the outer boundary of the model, but also defined an outer boundary with a fixed pressure which was equal to the initial pore pressure. The reservoir properties of the model we established and fracturing construction parameters, as an extremely important foundation of CO2 fracturing simulation, were presented in Table 1. The two sides of the wellbore established perforations along 45° and the perforation depth was 0.15 m. The ABAQUS software was used to simulate influences of the fracturing fluid viscosity and physical parameters of the shale reservoir on the width and length of oriented crack. It should be noted that the CO2 fracturing fluid was injected into the perforation edged the wellbore. The investigation also explored the filtration coefficient in the shale reservoir during CO2 fracturing, and a filtration coefficient below 1 × 10⁻¹⁴ m3·(s·Pa)−1 at the 0.05 of porosity and 4 × 10⁻¹⁷ K/m2 of permeability was shown, which showed that the effect of CO2 filtration on the fracturing property was negligible.

3. Results and Discussion

3.1. Structural Characterization of EEPDMS

The synthesis and post-modifications of polydimethylsiloxane, namely EEPDMS, was monitored by infrared spectroscopy (see Supplementary, Figure S1). It can be seen from the infrared spectroscopy that the sharp peak at 2972 and 2883 cm−1 correspond to the C–H stretching vibration, and the peak at 1740 cm−1 can be attributable to the C=O bending vibration [33]. The sharp peak observed 1416 cm−1 indicated the asymmetric vibration of Si–CH3. In addition, the narrow peak of 1170 cm−1 (obstructed by the Si–O–Si peak at 1021–1200 cm−1) and 1018 cm−1 indicated the stretching vibration of C–O–C group and the epoxy group, respectively. The absorption band occurring between 1090 ± 1020 cm−1 indicated the symmetrical stretching vibration of the Si–O–Si [18]. Meanwhile, the peak at 1264 cm−1, attributable to the symmetrical vibration of Si–CH3 and CH3, and the peak at 800 cm−1 confirmed the presence of the telescopic vibration of Si–C.
1H NMR was used to verify the chemical structure of EEPDMS (see Supplementary, Figure S2). 1H-NMR (400 MHz, CDCl3), δ (ppm), 0.11–0.28 (m, 516 H), 0.69 (m, 2 H), 1.19 (m, 6H), 1.89 (s, 2H), 3.86 (m, 2H), 4.34 (d, 2H), 3.17 (s, 2H), 2.54 (s, 2H), 2.79 (s, 2H), 7.39(s, CDCl3). The FTIR spectroscopy and 1H NMR spectroscopy demonstrated that EEPDMS is pure (100 wt.%), and there are no impurities.

3.2. Solubility and Phase Behavior of EEPDMS in Organic Solvents

Due to the lower solubility of siloxane in liquid CO2, the solubility and viscosity-increasing property of EEPDMS in organic solvents that considered as a cosolvent in liquid CO2, was a basis for further measurement of the solubility and thickening property of EEPDMS. EEPDMS was evaluated for viscosity and phase behavior in organic liquids at contents ranging from 1 to 4 wt.% and temperatures at the range of 283 to 323 K employing an ubbelohde viscometer and a UV-visible spectrophotometer respectively, and the results is shown in Table 2.
Moreover, Table 2 also listed the solubility of EEPDMS in organic solvents. The appearance of mixture composed of EEPDMS and each organic solvent was significantly varied, from transparent liquid to turbid solution. For the Toluene, Hexane, and Pentane, a clear and viscous liquid was always observed with increasing EEPDMS content and temperature. The exception of these above organic liquids which was classified as a fluid with strong polarities were measured to be insoluble with EEPDMS.
Toluene or Hexane with a low content EEPDMS illustrated a medium viscosity at a low temperature. Meanwhile, the decreased viscosity gradually with an increase in temperature between 283 and 323 K, attributable to a decreased intermolecular interaction and the larger intermolecular distance microscopically [34], showed the decrease in solubility and viscosity of EEPDMS at the high temperature. However, for the Pentane with 1 wt.% EEPDMS, a medium viscosity was shown at low temperature, but the temperature range of the medium viscosity is shorter than that of Toluene and hexane. Changing the EEPDMS content to 4 wt.% obviously increased the viscosity of the Pentane, as displayed in Table 2. The drastic difference in the measured viscosity of Pentane containing different EEPDMS contents was likely due to the increased intermolecular interaction when EEPDMS molecules were raised per unit volume. In comparison to Toluene and hexane, Pentane still showed a poor thickening organic solvent and miscibility, and it will not be considered as a solvent of EEPDMS in CO2. By contrast, a turbid state was shown when alcohol solvents were used as a solvent and EEPDMS could not dissolve in an alcohol solution. This is mainly because there was a large difference in the solubility parameter between siloxane and these alcohol solvents [35,36,37].
Given that, Toluene and Hexane could be used as a solvent to dissolve EEPDMS while other organic liquids would be excluded due to their poor solubility and miscibility. However, it is a big obstacle for the hexane due to the large used amount in previous study [10]. By contrast, a relatively excellent thickening performance was illustrated by a small amount of Toluene as a solvent [14,38]. Thus, after, Toluene could be used as a solvent to measure the thickening property of EEPDMS.

3.3. Solubility and Phase Behavior of EEPDMS in Liquid CO2

In this paper, a visual method was employed and a windowed high-pressure cell with a variable volume used to observe the solubility and phase behavior of EEPDMS in Toluene/CO2 mixtures [30]. The detailed operating procedure, conducted at this high-pressure cell shown in Figure 2, was explained in our previous articles [18], and would not be described in detail. The results of phase behavior showed that the cloud point pressure was below 8 MPa with increasing temperatures in the range from 293 to 333 K and contents in the range of 1 to 3 wt.%. The fact that EEPDMS possessed a lower dissolved pressure in CO2 than that in other articles [10,14,19] suggested that EEPDMS was soluble in CO2 as easily as desired.

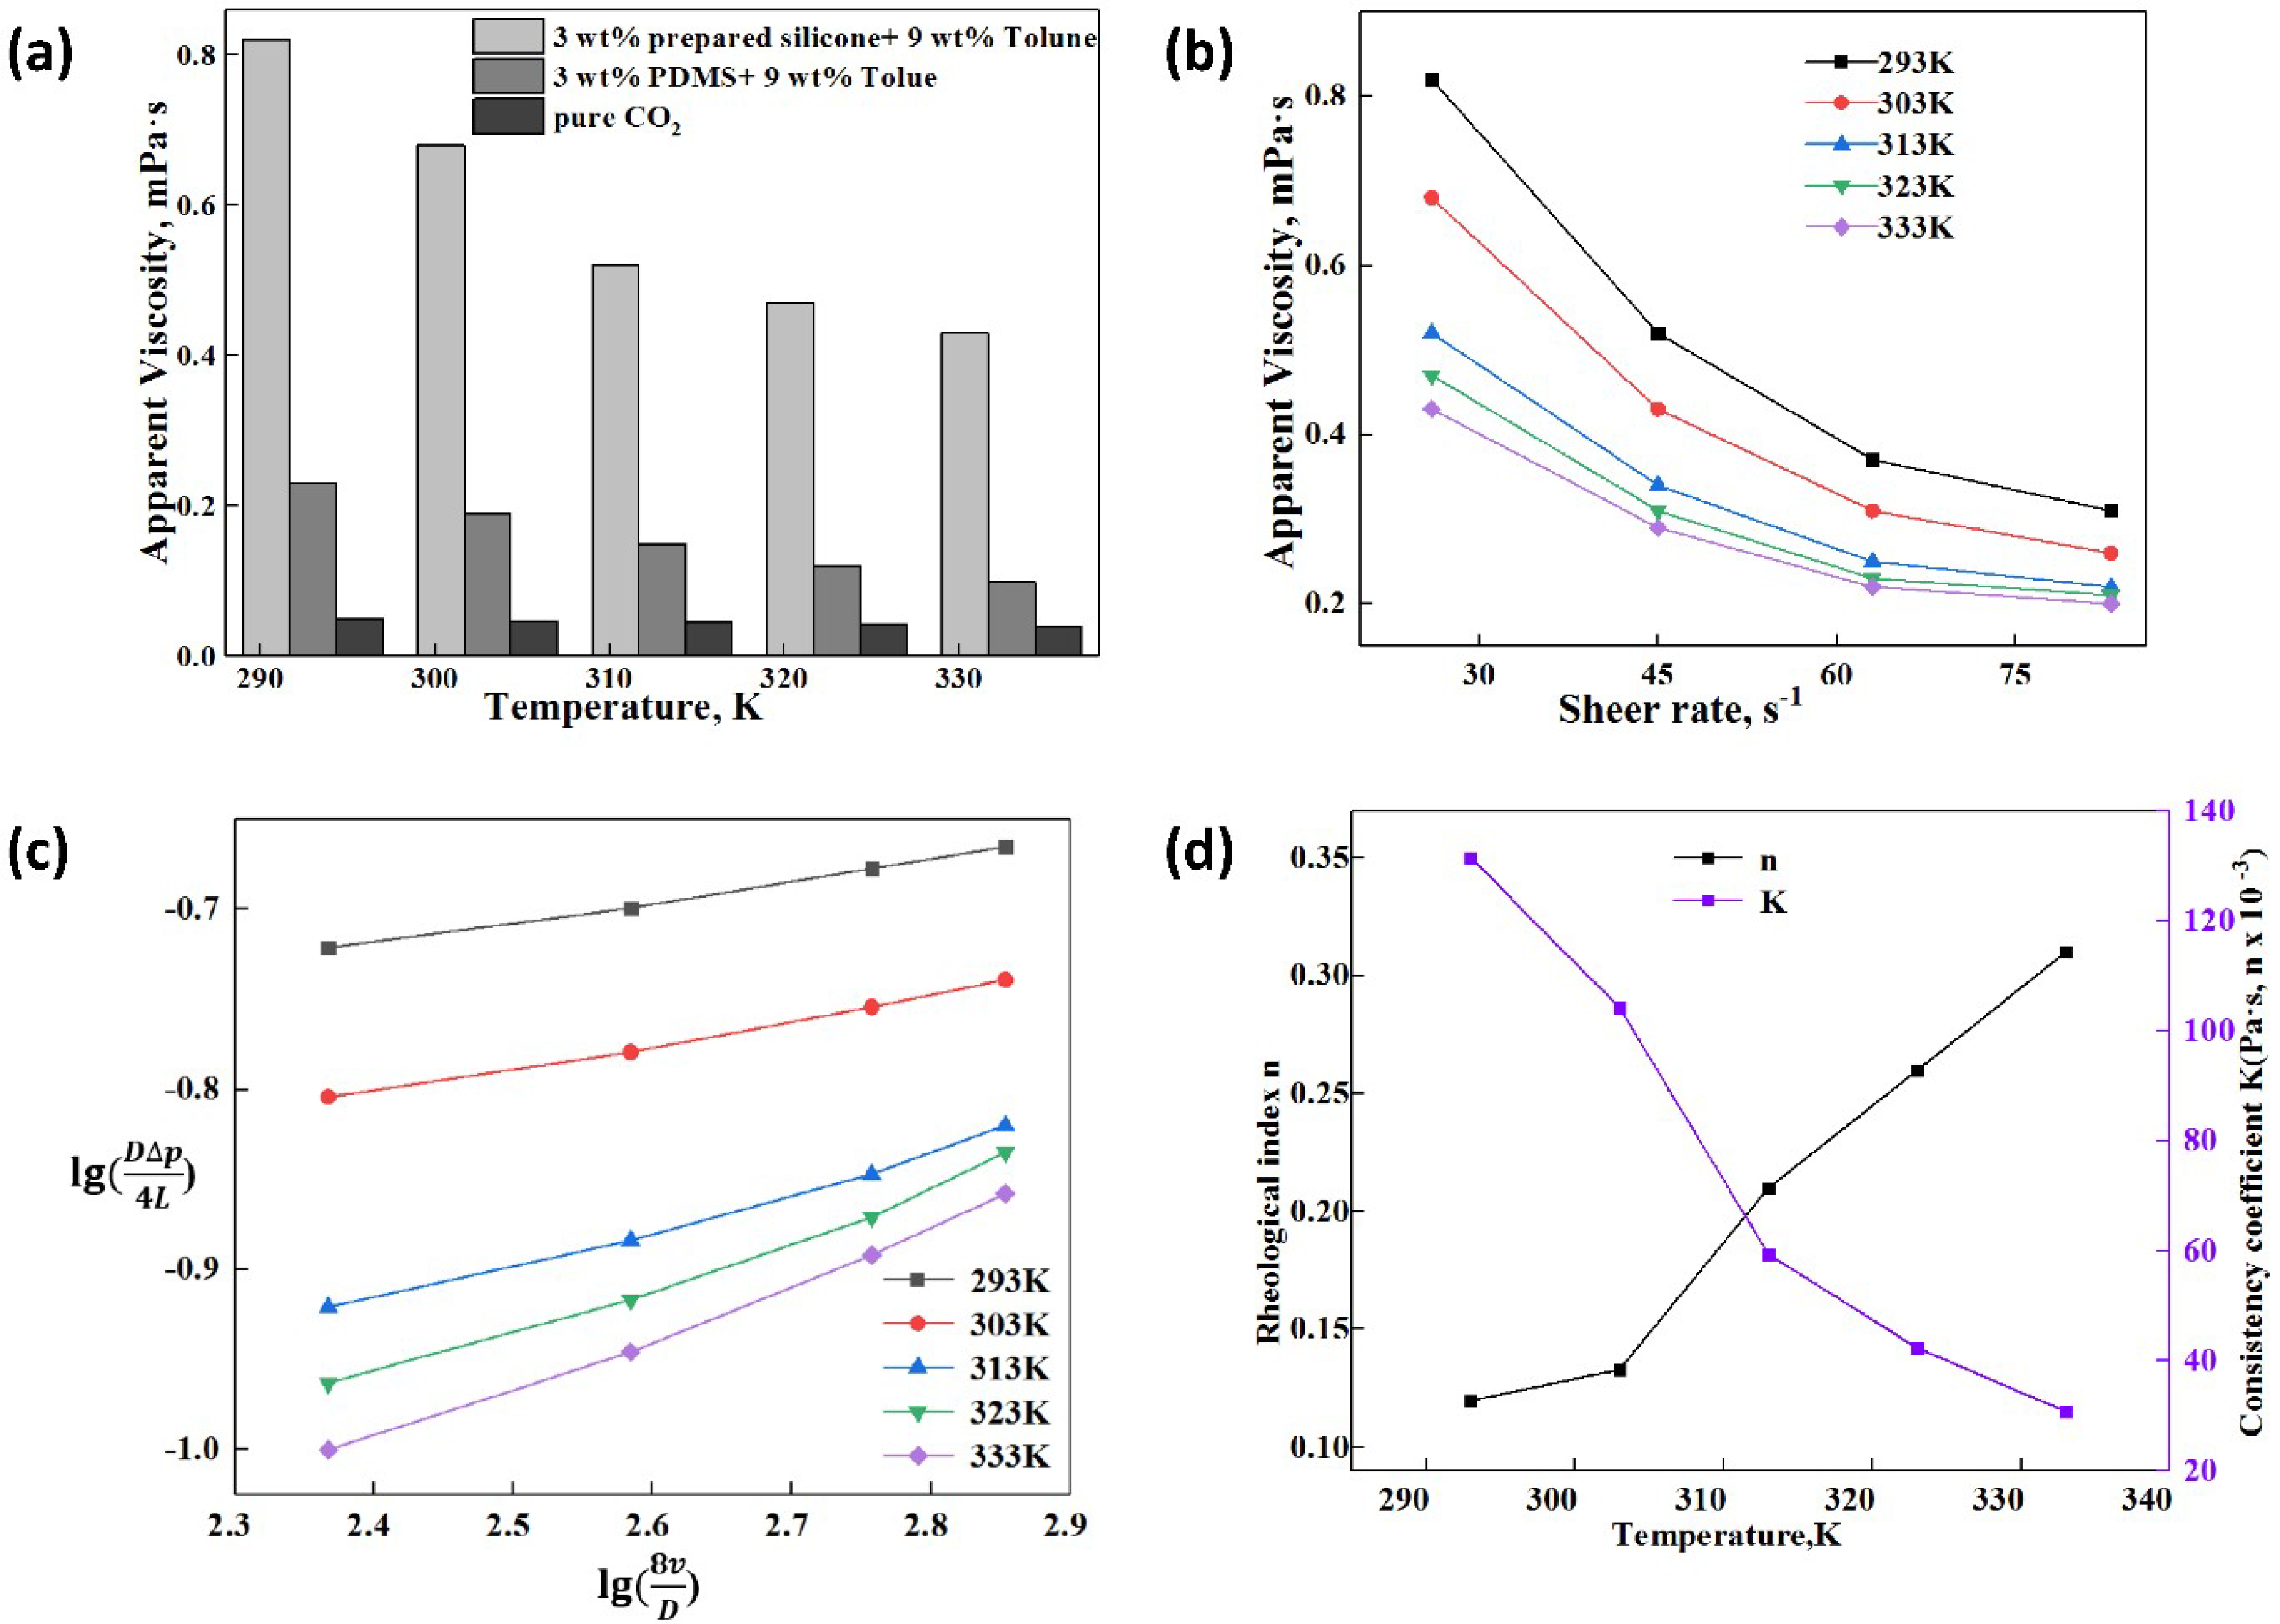
3.4. Apparent Viscosity and Rheology of the Thickened Liquid CO2

3.4.1. Effect of Temperature on the Apparent Viscosity and Rheology

The apparent viscosity and rheology of thickened liquid CO2 were influenced by many factors such as temperature, pressure, EEPDMS content (wt.%) and the shear rate. Figure 4 indicated the effect of temperature on the apparent viscosity and rheology of the thickened liquid CO2, and the pressure was identified as 8 MPa at 3 wt.% EEPDMS. In addition, this investigation showed the comparison of thickening performance between EEPDMS and polydimethylsiloxane (PDMS). In the first place, measurements carried out with EEPDMS resulted in the apparent viscosity of thickened CO2 three to four times higher that of PDMS. In comparison with PDMS, the CO2 viscosity increased evidently after adding EEPDMS into CO2, indicating that EEPDMS was provided with an excellent thickening performance than that of PDMS as desired. The results showed that the apparent viscosity of thickened CO2 decreased progressively with increasing the temperature. In comparison to previous research, there was a same trend between the apparent viscosity and temperature [9,10,14]. It was attributed to the effect of temperature on the space mesh structure of thickened CO2 [9]. A space mesh structure formed based on the C–H···O bond [2,39,40,41] existed between CO2 and Toluene and the interaction between Toluene and siloxane [2]. The apparent viscosity of thickened CO2 was closely related to the density of these space mesh structures, the bond length between molecules and winding intensity of space mesh. As temperature increases, these above bonds formed between molecules gradually break, this formed mesh structure is destroyed gradually owing to the increasing molecular activity. Meanwhile, the Arrhenius equation could correctly explain the influence of temperature on the apparent viscosity of thickened CO2 as shown in Equation (2) [40,42].
μ = A v exp ( E f R g T )
where μ is the fluid viscosity, Av is the pre-exponential factor, Ef is the activation energy, Rg is the molar gas constant. The temperature (T) was limited to a small range of 293 to 323 K. The migration activity of every molecule improved with the increase in the system temperature. The gradual broken space mesh structure caused decrease in the activation energy of system and flow resistance. The thickened CO2 illustrated a reduction in liquid viscosity [9,39,40]. It should be noted that the shear rate is between 0 and 100 s−1 mainly because the viscosity hardly changes when the shear rate is greater than 100 s−1, namely, the viscosity at a high shear rate bigger than 100 s−1 is stable.
Meanwhile, it could be seen from Figure 4c,d that the rheological index ‘n’ increased with the increase in the system temperature, which resulted from the apparent viscosity reduction. However, a decreasing trend contributed to the consistency coefficient K when the system temperature rose. The bigger the system temperature was, the stronger the non-Newtonian property became.

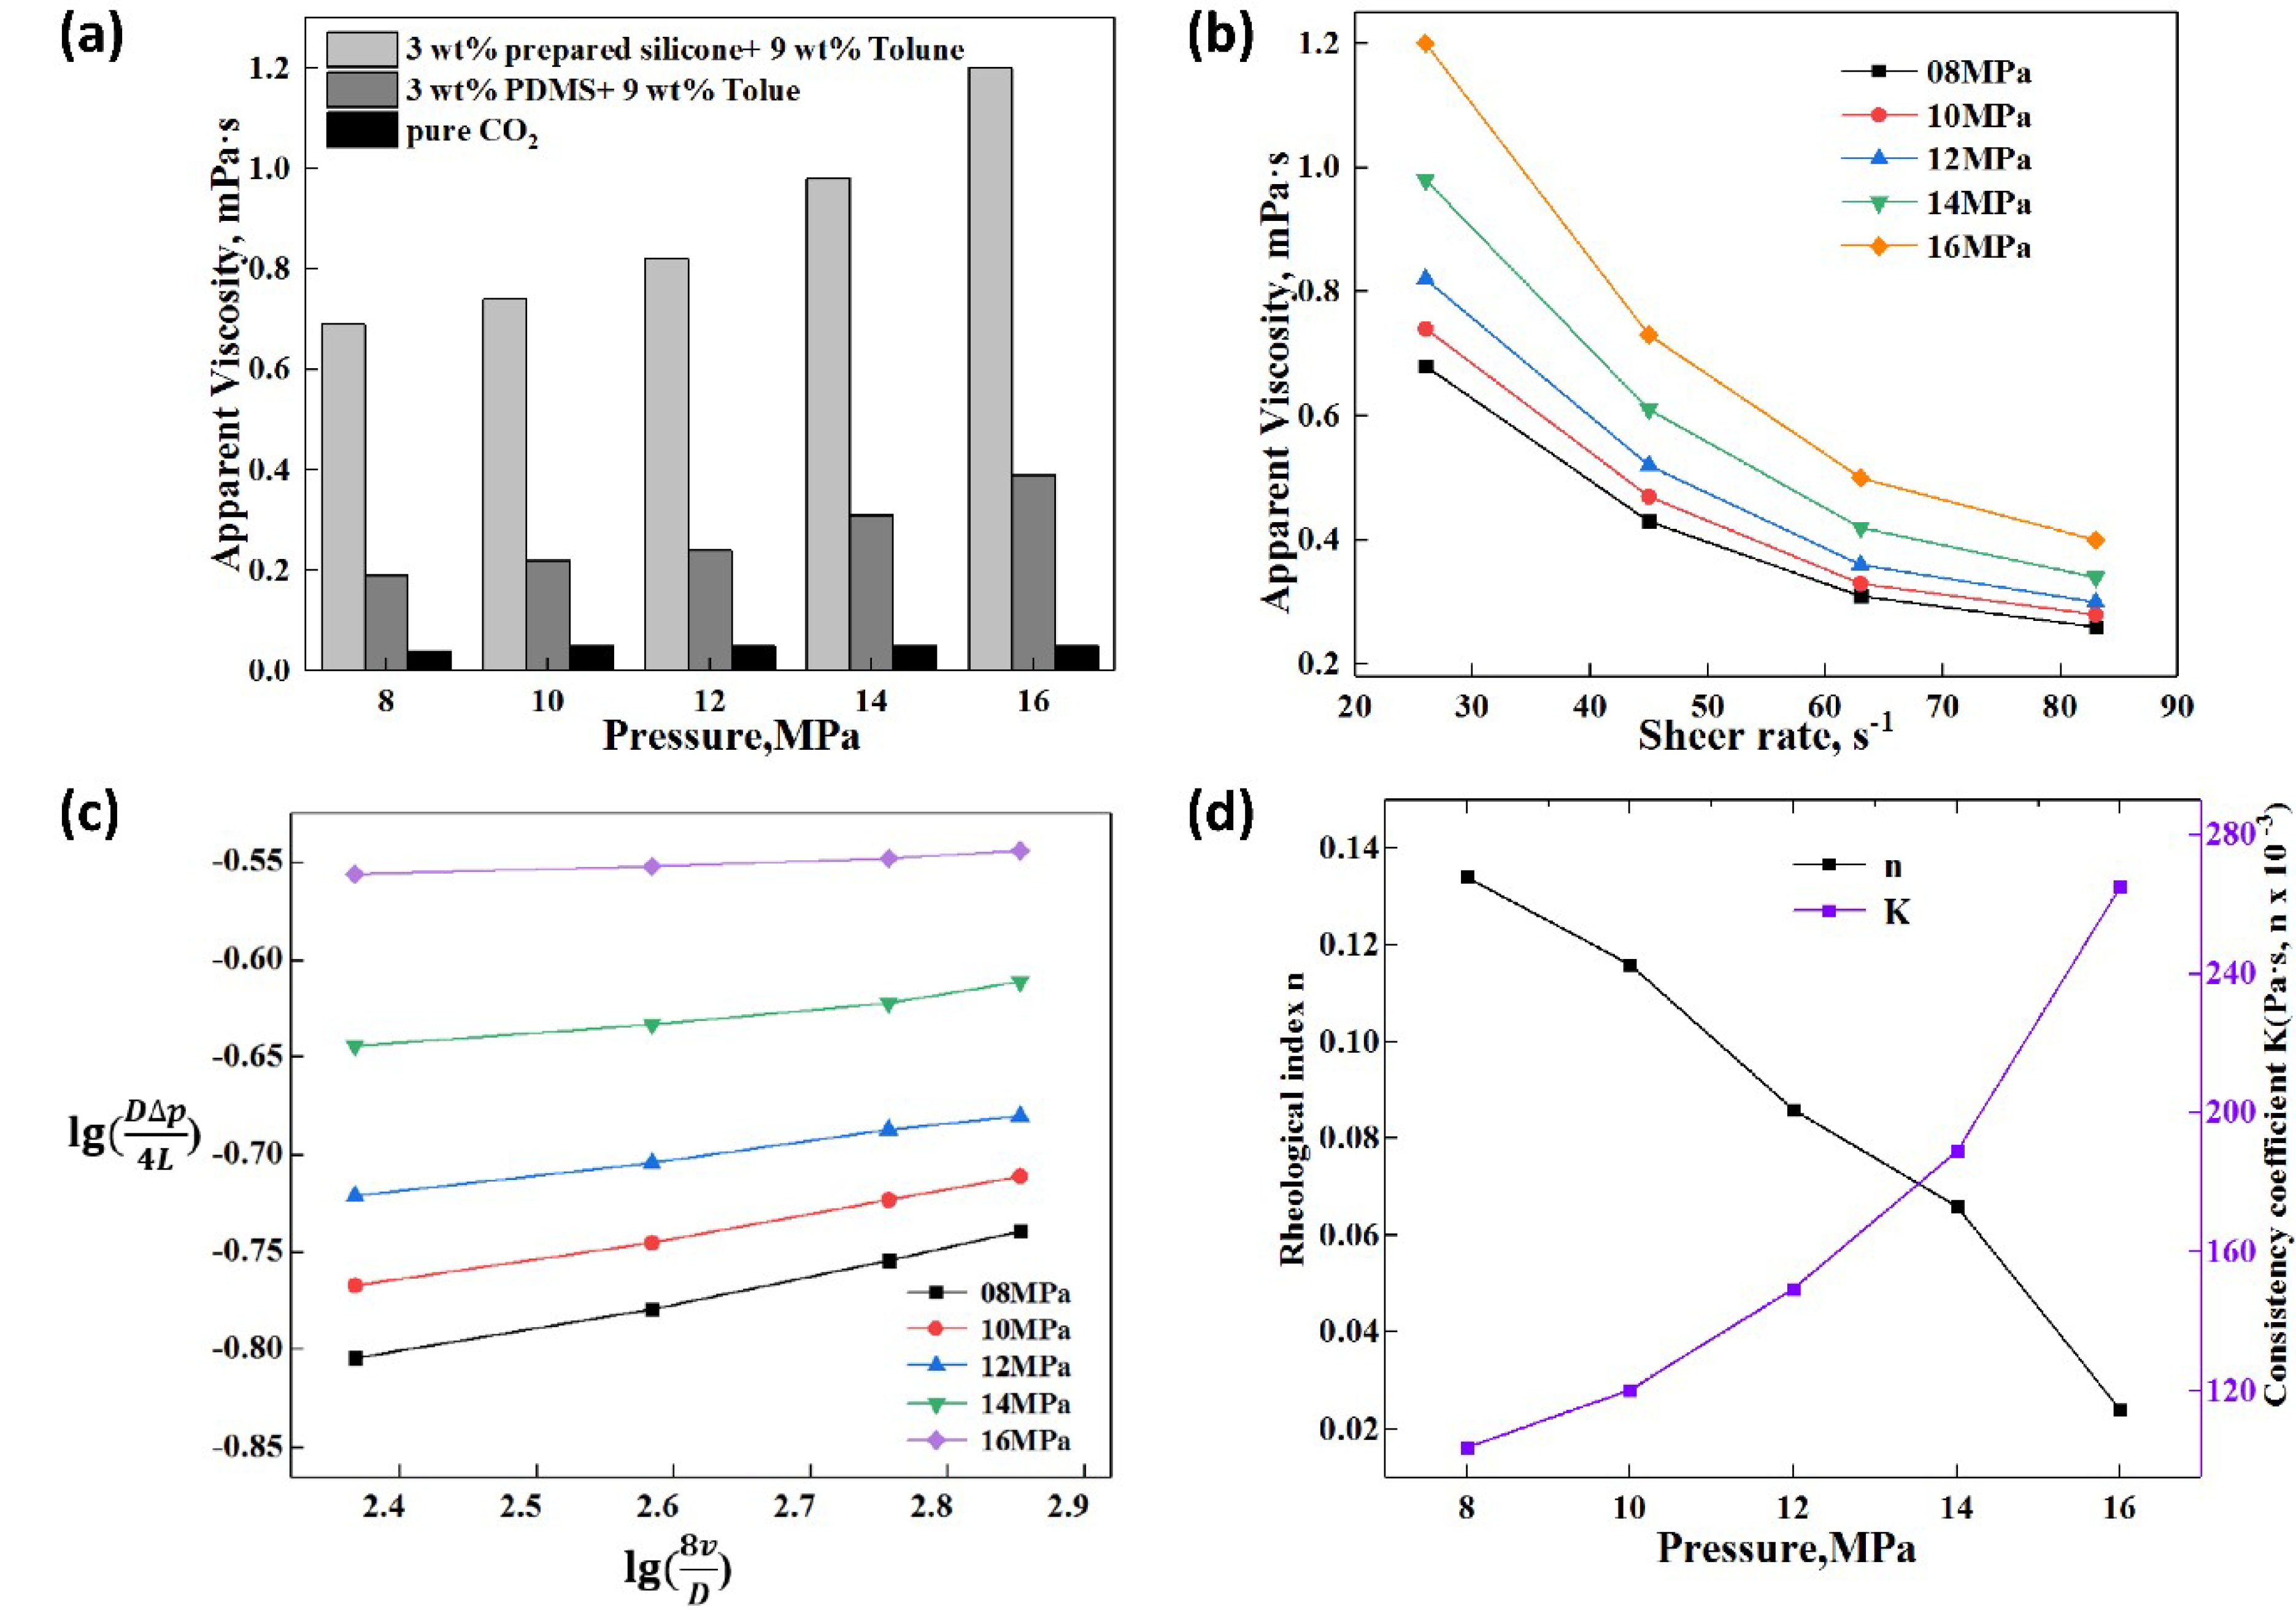
3.4.2. Effect of Pressure on the Apparent Viscosity and Rheology

It could be seen from Figure 5 that the relationship between the apparent viscosity of CO2, rheology and pressure was shown at the temperature of 303 K and 3 wt.% EEPDMS. An increase CO2 viscosity was seen with an increase in the pressure from 8 to 16 MPa, which was similar to previous research conclusions [9,10,14,19]. In comparison with EEPDMS, PDMS illustrated a poor thickening capability, which resulted from the influence of pressure on the mesh structure and the molecular spacing. The molecular spacing was shortened with increasing the pressure, and more compact mesh structures were formed at a higher pressure. The porosity of the microscopic mesh structure was significantly reduced to form a large flow resistance [9], which resulted in a slow increase in viscosity. Moreover, as the system pressure rose, these electron-donating groups such as epoxy ether group showed an enhanced solubility and interaction with CO2 [16,17], which contributed to the improvement in viscosity.
The effect of pressure on the apparent rheology of the liquid CO2 was displayed in Figure 5c,d. The consistency coefficient K built up over the increase in the pressure but the rheological index n rapidly reduced. When the pressure rose, the spatial distance between molecules was progressively shortened. The interaction among molecules was intensified [9]. The above reasons resulted in a denser mesh structure to improve the viscosity and rheology. In addition, Non-Newtonian property of this thickened liquid CO2 enhanced when the pressure rose. The effect of the pressure on the rheology of this thickened liquid CO2 will be lesser than that of the temperature depending on the rheological index n and consistency coefficient K in the Figure 4d and Figure 5d.

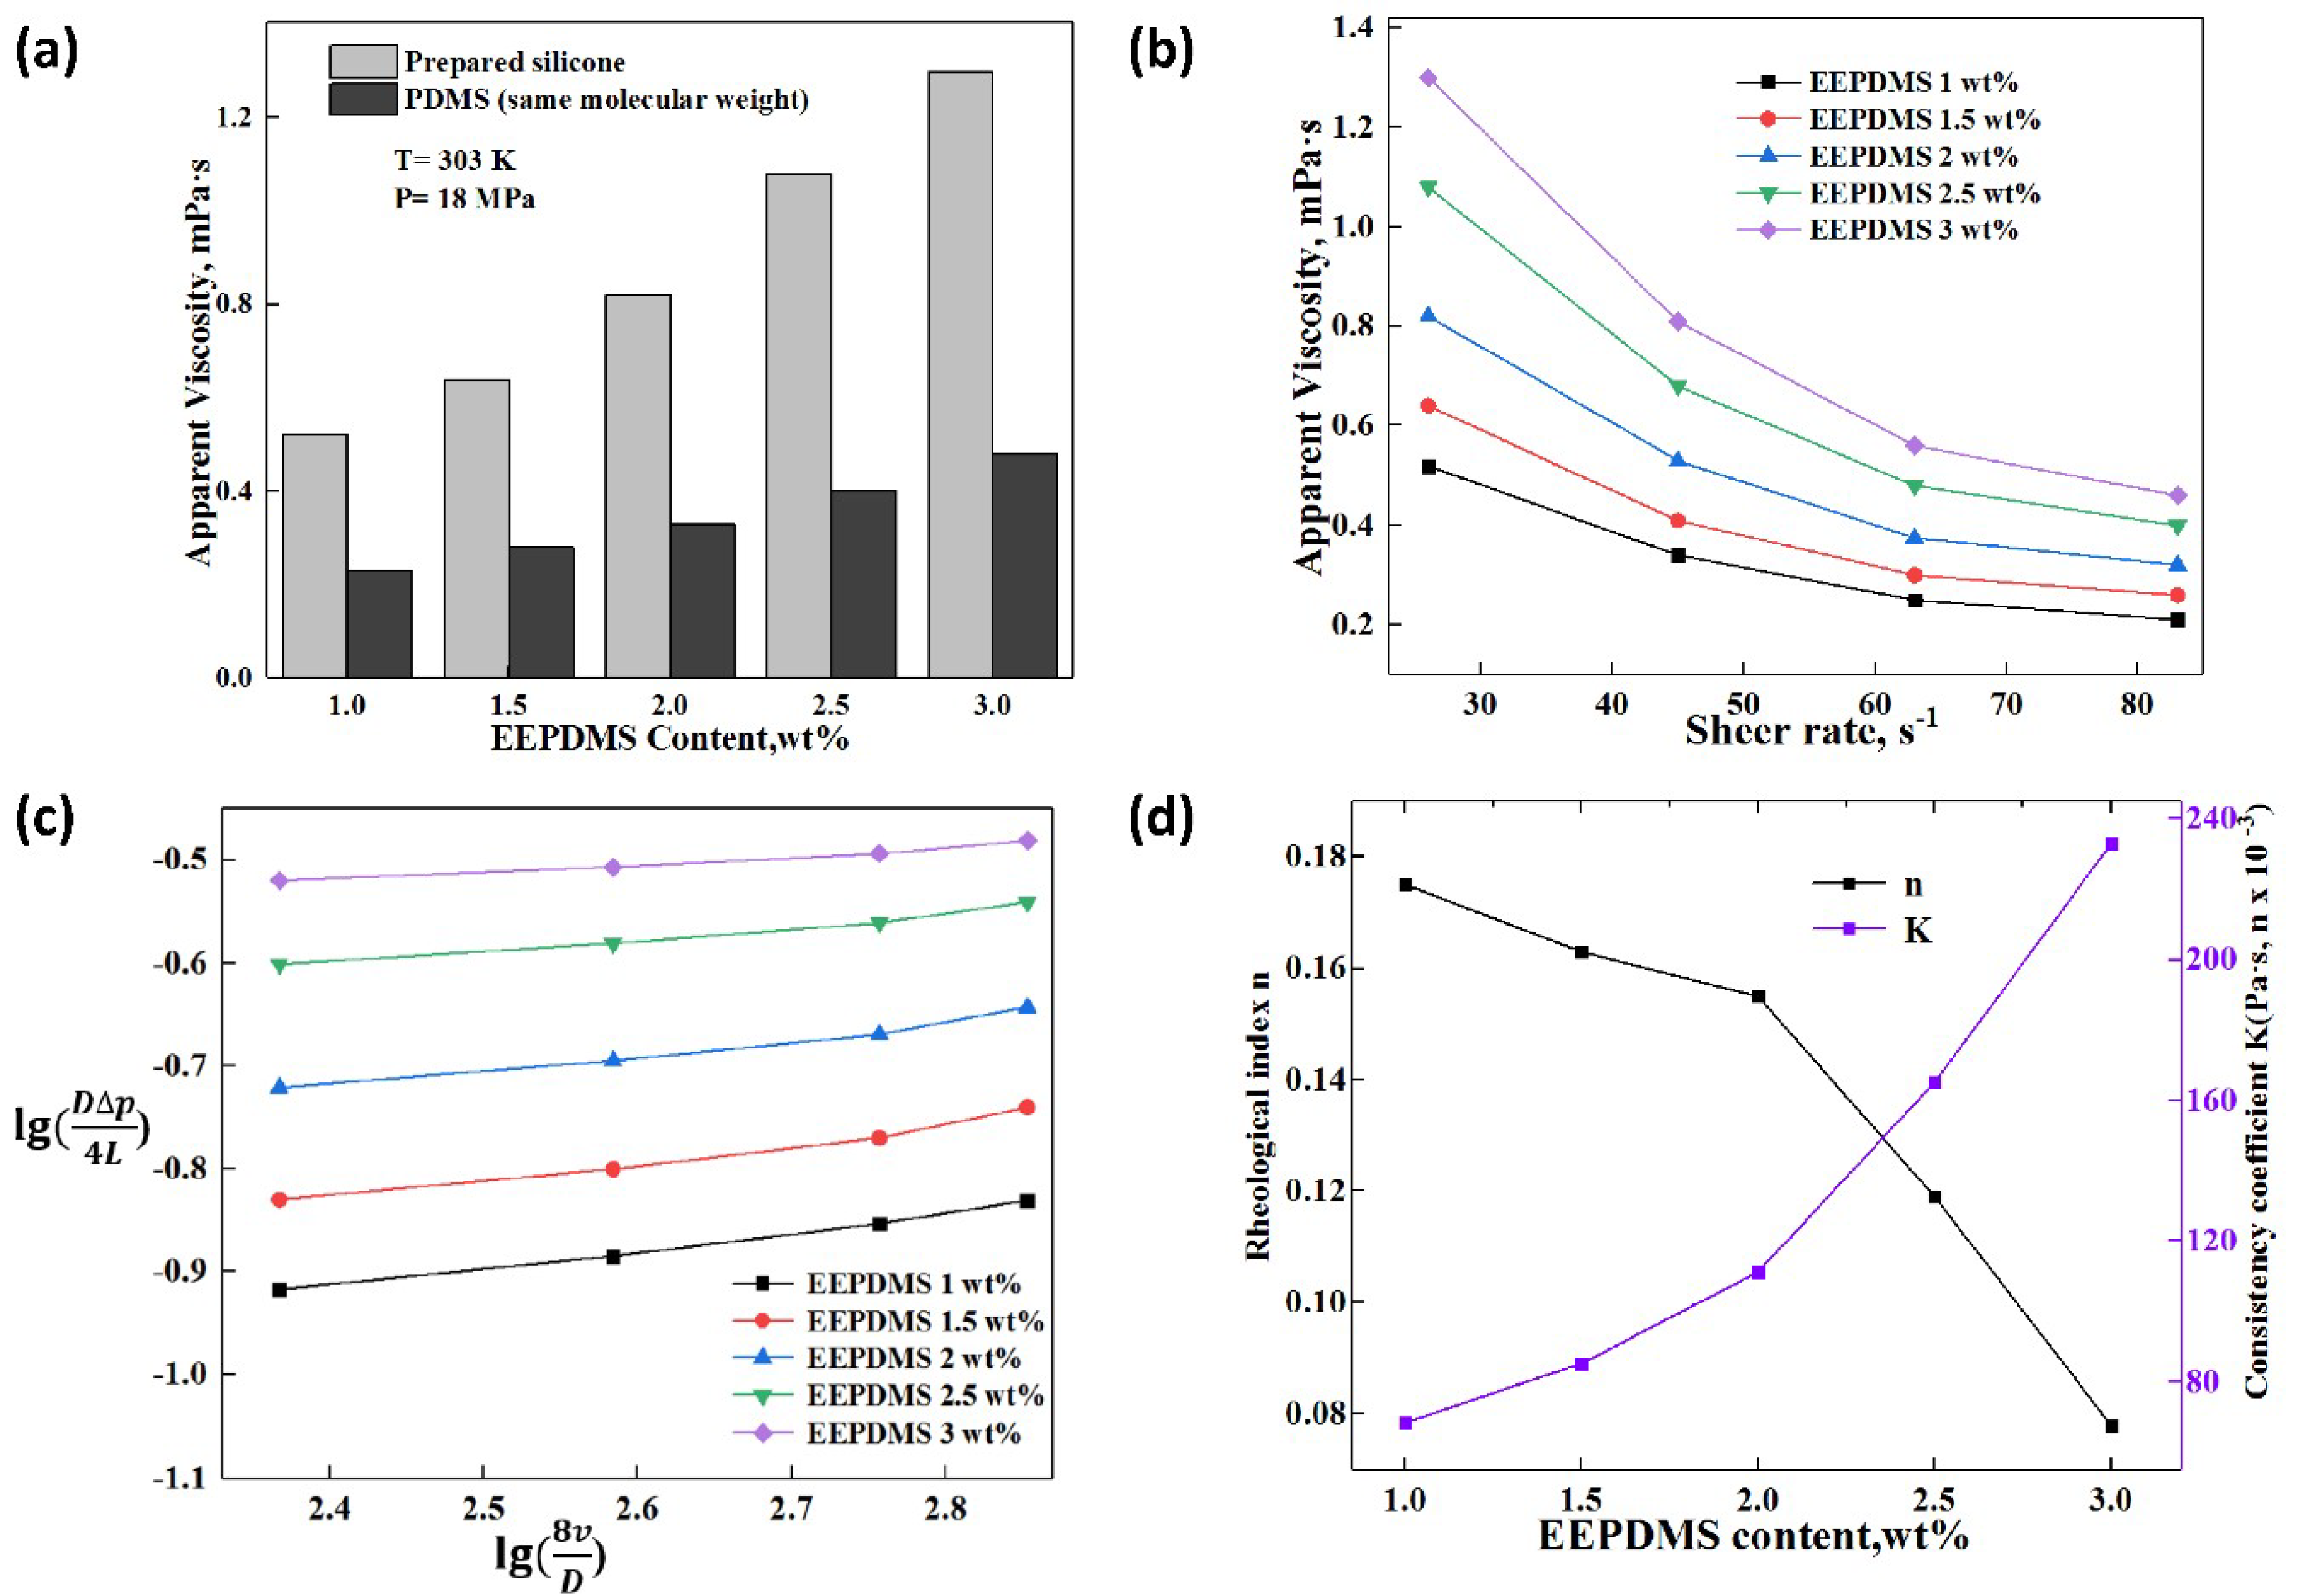
3.4.3. Effect of Thickener Content on the Apparent Viscosity and Rheology

This apparent viscosity indicated in Figure 6a and Figure 7b were tested at 303 K and 18 MPa, which could form a single-phase fluid. In addition to the thickening data of EEPDMS, Figure 6a also displays the apparent viscosity data for the pure CO2 and the thickened CO2 with the use of PDMS. The thickening performance as displayed in Figure 6a indicated differences between EEPDMS and PDMS. The CO2 viscosity became smaller for the PDMS compared with that of EEPDMS. This is attributed to the epoxy group and carbonyl group inside ester group which does not only assist EEPDMS to enhance the interaction between the thickener and CO2, but also improve the solubility and miscibility of EEPDMS in CO2 [16,17]. Meanwhile, EEPDMS content was significantly increased during the measurement, which caused further increase in the apparent viscosity. More compact mesh structure formed due to the increase of EEPDMS in CO2, which showed more chemical bonds among CO2, EEPDMS, and Toluene. Much force is required to break the mesh structure [9,40]. In this scenario, the apparent viscosity becomes greater with an increase in the EEPDMS content.
The slope of each line in Figure 6c presents the rheological index n under certain conditions [9,40]. As you can see by Figure 6c,d, the rheological index n decreased with increasing the EEPDMS content. However, the consistency coefficient presented a rising trend. The rheological index n under different EEPDMS content, reduced from 0.175 to 0.078, demonstrating that the non-Newtonian characteristic of the thickened liquid CO2 became greater as the thickener content increased [43].

3.4.4. Effect of Shear Rate on the Apparent Viscosity and Rheology

Figure 4a and Figure 5a demonstrated that the apparent viscosity of pure CO2 did not change until EEPDMS or PDMS was added into it, which indicated that pure CO2 was a Newtonian fluid. By contrast, the thickened liquid CO2 with EEPDMS or PDMS showed a decreased curve with increasing the shear rate (see Figure 4b, Figure 5b and Figure 6b), which indicated that the thickened CO2 fracturing fluid was a power law fluid with the shear thinning property [9,14,39,40]. The effect of shear rate on the pure CO2 viscosity can be practically negligible and this can be attributed to the similarity in the properties between CO2 and Newtonian fluid [9]. Shear thinning property of thickened CO2 can be attributed to the space mesh structure destruction relating to gradually increased shearing force with increasing the shear rate.
There were many novelties of EEPDMS shown in this paper. The low dissolved pressure could allow EEPDMS to be used in reservoirs with a low pressure. Moreover, EEPDMS showed an excellent thickening performance. Doherty [10] also prepared the thickener with an excellent thickening performance but the huge measurement pressure and cosolvent amount (>40 wt.%) was a huge challenge that hindered the application of silicone polymer as a thickener in the CO2 fracturing.

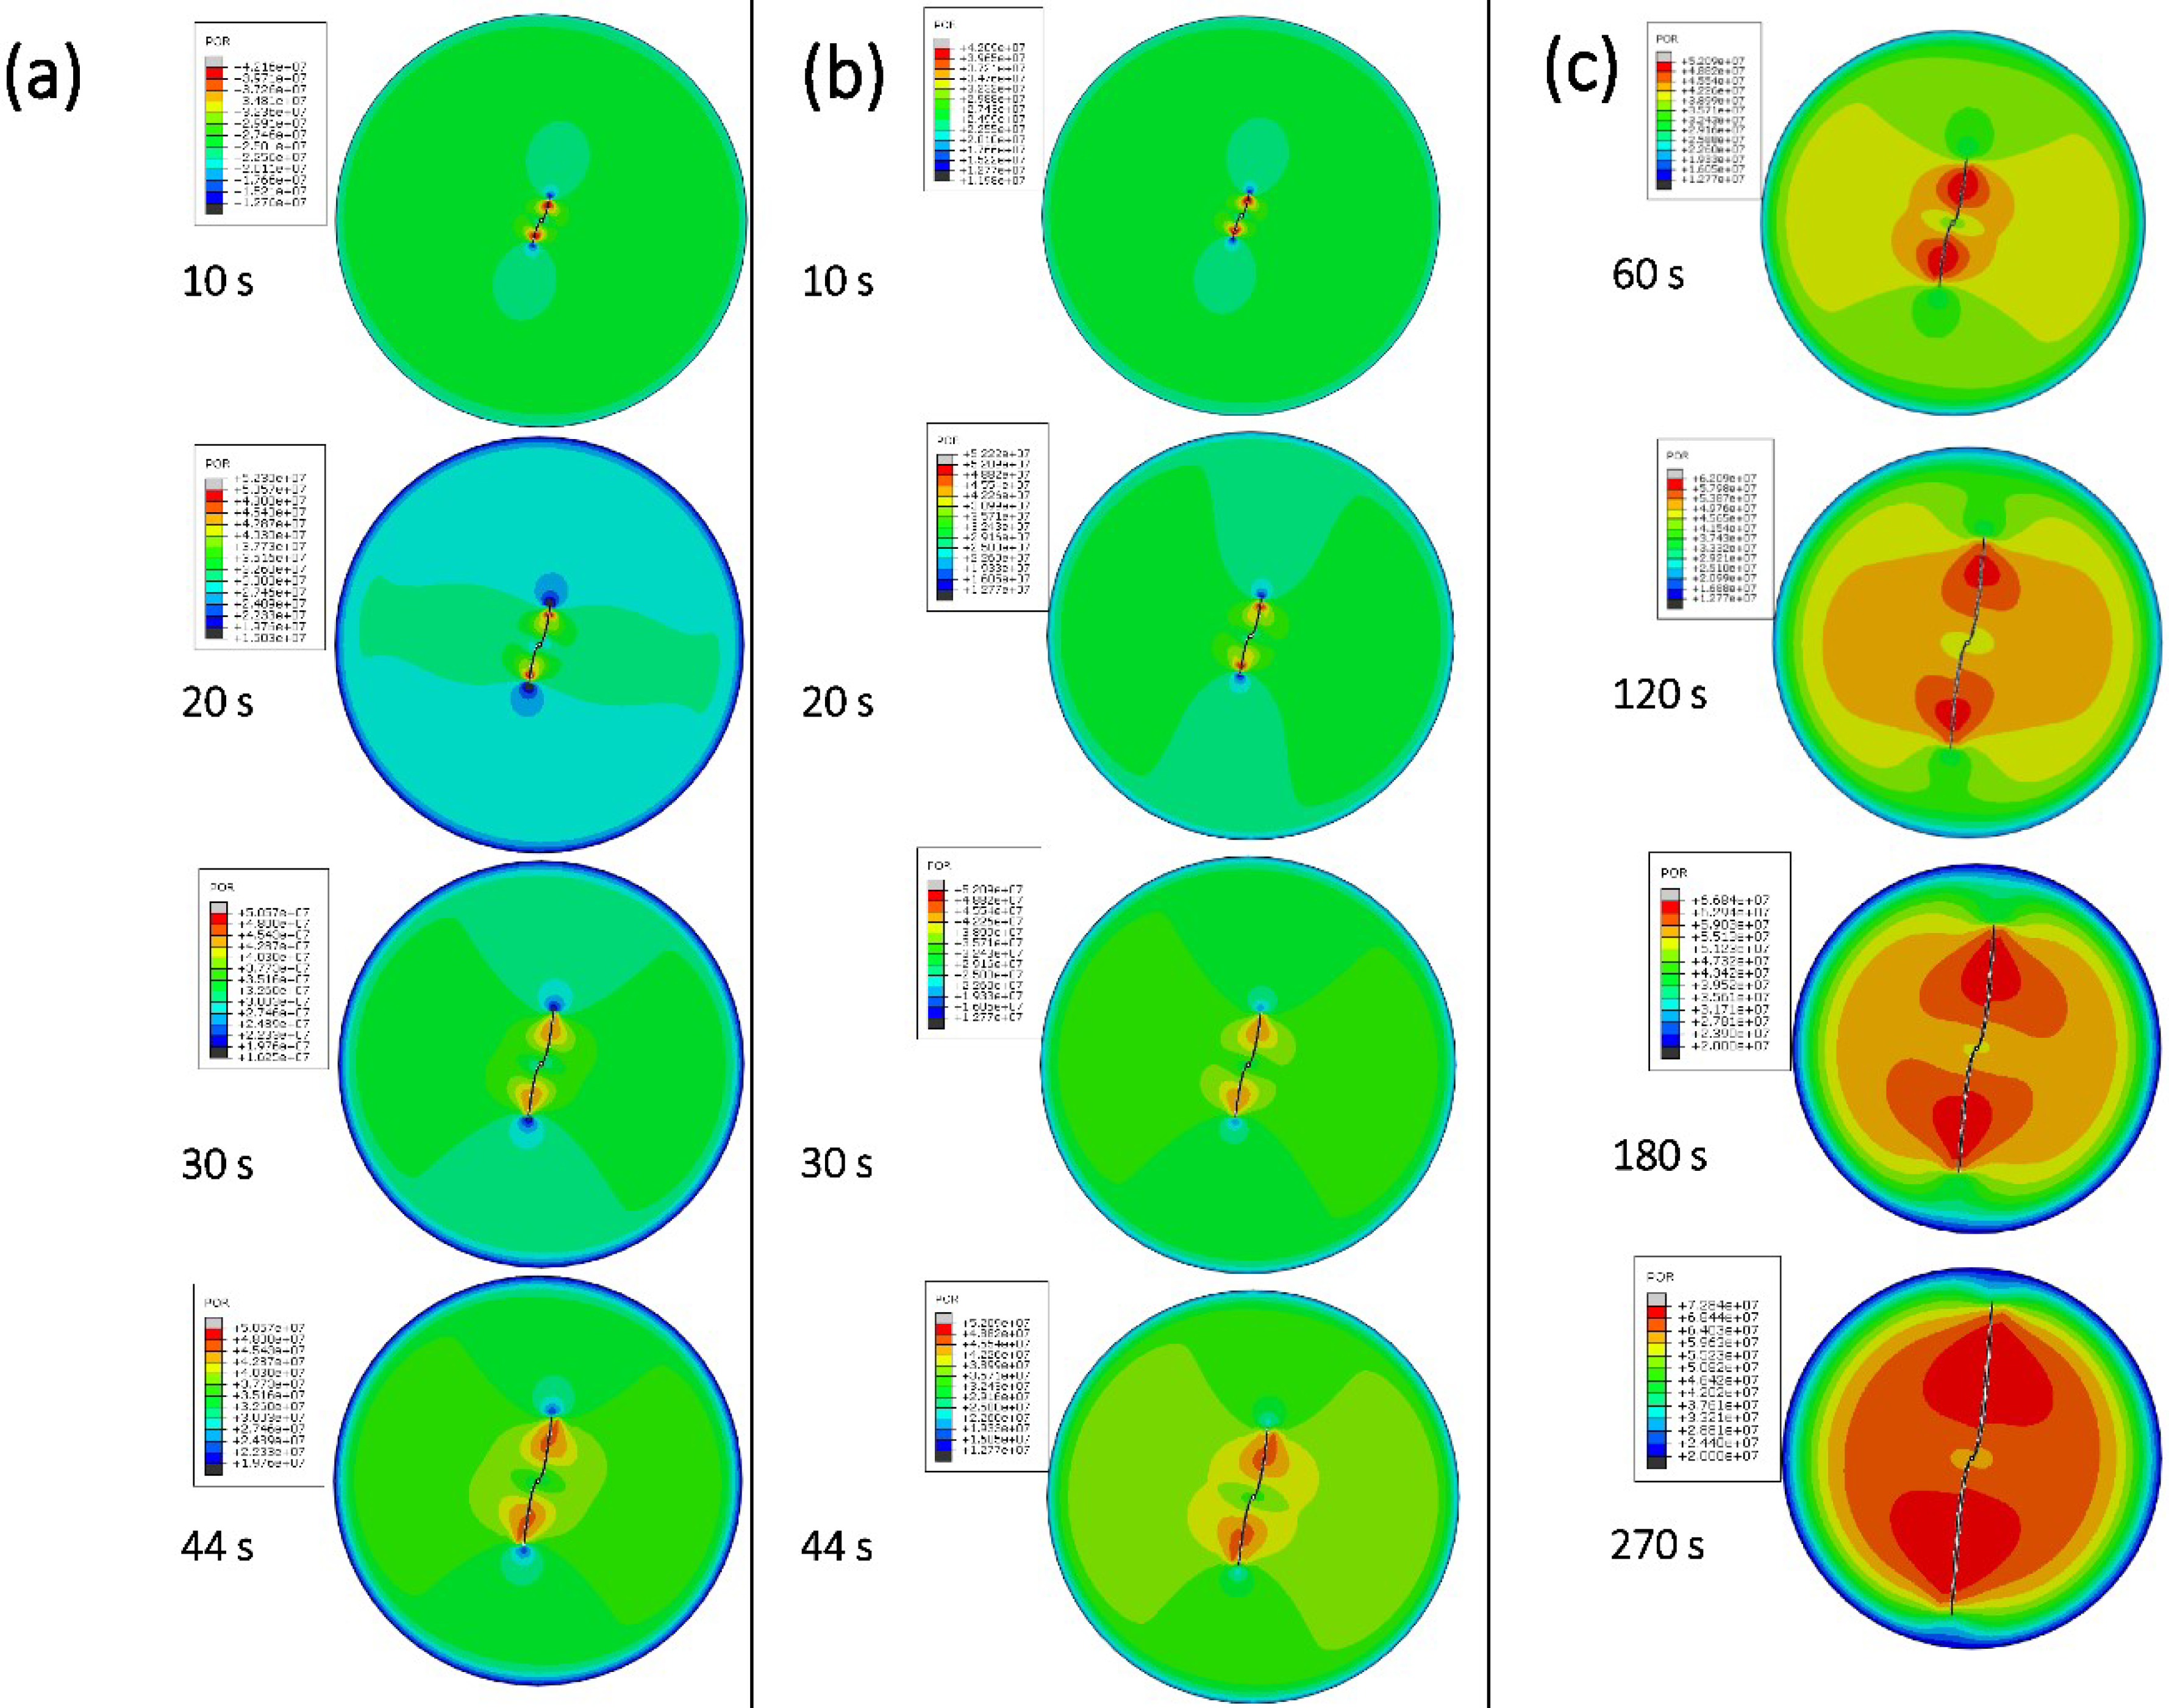
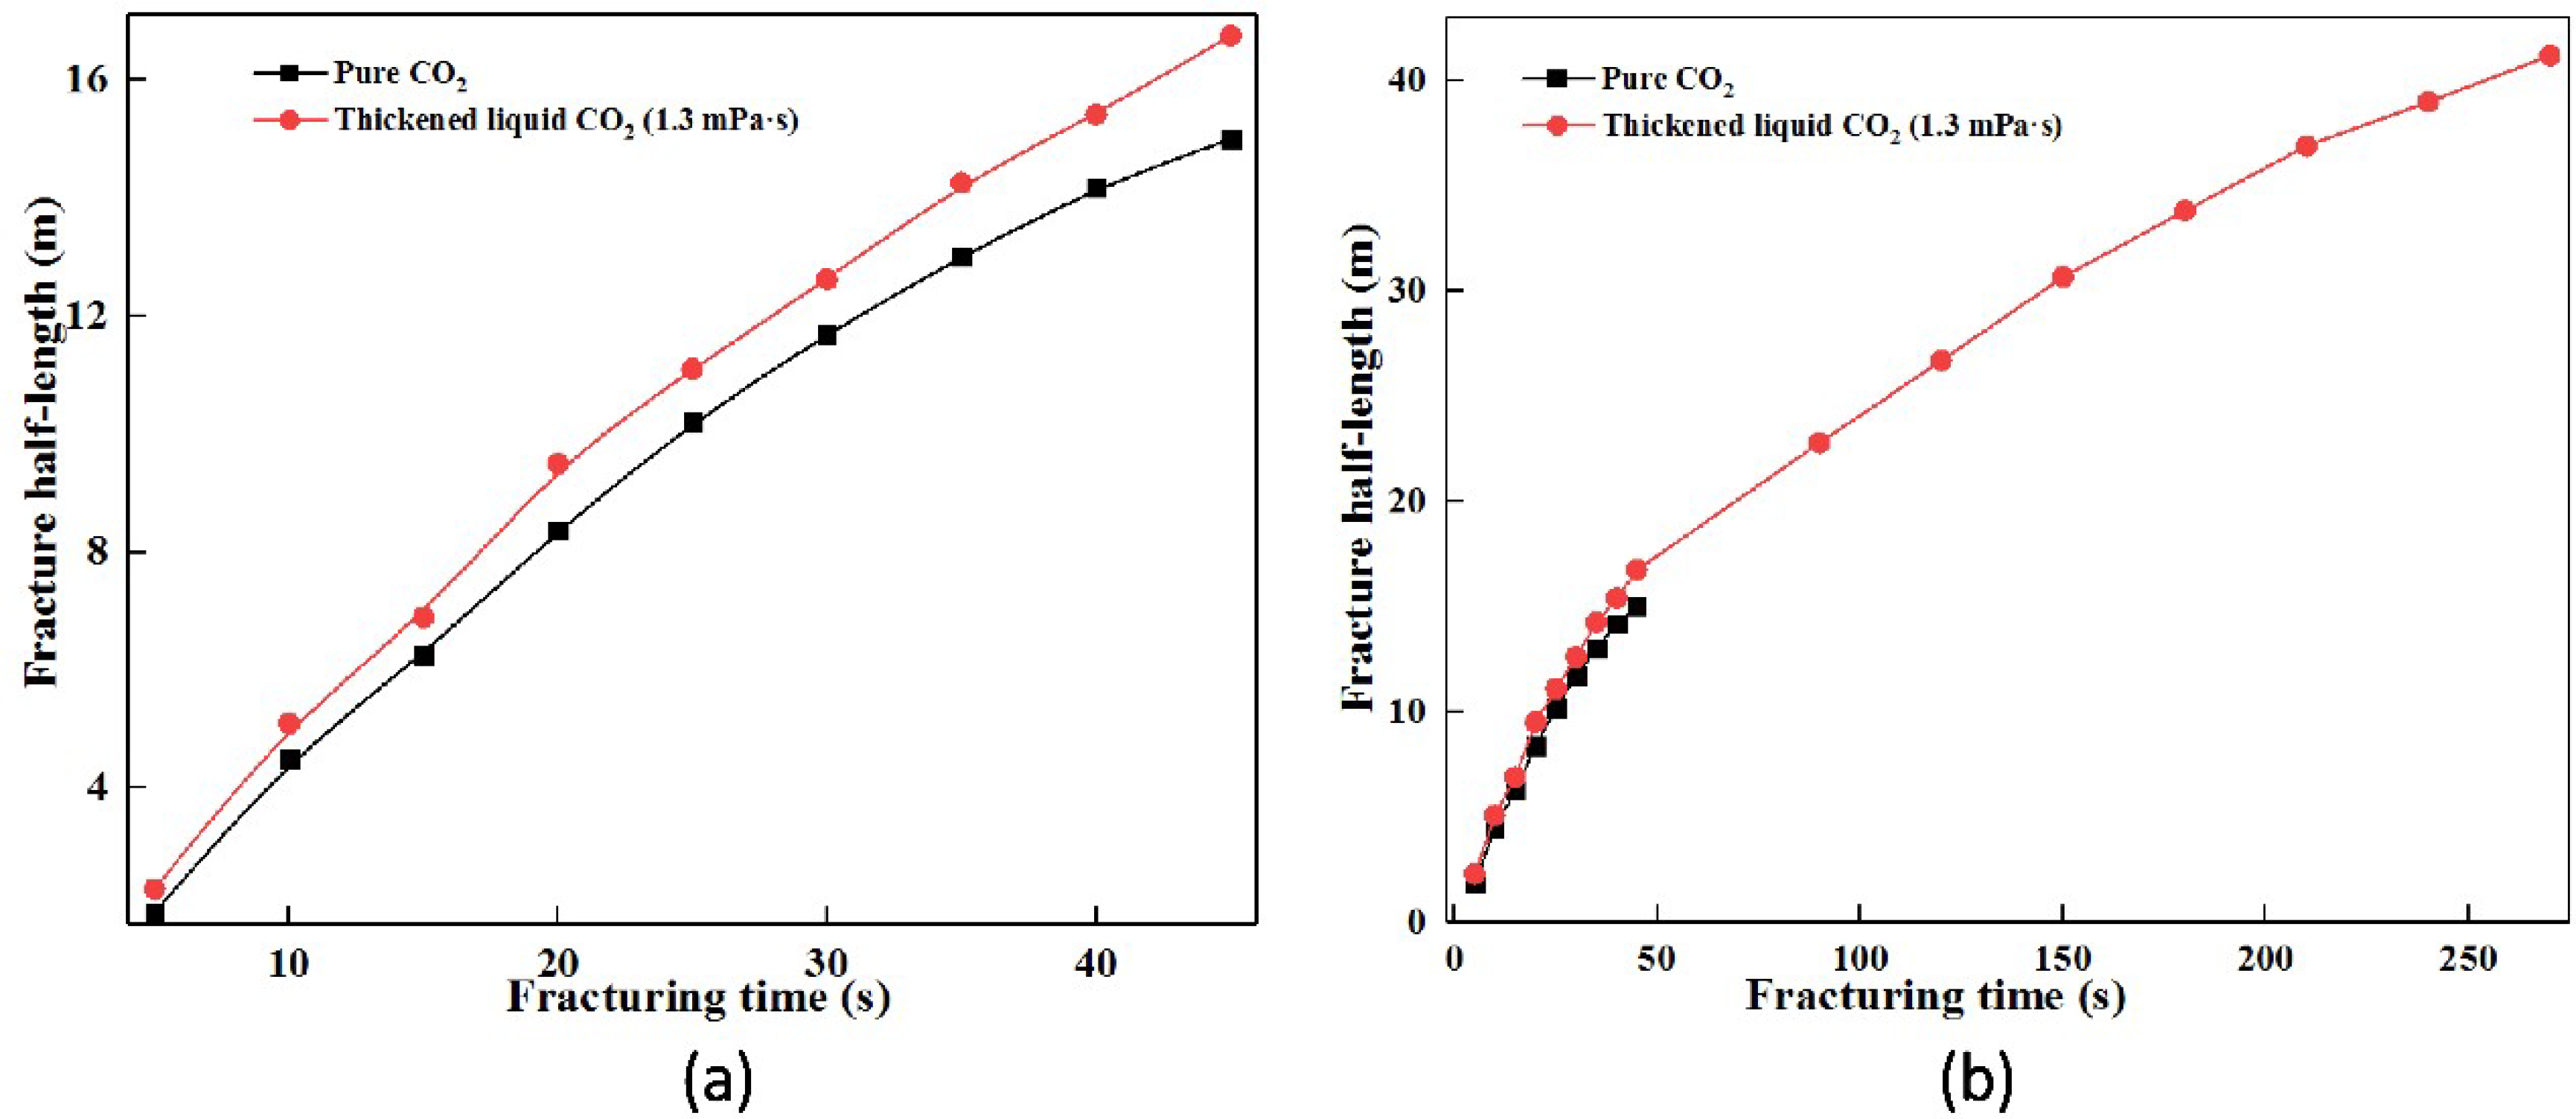
3.5. Numerical Simulation

A shale reservoir model displayed in Figure 3, based on the basic physical parameter of shale reservoirs, was established to verify the fracturing property of thickened liquid CO2. It could be seen from Figure 7 that an obvious crack turning characteristic was both illustrated between the pure CO2 fracturing fluid and thickened CO2 fracturing fluid (The parameters required for fracturing fluid are shown in Table 3). These two fracturing fluids still showed obvious crack morphology differences.
The pure CO2 conducted a tardily propagated prefabricated perforation with the effect of the loading, and it eventually failed at 44 s. However, the excellent fracturing property was shown by the thickened CO2 fracturing fluid. Compare to the difference in crack propagation, a conclusion can be drawn that with the increase of CO2 viscosity, the fracture half-length increased dramatically (Figure 8). The fracture half-length of pure CO2 fracturing fluid was merely 15.5 m at 44 s, whereas the thickened liquid CO2 obtained a fracture half-length of 41.4 m at 270 s (Figure 8b). In addition, it could be seen from Figure 8a that the fracture half-length of thickened liquid CO2 (1.3 mPa·s) is slightly larger than that of the pure liquid CO2, and the fracture half-length of thickened liquid CO2 showed a growth trend. The formed actual fluid pressure (Pressure inside the crack) (see Figure 7) was considered to be the reason for the different fracture half-length during CO2 fracturing operation. The viscosity of fracturing fluid is an important variable that influences fracture propagation [44,45]. The higher the fluid viscosity the lower the local flow rate in the fracture and the higher the fluid pressure and breakdown pressure under the same injection rate [46,47]. Moreover, the initiation pressure increased with an increase in the fluid viscosity [48]. With increasing dynamic viscosity, the breakdown pressure increases significantly but the fracture initiation pressure increases only slightly [48]. However, it could be seen from Figure 7 that there is a significant increase in the fluid pressure (Pressure inside the crack) when the viscosity is increased. Compared to the liquid pressure of the low viscosity (<20 MPa at 44 s), the high fluid pressure (>29 MPa at 44 s) of the higher viscosity could break through the reservoir pressure. This breakdown pressure and initiation pressure can continue the fracturing operation. However, the liquid pressure of the low viscosity (Pure liquid CO2, <20 MPa at 44 s) could not eliminate the above three pressures, and the fracturing operation suspended.

4. Conclusions

The results showed that EEPDMS have a considerable influence on the CO2 viscosity. Compared with the pure CO2, EEPDMS addition was contribute to the interaction with CO2, generating more microscopic mesh structure, which could be used to explain the increase in CO2 viscosity. On the other hand, the influence of temperature, pressure, shear rate and EEPDMS content on the CO2 viscosity was inconsistent. As temperature or shear rate increased, the CO2 viscosity decreased. However, CO2 viscosity displayed a rising trend with increasing the pressure or EEPDMS content. These above trends were applicable not only to pure CO2 but also to thicken CO2. The mesh structure theory was important as it applied to explain the causes of viscosity changes by various factors. The established shale model described the fracturing effect of the thickened liquid CO2. In the future study, we could summarize the design principle of CO2 thickener to prepare a thickener with an excellent thickening CO2 performance which will be beneficial for the CO2 use in shale gas mining. The simulation results of CO2 fracturing in this article provided a theoretical basis for the application of CO2 fracturing technology, and we will do a deeper study of the CO2 fracturing experiment and give the data in a further paper.

Supplementary Materials

The following are available online at https://www.mdpi.com/2073-4360/11/3/540/s1, Figure S1: FTIR spectra analysis of EEPDMS. Figure S2: 1H-NMR (CDCl3) spectra at 400 MHz of EEPDMS.

Author Contributions

Q.L. (Qiang Li) and Y.W. designed this experiment; F.W., L.Y. and F.K. performed a series of experiments about the preparation of this polymer and the effect of factors on the viscosity and rheology of the liquid CO2; H.B. and Q.L. (Qingchao Li) designed the capillary viscometer.

Funding

This investigation was supported by Joint Funds of the National Natural Science Foundation of China (U1762212).

Acknowledgments

The authors thank Binfei Li and Chao Zheng for their helpful suggestions the design of this capillary viscometer.

Conflicts of Interest

The authors declare no conflict of interest.

Nomenclature

σhMinimum horizontal principal stress
σvMinimum vertical principal stress
PfInjection pressure of CO2 fracturing fluid

References

  1. Lv, Q.; Li, Z.; Li, B.; Zhang, C.; Shi, D.; Zheng, C.; Zhou, T. Experimental study on the dynamic filtration control performance of N2/liquid CO2 foam in porous media. Fuel 2017, 202, 435–445. [Google Scholar] [CrossRef]
  2. Li, Q.; Wang, Y.; Wang, X.; Yu, H.; Li, Q.; Wang, F.; Bai, H.; Kobina, F. An Application of Thickener to Increase Viscosity of Liquid CO2 and the Assessment of the Reservoir Geological Damage and CO2 Utilization. Energy Source Part A 2019, 41, 368–377. [Google Scholar]
  3. Ayatollahi, S.; Hemmati-Sarapardeh, A.; Roham, M.; Hajirezaie, S. A rigorous approach for determining interfacial tension and minimum miscibility pressure in paraffin-CO2 systems: Application to gas injection processes. J. Taiwan. Inst. Chem. Eng. 2016, 63, 107–115. [Google Scholar] [CrossRef]
  4. Rassenfoss, S. More carbon dioxide means more oil. J. Petrol. Sci. Eng. 2014, 66, 38–50. [Google Scholar] [CrossRef]
  5. Zhao, F.; Hao, H.; Hou, J.; Hou, L.; Song, Z. CO2 mobility control and sweep efficiency improvement using starch gel or ethylenediamine in ultra-low permeability oil layers with different types of heterogeneity. J. Petrol. Sci. Eng. 2015, 133, 52–65. [Google Scholar] [CrossRef]
  6. King, S.R. Liquid CO2 for the stimulation of low permeability reservoirs. In Proceedings of the 1983 SPE/DOE Symposium on Low Permeability, Denver, CO, USA, 14–16 March 1983; pp. 14–16. [Google Scholar]
  7. Bahrami, H.; Rezaee, R.; Nazhat, D.; Ostojic, J. Evaluation of damage mechanisms and skin factor in tight gas reservoirs. APPEA J. 2011, 51, 639–652. [Google Scholar]
  8. Cheng, Y. Impact of water dynamics in fractures on the performance of hydraulically fractured wells in gas shale reservoirs. In Proceedings of the SPE International Symposium and Exhibition on Formation Damage Control, Lafayette, LA, USA, 10–12 February 2010. [Google Scholar]
  9. Luo, X.; Wang, S.; Wang, Z.; Jing, Z.; Lv, M.; Zhai, Z.; Han, T. Experimental investigation on rheological properties and friction performance of thickened CO2 fracturing fluid. J. Petrol. Sci. Eng. 2015, 133, 410–420. [Google Scholar] [CrossRef]
  10. Doherty, M.D.; Lee, J.J.; Dhuwe, A.; O’Brien, M.J.; Perry, R.J.; Beckman, E.J.; Enick, R.M. Small molecule cyclic amide and urea based thickeners for organic and sc-CO2/organic solutions. Energy Fuels 2016, 30, 5601–5610. [Google Scholar] [CrossRef]
  11. Cummings, S.; Xing, D.; Enick, R.; Rogers, S.; Heenan, R.; Grillo, I.; Eastoe, Z. Design principles for supercritical CO2 viscosifiers. Soft Matter 2012, 8, 7044–7055. [Google Scholar] [CrossRef]
  12. Triolo, A.; Celso, F.L.; Triolo, F.; Amenitsch, H.; Steinhart, M. Kinetics of block-copolymer aggregation in super critical CO2. J. Non-Cryst. Solids 2002, 307, 725–730. [Google Scholar] [CrossRef]
  13. Baysal, C.; Erman, B.; Chu, B. Conformational features of poly (1, 1-dihydroperfluorooctyl acrylate) and poly (vinyl acetate) diblock oligomers in supercritical carbon dioxide. J. Chem. Phys. 2001, 114, 5444–5449. [Google Scholar] [CrossRef]
  14. Bae, J.H.; Irani, C.A. A laboratory investigation of viscosified CO2 process. SPE Adv. Technol. Ser. 1993, 1, 166–171. [Google Scholar] [CrossRef]
  15. Williams, L.L.; Rubin, J.B.; Edwards, H.W. Calculation of Hansen solubility parameter values for a range of pressure and temperature conditions, including the supercritical fluid region. Ind. Eng. Chem. Res. 2004, 43, 4967–4972. [Google Scholar] [CrossRef]
  16. Wang, Y.; Hong, L.; Tapriyal, D.; Kim, I.C.; Paik, I.; Crosthwaite, J.M.; Hamilton, A.D.; Thies, M.C.; Beckenman, E.J.; Enick, R.M.; et al. Design and evaluation of nonfluorous CO2-soluble oligomers and polymers. J. Phys. Chem. B 2009, 113, 14971–14980. [Google Scholar] [CrossRef]
  17. Kilic, S.; Michalik, S.; Wang, Y.; Johnson, J.K.; Enick, R.M.; Beckenman, E.J. Effect of grafted Lewis base groups on the phase behavior of model poly (dimethyl siloxanes) in CO2. Ind. Eng. Chem. Res. 2003, 42, 6415–6424. [Google Scholar] [CrossRef]
  18. Li, Q.; Wang, Y.; Li, Q.; Foster, G.; Lei, C. Study on the optimization of silicone copolymer synthesis and the evaluation of its thickening performance. RSC Adv. 2018, 8, 8770–8778. [Google Scholar] [CrossRef]
  19. O’Brien, M.J.; Perry, R.J.; Doherty, M.D.; Lee, J.J.; Dhuwe, A.; Beckman, E.J.; Enick, R.M. Anthraquinone siloxanes as thickening agents for supercritical CO2. Energy Fuels 2016, 30, 5990–5998. [Google Scholar] [CrossRef]
  20. Sun, B.; Sun, W. Research progress and prospectives of supercritical CO2 thickening technology. J. China Univ. Petroleum (Ed. Nat. Sci.) 2015, 39, 76–83. [Google Scholar]
  21. Sarbu, T.; Styranec, T.J.; Beckman, E.J. Design and synthesis of low cost, sustainable CO2-philes. Ind. Eng. Chem. Res. 2000, 39, 4678–4683. [Google Scholar] [CrossRef]
  22. Crivello, J.V.; Lee, J.L. The synthesis, characterization, and photoinitiated cationic polymerization of silicon-containing epoxy resins. J. Polym. Sci. Polym. Chem. 1990, 28, 479–503. [Google Scholar] [CrossRef]
  23. Morita, Y.; Tajima, S.; Suzuki, H.; Sugino, H. Thermally initiated cationic polymerization and properties of epoxy siloxane. J. Appl. Polym. Sci. 2006, 100, 2010–2019. [Google Scholar] [CrossRef]
  24. Grunlan, M.A.; Lee, N.S.; Cai, G.; Gädda, T.; Mabry, J.M.; Mansfeld, F.; Kus, E.; Wendt, D.E.; Kowalke, G.L.; Finlay, J.A.; et al. Synthesis of α, ω-Bis Epoxy Oligo (1 ‘H, 1 ‘H, 2 ‘H, 2 ‘H-Perfluoroalkyl Siloxane) s and Properties of Their Photo-Acid Cross-Linked Films. Chem. Mater 2004, 16, 2433–2441. [Google Scholar] [CrossRef]
  25. Cui, L.Z. Synthesis and Analysis of Hydrogen-Terminated Polydimethylsiloxane; Zhejiang University: Hangzhou, China, 2012. [Google Scholar]
  26. Lewis, L.N.; Lewis, N. Platinum-catalyzed hydrosilylation-colloid formation as the essential step. J. Am. Chem. Soc. 1986, 108, 7228–7231. [Google Scholar] [CrossRef]
  27. Barry, A.J. Viscometric investigation of dimethylsiloxane polymers. J. Appl. Phys. 1946, 17, 1020–1024. [Google Scholar] [CrossRef]
  28. Kuo, A.C.M. Poly (dimethylsiloxane). In Polymer Data Handbook; Oxford University Press: Oxfordshire, UK, 1999; pp. 411–435. [Google Scholar]
  29. Craft, N.E.; Soares, J.H. Relative solubility, stability, and absorptivity of lutein and. beta-carotene in organic solvents. J. Agric. Food. Chem. 1992, 40, 431–434. [Google Scholar] [CrossRef]
  30. Fink, R.; Beckman, E.J. Phase behavior of siloxane-based amphiphiles in supercritical carbon dioxide. J. Supercrit. Fluid 2000, 18, 101–110. [Google Scholar] [CrossRef]
  31. Li, Q.; Cheng, Y.; Li, Q.; Ansari, U.; Liu, Y.; Yan, C.; Lei, C. Development and verification of the comprehensive model for physical properties of hydrate sediment. Arab. J. Geosci. 2018, 11, 325. [Google Scholar] [CrossRef]
  32. Zou, J.; Chen, W.; Jiao, Y.Y. Numerical simulation of hydraulic fracture initialization and deflection in anisotropic unconventional gas reservoirs using XFEM. J. Nat. Gas Sci. Eng. 2018, 55, 466–475. [Google Scholar] [CrossRef]
  33. Gnanasambandam, R.; Proctor, A. Determination of pectin degree of esterification by diffuse reflectance Fourier transform infrared spectroscopy. Food Chem. 2000, 68, 327–332. [Google Scholar] [CrossRef]
  34. Yang, H.; Nguyen, Q.T.; Ding, Y.D.; Long, Y.C.; Ping, Z. Investigation of poly (dimethyl siloxane) (PDMS)–solvent interactions by DSC. J. Membrane Sci. 2000, 164, 37–43. [Google Scholar] [CrossRef]
  35. Wu, C.; Li, J.; Dong, H.; Jiang, J. Solubility of 1, 3-dimethyl-1, 1, 3, 3-tetraphenyldisiloxane in different solvents from (288.15 to 313.15) K. Thermochim. Acta 2012, 543, 24–31. [Google Scholar] [CrossRef]
  36. Lee, B.C.; Danner, R.P. Prediction of polymer-solvent phase equilibria by a modified group-contribution EOS. AIChE J. 1996, 42, 837–849. [Google Scholar] [CrossRef]
  37. Bueche, A.M. Interaction of polydimethylsiloxanes with swelling agents. J. Polym. Sci. 1955, 15, 97–103. [Google Scholar] [CrossRef]
  38. Bae, J.H. Viscosified CO2 Process: Chemical Transport and Other Issues. In Proceedings of the SPE International Symposium on Oilfield Chemistry, San Antonio, TX, USA, 14–17 February 1995. [Google Scholar]
  39. Raveendran, P.; Wallen, S.L. Cooperative C− H··· O Hydrogen Bonding in CO2− Lewis Base Complexes: Implications for Solvation in Supercritical CO2. J. Am. Chem. Soc. 2002, 124, 12590–12599. [Google Scholar] [CrossRef]
  40. Tsukahara, T.; Kayaki, Y.; Ikariya, T.; Ikeda, Y. 13C NMR spectroscopic evaluation of the affinity of carbonyl compounds for carbon dioxide under supercritical conditions. Angew. Chem. Int. Edit. 2004, 43, 3719–3722. [Google Scholar] [CrossRef] [PubMed]
  41. Chandrika, B.; Schnackenberg, L.K.; Raveendran, P.; Raveendran, P.; Wallen, S.L. High resolution 1H NMR structural studies of sucrose octaacetate in supercritical carbon dioxide. Chem. Eur. J. 2005, 11, 6266–6271. [Google Scholar] [CrossRef] [PubMed]
  42. Pozrikidis, C. Numerical investigation of the effect of surfactants on the stability and rheology of emulsions and foam. J. Eng. Math. 2001, 41, 237–258. [Google Scholar] [CrossRef]
  43. Shen, Z.; Zhao, Z.; Kang, W. Colloid and Surface Chemistry; Chemical Industry Press: Beijing, China, 2012. [Google Scholar]
  44. Liu, L.; Li, L.; Elsworth, D.; Zhi, S.; Yu, Y. The Impact of Oriented Perforations on Fracture Propagation and Complexity in Hydraulic Fracturing. Processes 2018, 6, 213. [Google Scholar] [CrossRef]
  45. Chen, D.; Yao, Y.; Fu, G.; Meng, H.; Xie, S. A new model for predicting liquid loading in deviated gas wells. J. Nat. Gas. Sci. Eng. 2016, 34, 178–184. [Google Scholar] [CrossRef]
  46. Detournay, E. Propagation regimes of fluid-driven fractures in impermeable rocks. Int. J. Geomech. 2004, 4, 35–45. [Google Scholar] [CrossRef]
  47. Zhang, X.; Jeffrey, R.G.; Thiercelin, M. Deflection and propagation of fluid-driven fractures at frictional bedding interfaces: A numerical investigation. J. Struct. Geol. 2007, 29, 396–410. [Google Scholar] [CrossRef]
  48. Liu, L.; Zhu, W.; Wei, C.; Elsworth, D.; Wang, J. Microcrack-based geomechanical modeling of rock-gas interaction during supercritical CO2 fracturing. J. Petrol. Sci. Eng. 2018, 164, 91–102. [Google Scholar] [CrossRef]
Figure 1. The synthesis process of EEPDMS.
Polymers 11 00540 g001
Figure 2. The composition of this capillary viscometer.
Polymers 11 00540 g002
Figure 3. Schematic diagram of the established finite element model.
Polymers 11 00540 g003
Figure 4. Effect of temperature on the apparent viscosity and rheology; (a) Temperature and apparent viscosity; (b) Shear rate and apparent viscosity; (c) Logτw and Log(8v/D); (d) Rheological index, consistency coefficient and temperature.
Polymers 11 00540 g004
Figure 5. Effect of pressure on the apparent viscosity and rheology. (a) Temperature and apparent viscosity; (b) Shear rate and apparent viscosity; (c) Logτw and Log(8v/D); (d) Rheological index, consistency coefficient and temperature.
Polymers 11 00540 g005
Figure 6. Effect of thickener content on the apparent viscosity and rheology. (a)Temperature and apparent viscosity; (b) Shear rate and apparent viscosity; (c) Logτw and Log(8v/D); (d) Rheological index, consistency coefficient and temperature.
Polymers 11 00540 g006
Figure 7. The distribution of the fracture morphology evolution. (a) Pure liquid CO2 (0.04 mPa·s, 0–44 s); (b) Thickened liquid CO2 (1.3 mPa·s, 0–44 s); (c) Thickened liquid CO2 (1.3 mPa·s, 0–270s).
Polymers 11 00540 g007
Figure 8. The effect of EEPDMS on the fracture half-length in CO2 fracturing operation. (a) 0–44 s; (b) 0–270 s.
Polymers 11 00540 g008
Table 1. The characteristic parameters and the initial conditions of shale reservoirs.
ParameterValueParameterValue
Elastic Modulus, E/GPa20Poisson’s ratio, ν0.26
Minimum horizontal principal stress, σh/MPa31Maximum horizontal principal stress, σH/MPa37
Tensile strength, C/MPa3.5Initial pore pressure, Pip/MPa18
Initial porosity, ϕ/%8Permeability, K/m24 × 10−17
Injection rate, Q/(m3/min)4Total fracturing time, T/min10
Leak-off coefficient1 × 10−14Viscosity, mPa·s0.04 and 1.3
Table 2. Viscosity and Phase behavior of EEPDMS on Organic Liquids.
SolventEEPDMS Content (wt.%)Solution State283 K293 K303 K313 K323 K
Toluene 1Clear, Viscous liquidMMMSS
Hexane 1Clear, Viscous liquidMMMSS
Pentane1Clear, Viscous liquidMSSSS
Nonanol 1Turbid solutionIIIIS
Methanol 1Turbid solutionIIIII
Ethanol 1Turbid solutionIIIII
1,2-Propylene glycol1Turbid solutionIIIII
Toluene 2Clear, Viscous liquidMMMSS
Hexane 2Clear, Viscous liquidMMMSS
Pentane2Clear, Viscous liquidMSSSS
Nonanol2Turbid solutionIIIII
Methanol 2Turbid solutionIIIII
Ethanol 2Turbid solutionIIIII
1,2-Propylene glycol2Turbid solutionIIIII
Toluene 4Clear, Viscous liquidMMMMS
Hexane4Clear, Viscous liquidMMMMS
Pentane4Clear, Viscous liquidMMSSS
Nonanol4Turbid solutionIIIII
Methanol 4Turbid solutionIIIII
Ethanol 4Turbid solutionIIIII
1,2-Propylene glycol4Turbid solutionIIIII
* M: Medium viscosity (0.5–0.7 mPa·s); S: Slight viscosity (0.1–0.5 mPa·s); I: Insoluble.
Table 3. The Detailed parameters of fracturing fluids for numerical simulation in this paper.
Fluid typeViscosity (mPa s)Injection Rate (m3/min)Thickener Content (wt.%)Cosolvent Content (wt.%)
Pure liquid CO20.04400
Thickened liquid CO21.30439

