Solid-State Foaming of Acrylonitrile-Butadiene-Styrene/Recycled Polyethylene Terephthalate Using Carbon Dioxide as a Blowing Agent


Abstract
:
1. Introduction
2. Materials and Methods
2.1. Materials
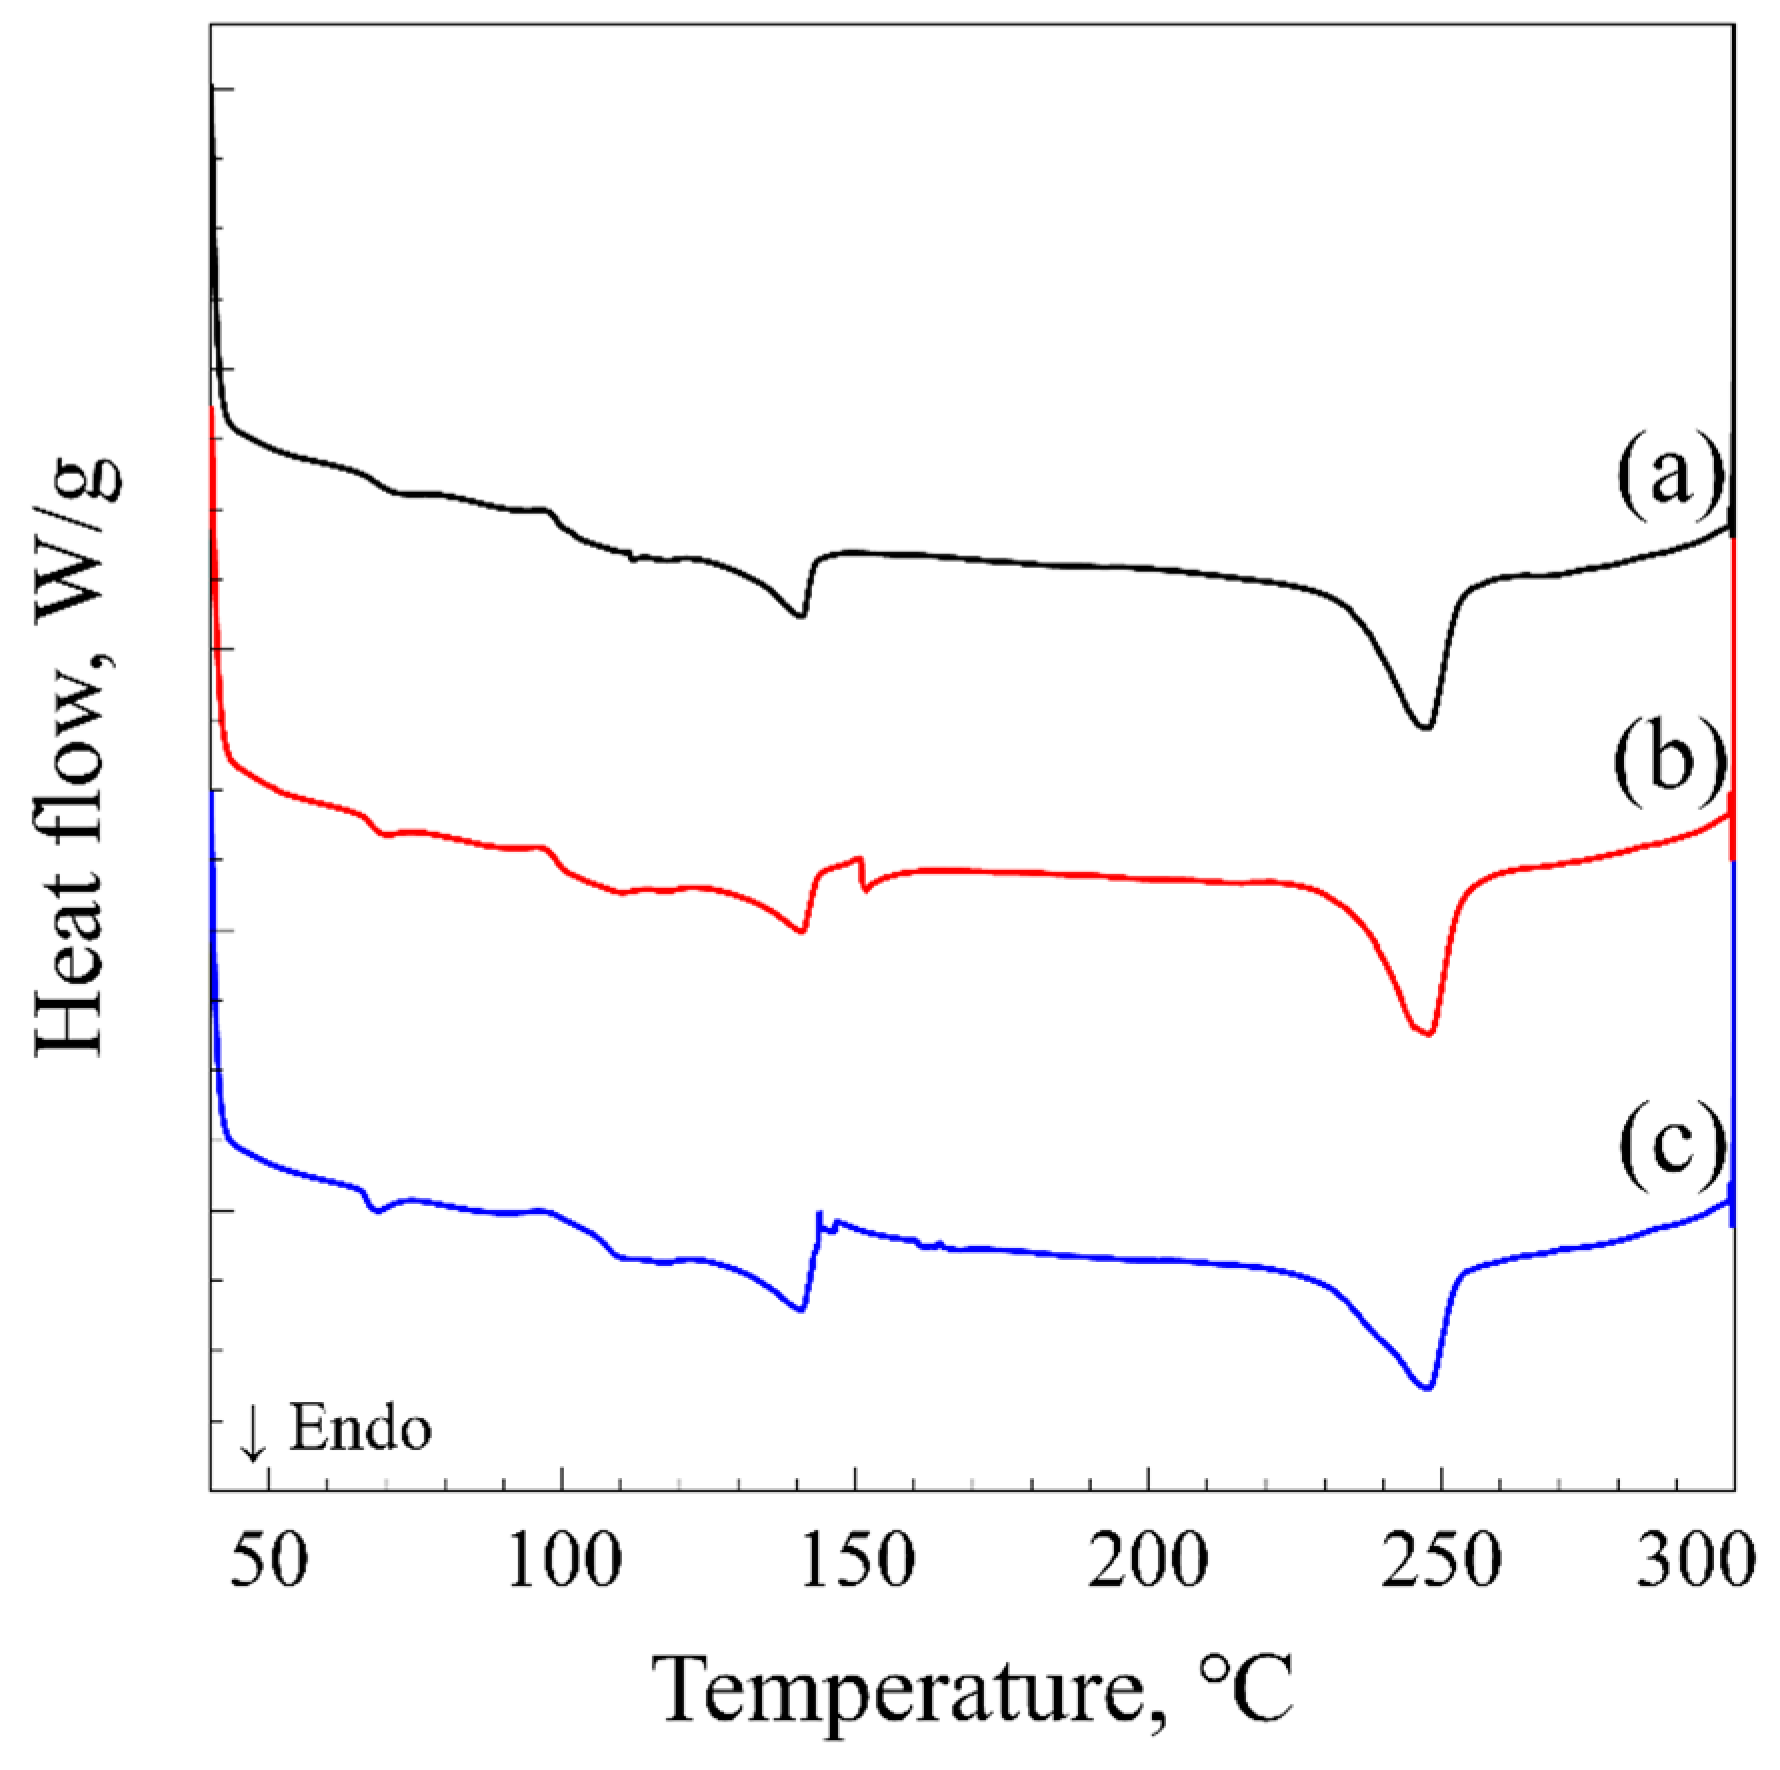
2.2. Differential Scanning Calorimetry
2.3. Sorption Kinetics
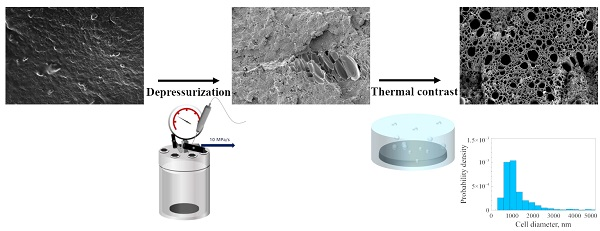
2.4. Preparation of ABS/R-PET Foam Structure
2.5. Structural Characterization
3. Results and Discussions
3.1. Characterization of Unprocessed ABS/R-PET Blend
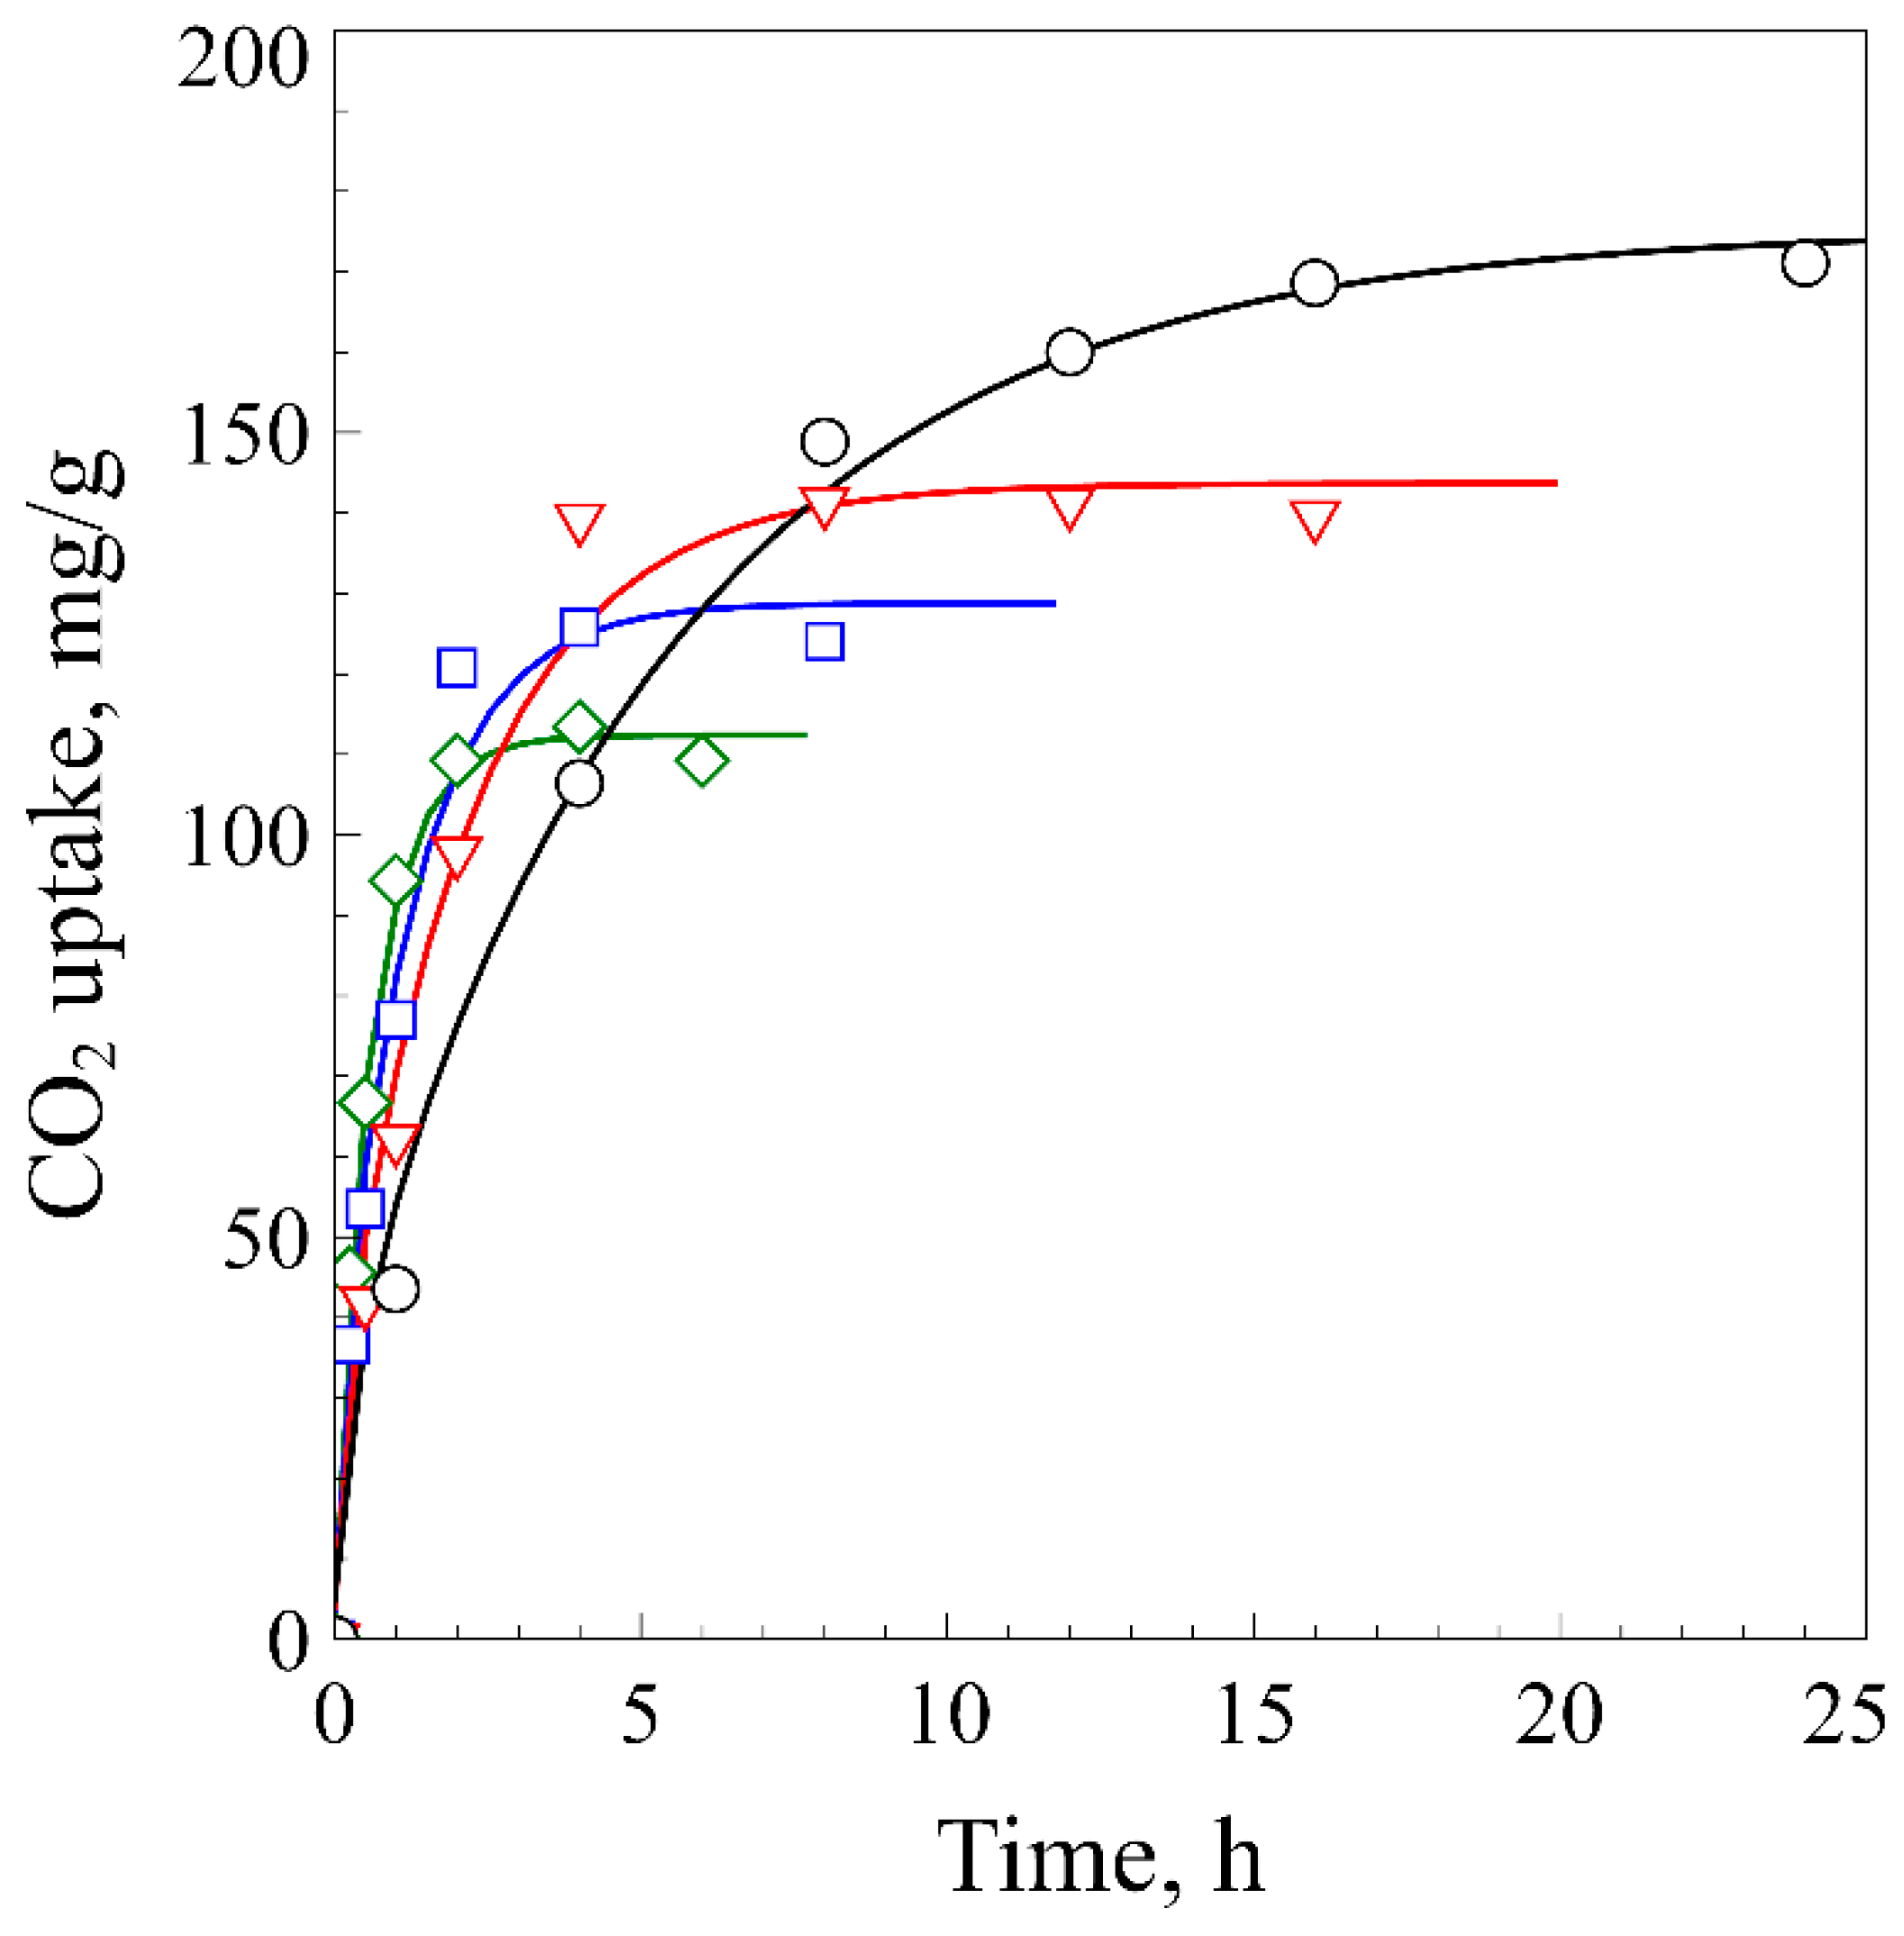
3.2. Measurement of Sorption Kinetics
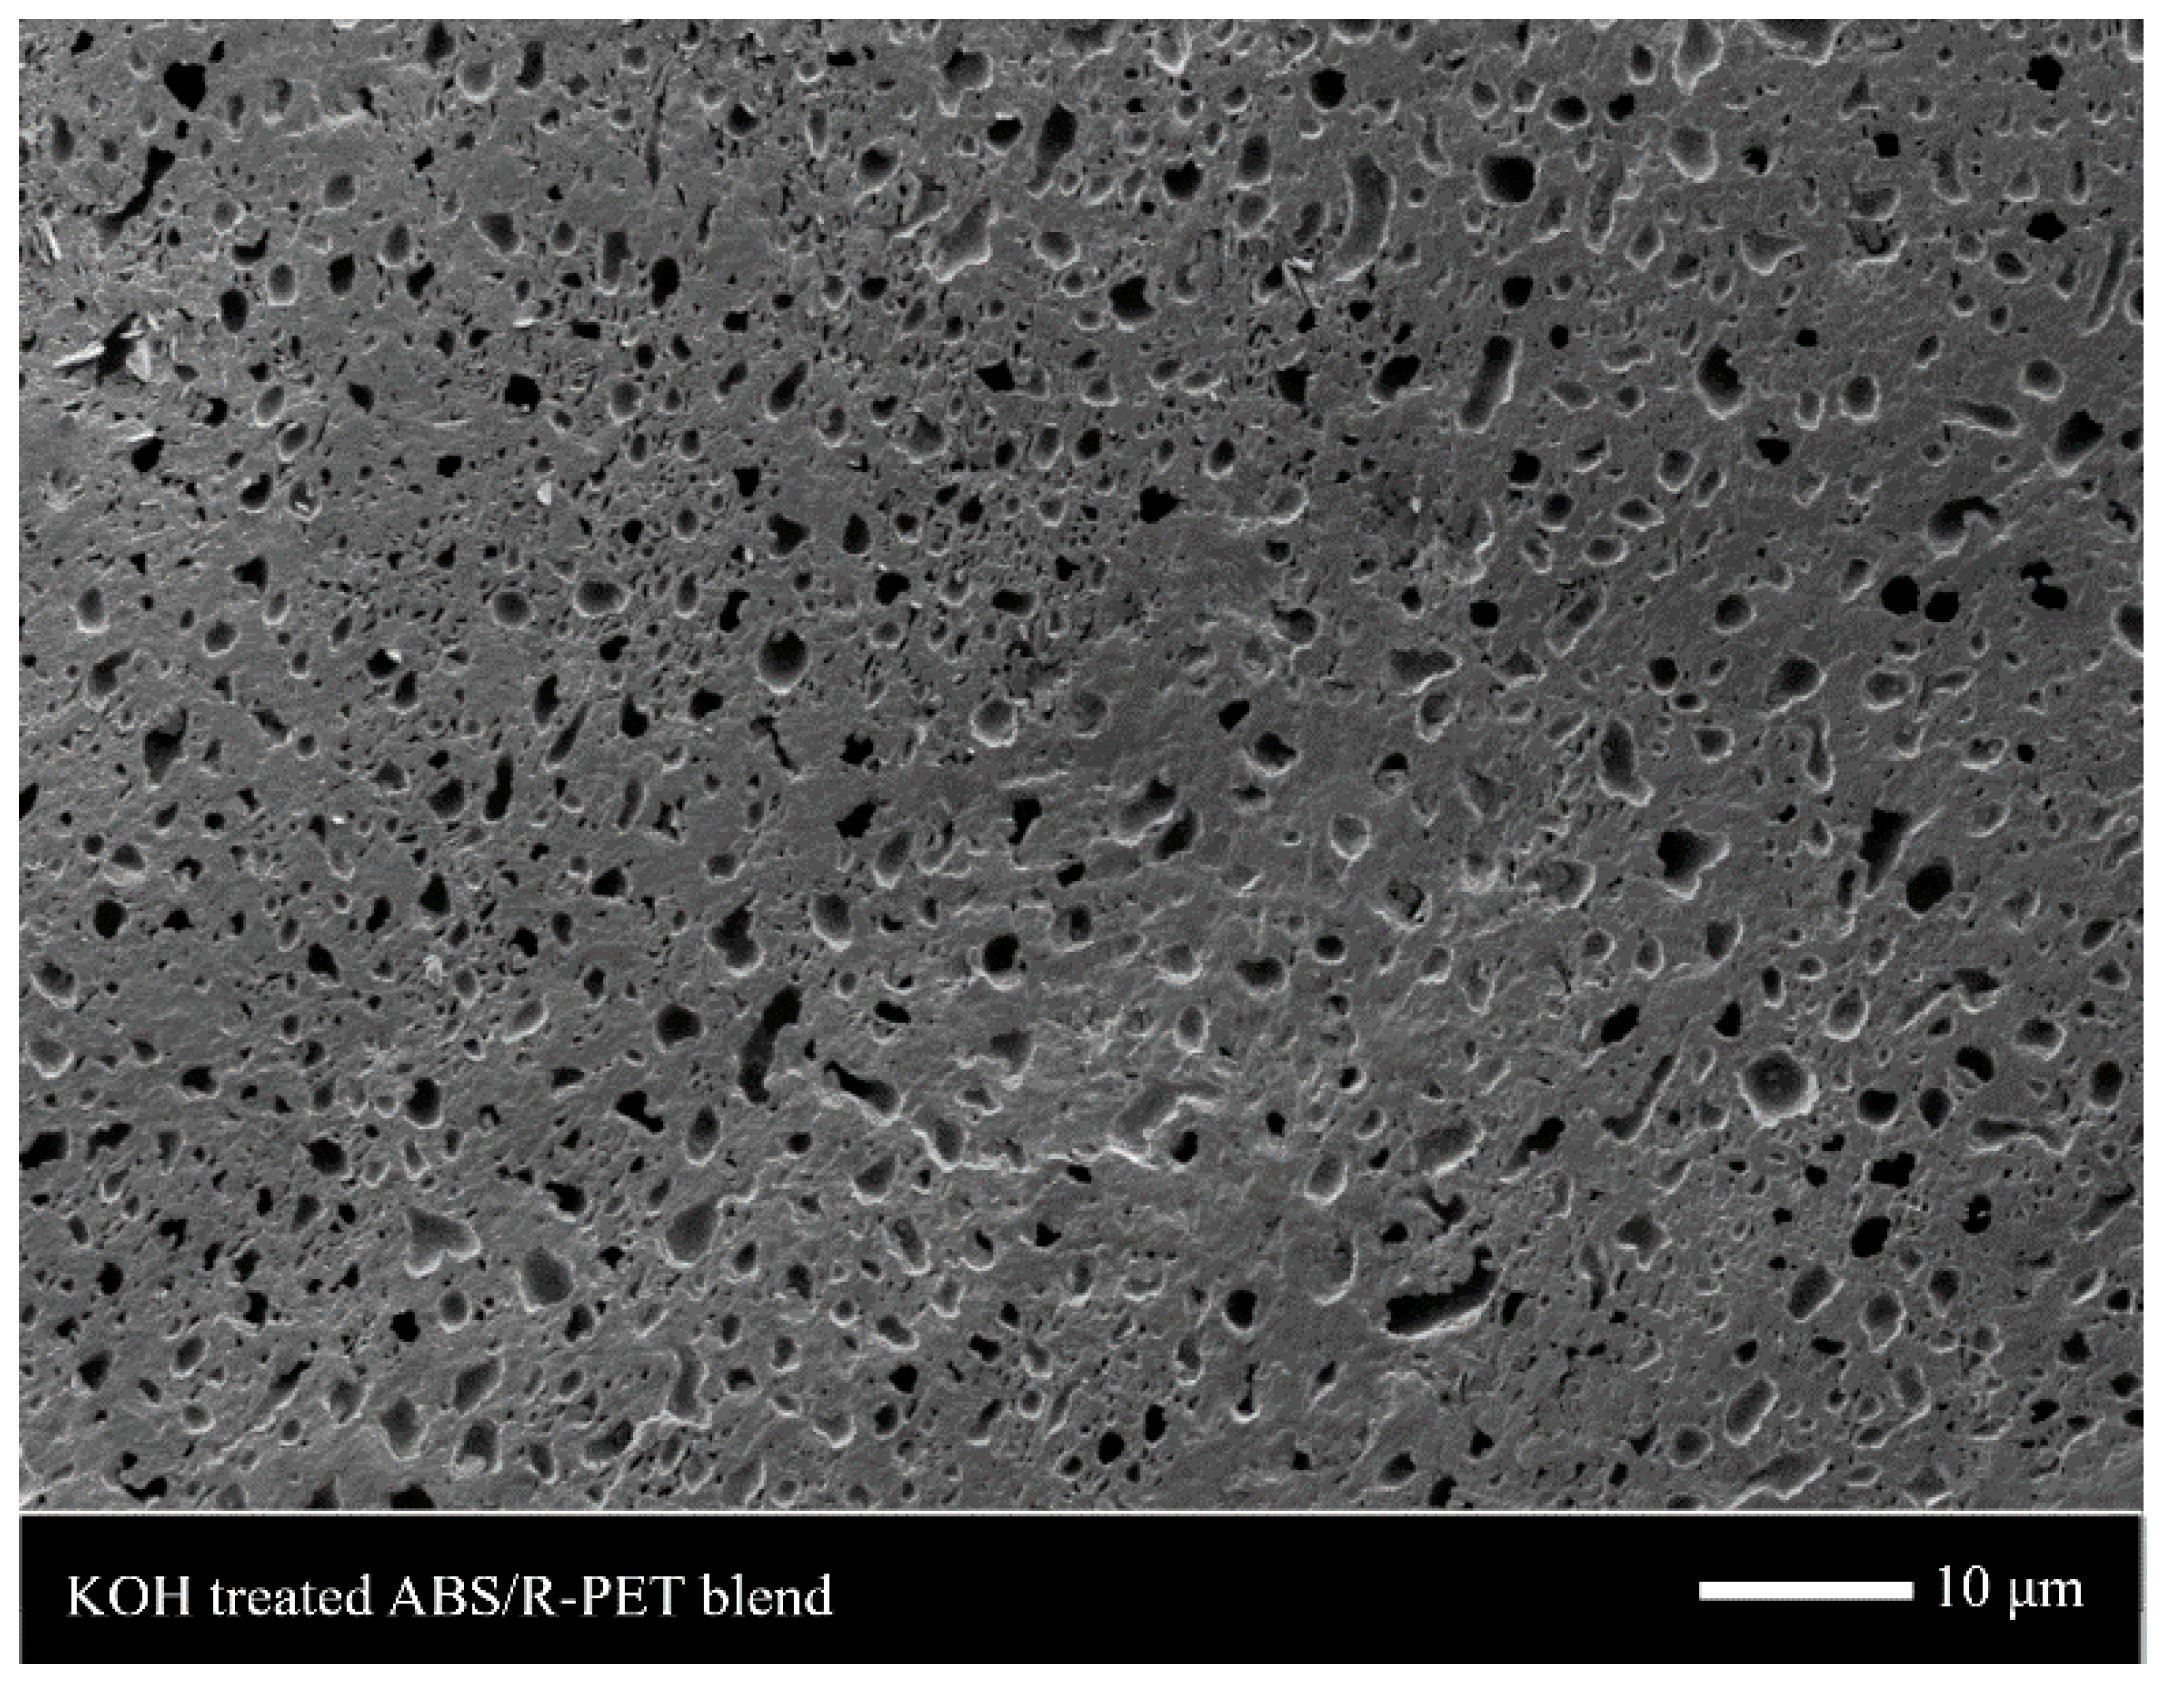
3.3. Characterization of the ABS/R-PET Microcellular Foams
4. Conclusions
Author Contributions
Funding
Acknowledgments
Conflicts of Interest
References
- Barnes, D.K.A.; Galgani, F.; Thompson, R.C.; Barlaz, M. Accumulation and fragmentation of plastic debris in global environments. Philos. Trans. R. Soc. Lond. B Biol. Sci. 2009, 364, 1985–1998. [Google Scholar] [CrossRef] [PubMed]
- Park, S.H.; Kim, S.H. Poly (ethylene terephthalate) recycling for high value added textiles. Fash. Text. 2014, 1, 1. [Google Scholar] [CrossRef]
- Papadopoulou, C.P.; Kalfoglou, N.K. Comparison of compatibilizer effectiveness for PET/PP blends: Their mechanical, thermal and morphology characterization. Polymer 2000, 41, 2543–2555. [Google Scholar] [CrossRef]
- Chaudhari, K.; Kale, D. Impact modification of waste PET by polyolefinic elastomer. Polym. Int. 2003, 52, 291–298. [Google Scholar] [CrossRef]
- Mbarek, S.; Jaziri, M.; Carrot, C. Recycling poly(ethylene terephtalate) wastes: Properties of poly(ethylene terephtalate)/polycarbonate blends and the effect of a transesterification catalyst. Polym. Eng. Sci. 2006, 46, 1378–1386. [Google Scholar] [CrossRef]
- Cook, W.D.; Zhang, T.; Moad, G.; Van Deipen, G.; Cser, F.; Fox, B.; O’Shea, M.; Van Deipen, G.; Cser, F.; Fox, B.; et al. Morphology-Property Relationships in ABS/PET Blends. 1. Compositional Effects. J. Appl. Polym. Sci. 1996, 62, 1699–1708. [Google Scholar] [CrossRef]
- Paul, S.; Kale, D.D. Blends of acrylonitrile-butadiene-styrene/waste poly(ethylene terephthalate) compatibilized by styrene maleic anhydride. J. Appl. Polym. Sci. 2001, 80, 2593–2599. [Google Scholar] [CrossRef]
- Nawaby, A.V.; Handa, Y.P.; Liao, X.; Yoshitaka, Y.; Tomohiro, M. Polymer—CO2 systems exhibiting retrograde behavior and formation of nanofoams. Polym. Int. 2007, 56, 67–73. [Google Scholar] [CrossRef]
- Forest, C.; Chaumont, P.; Cassagnau, P.; Swoboda, B.; Sonntag, P. Generation of nanocellular foams from ABS terpolymers. Eur. Polym. J. 2015, 65, 209–220. [Google Scholar] [CrossRef]
- Yoon, T.J.; Kong, W.; Kwon, D.E.; Park, B.K.; Lee, W., II; Lee, Y.W. Preparation of solid-state micro- and nanocellular acrylonitrile-butadiene-styrene (ABS) foams using sub- and supercritical CO2 as blowing agents. J. Supercrit. Fluids 2017, 124, 30–37. [Google Scholar] [CrossRef]
- Li, D.; Liu, T.; Zhao, L.; Yuan, W. Controlling sandwich-structure of PET microcellular foams using coupling of CO2 diffusion and induced crystallization. AIChE J. 2012, 58, 2512–2523. [Google Scholar] [CrossRef]
- Zhao, G.; Pan, Z.; Wang, J.; Guo, Q.; Cai, X. Toughening and Compatibilization of Acrylonitrile–Butadiene–Styrene/Poly (Ethylene Terephthalate) Blends. J. Macromol. Sci. Part B 2011, 50, 821–830. [Google Scholar] [CrossRef]
- Kumar, V.; Weller, J.E. A Process to Produce Microcellular PVC. Int. Polym. Process. 1993, 8, 73–80. [Google Scholar] [CrossRef]
- Matuana, L.M. Solid state microcellular foamed poly(lactic acid): Morphology and property characterization. Bioresour. Technol. 2008, 99, 3643–3650. [Google Scholar] [CrossRef] [PubMed]
- Hu, D.; Gu, Y.; Liu, T.; Zhao, L. Microcellular foaming of polysulfones in supercritical CO2 and the effect of co-blowing agent. J. Supercrit. Fluids 2018, 140, 21–31. [Google Scholar] [CrossRef]
- Crank, J. The Mathematics of Diffusion, 2nd ed.; Oxford University Press: Oxford, UK, 1975; ISBN 0198533446. [Google Scholar]
- Schneider, C.A.; Rasband, W.S.; Eliceiri, K.W. NIH Image to ImageJ: 25 years of image analysis. Nat. Methods 2012, 9, 671–675. [Google Scholar] [CrossRef] [PubMed]
- Legland, D.; Arganda-Carreras, I.; Andrey, P. MorphoLibJ: Integrated library and plugins for mathematical morphology with ImageJ. Bioinformatics 2016, 32, btw413. [Google Scholar] [CrossRef] [PubMed]
- Forest, C.; Chaumont, P.; Cassagnau, P.; Swoboda, B.; Sonntag, P. Nanofoaming of PMMA using a batch CO2 process: Influence of the PMMA viscoelastic behaviour. Polymer 2015, 77, 1–9. [Google Scholar] [CrossRef]
- Park, B.K.; Hwang, D.J.; Kwon, D.E.; Yoon, T.J.; Lee, Y.-W. Fabrication and Characterization of Multiscale PLA Structures Using Integrated Rapid Prototyping and Gas Foaming Technologies. Nanomaterials 2018, 8, 575. [Google Scholar] [CrossRef]
- Otsuka, T.; Taki, K.; Ohshima, M. Nanocellular Foams of PS/PMMA Polymer Blends. Macromol. Mater. Eng. 2008, 293, 78–82. [Google Scholar] [CrossRef]
- Taki, K.; Nitta, K.; Kihara, S.-I.; Ohshima, M. CO2 foaming of poly(ethylene glycol)/polystyrene blends: Relationship of the blend morphology, CO2 mass transfer, and cellular structure. J. Appl. Polym. Sci. 2005, 97, 1899–1906. [Google Scholar] [CrossRef]
- Di Maio, E.; Kiran, E. Foaming of polymers with supercritical fluids and perspectives on the current knowledge gaps and challenges. J. Supercrit. Fluids 2018, 134, 157–166. [Google Scholar] [CrossRef]
- Salerno, A.; Domingo, C. Polycaprolactone foams prepared by supercritical CO2 batch foaming of polymer/organic solvent solutions. J. Supercrit. Fluids 2019, 143, 146–156. [Google Scholar] [CrossRef]
- Hansen, C.M. Hansen Solubility Parameters: A User’s Handbook; CRC Press: Boca Raton, FL, USA, 2007; ISBN 9780849372483. [Google Scholar]
- Williams, L.L.; Rubin, J.B.; Edwards, H.W. Calculation of Hansen Solubility Parameter Values for a Range of Pressure and Temperature Conditions, Including the Supercritical Fluid Region. Ind. Eng. Chem. Res. 2004, 43, 4967–4972. [Google Scholar] [CrossRef]
- Marcus, Y. Solubility parameter of carbon dioxide—An enigma. ACS Omega 2018, 3, 524–528. [Google Scholar] [CrossRef]
- Tsivintzelis, I.; Pavlidou, E.; Panayiotou, C. Biodegradable polymer foams prepared with supercritical CO2-ethanol mixtures as blowing agents. J. Supercrit. Fluids 2007, 42, 265–272. [Google Scholar] [CrossRef]
- Zhong, Z.; Zheng, S.; Mi, Y. High-pressure DSC study of thermal transitions of a poly(ethylene terephthalate)/carbon dioxide system. Polymer 1999, 40, 3829–3834. [Google Scholar] [CrossRef]
- Ma, Z.; Zhang, G.; Yang, Q.; Shi, X.; Shi, A. Fabrication of microcellular polycarbonate foams with unimodal or bimodal cell-size distributions using supercritical carbon dioxide as a blowing agent. J. Cell. Plast. 2014, 50, 55–79. [Google Scholar] [CrossRef]
- Xu, Z.-M.; Jiang, X.-L.; Liu, T.; Hu, G.-H.; Zhao, L.; Zhu, Z.-N.; Yuan, W.-K. Foaming of polypropylene with supercritical carbon dioxide. J. Supercrit. Fluids 2007, 41, 299–310. [Google Scholar] [CrossRef]


| Saturation Temperature, °C | Csat, mg/g a | D, 10−7 cm2/s a |
|---|---|---|
| −20 | 175.3 (14.25) | 0.516 (0.17) |
| 0 | 143.7 (11.80) | 1.304 (0.47) |
| 20 | 128.8 (15.75) | 2.264 (1.03) |
| 40 | 112.4 (5.40) | 4.083 (0.85) |
| Component | ||||
|---|---|---|---|---|
| CO2 (−20 °C, 10 MPa) | 14.6 | 5.1 | 6.0 | - |
| PET | 18.7 | 6.3 | 6.7 | 8.3 |
| PB | 17.3 | 2.3 | 3.4 | 6.6 |
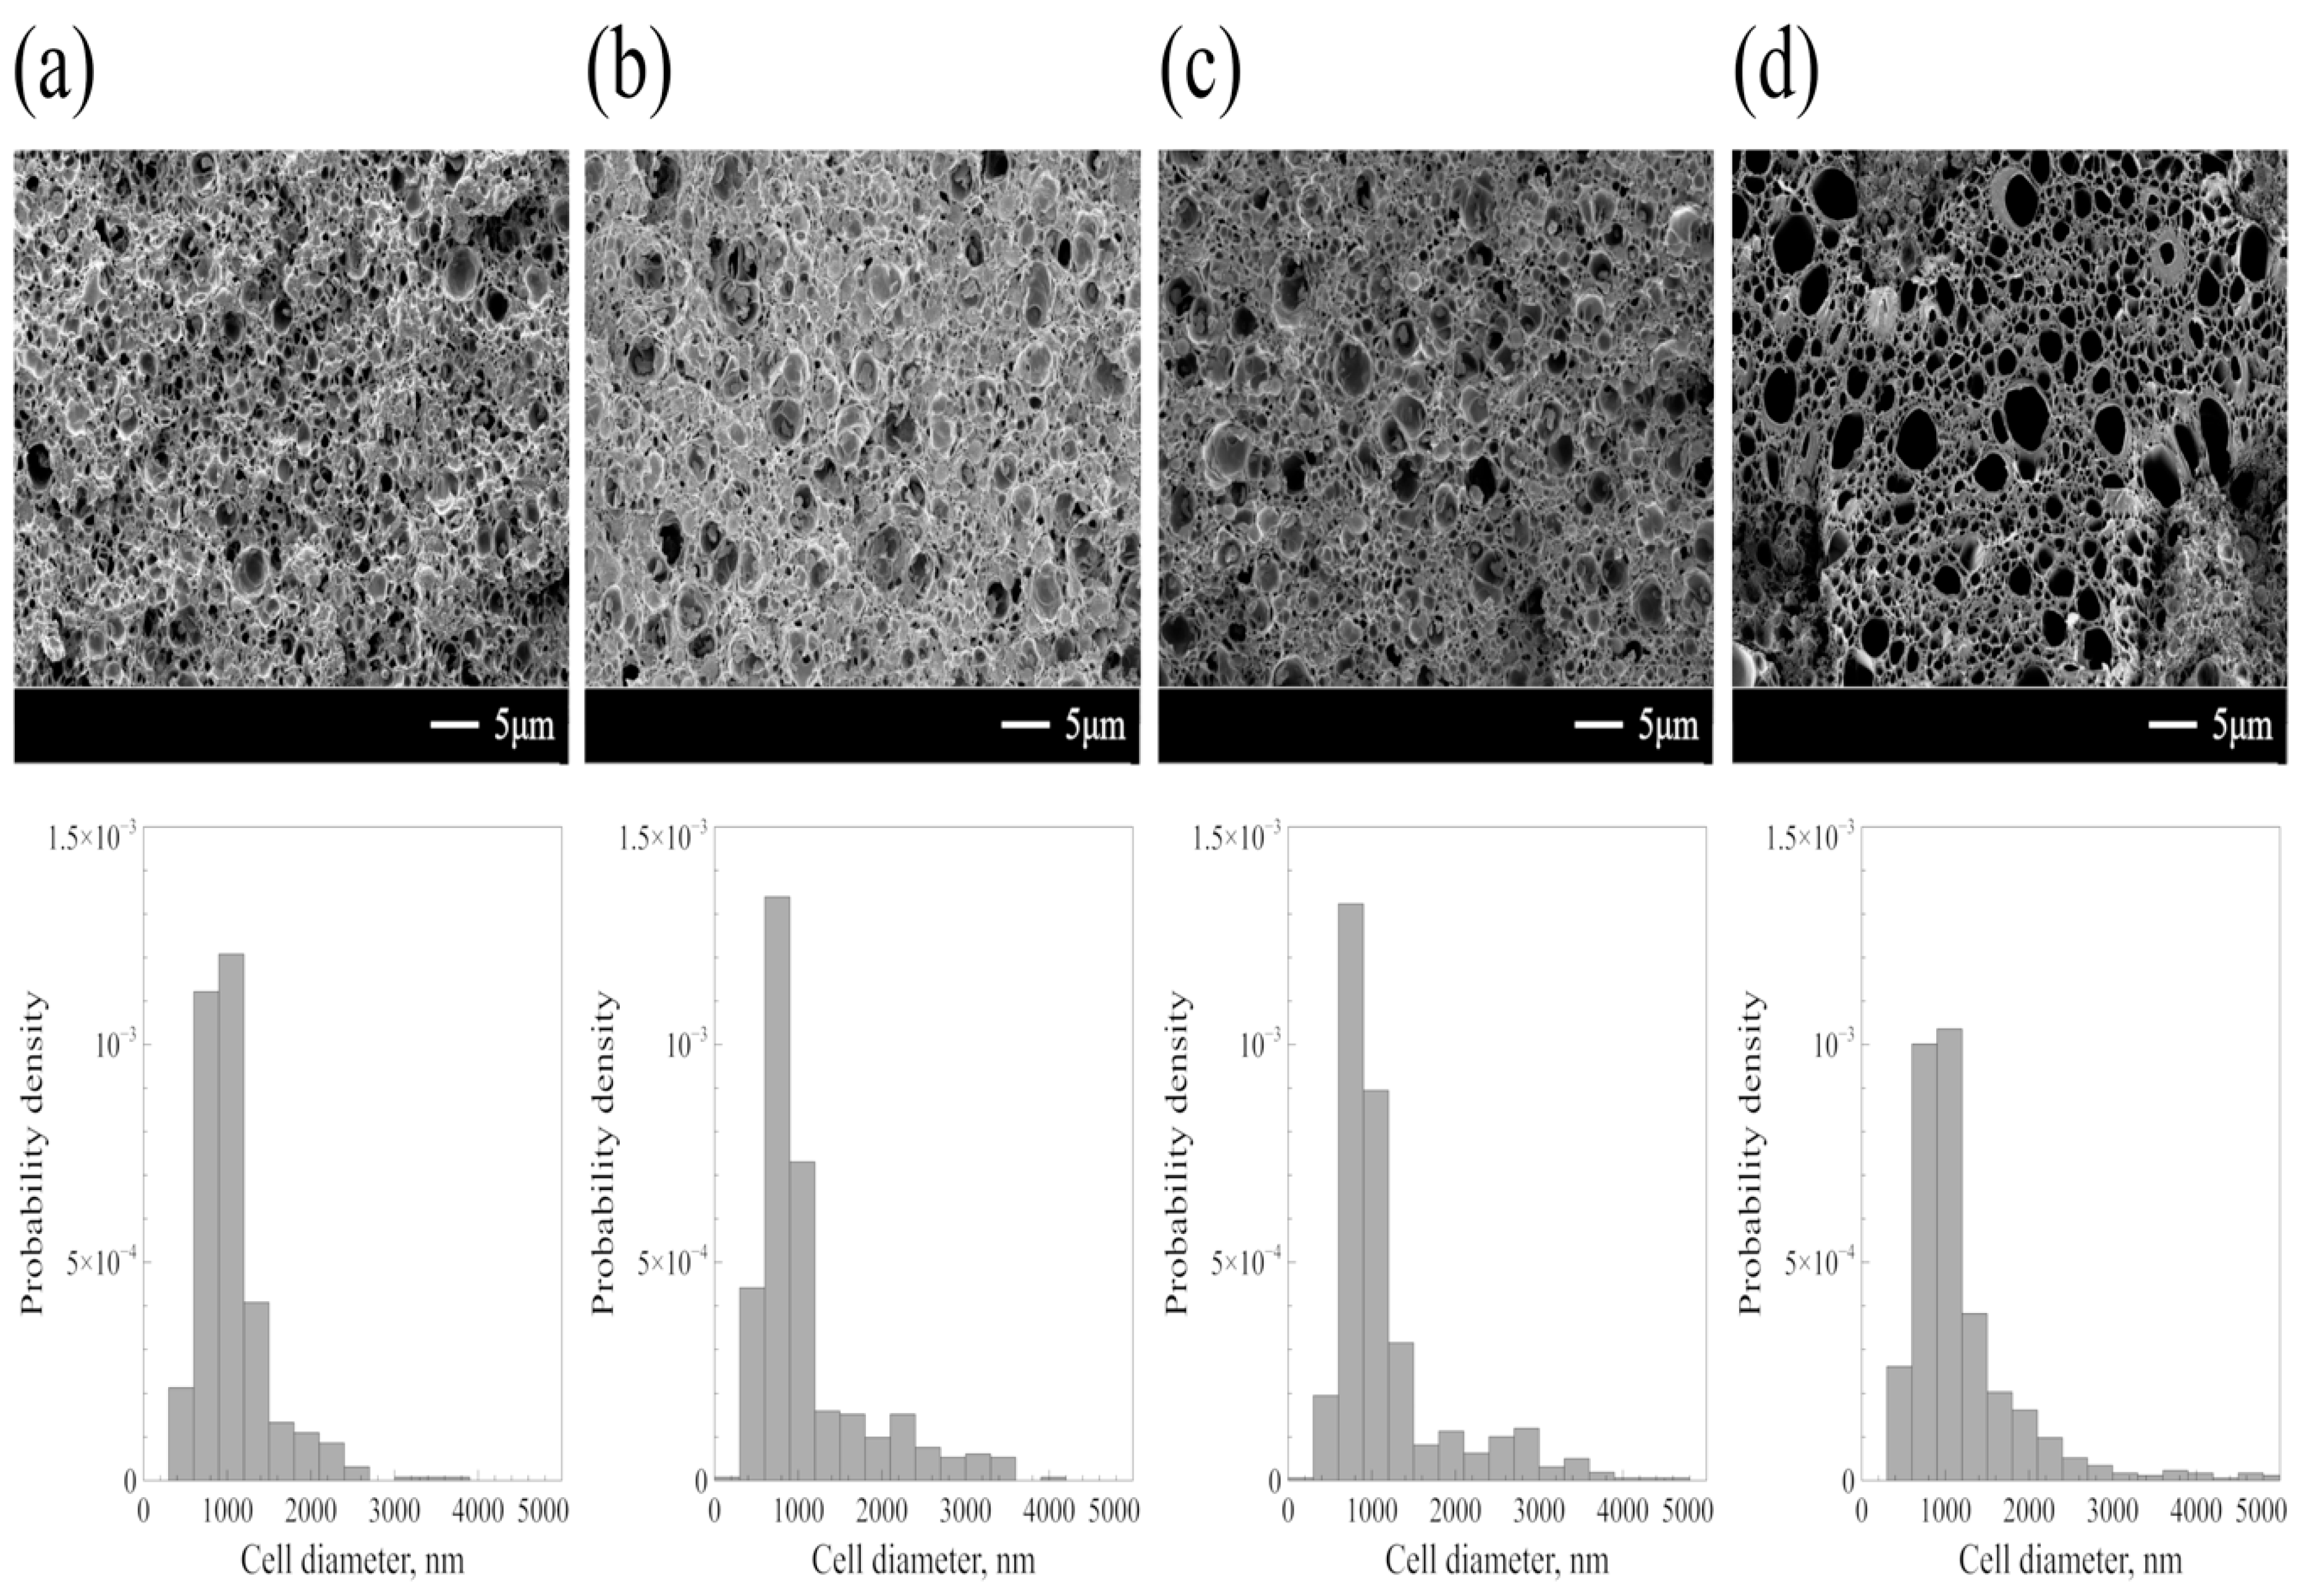
| Mean Cell Diameter, nm | Standard Deviation, nm | |
|---|---|---|
| 60 | 1068 | 445 |
| 80 | 1118 | 686 |
| 100 | 1192 | 717 |
| 120 | 1194 | 701 |
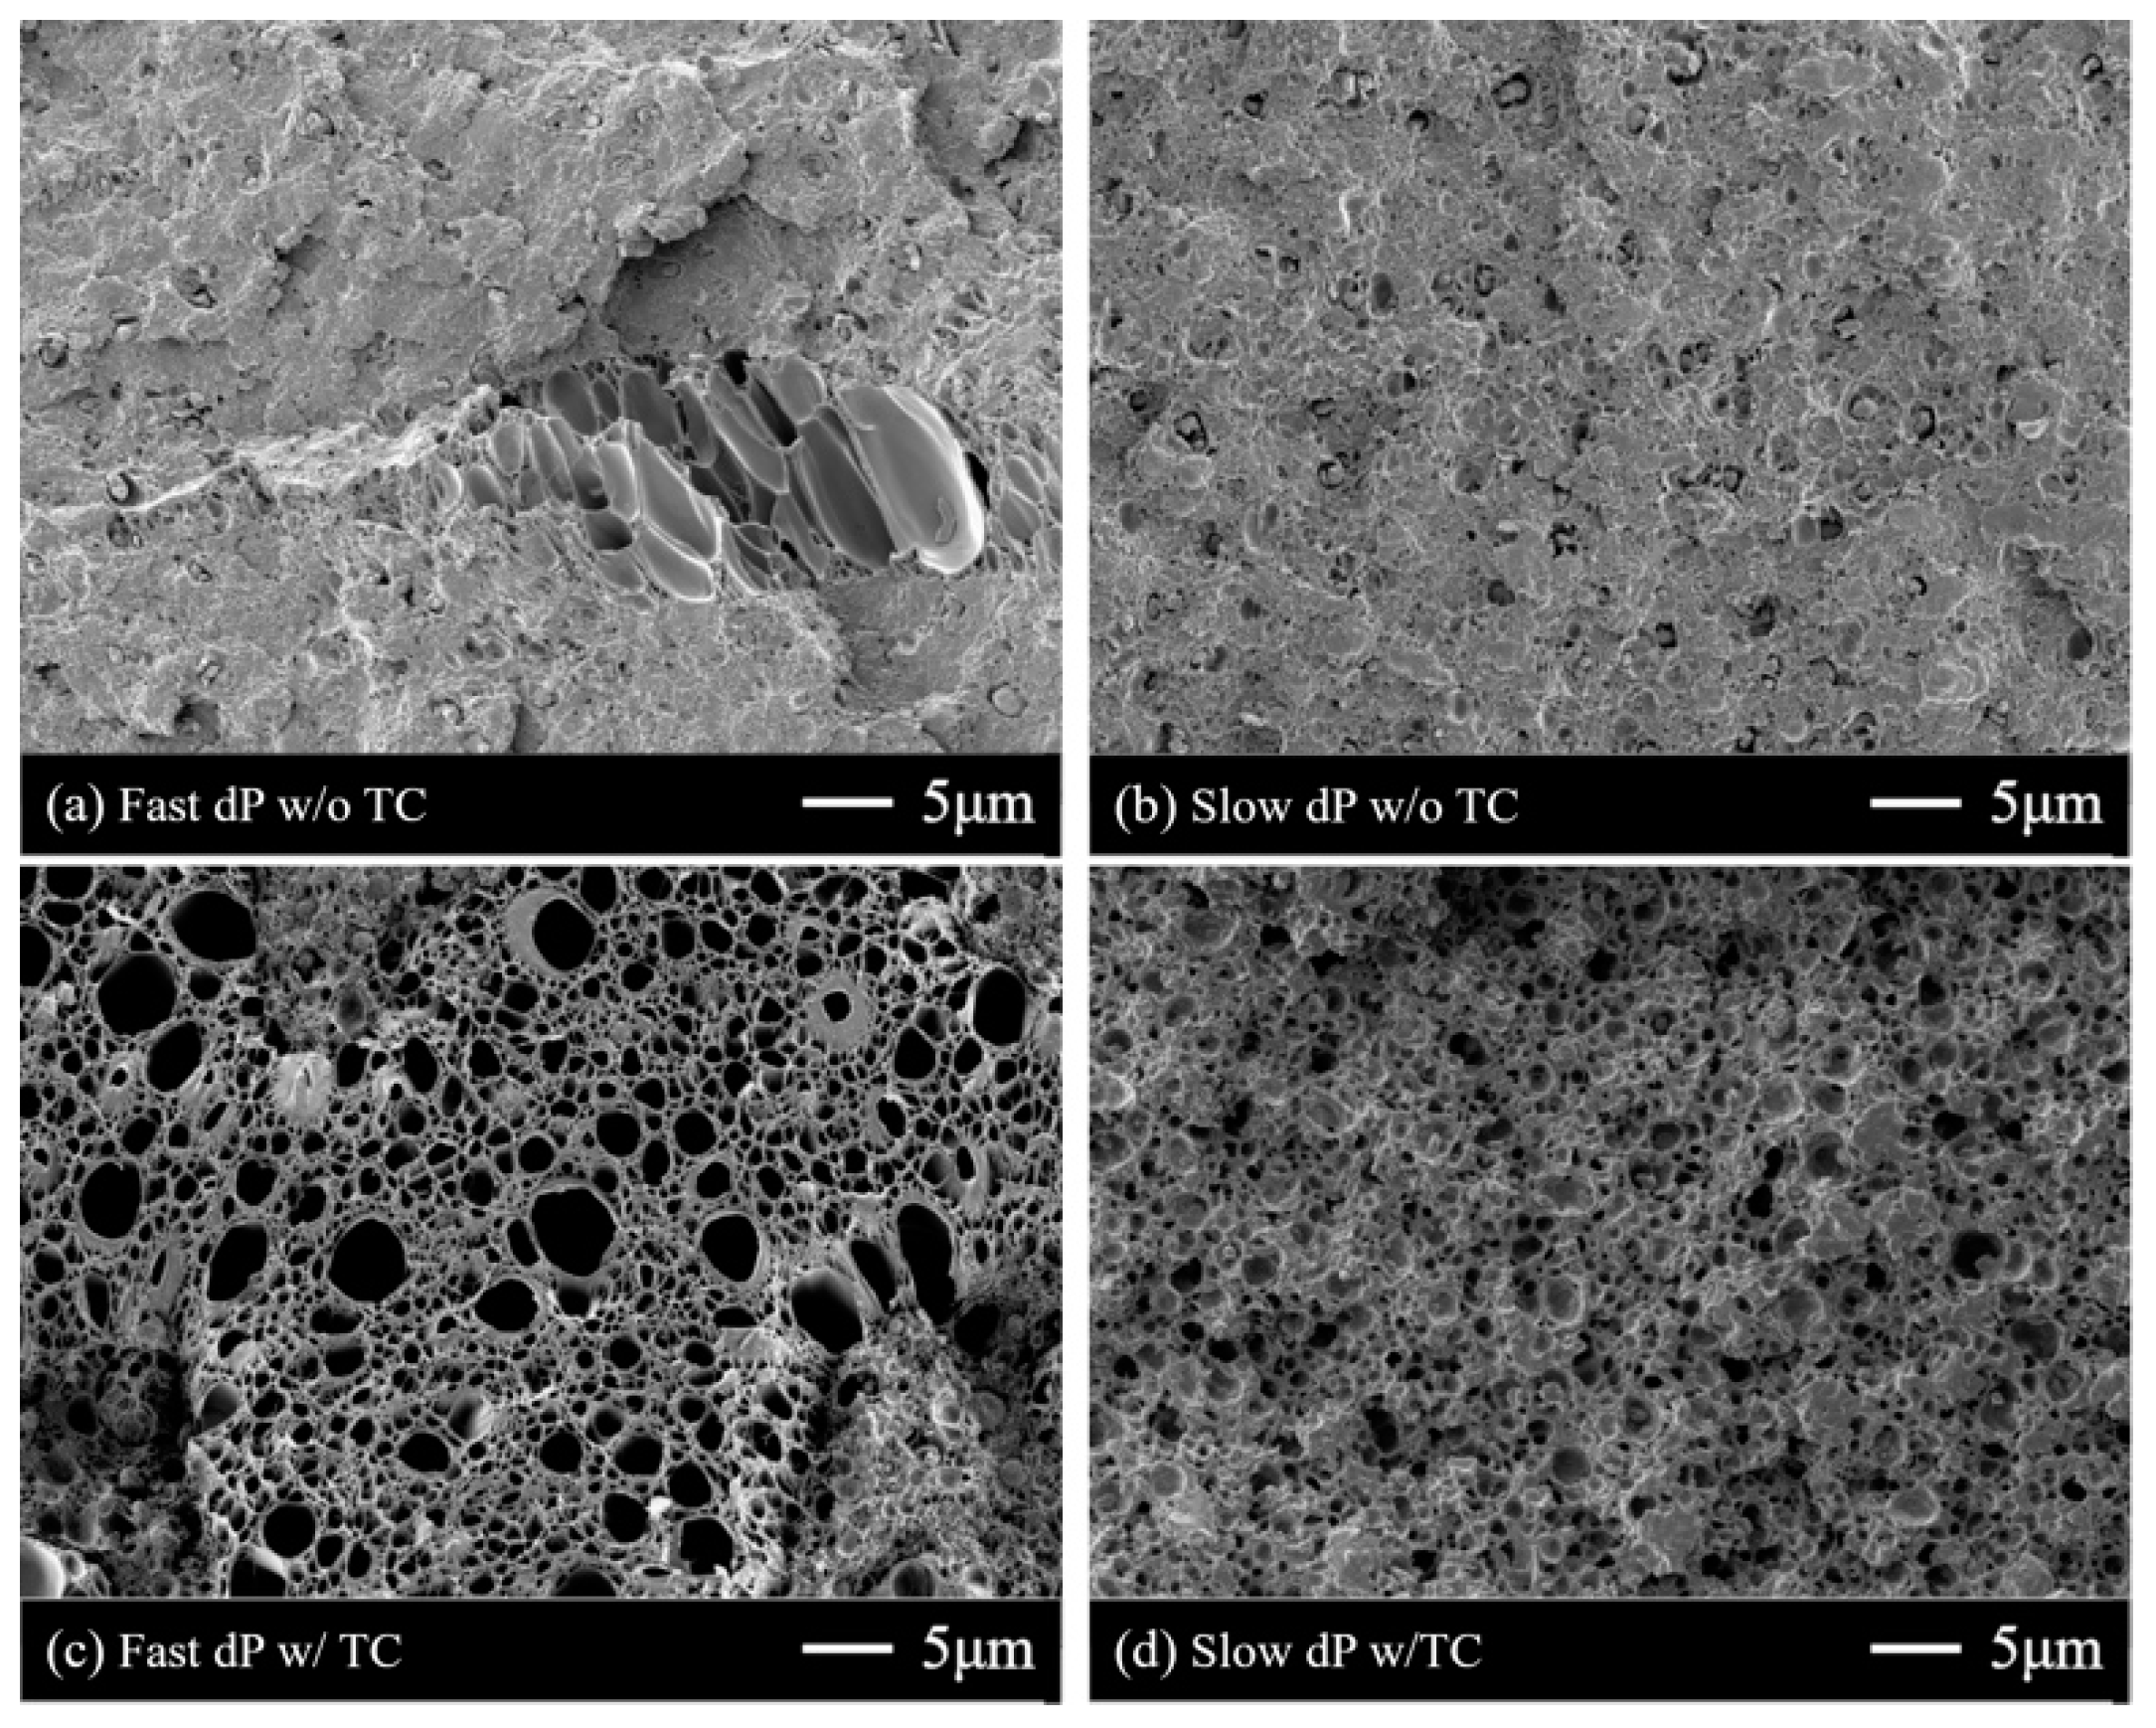
| Depressurization Rate | Mean Cell Diameter, nm | Sample Density, g/cm3 | Cell Number Density, 1012 cells/cm3 | The Remaining CO2, mg/g a |
|---|---|---|---|---|
| Fast | 1195 | 0.36 | 1.86 | 175.3 |
| Slow | 1060 | 0.40 | 0.69 | 154.3 |
© 2019 by the authors. Licensee MDPI, Basel, Switzerland. This article is an open access article distributed under the terms and conditions of the Creative Commons Attribution (CC BY) license (http://creativecommons.org/licenses/by/4.0/).
Share and Cite
Kwon, D.E.; Park, B.K.; Lee, Y.-W. Solid-State Foaming of Acrylonitrile-Butadiene-Styrene/Recycled Polyethylene Terephthalate Using Carbon Dioxide as a Blowing Agent. Polymers 2019, 11, 291. https://doi.org/10.3390/polym11020291
Kwon DE, Park BK, Lee Y-W. Solid-State Foaming of Acrylonitrile-Butadiene-Styrene/Recycled Polyethylene Terephthalate Using Carbon Dioxide as a Blowing Agent. Polymers. 2019; 11(2):291. https://doi.org/10.3390/polym11020291
Chicago/Turabian StyleKwon, Dong Eui, Byung Kyu Park, and Youn-Woo Lee. 2019. "Solid-State Foaming of Acrylonitrile-Butadiene-Styrene/Recycled Polyethylene Terephthalate Using Carbon Dioxide as a Blowing Agent" Polymers 11, no. 2: 291. https://doi.org/10.3390/polym11020291