Evolution of Interfacial Friction Angle and Contact Area of Polymer Pellets during the Initial Stage of Ultrasonic Plasticization

Abstract
:
1. Introduction
2. Experimentation
2.1. Materials
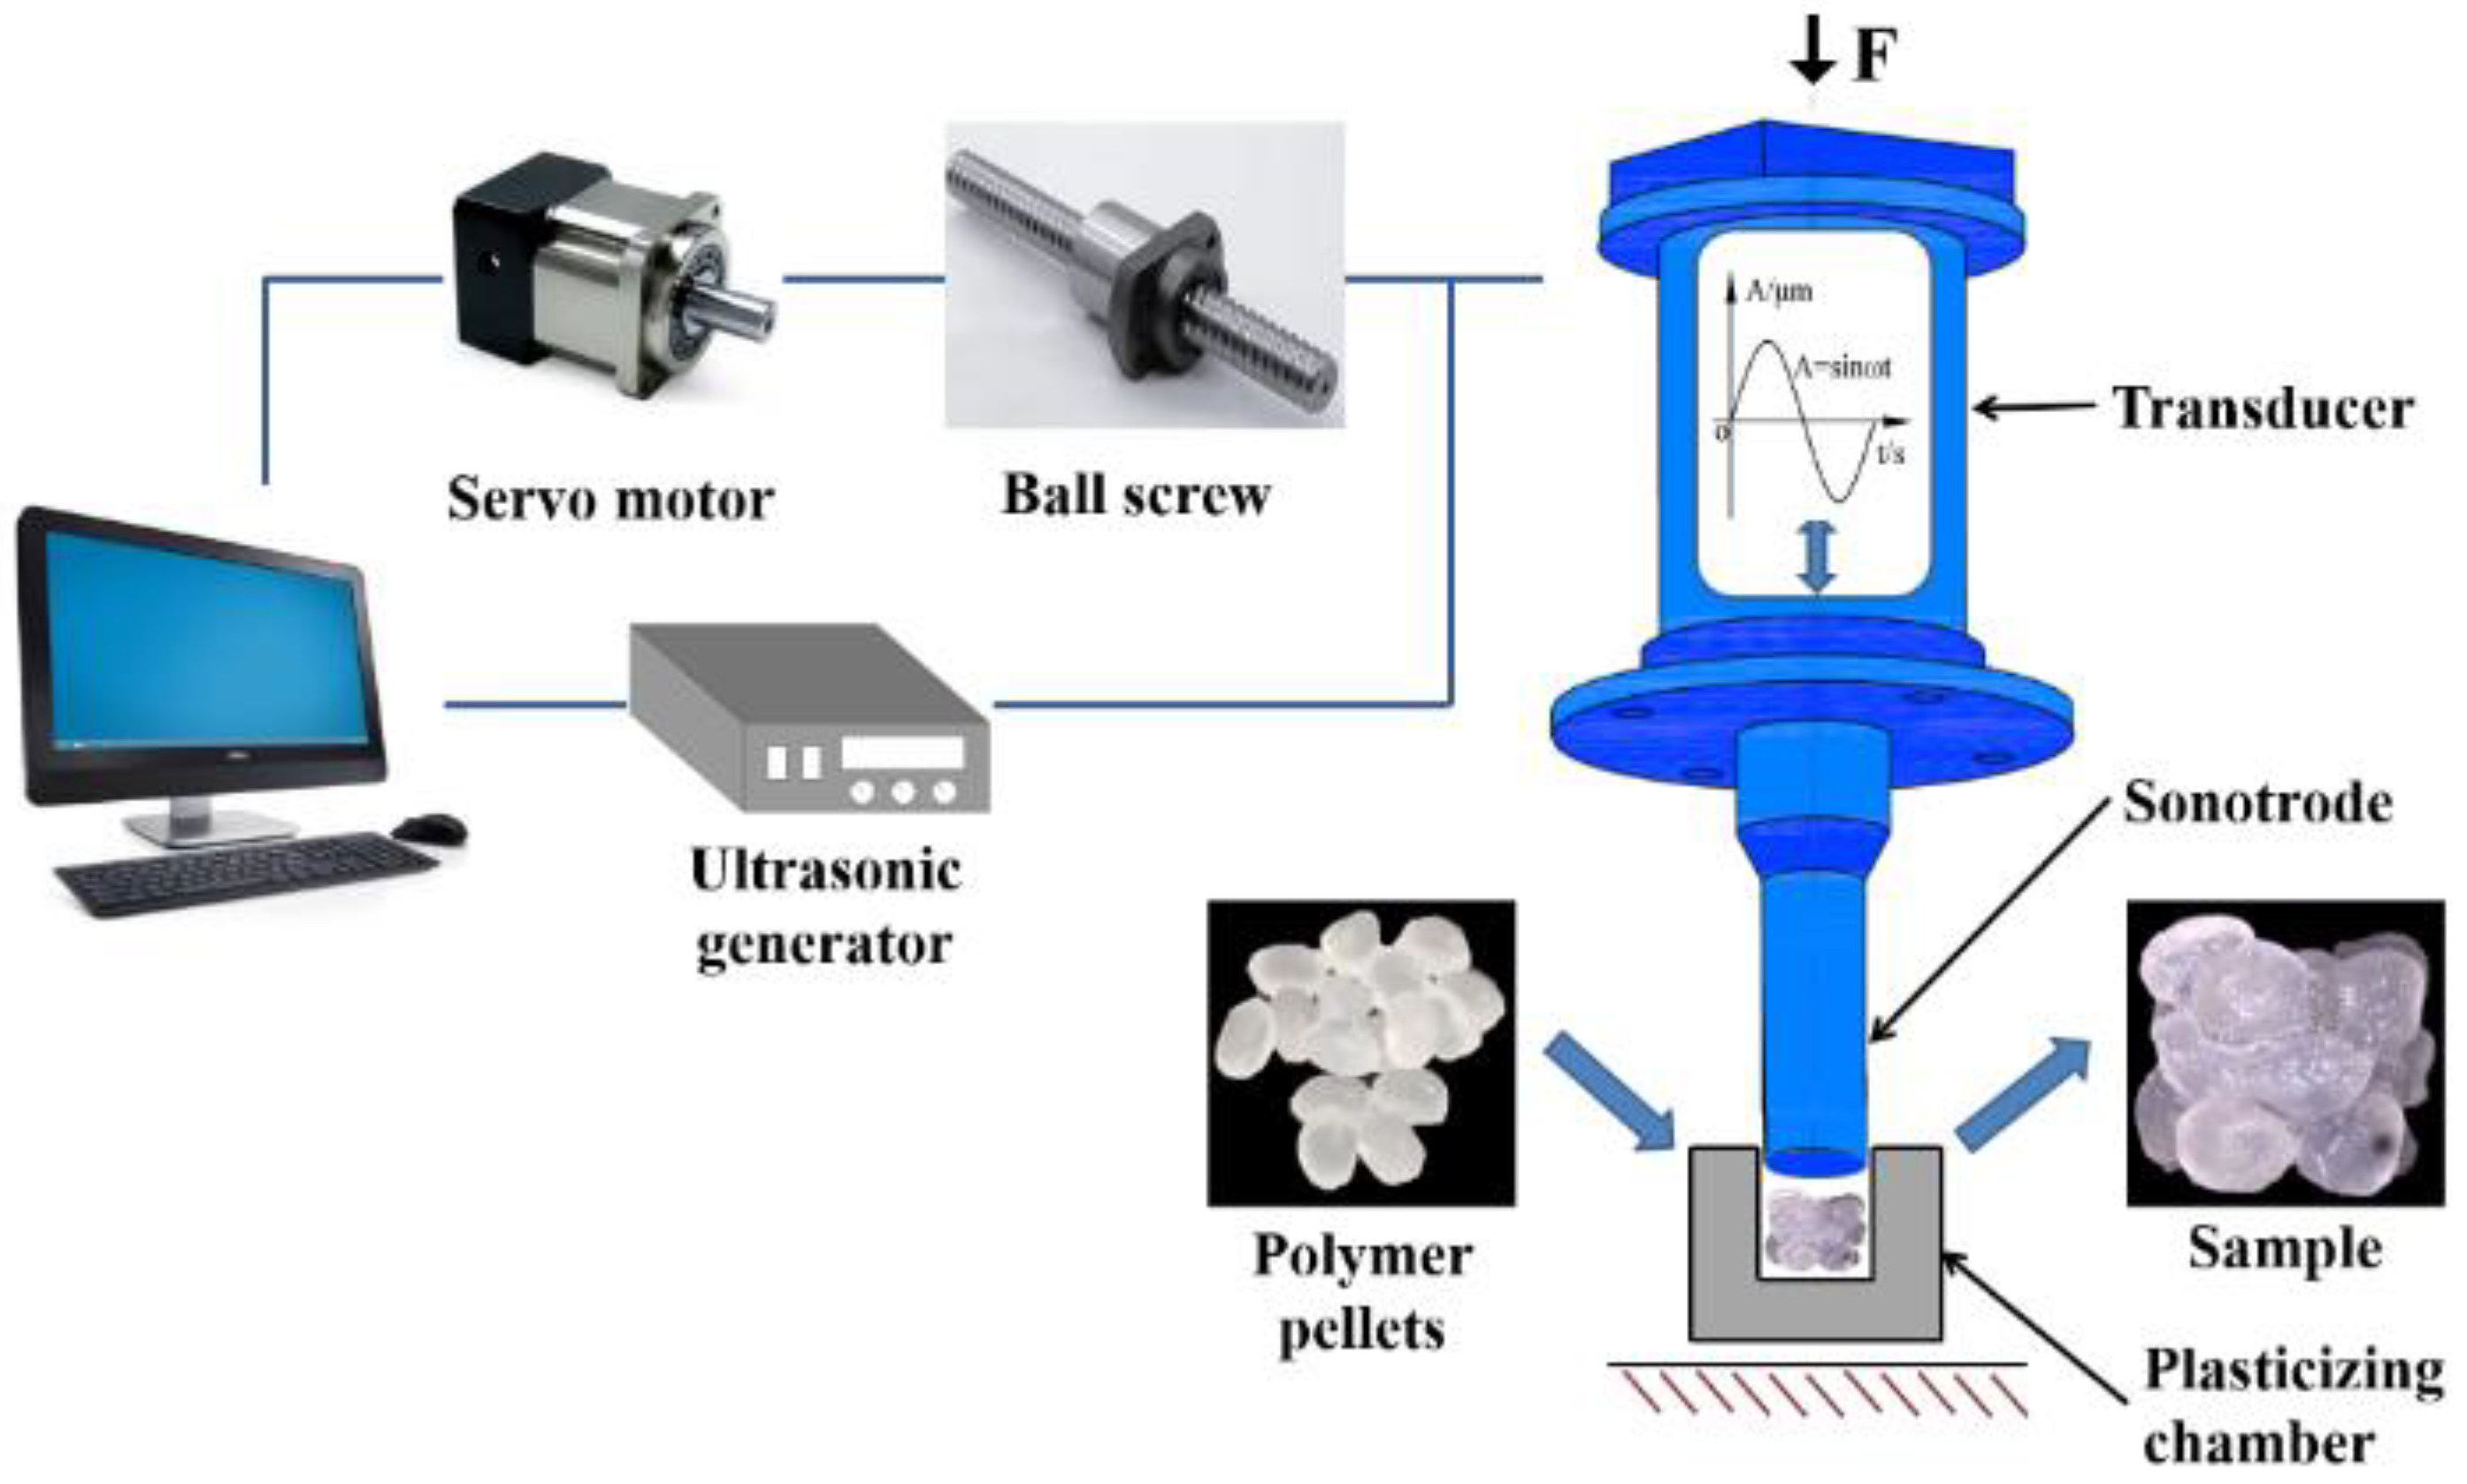
2.2. Equipment
2.3. Methodology
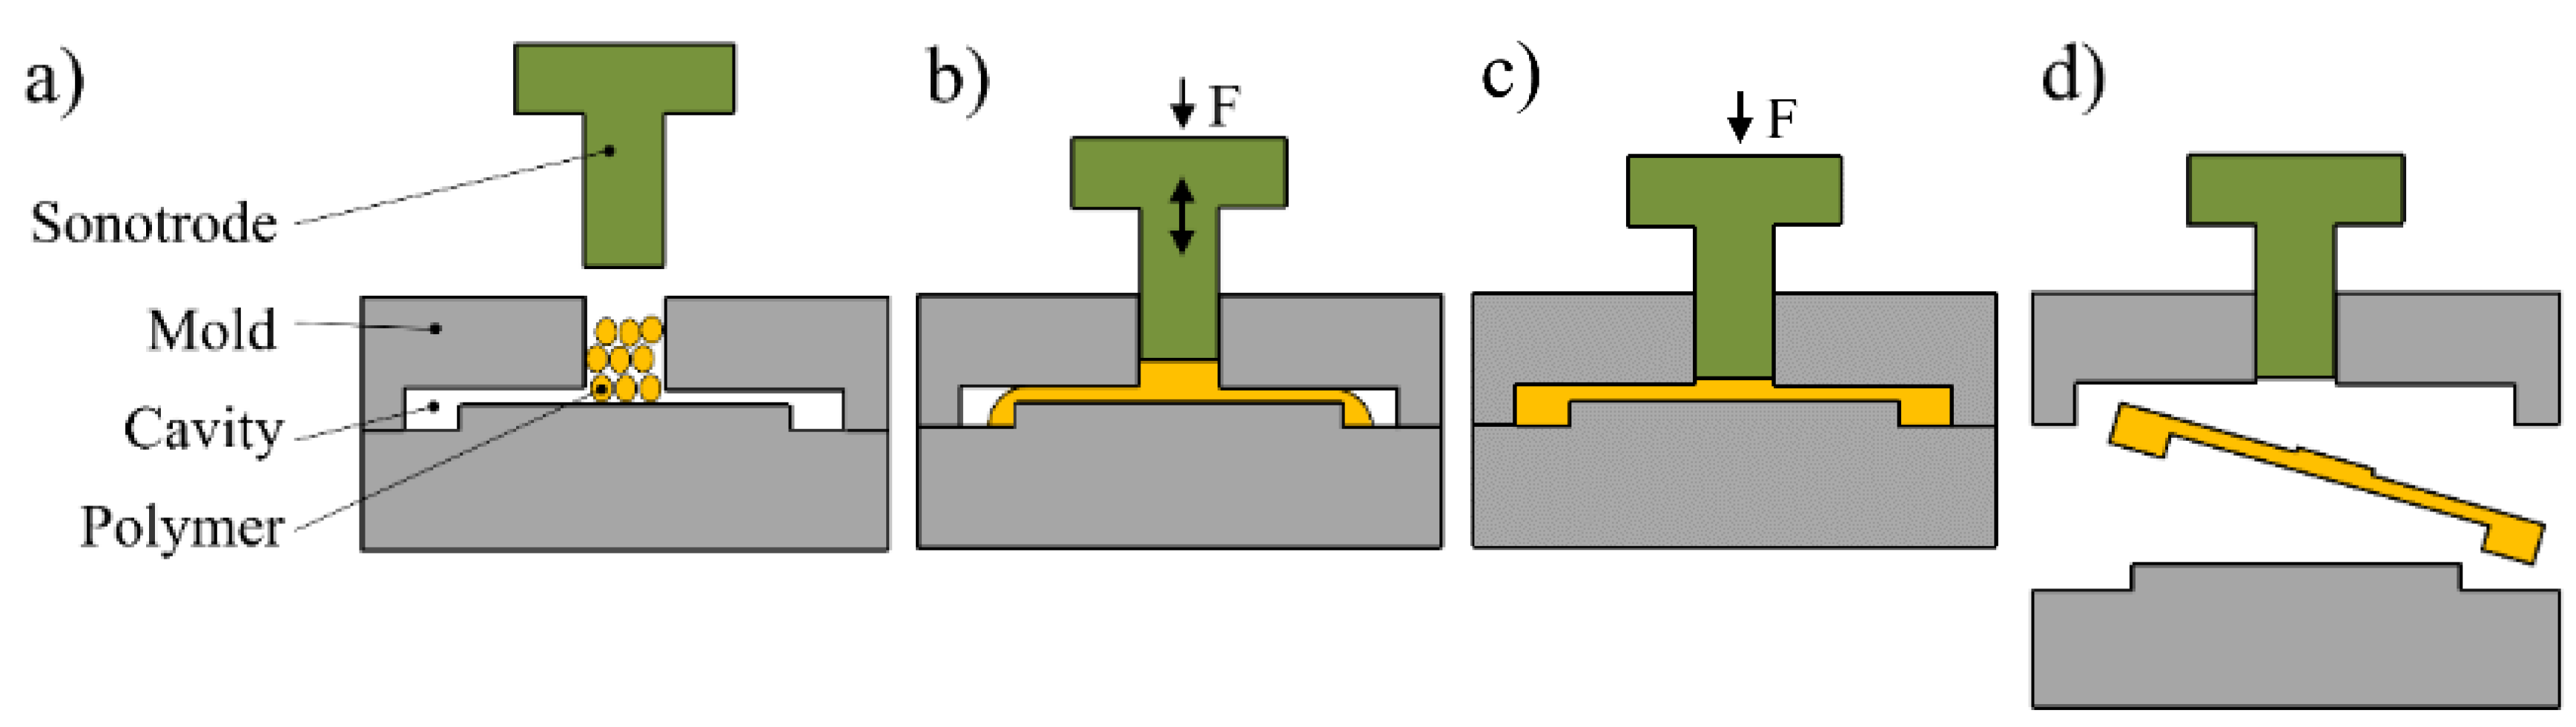
2.3.1. Experiment Process
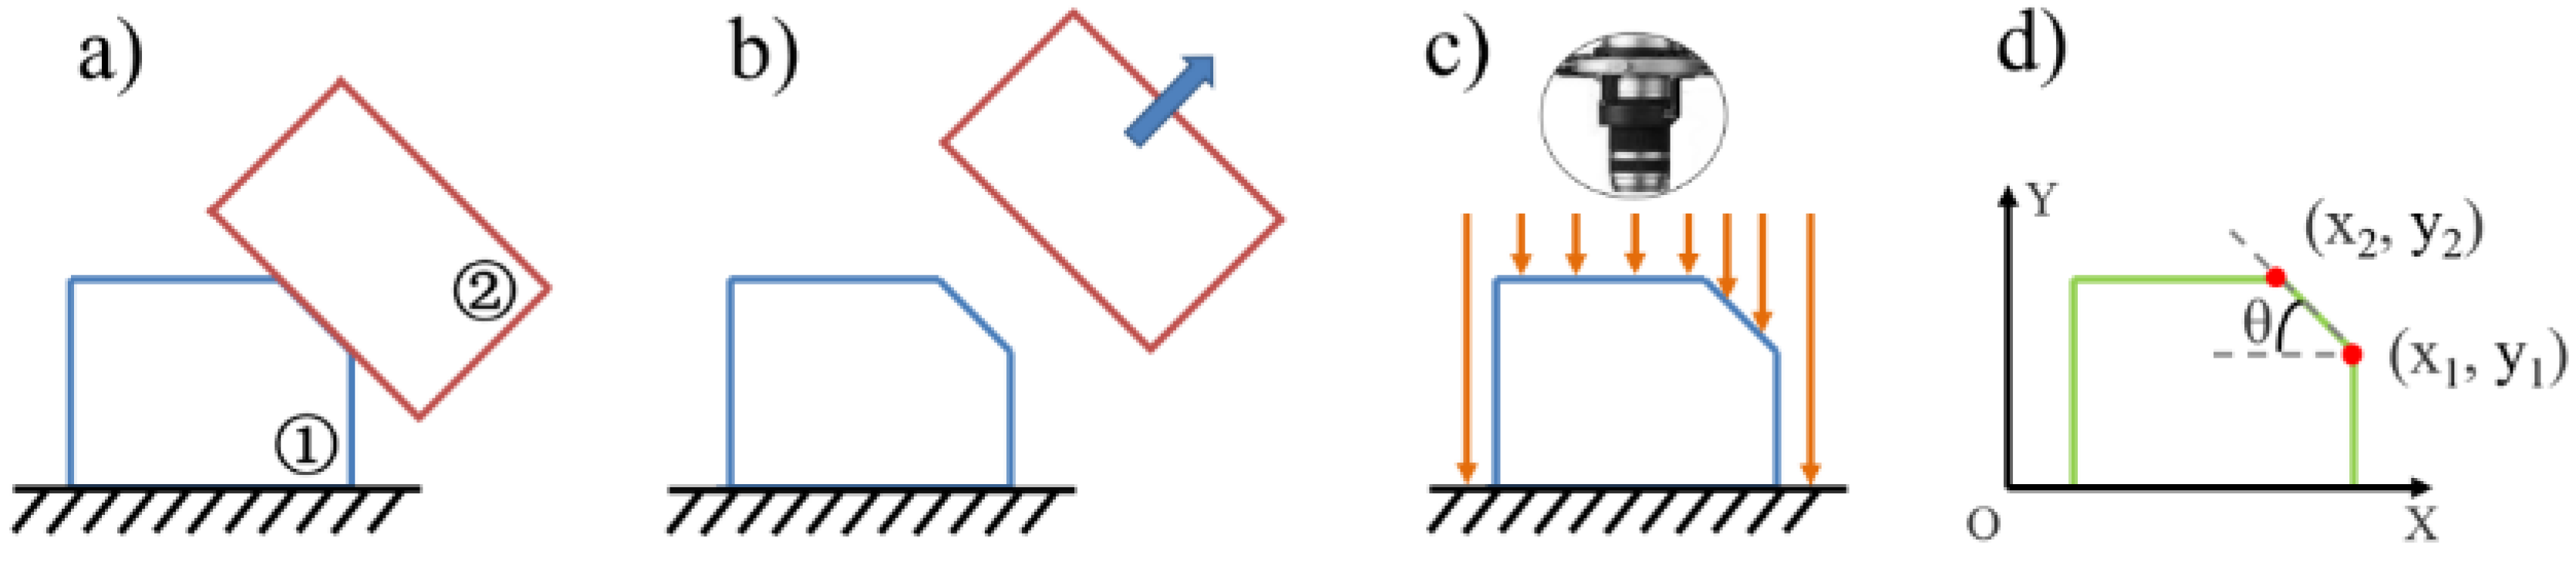
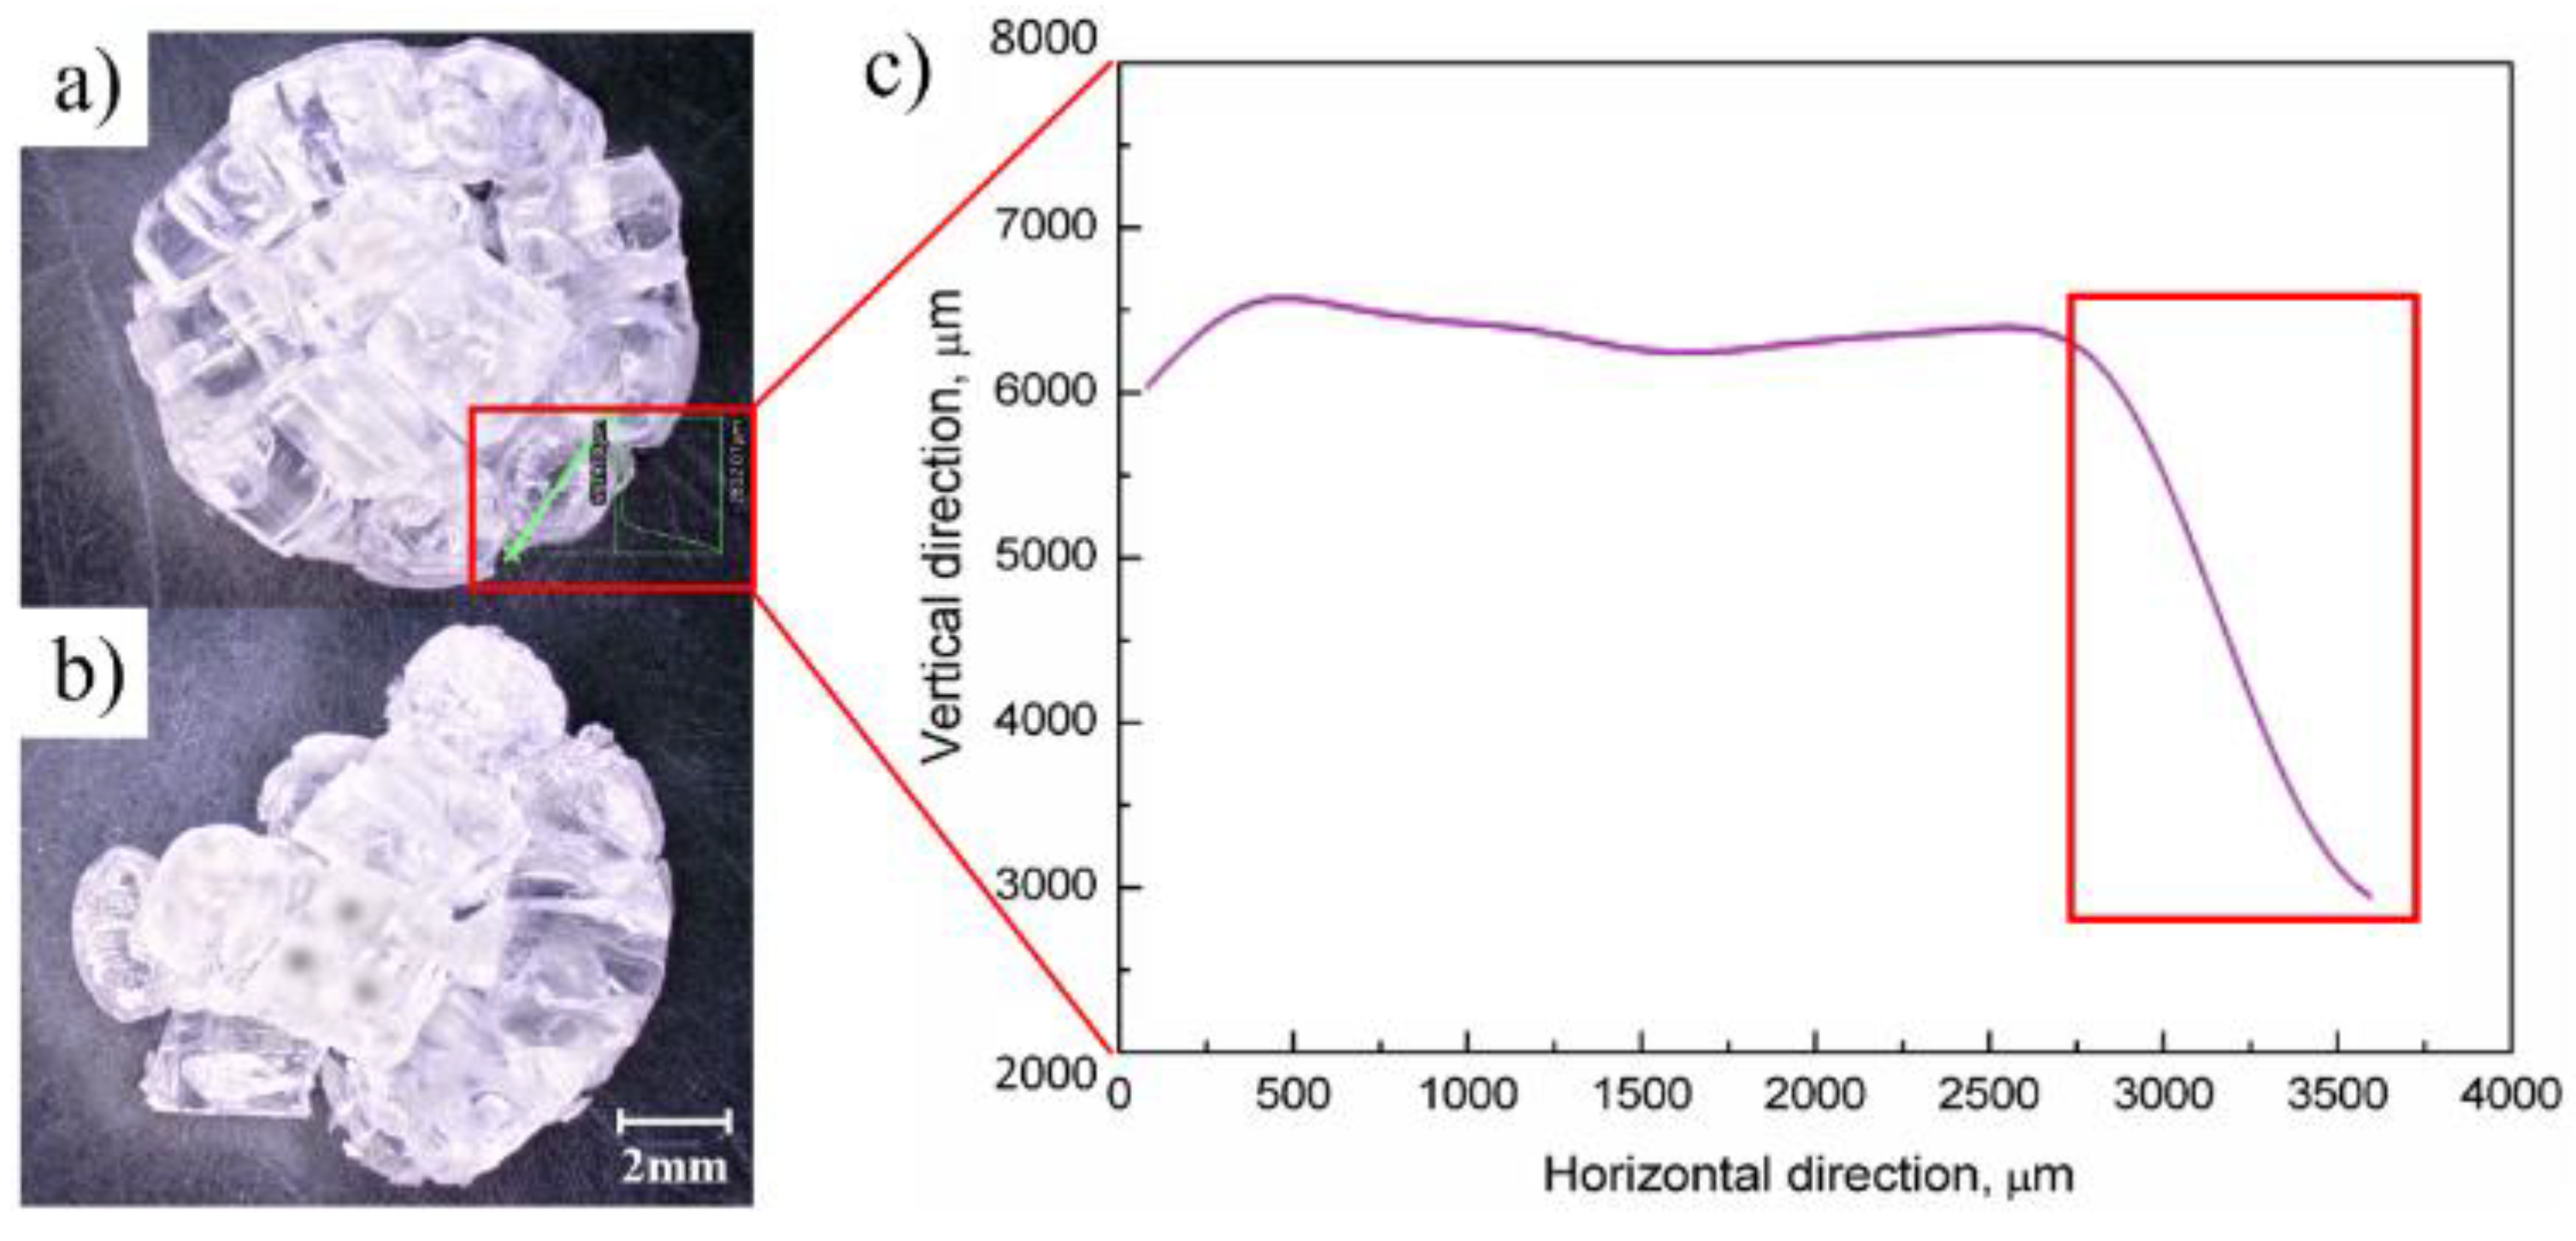
2.3.2. Measurement
3. Results and Discussion
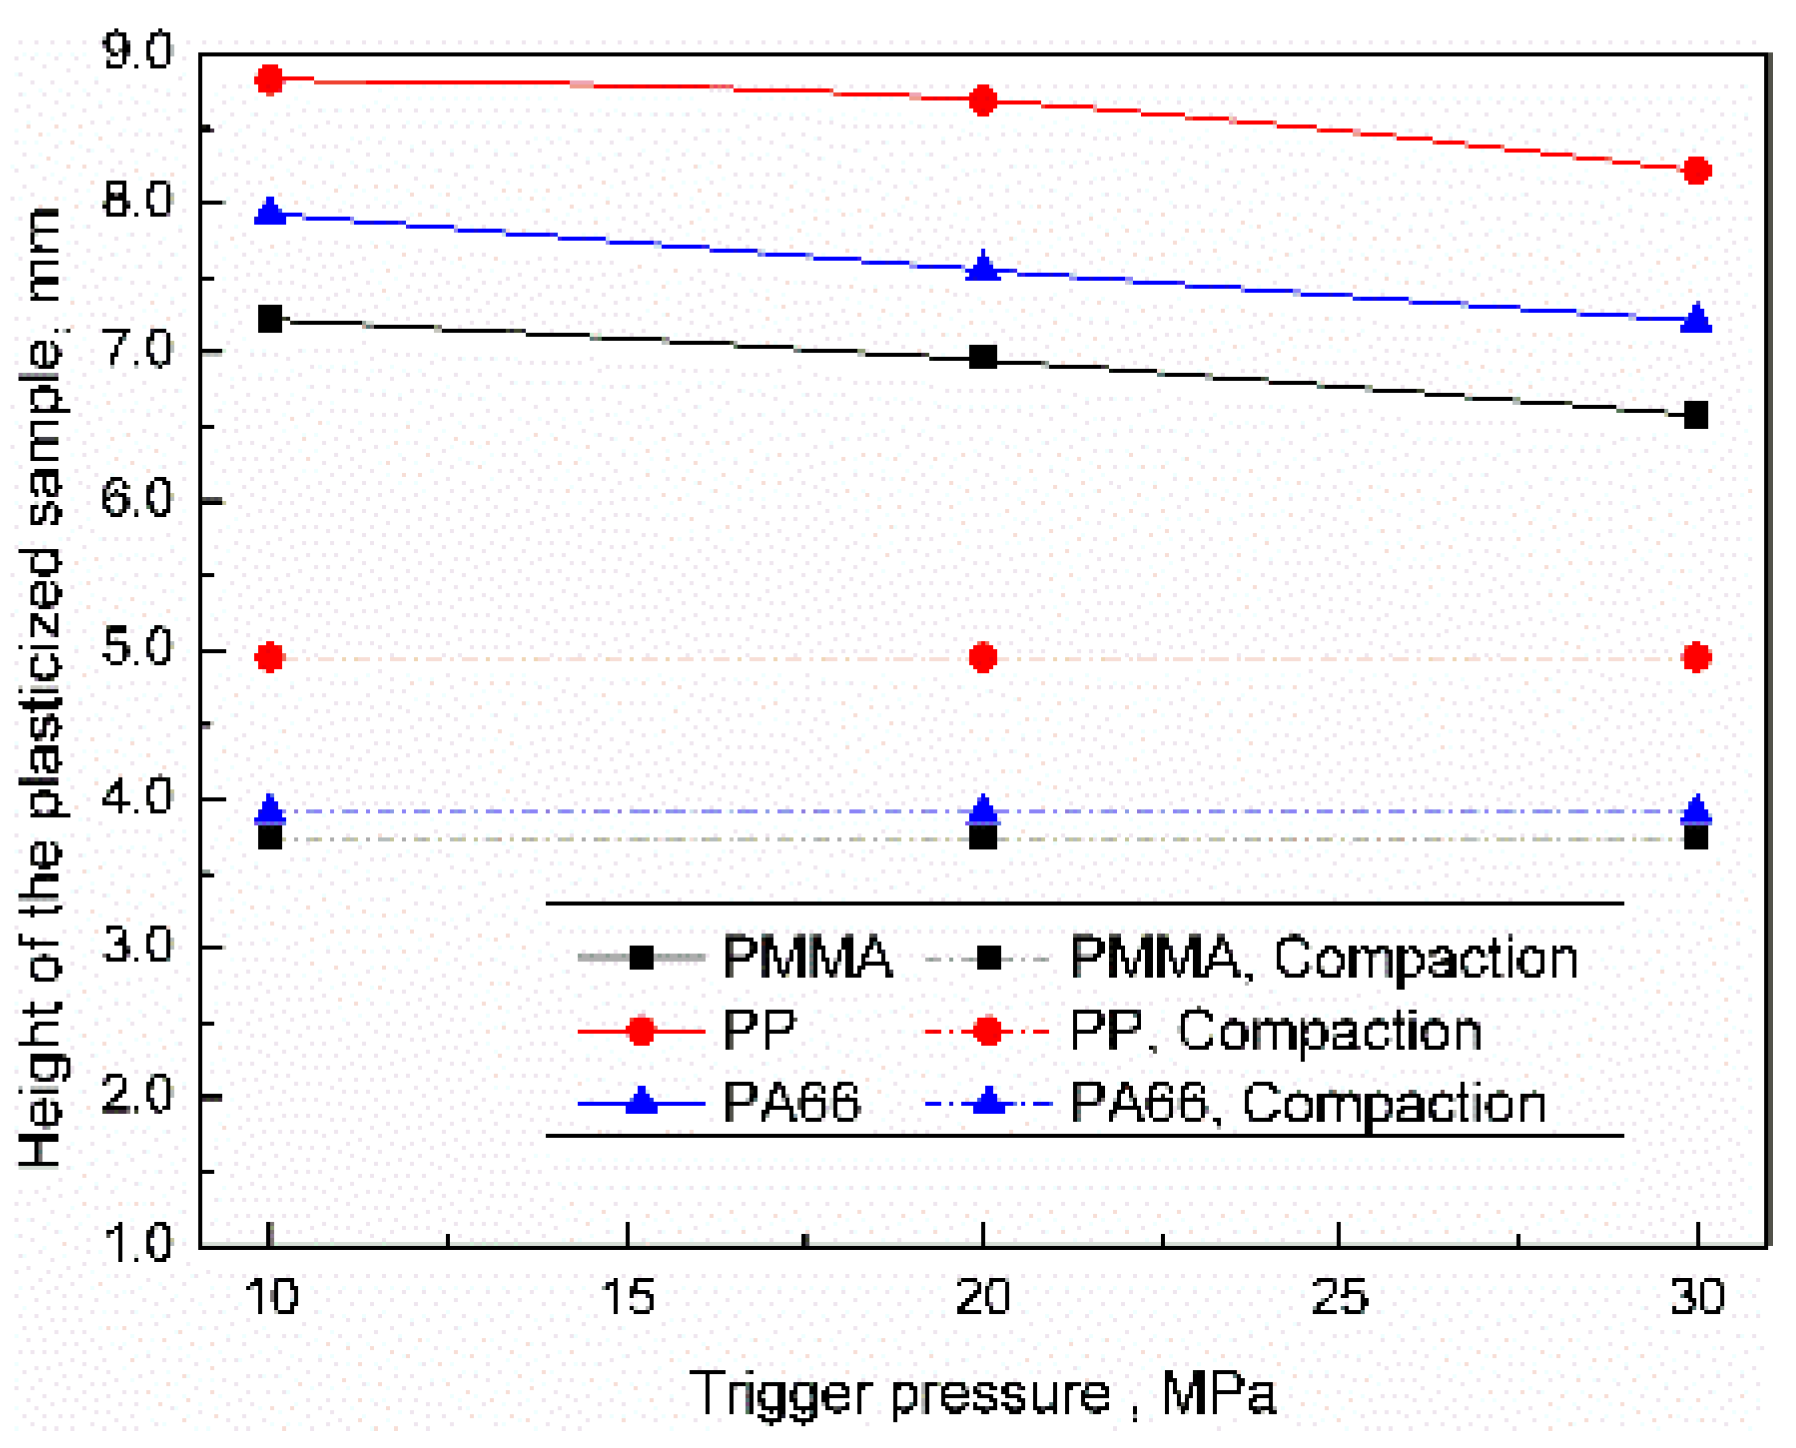
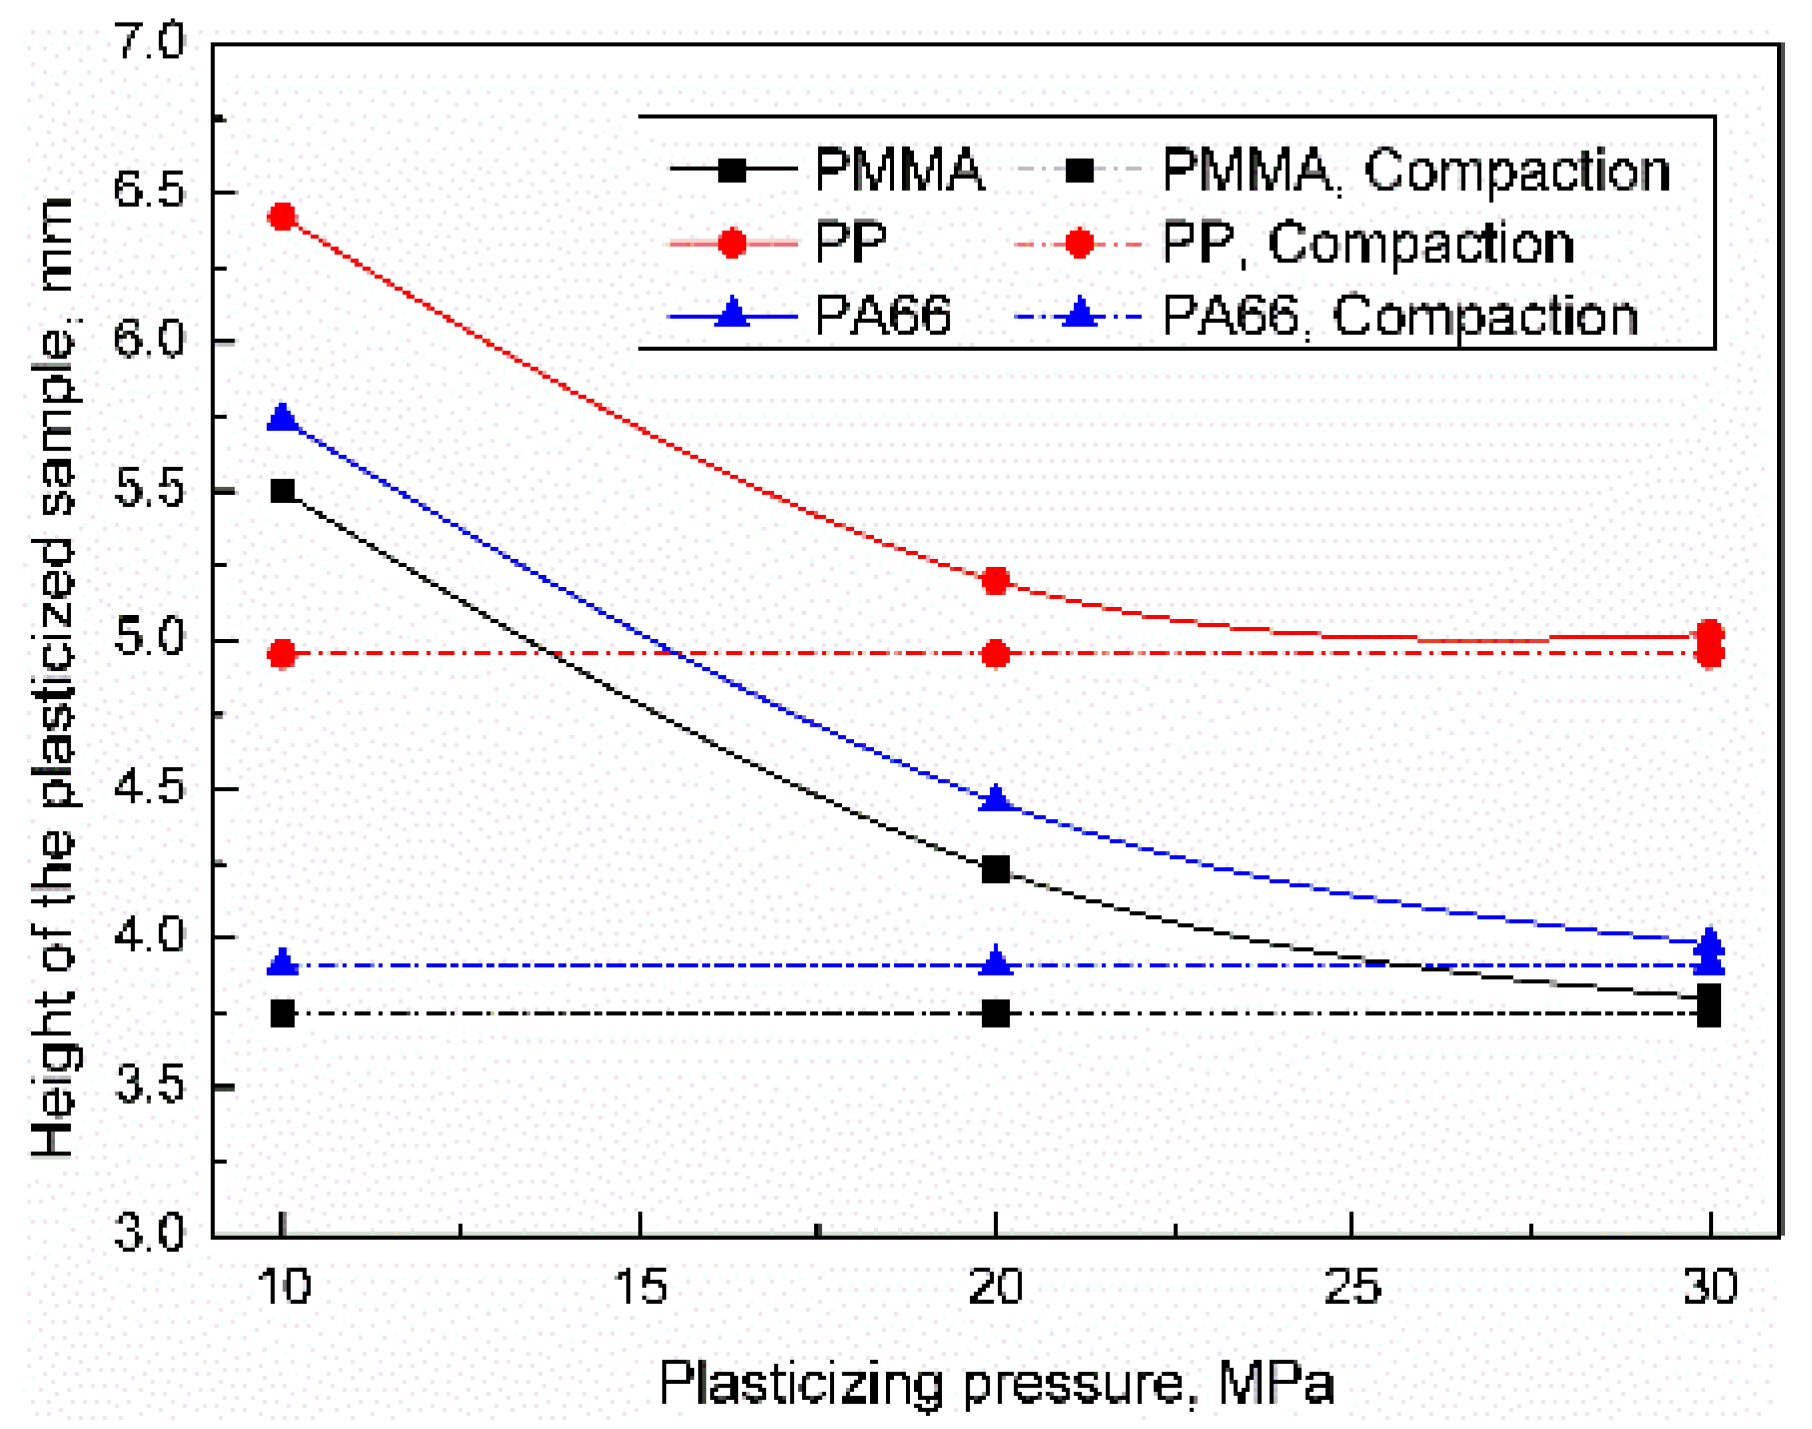
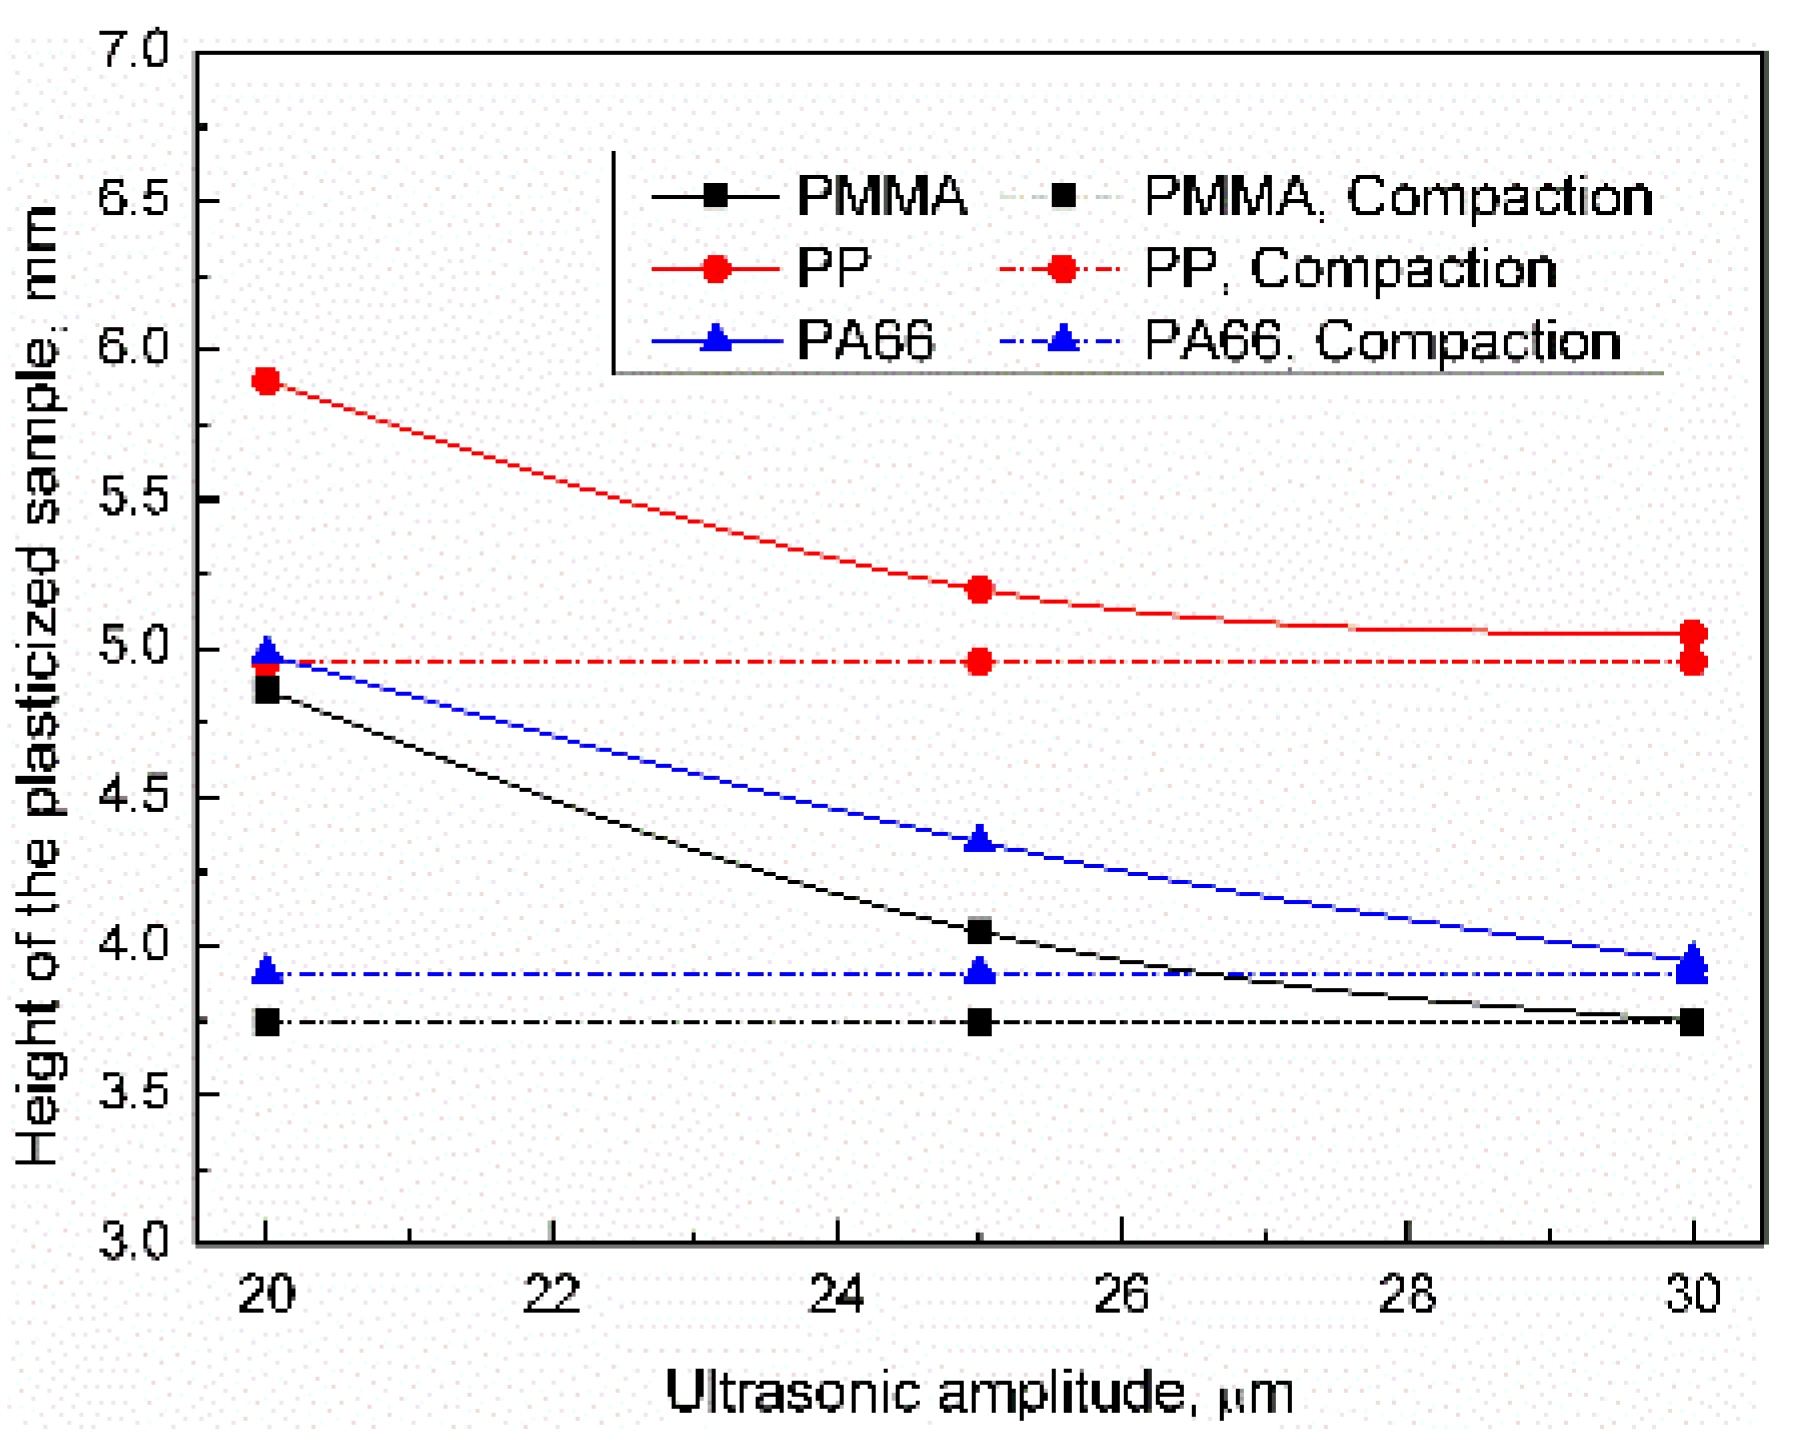
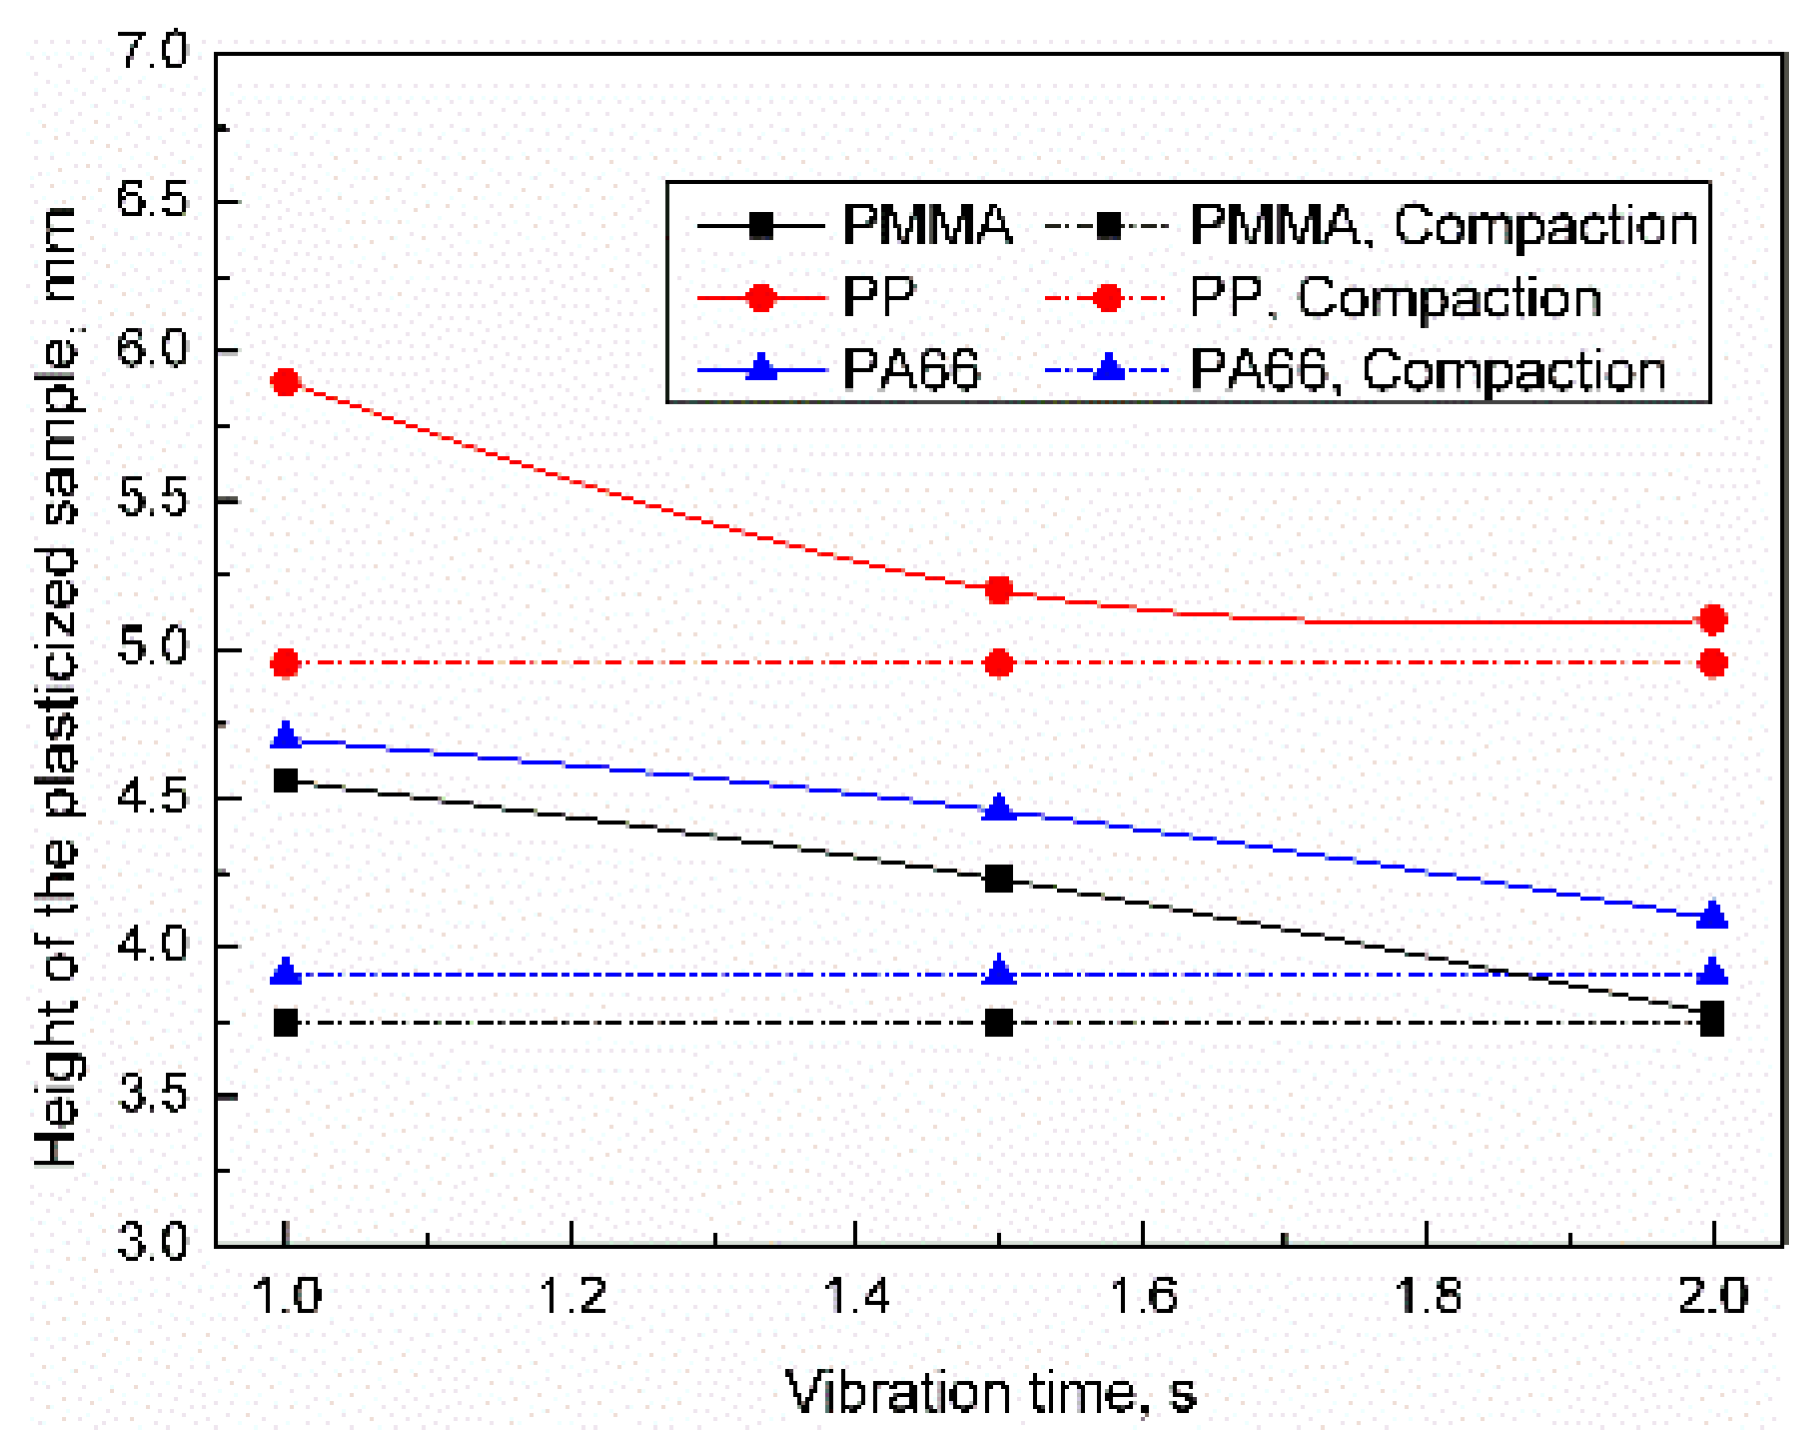
3.1. Height of Plasticized Sample
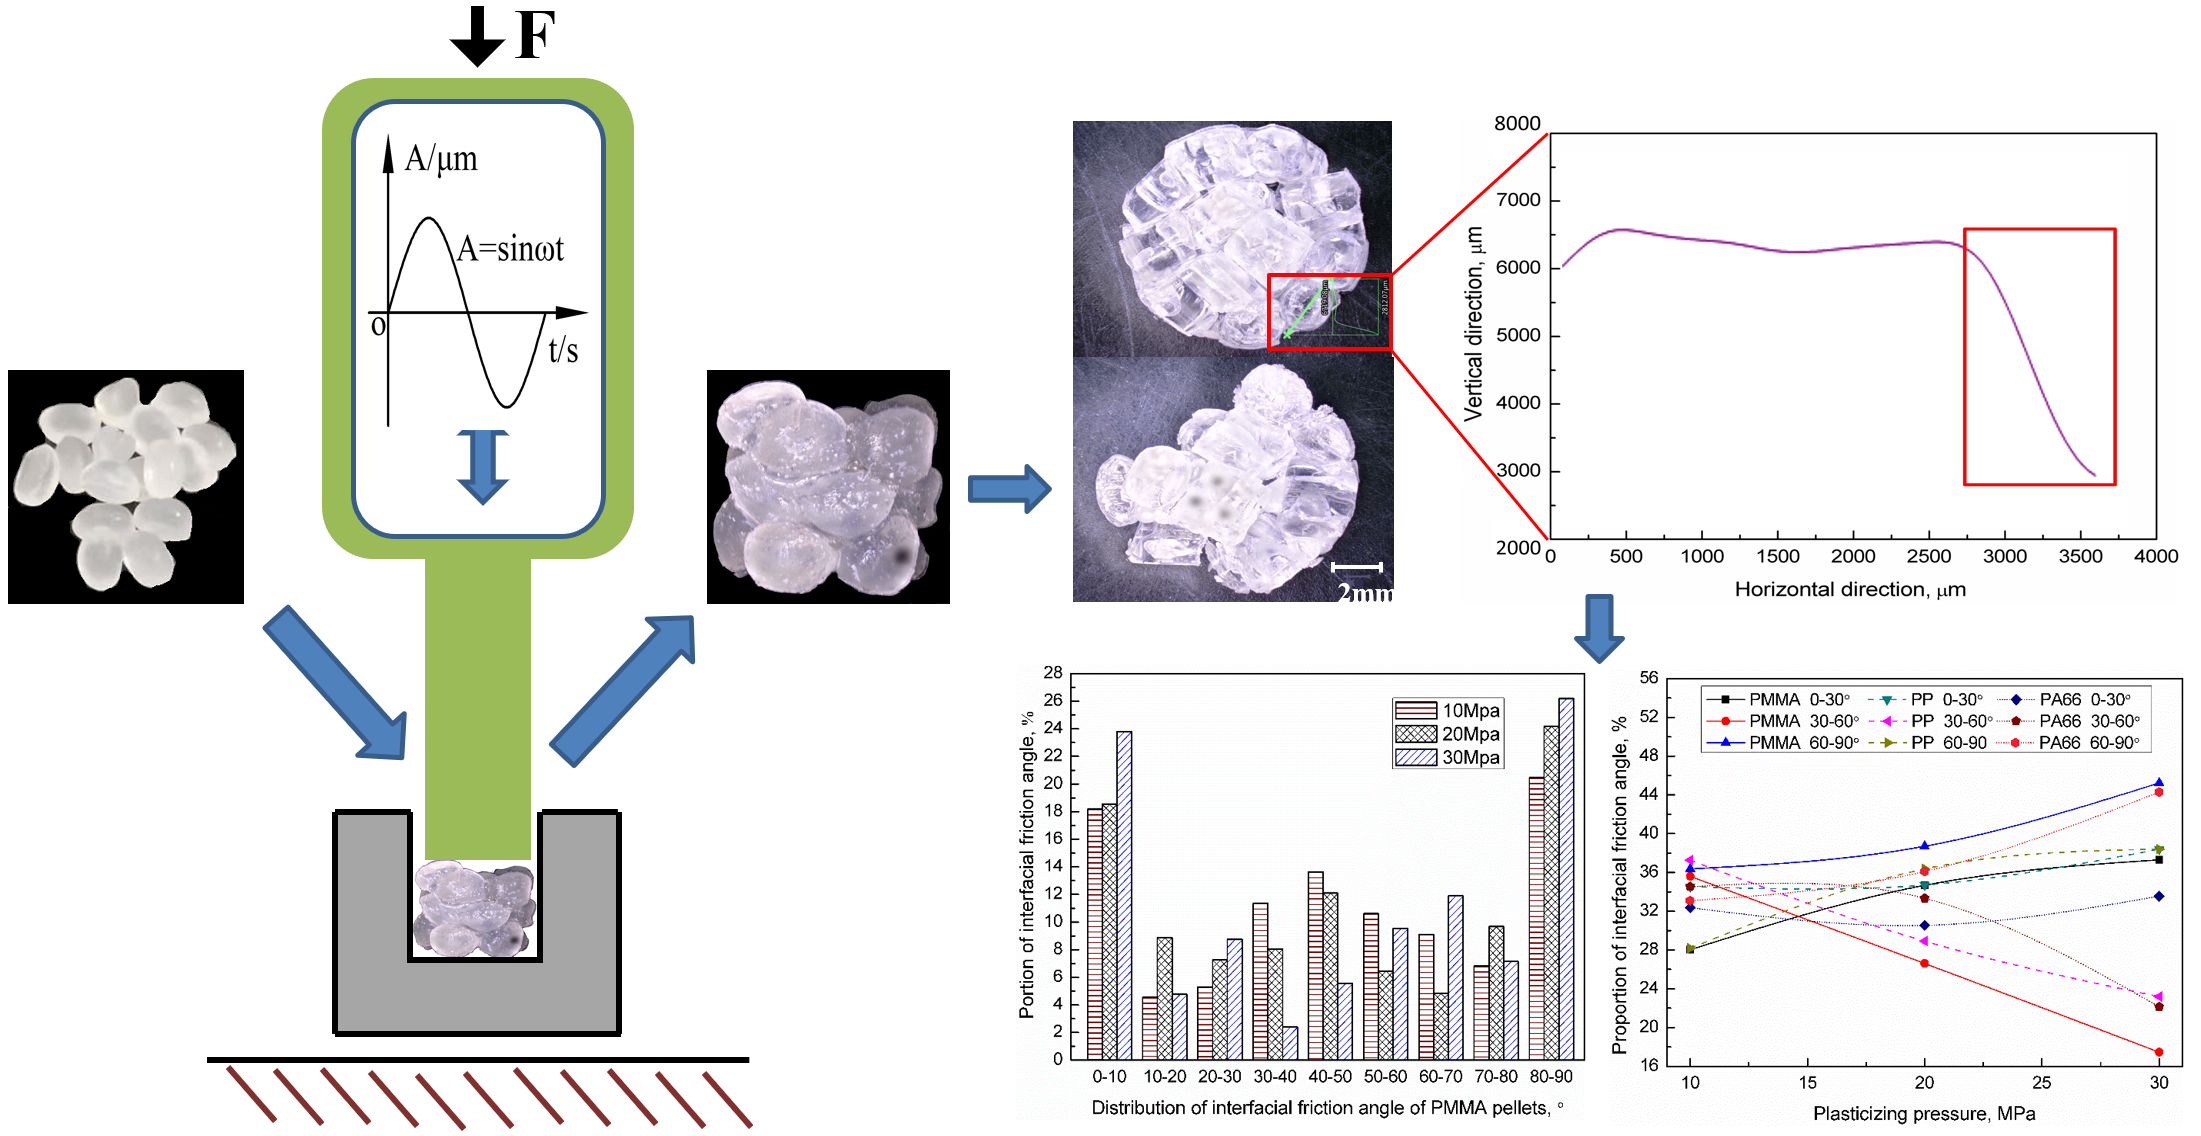
3.2. Interfacial Friction Angle of the Polymer Pellets
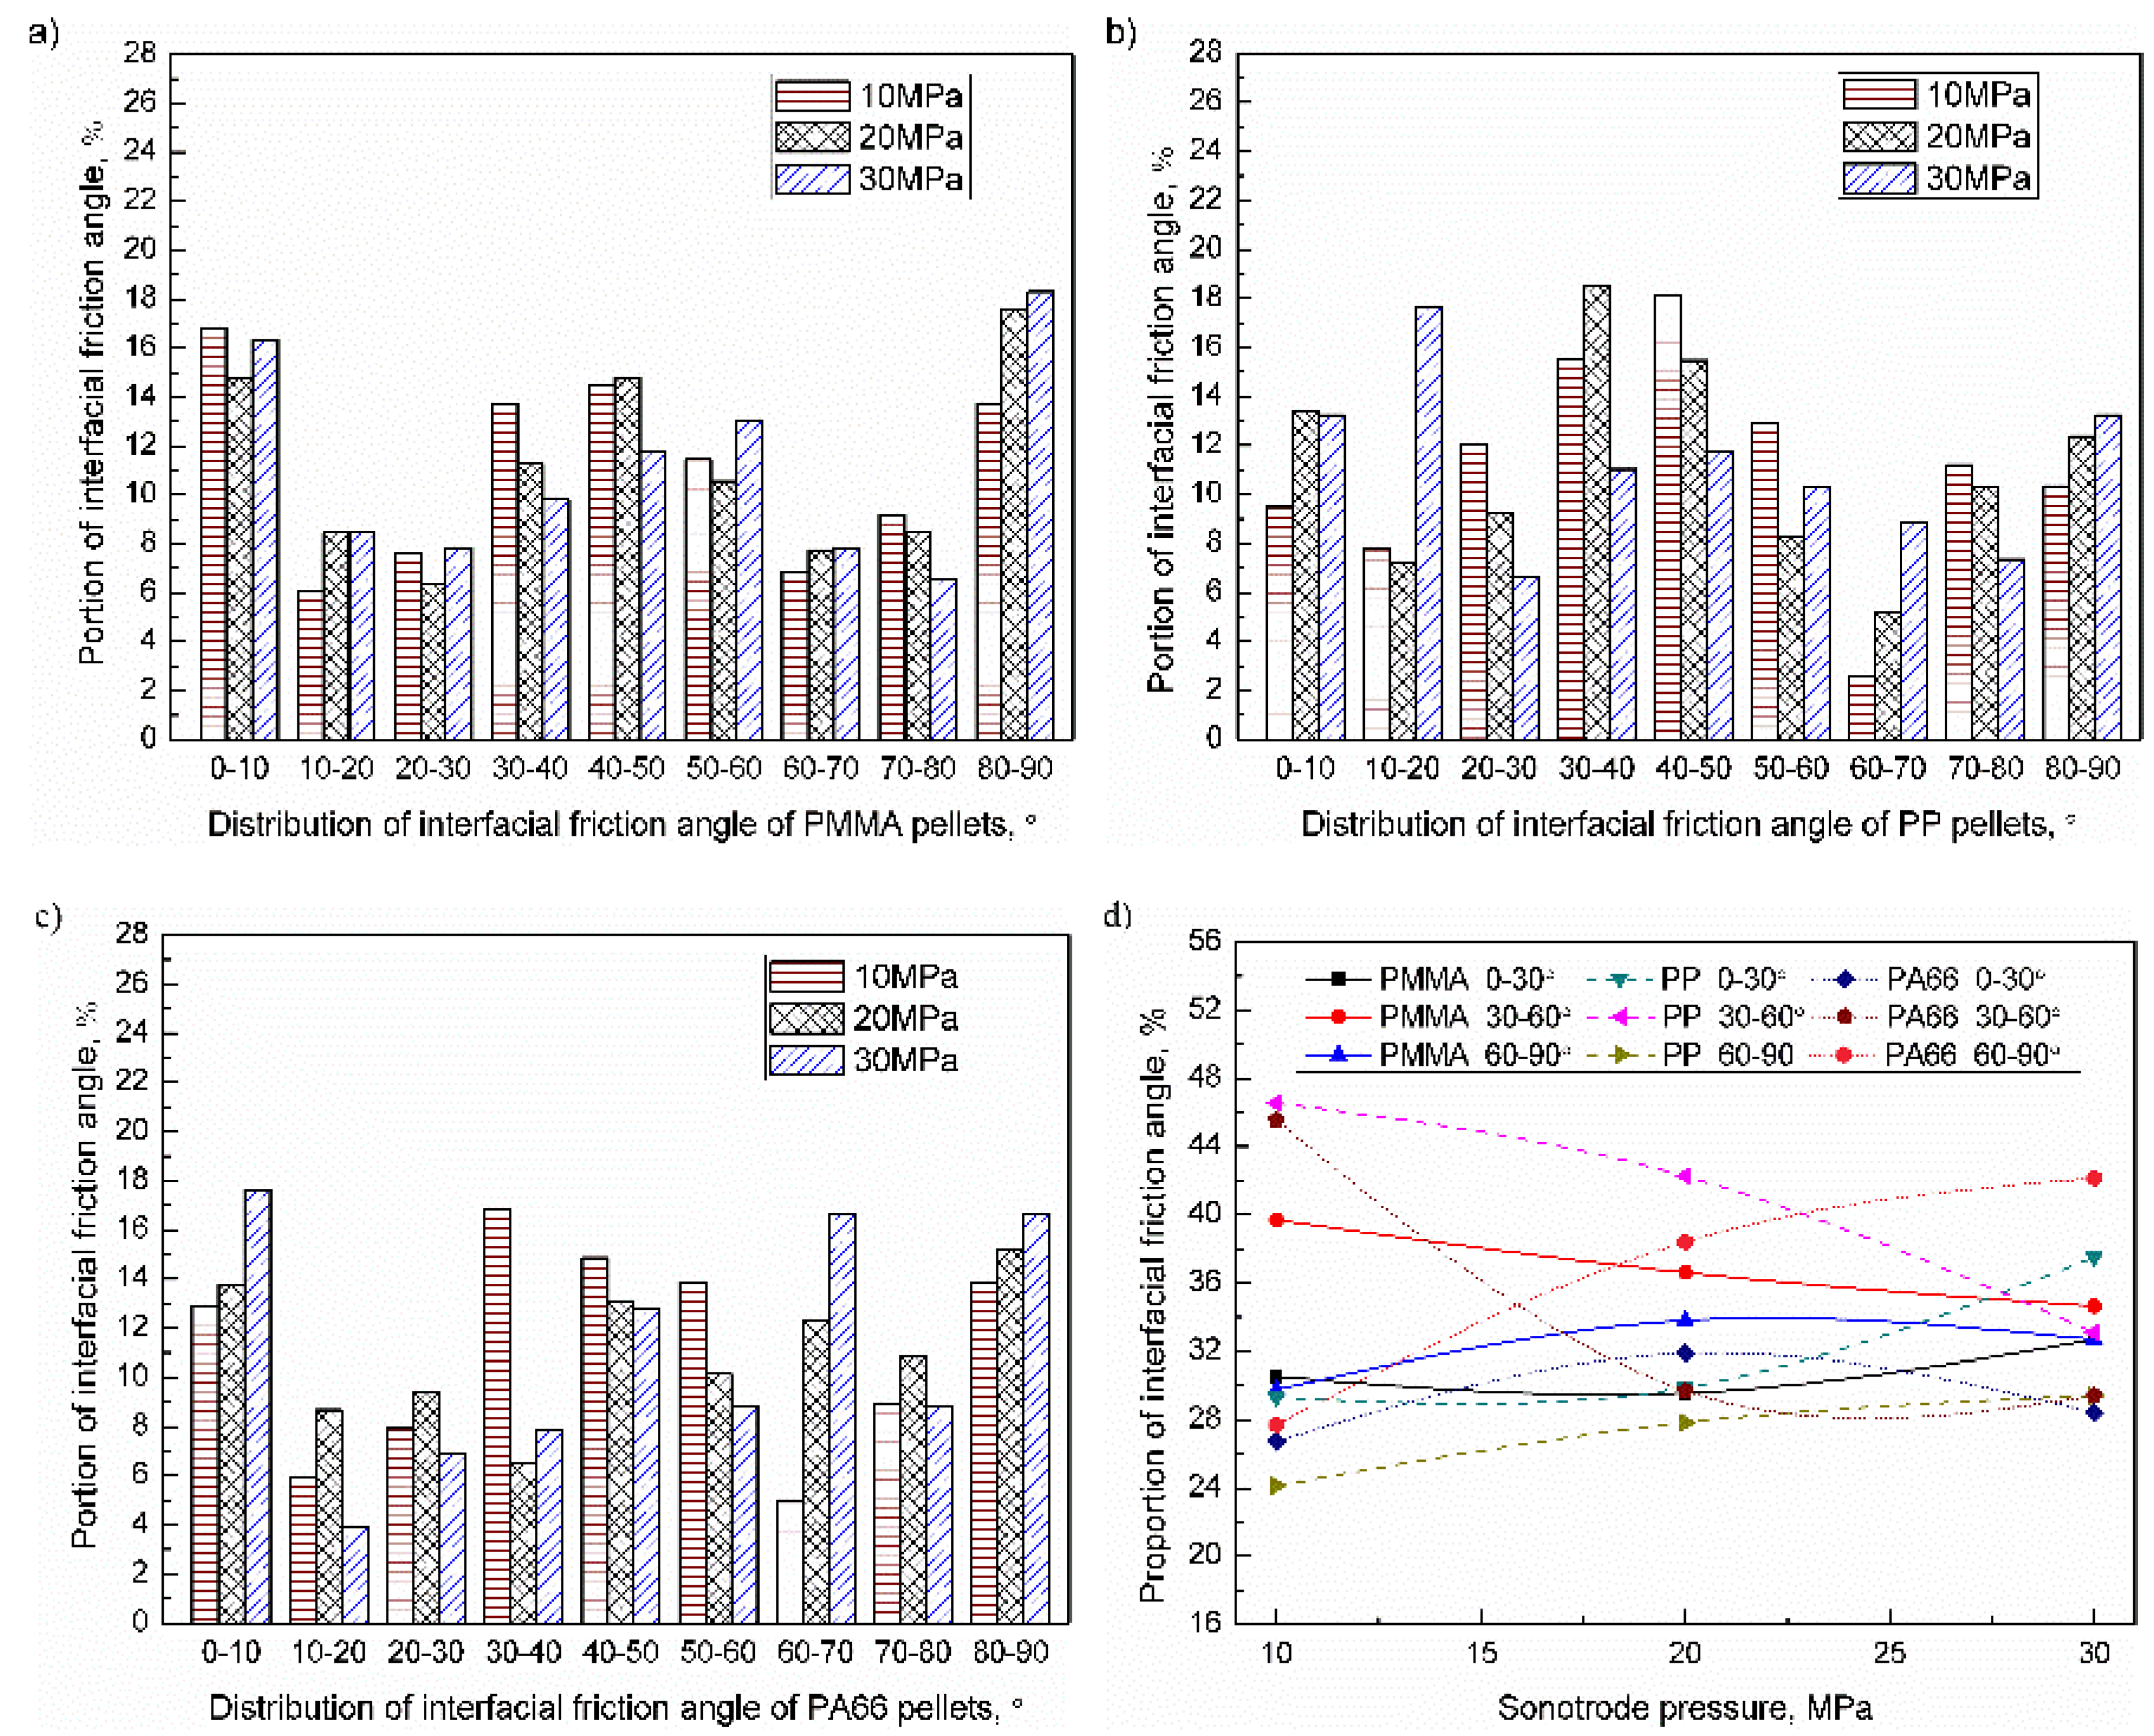
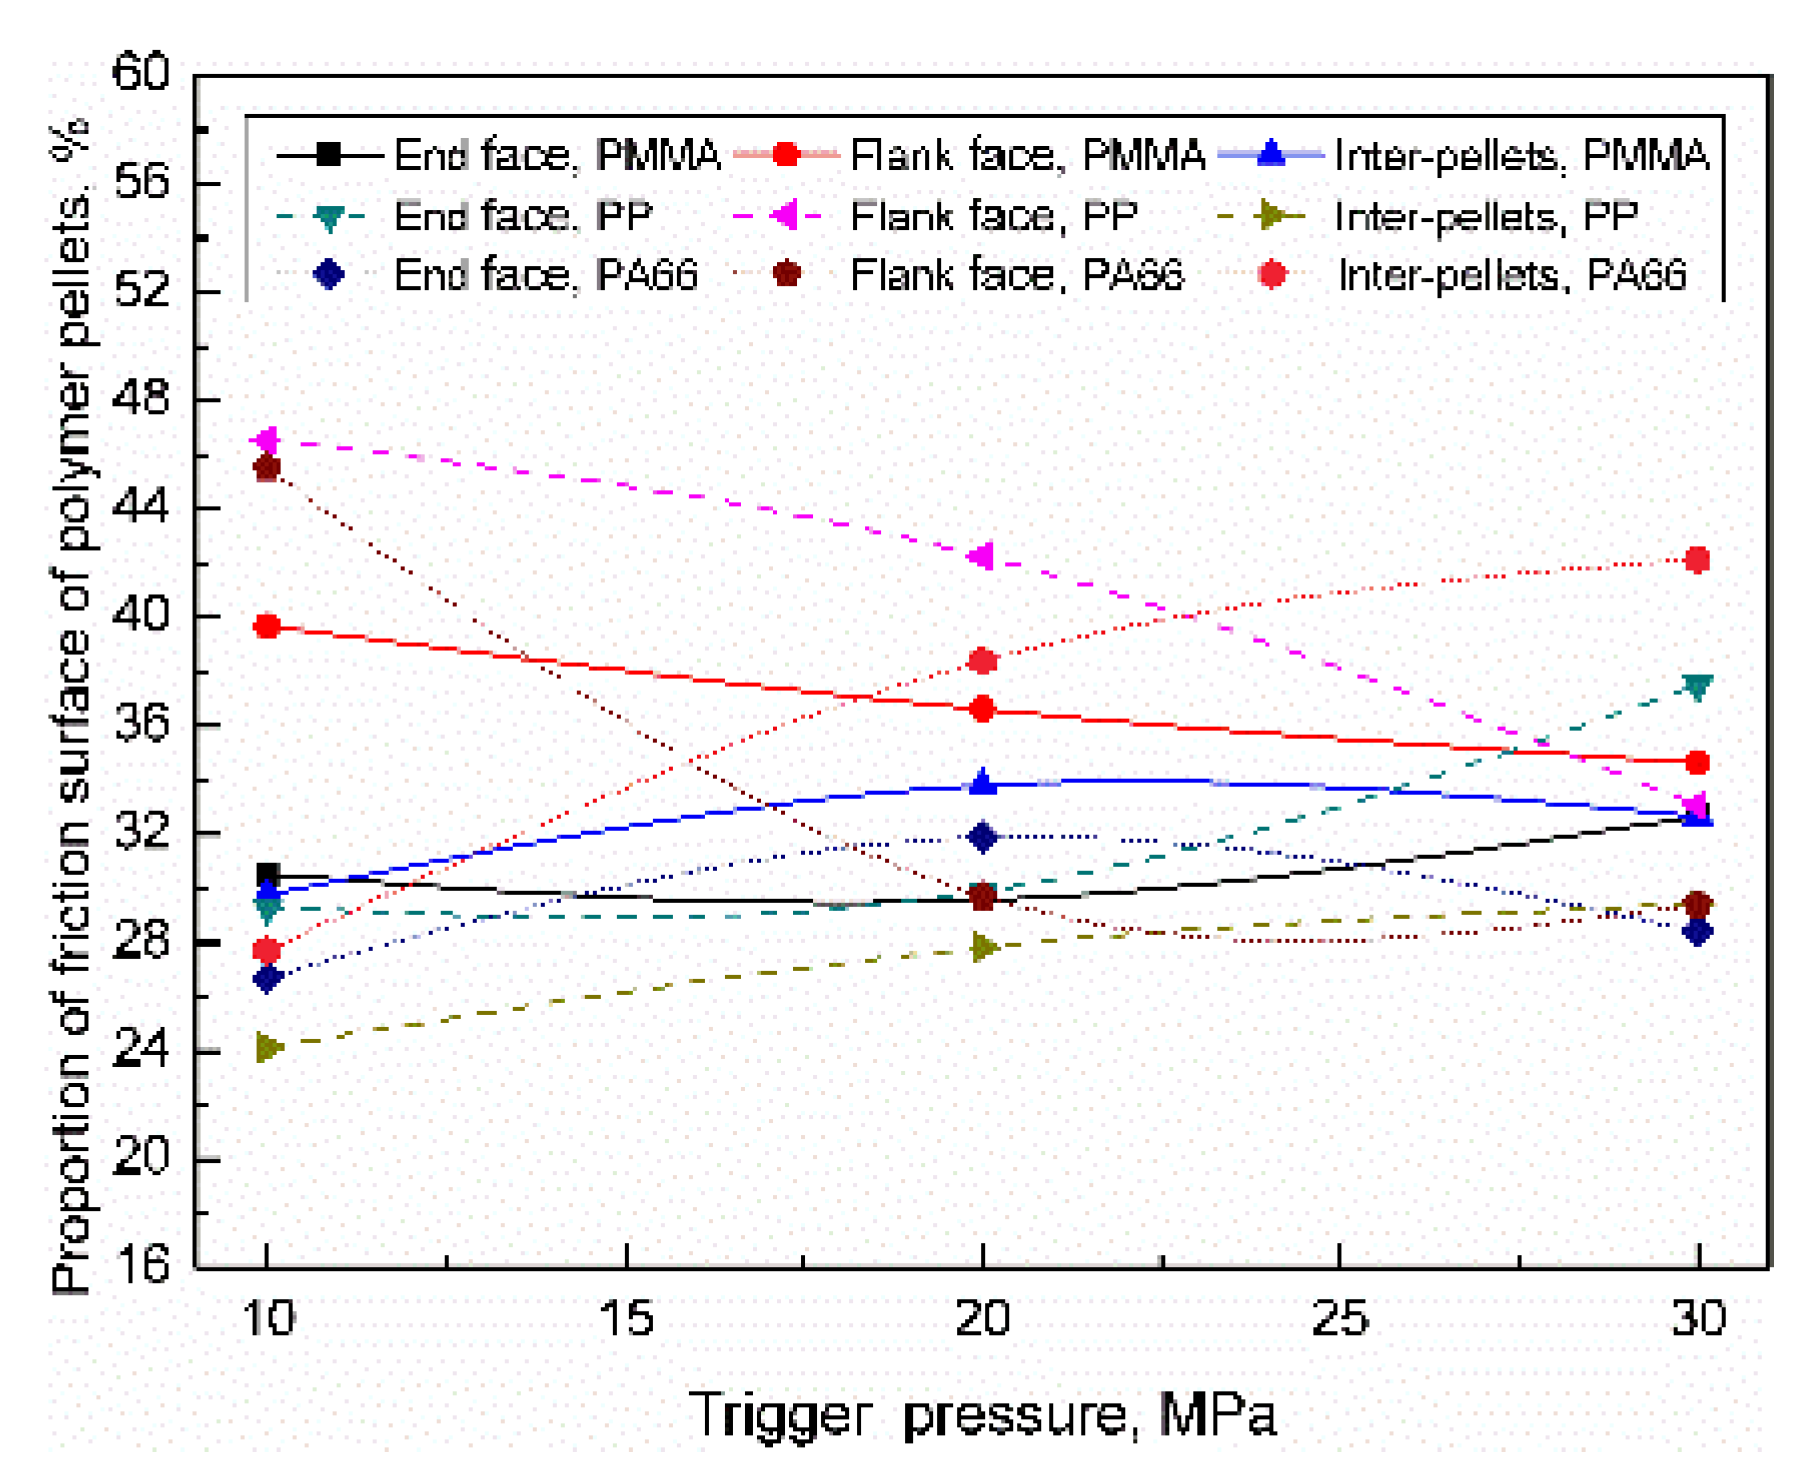
3.2.1. Influence of Trigger Pressure
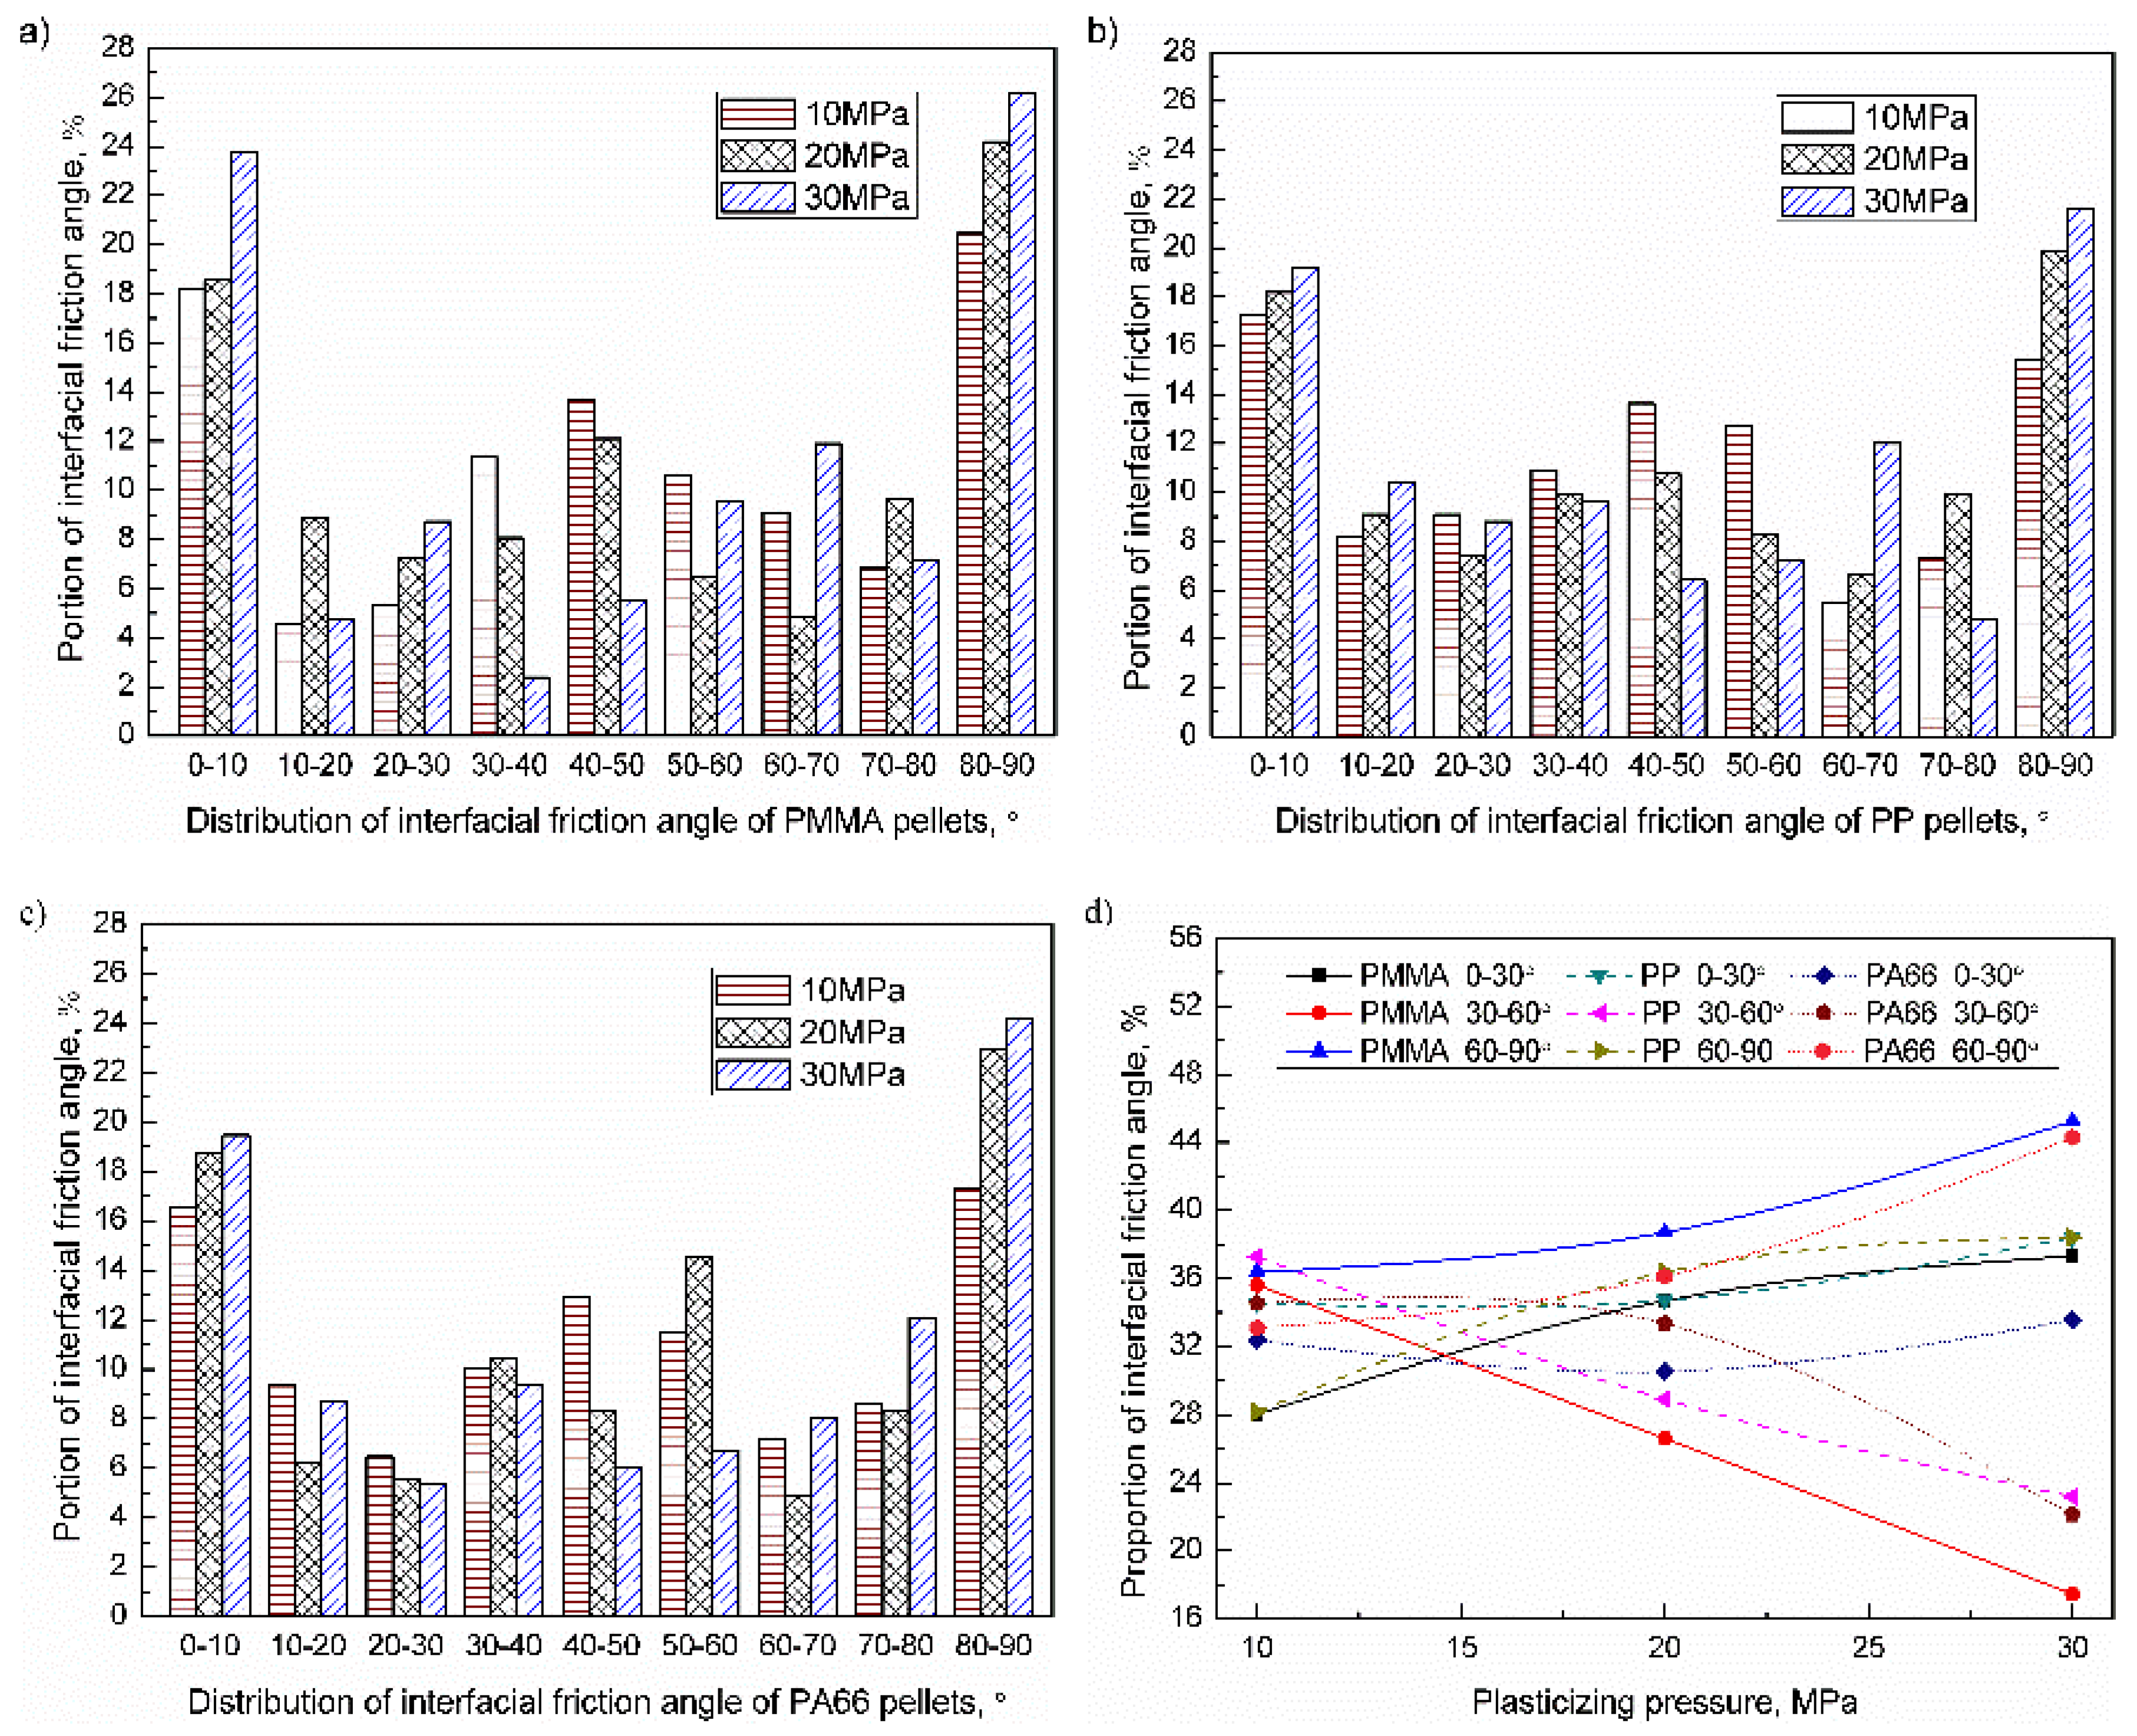
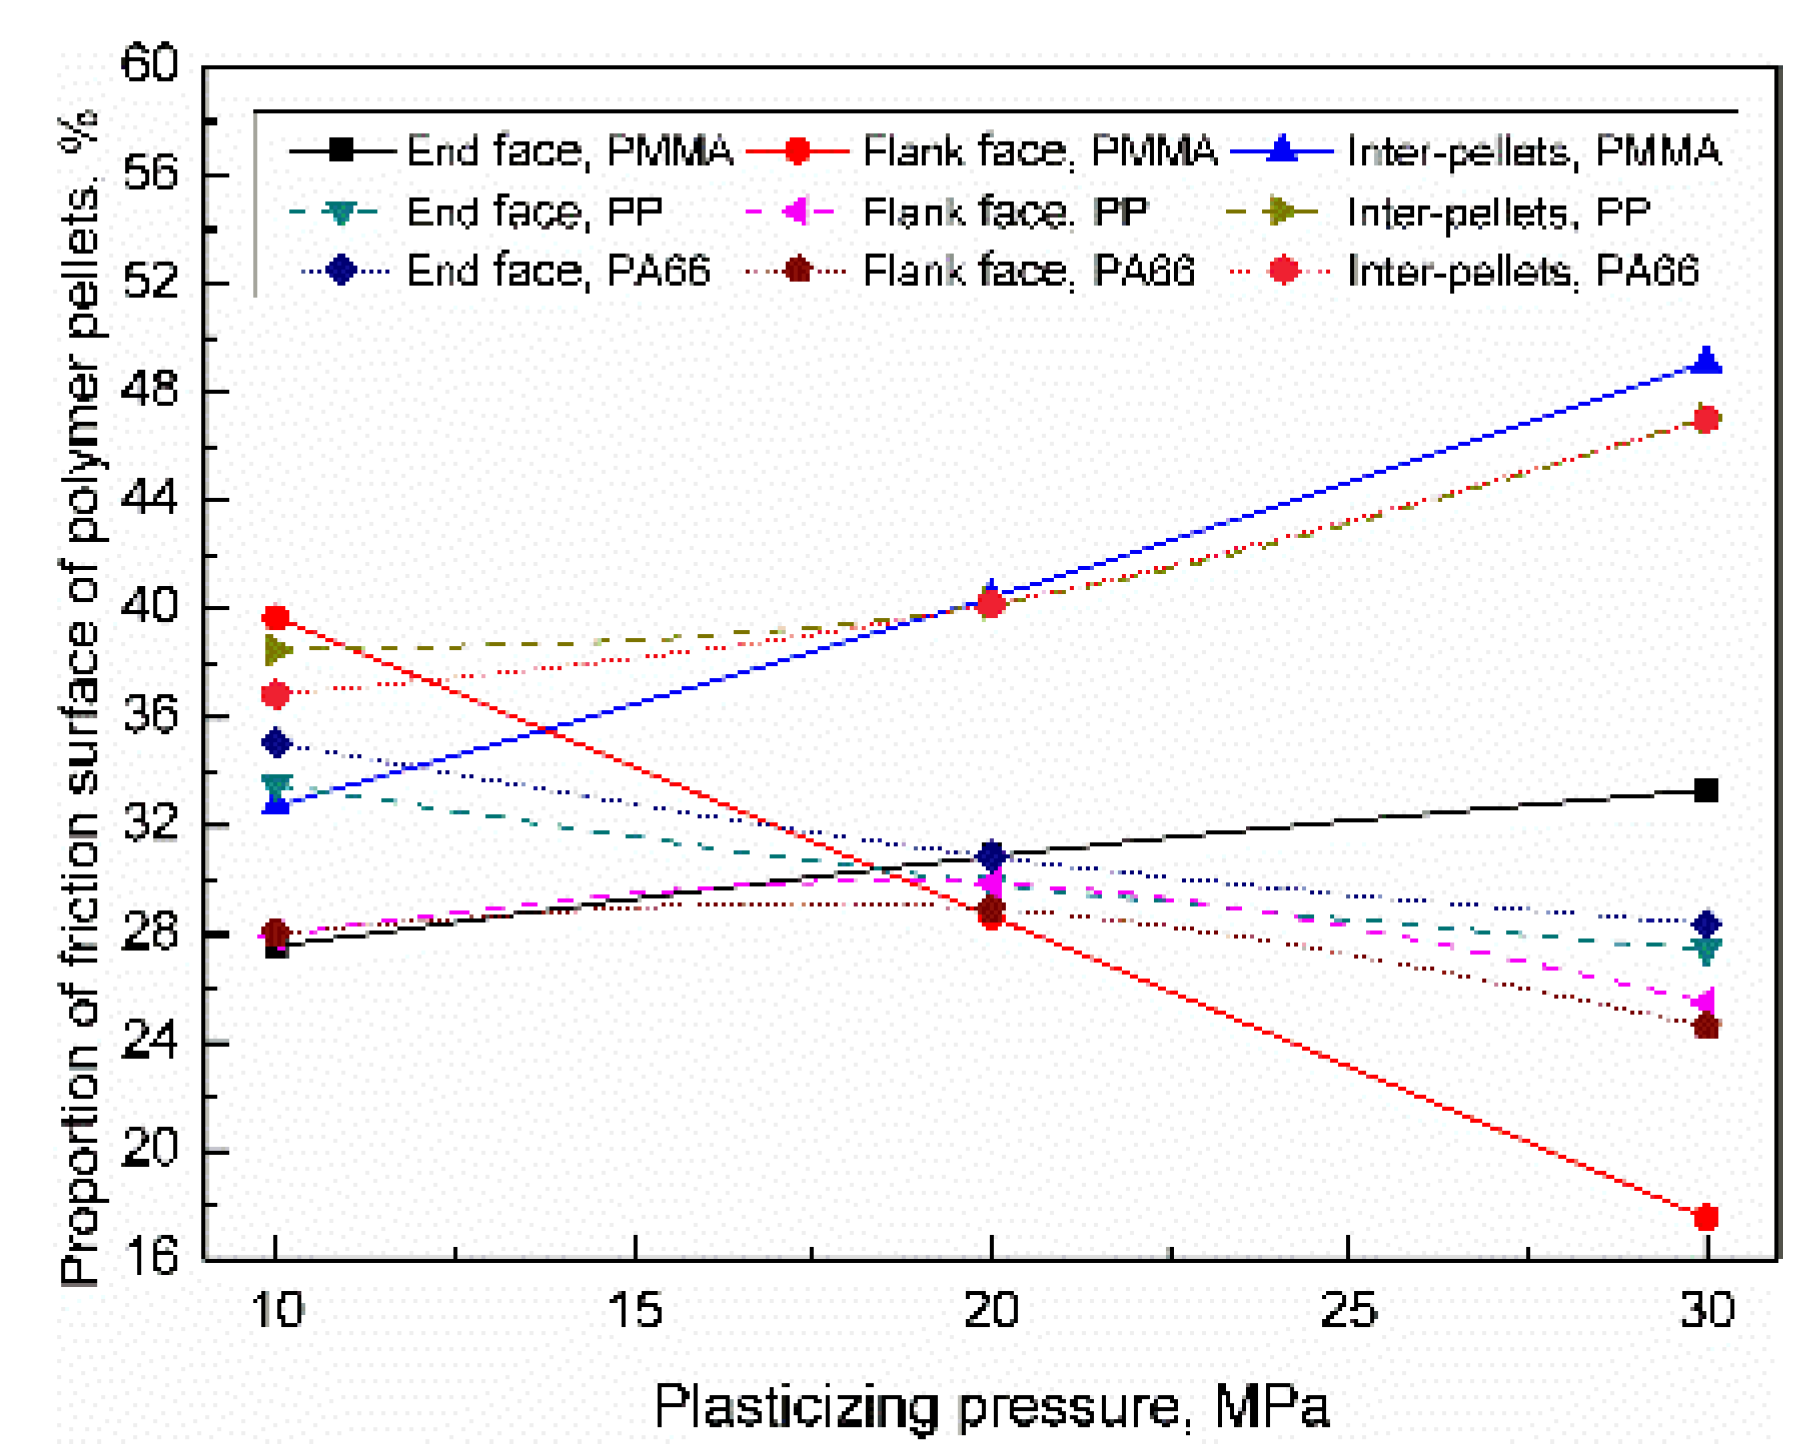
3.2.2. Influence of Plasticizing Pressure
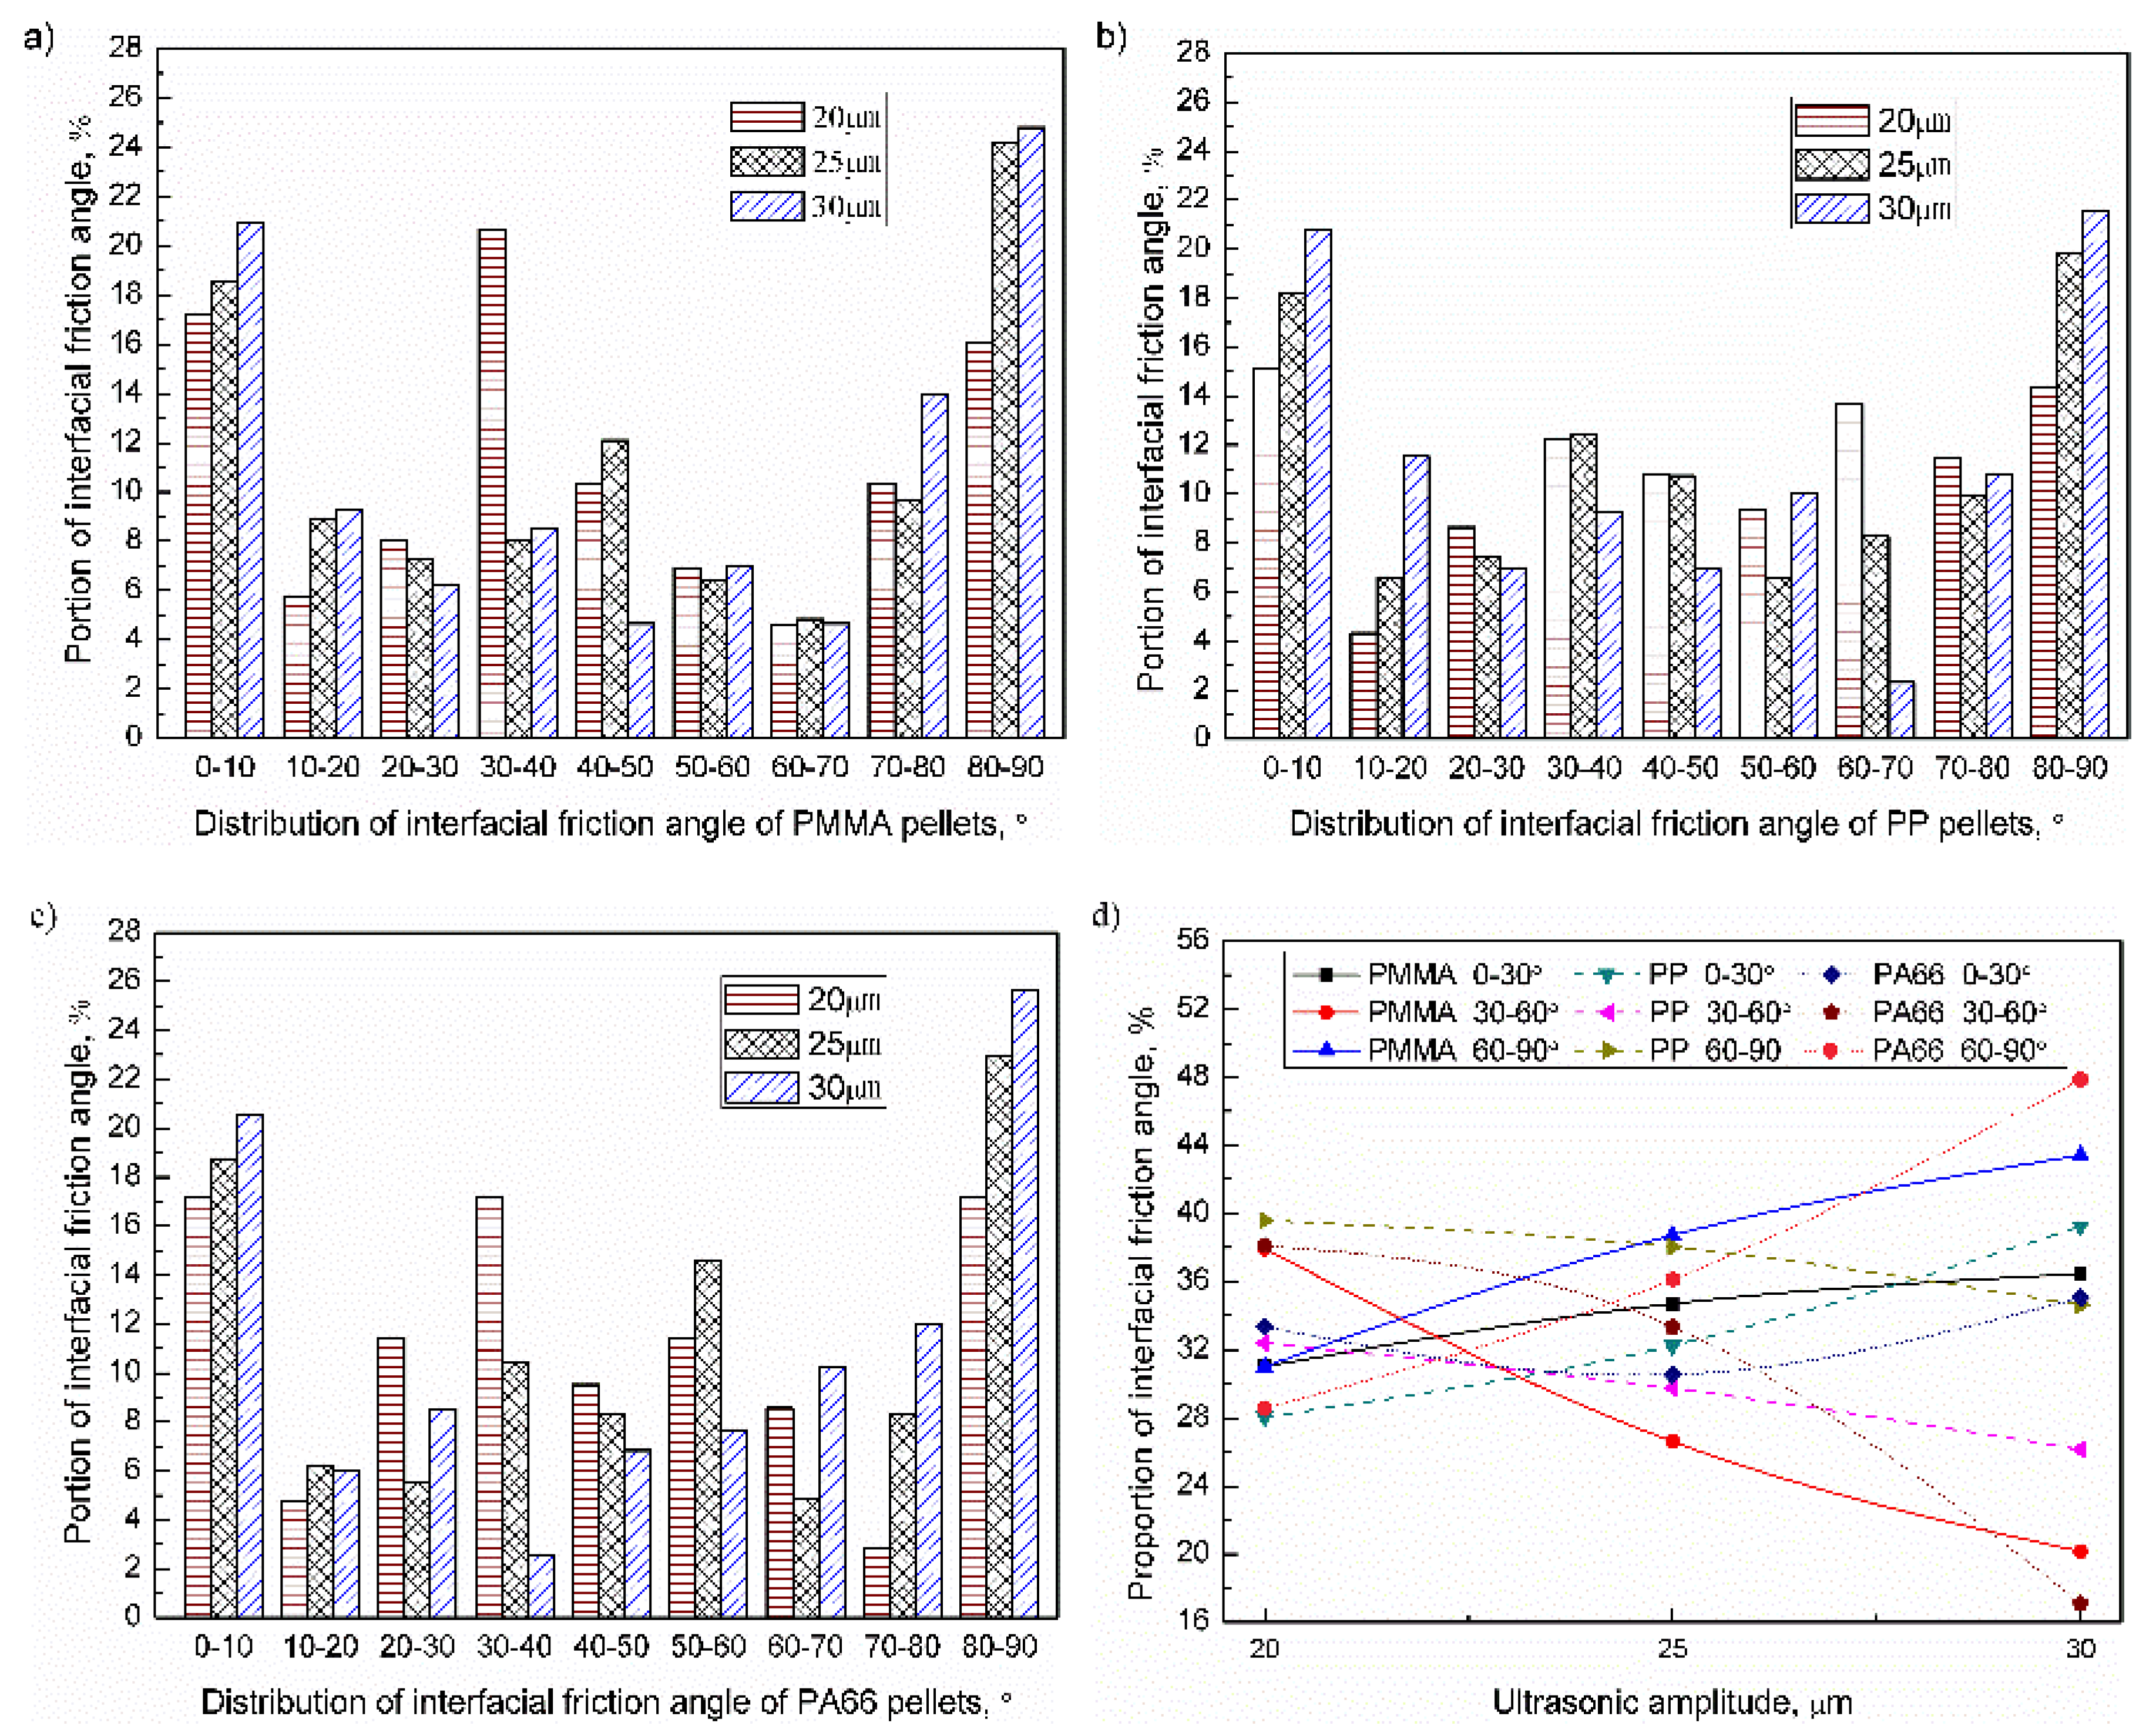
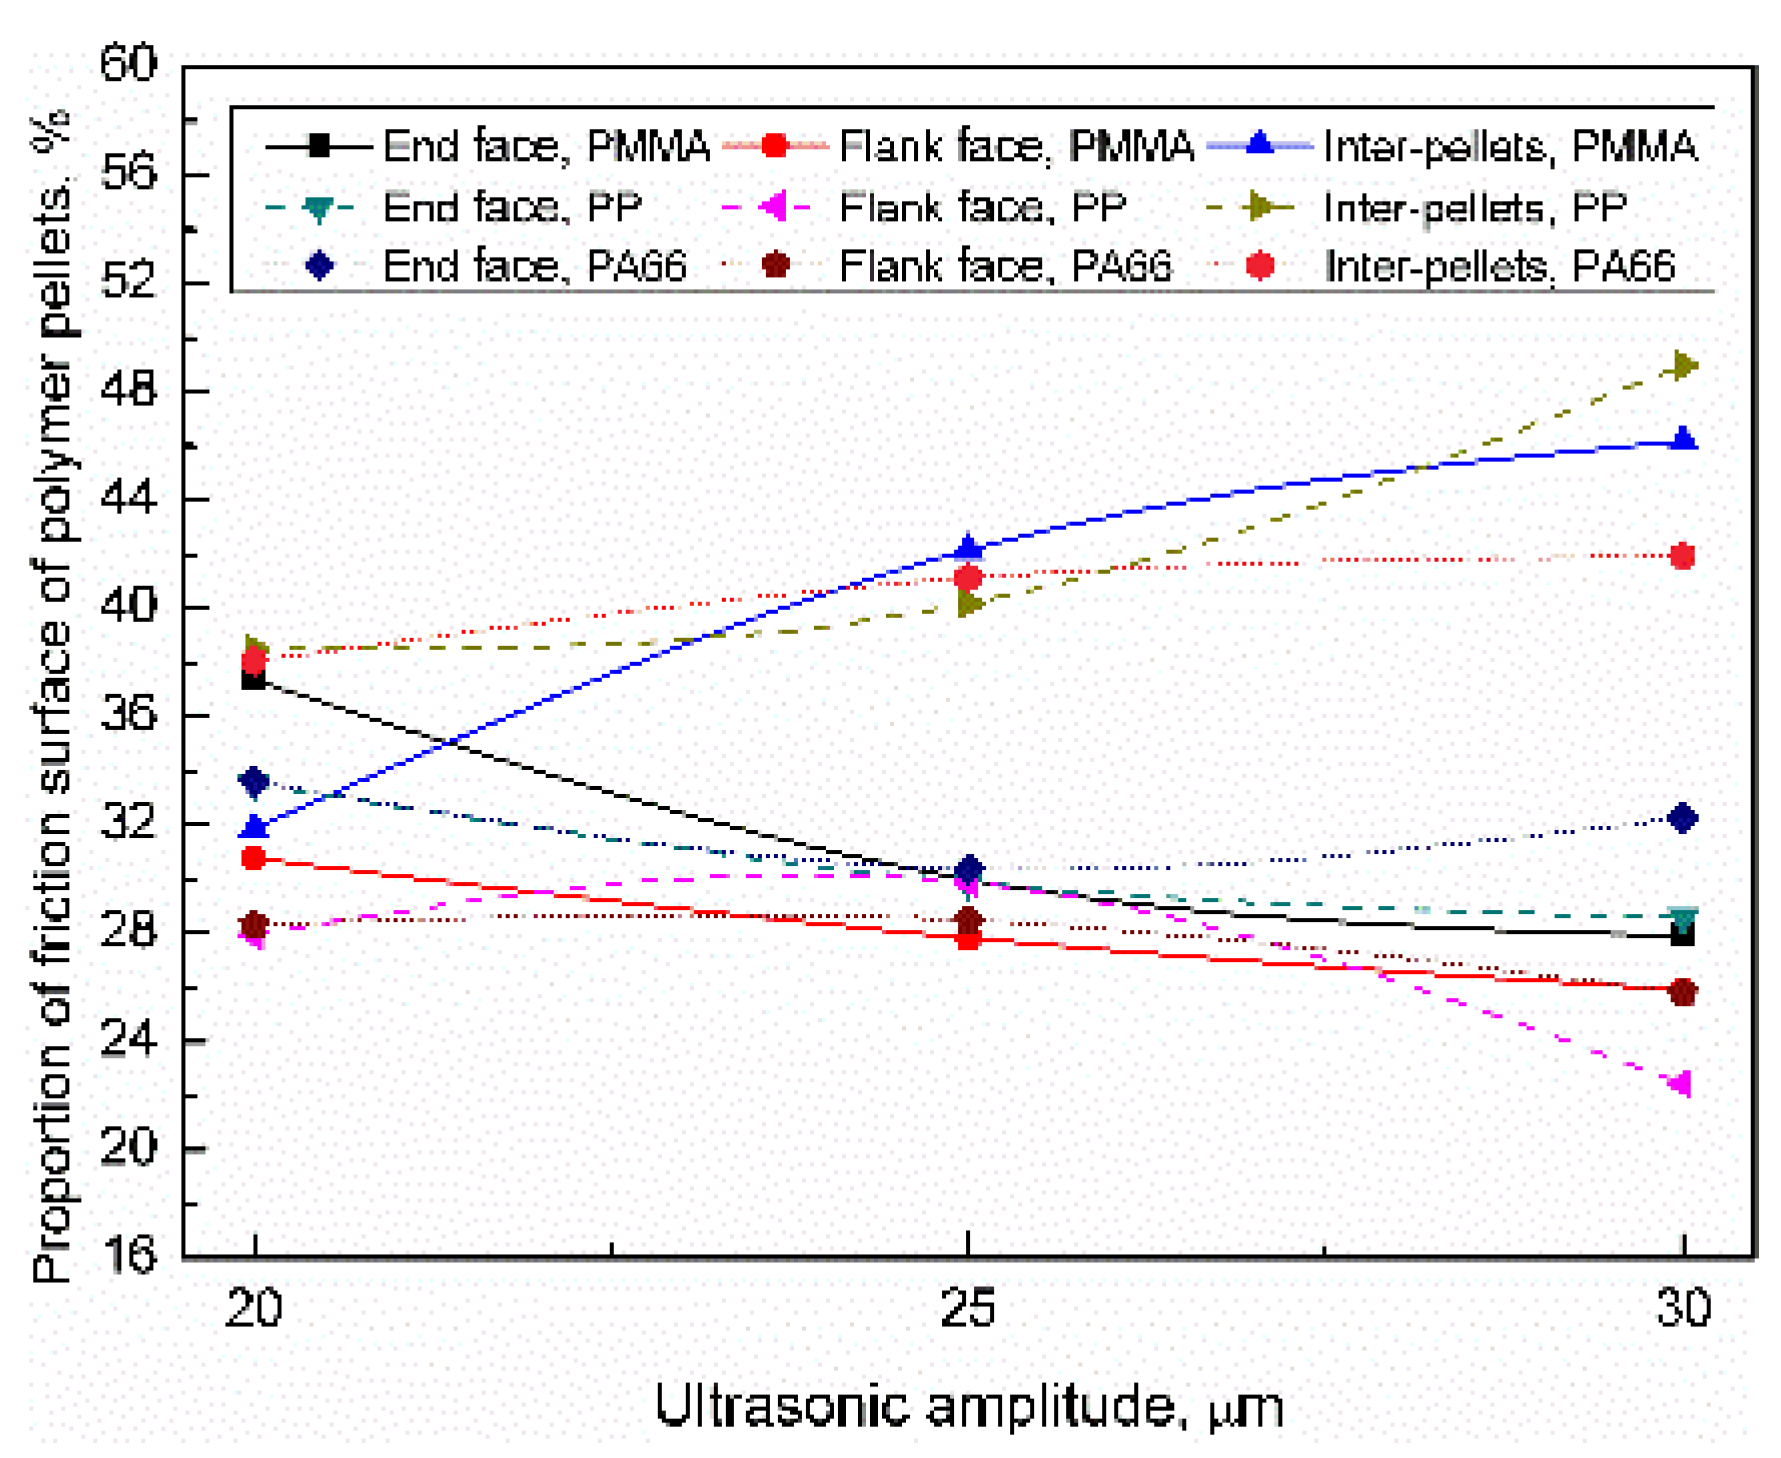
3.2.3. Influence of Ultrasonic Amplitude
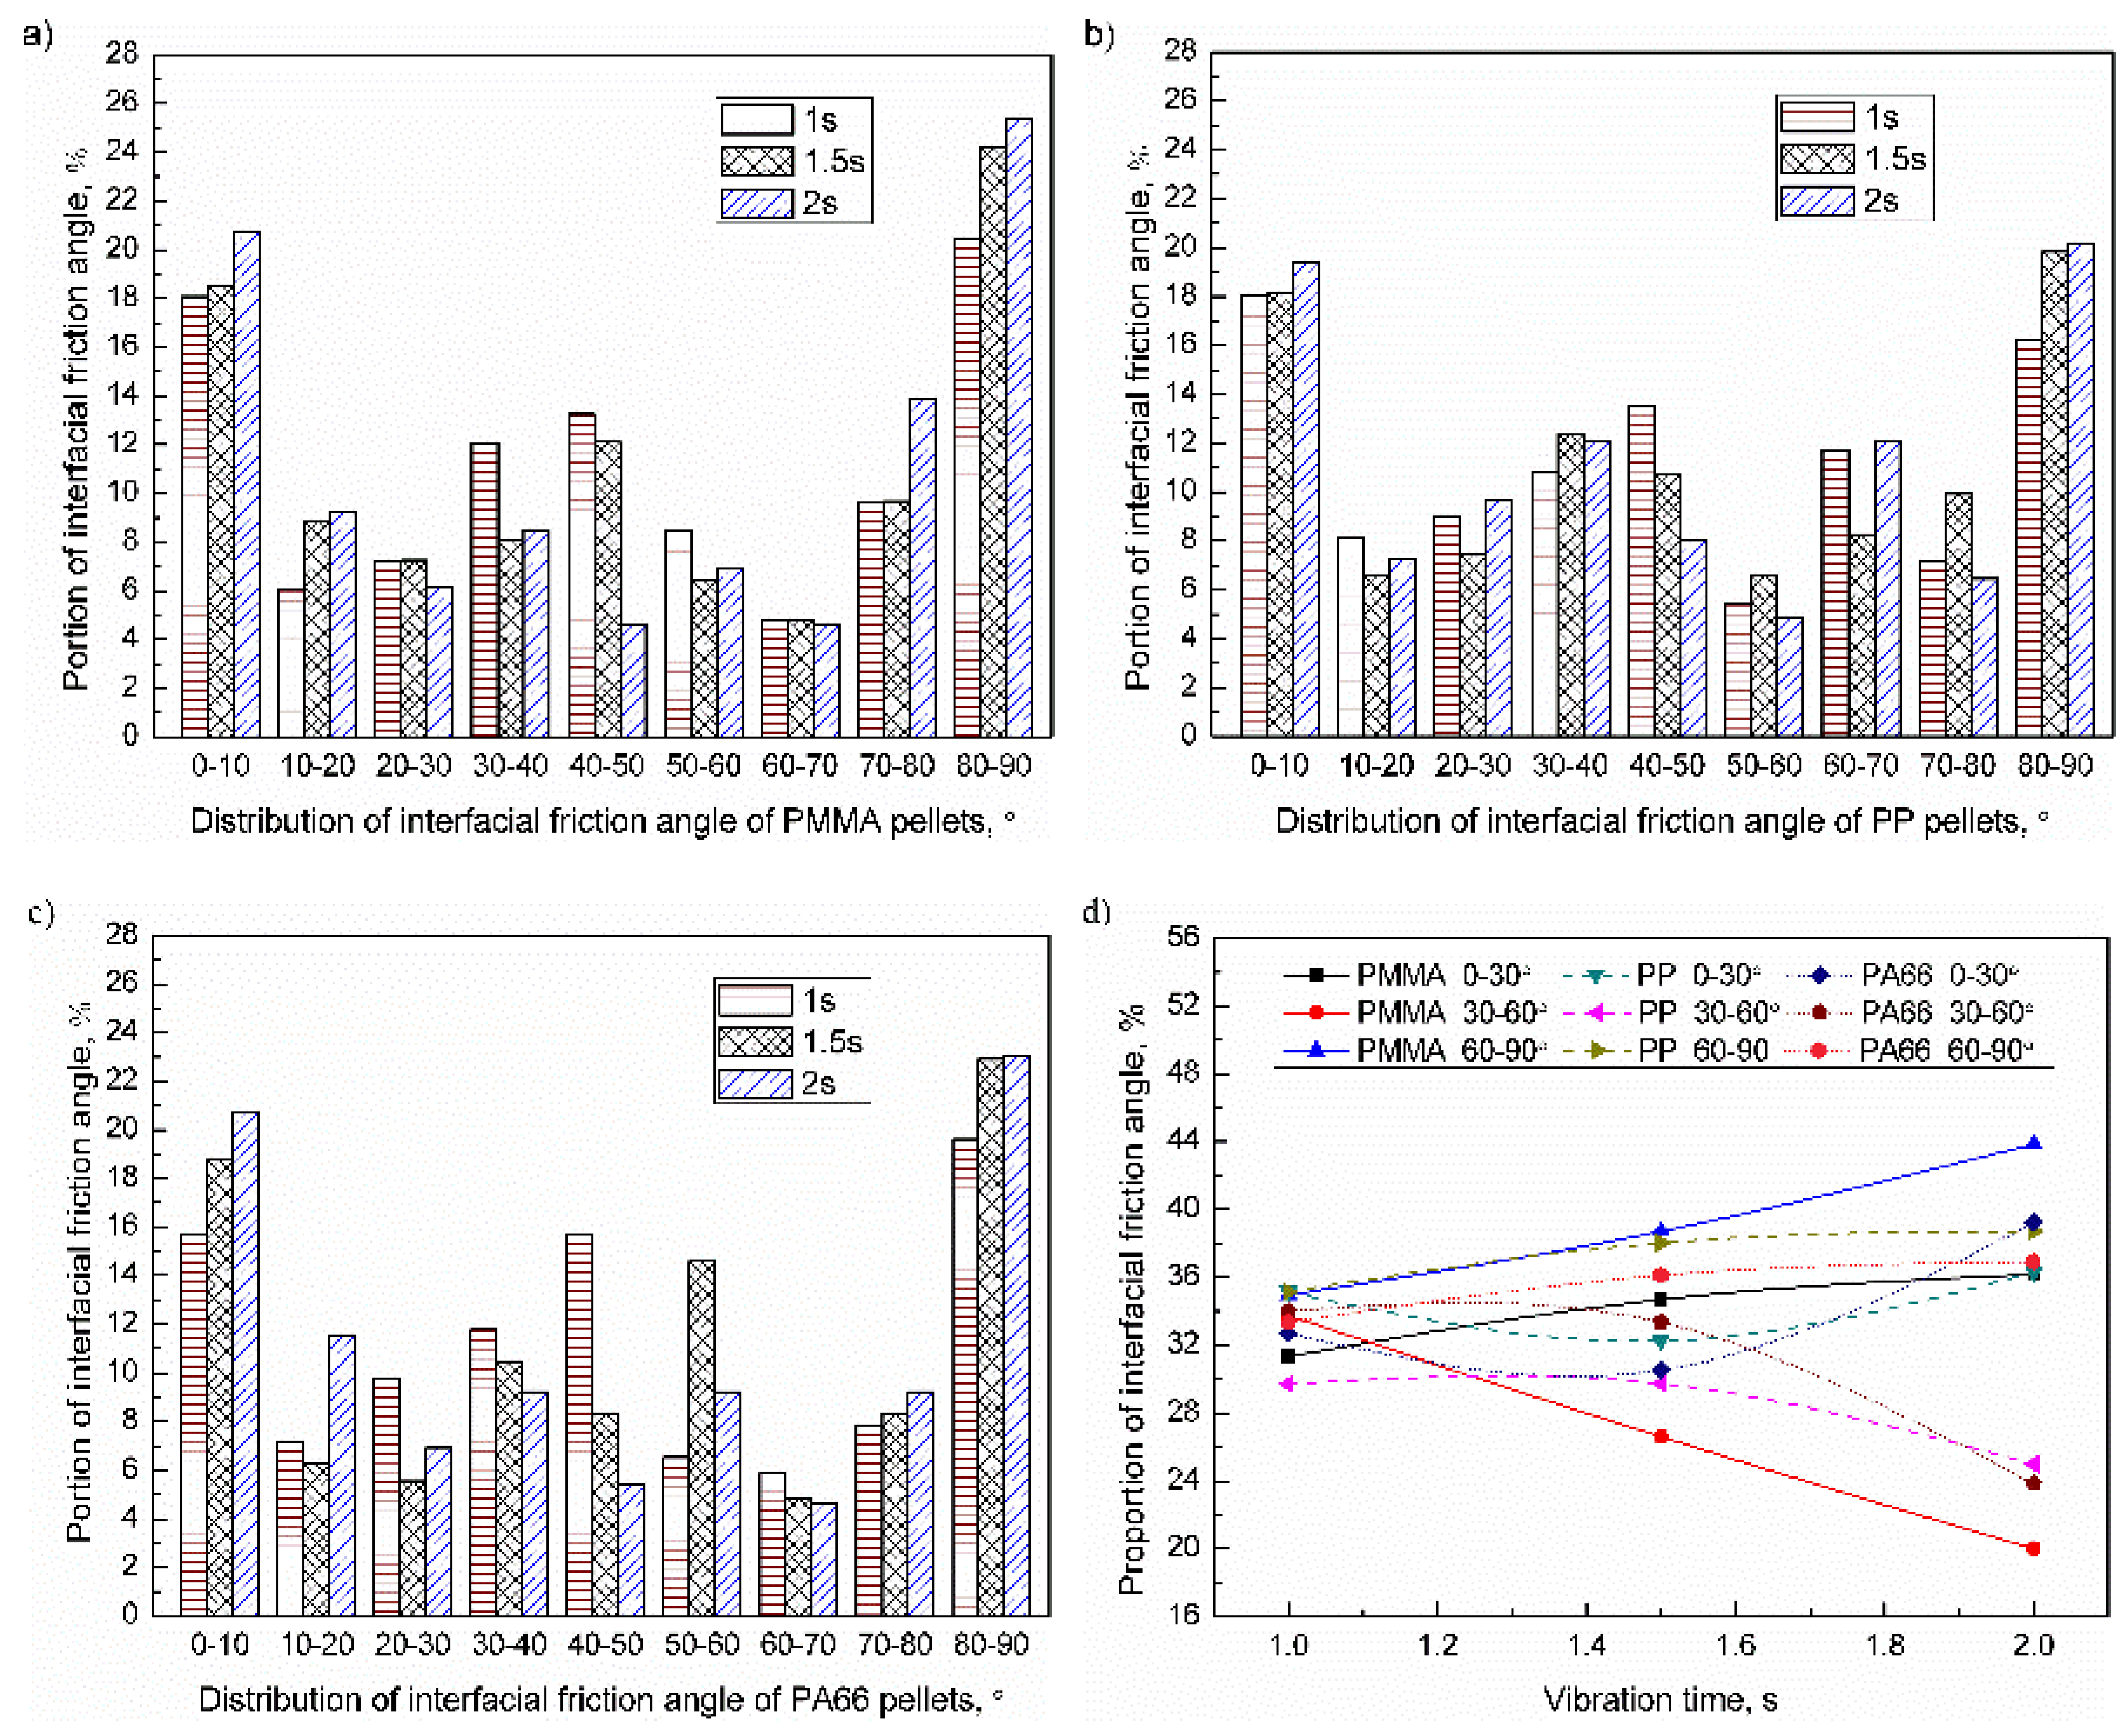
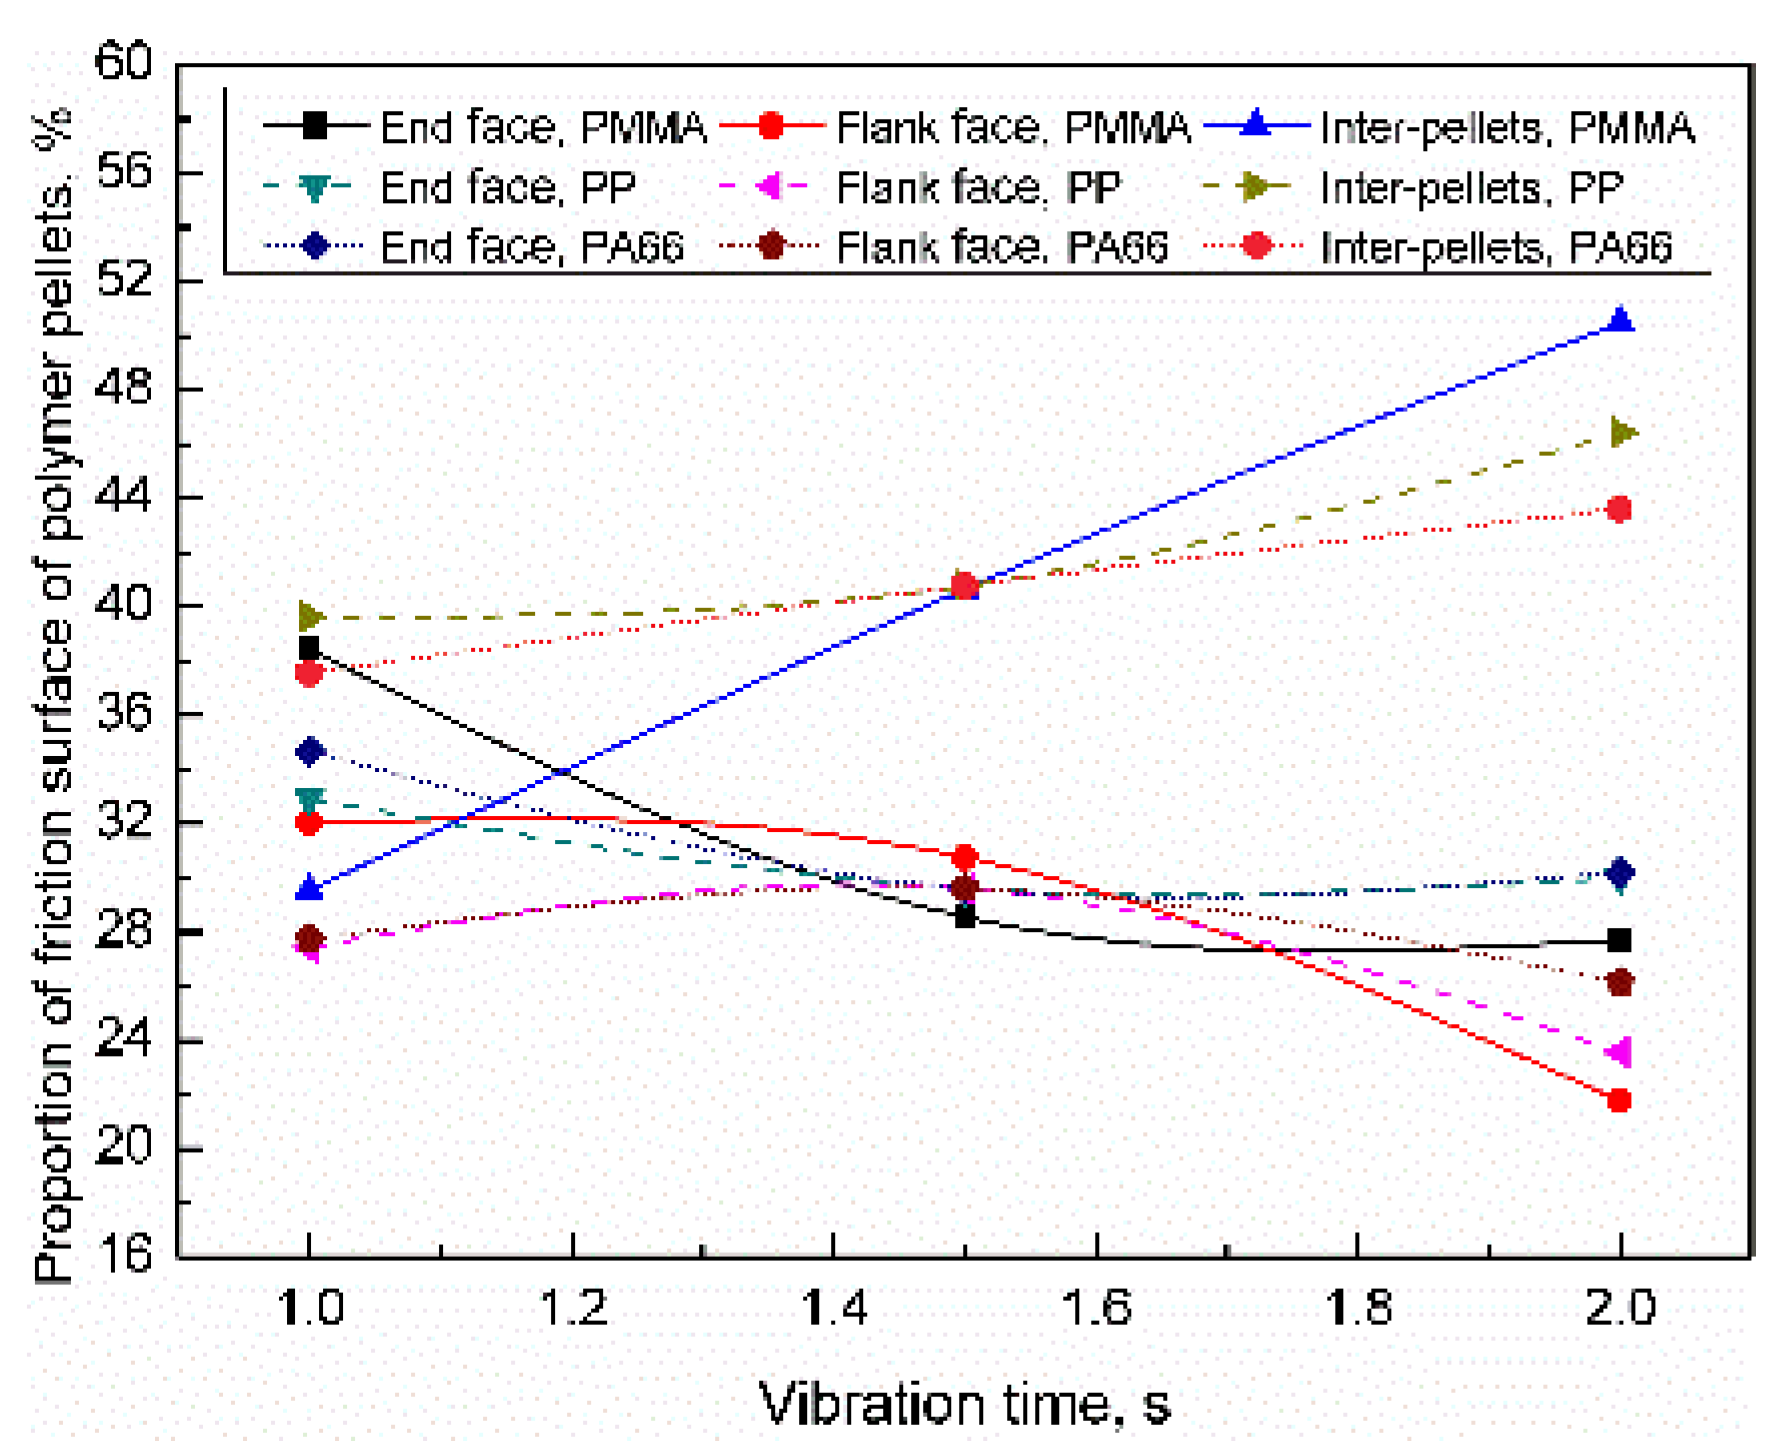
3.2.4. Influence of Vibration Time
3.3. Contact Area of the Polymer Pellets
4. Conclusions
Author Contributions
Funding
Acknowledgments
Conflicts of Interest
References
- Qin, Y.; Brockett, A.; Ma, Y.; Razali, A.; Zhao, J.; Harrison, C.; Pan, W.; Dai, X.; Loziak, D. Micro-manufacturing: Research, technology outcomes and development issues. Int. J. Adv. Manuf. Technol. 2010, 47, 821–837. [Google Scholar] [CrossRef] [Green Version]
- Fassi, I.; Shipley, D. Micro-Manufacturing Technologies and Their Applications; Springer: Cham, Switzerland, 2017. [Google Scholar]
- Michaeli, W.; Spennemann, A.; Gärtner, R. New plastification concepts for micro injection moulding. Microsyst. Technol. 2002, 8, 55–57. [Google Scholar] [CrossRef]
- Dorf, T.; Perkowska, K.; Janiszewska, M.; Ferrer, I.; Ciurana, J. Effect of the main process parameters on the mechanical strength of polyphenylsulfone (PPSU) in ultrasonic micro-moulding process. Ultrason. Sonochem. 2018, 46, 46–58. [Google Scholar] [CrossRef] [PubMed]
- Zhang, S. Design and Research on Plasticization Module of Ultrasonic Plasticization Micro-Injection Molding Machine; Central South University: Changsha, China, 2015. [Google Scholar]
- Jiang, B.Y.; Zou, Y.; Liu, T.; Zhang, Y.P.; Wu, W.Q. Effect of ultrasonic plasticization on the melt mass-flow rate of polymers. J. Cent. South Univ. 2018, 49, 2670–2676. [Google Scholar] [CrossRef]
- Jiang, B.Y.; Zou, Y.; Liu, T.; Wu, W.Q. Characterization of the Fluidity of the Ultrasonic Plasticized Polymer Melt by Spiral Flow Testing under Micro-Scale. Polymers 2019, 11, 357. [Google Scholar] [CrossRef] [Green Version]
- Sacristán, M.; Plantá, X.; Morell, M.; Puiggalí, J. Effects of ultrasonic vibration on the micro-molding processing of polylactide. J. Ultrason. Sonochem. 2014, 21, 376–386. [Google Scholar] [CrossRef]
- Negre, P.; Grabalosa, J.; Ferrer, I.; Ciurana, J.; Elías-Zúñiga, A.; Rivillas, F. Study of the Ultrasonic Molding Process Parameters for Manufacturing Polypropylene Parts. Procedia Eng. 2015, 132, 7–14. [Google Scholar] [CrossRef] [Green Version]
- Grabalosa, J.; Ferrer, I.; Elías-Zúñiga, A.; Ciurana, J. Influence of processing conditions on manufacturing polyamide parts by ultrasonic molding. Mater. Des. 2016, 98, 20–30. [Google Scholar] [CrossRef]
- Ferrer, I.; Vives-Mestres, M.; Manresa, A.; Garcia-Romeu, M. Replicability of Ultrasonic Molding for Processing Thin-Wall Polystyrene Plates with a Microchannel. Materials 2018, 11, 1320. [Google Scholar] [CrossRef] [Green Version]
- Díaz, A.; Franco, L.; Casas, M.T.; Valle, L.J.D.; Aymamí, J.; Olmo, C.; Puiggalí, J. Preparation of micro-molded exfoliated clay nanocomposites by means of ultrasonic technology. J. Polym. Res. 2014, 21, 584. [Google Scholar] [CrossRef]
- Planellas, M.; Sacristán, M.; Rey, L.; Olmo, C.; Aymamí, J.; Casas, M.T.; del Valle, L.J.; Franco, L.; Puiggalí, J. Micro-molding with ultrasonic vibration energy: New method to disperse nanoclays in polymer matrices. Ultrason. Sonochem. 2014, 21, 1557–1569. [Google Scholar] [CrossRef] [PubMed]
- Olmo, C.; Amestoy, H.; Casas, M.T.; Martínez, J.C.; Franco, L.; Sarasua, J.-R.; Puiggalí, J. Preparation of Nanocomposites of Poly (ε-caprolactone) and Multi-Walled Carbon Nanotubes by Ultrasound Micro-Molding. Influence of Nanotubes on Melting and Crystallization. Polymers 2017, 9, 322. [Google Scholar] [CrossRef] [PubMed] [Green Version]
- Grabalosa, J.; Ferrer, I.; Martínez-Romero, O.; Elías-Zúñiga, A.; Plantá, X.; Rivillas, F. Assessing a stepped sonotrode in ultrasonic molding technology. J. Mater. Process. Technol. 2015, 229, 687–696. [Google Scholar] [CrossRef]
- Sánchez-Sánchez, X.; Hernández-Avila, M.; Elizalde, L.E.; Martínez, O.; Ferrer, I.; Elías-Zuñiga, A. Micro injection molding processing of UHMWPE using ultrasonic vibration energy. Mater. Des. 2017, 132, 1–12. [Google Scholar] [CrossRef]
- Dorf, T.; Ferrer, I.; Ciurana, J. Characterizing Ultrasonic Micro-Molding Process of Polyetheretherketone (PEEK). Int. Polym. Process. 2018, 33, 442–452. [Google Scholar] [CrossRef]
- Michaeli, W.; Kamps, T.; Hopmann, C. Manufacturing of polymer micro parts by ultrasonic plasticization and direct injection. Microsyst. Technol. 2011, 17, 243–249. [Google Scholar] [CrossRef]
- Wu, W.Q.; Peng, H.J.; Jia, Y.J.; Jiang, B.Y. Characteristics and mechanisms of polymer interfacial friction heating in ultrasonic plasticization for micro injection molding. Microsyst. Technol. 2017, 23, 1385–1392. [Google Scholar] [CrossRef]
- Jia, Y.L.; Jiang, B.Y.; Peng, H.J.; Zhang, S.; Liu, X.C. Viscoelastic heating effect in ultrasonic plasticization for micro injection molding. J. Cent. South Univ. 2016, 47, 2976–2983. [Google Scholar] [CrossRef]
- Jiang, B.Y.; Peng, H.J.; Wu, W.Q.; Jia, Y.L.; Zhang, Y.P. Numerical simulation and experimental investigation of the viscoelastic heating mechanism in ultrasonic plasticizing of amorphous polymers for micro injection molding. Polymers 2016, 8, 199. [Google Scholar] [CrossRef]
- Peng, T.; Jiang, B.; Zou, Y. Study on the Mechanism of Interfacial Friction Heating in Polymer Ultrasonic Plasticization Injection Molding Process. Polymers 2019, 11, 1407. [Google Scholar] [CrossRef] [Green Version]
- Kistrup, K.; Poulsen, C.E.; Hansen, M.F.; Wolff, A. Ultrasonic welding for fast bonding of self-aligned structures in lab-on-a-chip systems. Lab Chip 2015, 15, 1998–2001. [Google Scholar] [CrossRef] [PubMed]
- Sackmann, J.; Burlage, K.; Gerhardy, C.; Memering, B.; Liao, S.; Schomburg, W.K. Review on ultrasonic fabrication of polymer micro devices. Ultrasonics 2015, 56, 189–200. [Google Scholar] [CrossRef] [PubMed]
- Vendan, S.A.; Natesh, M.; Garg, A.; Gao, L. Ultrasonic Welding of Polymers; Springer: Singapore, 2019. [Google Scholar]
- Park, J.H.; Lee, K.Y.; Park, K.J.U. Coupled numerical analysis to investigate the heating mechanism of ultrasonic imprint lithography. Ultrasonics 2015, 60, 96–102. [Google Scholar] [CrossRef] [PubMed]
- Leisen, C.; Wolf, M.; Drummer, D. Influence of the mold temperature on the material properties and the vibration welding process of crosslinked polyamide 66. Polym. Eng. Sci. 2018, 58, E207–E214. [Google Scholar] [CrossRef]
- Wang, G.; Hui, Y.; Zhang, L.; Zhao, G. Research on temperature and pressure responses in the rapid mold heating and cooling method based on annular cooling channels and electric heating. Int. J. Heat Mass Transf. 2018, 116, 1192–1203. [Google Scholar] [CrossRef]
- Jiang, B.Y.; Qi, P.C.; Zhang, S.; Wu, W.Q.; Zou, Y. Effect of ultrasonic power on polymer ultrasonic plastification. J. Cent. South Univ. 2017, 48, 3224–3230. [Google Scholar]


| Material | Crystal Type | Density (g/cm3) | Melt Point (°C) | Specific Heat Capacity (KJ/Kg·°C) | Elastic Modulus (Gpa) | Acoustic Impedance (105 Pa·s∙m−1) |
|---|---|---|---|---|---|---|
| PMMA | Amorphous | 1.19 | 130~140 | 1.465 | 3.3 | 32.00 |
| PP | Semi-crystalline | 0.91 | 175 | 1.926 | 0.9 | 11.10 |
| PA66 | Crystalline | 1.14 | 252 | 1.675 | 2.6 | 2.90 |
| Number | Ultrasonic Amplitude (UA)/μm | Plasticization Pressure (PPe)/MPa | Vibration Time (VT)/s |
|---|---|---|---|
| 1 | 20, 25, 30 | 20 | 1.5 |
| 2 | 25 | 10, 20, 30 | 1.5 |
| 3 | 25 | 20 | 1, 1.5, 2 |
© 2019 by the authors. Licensee MDPI, Basel, Switzerland. This article is an open access article distributed under the terms and conditions of the Creative Commons Attribution (CC BY) license (http://creativecommons.org/licenses/by/4.0/).
Share and Cite
Jiang, B.; Zou, Y.; Wei, G.; Wu, W. Evolution of Interfacial Friction Angle and Contact Area of Polymer Pellets during the Initial Stage of Ultrasonic Plasticization. Polymers 2019, 11, 2103. https://doi.org/10.3390/polym11122103
Jiang B, Zou Y, Wei G, Wu W. Evolution of Interfacial Friction Angle and Contact Area of Polymer Pellets during the Initial Stage of Ultrasonic Plasticization. Polymers. 2019; 11(12):2103. https://doi.org/10.3390/polym11122103
Chicago/Turabian StyleJiang, Bingyan, Yang Zou, Guomeng Wei, and Wangqing Wu. 2019. "Evolution of Interfacial Friction Angle and Contact Area of Polymer Pellets during the Initial Stage of Ultrasonic Plasticization" Polymers 11, no. 12: 2103. https://doi.org/10.3390/polym11122103