Employing of Trukhan Model to Estimate Ion Transport Parameters in PVA Based Solid Polymer Electrolyte

 ,
,
Abstract
:
1. Introduction
2. Experimental Method
2.1. Materials and Sample Preparation
2.2. Impedance Measurement
3. Results and Discussion
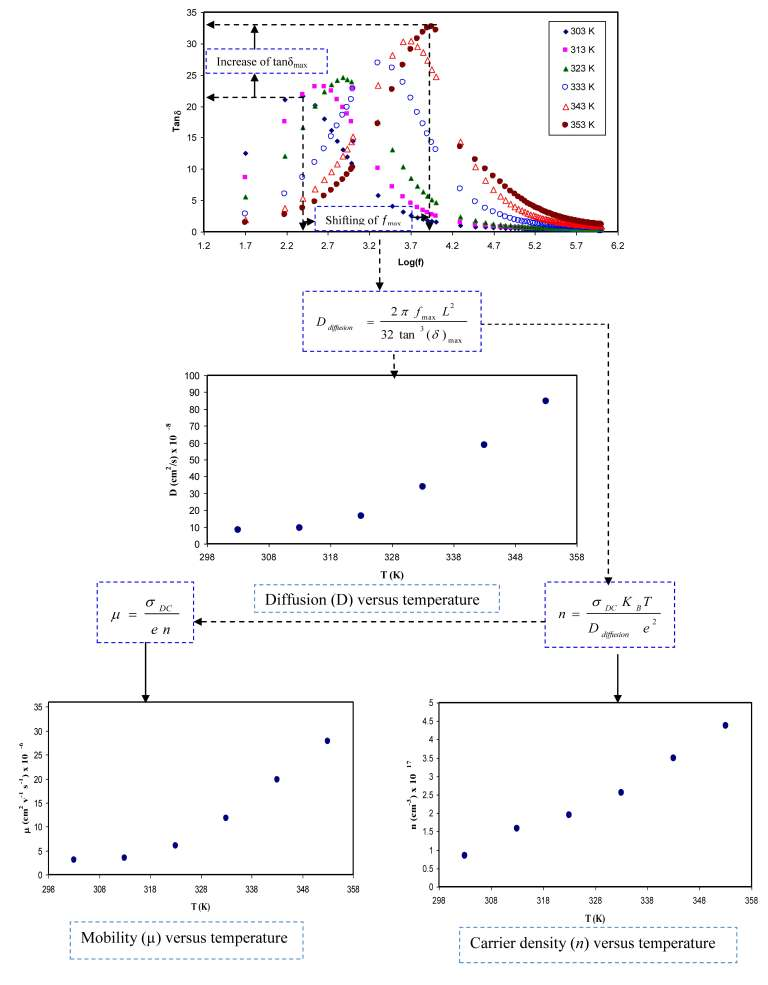
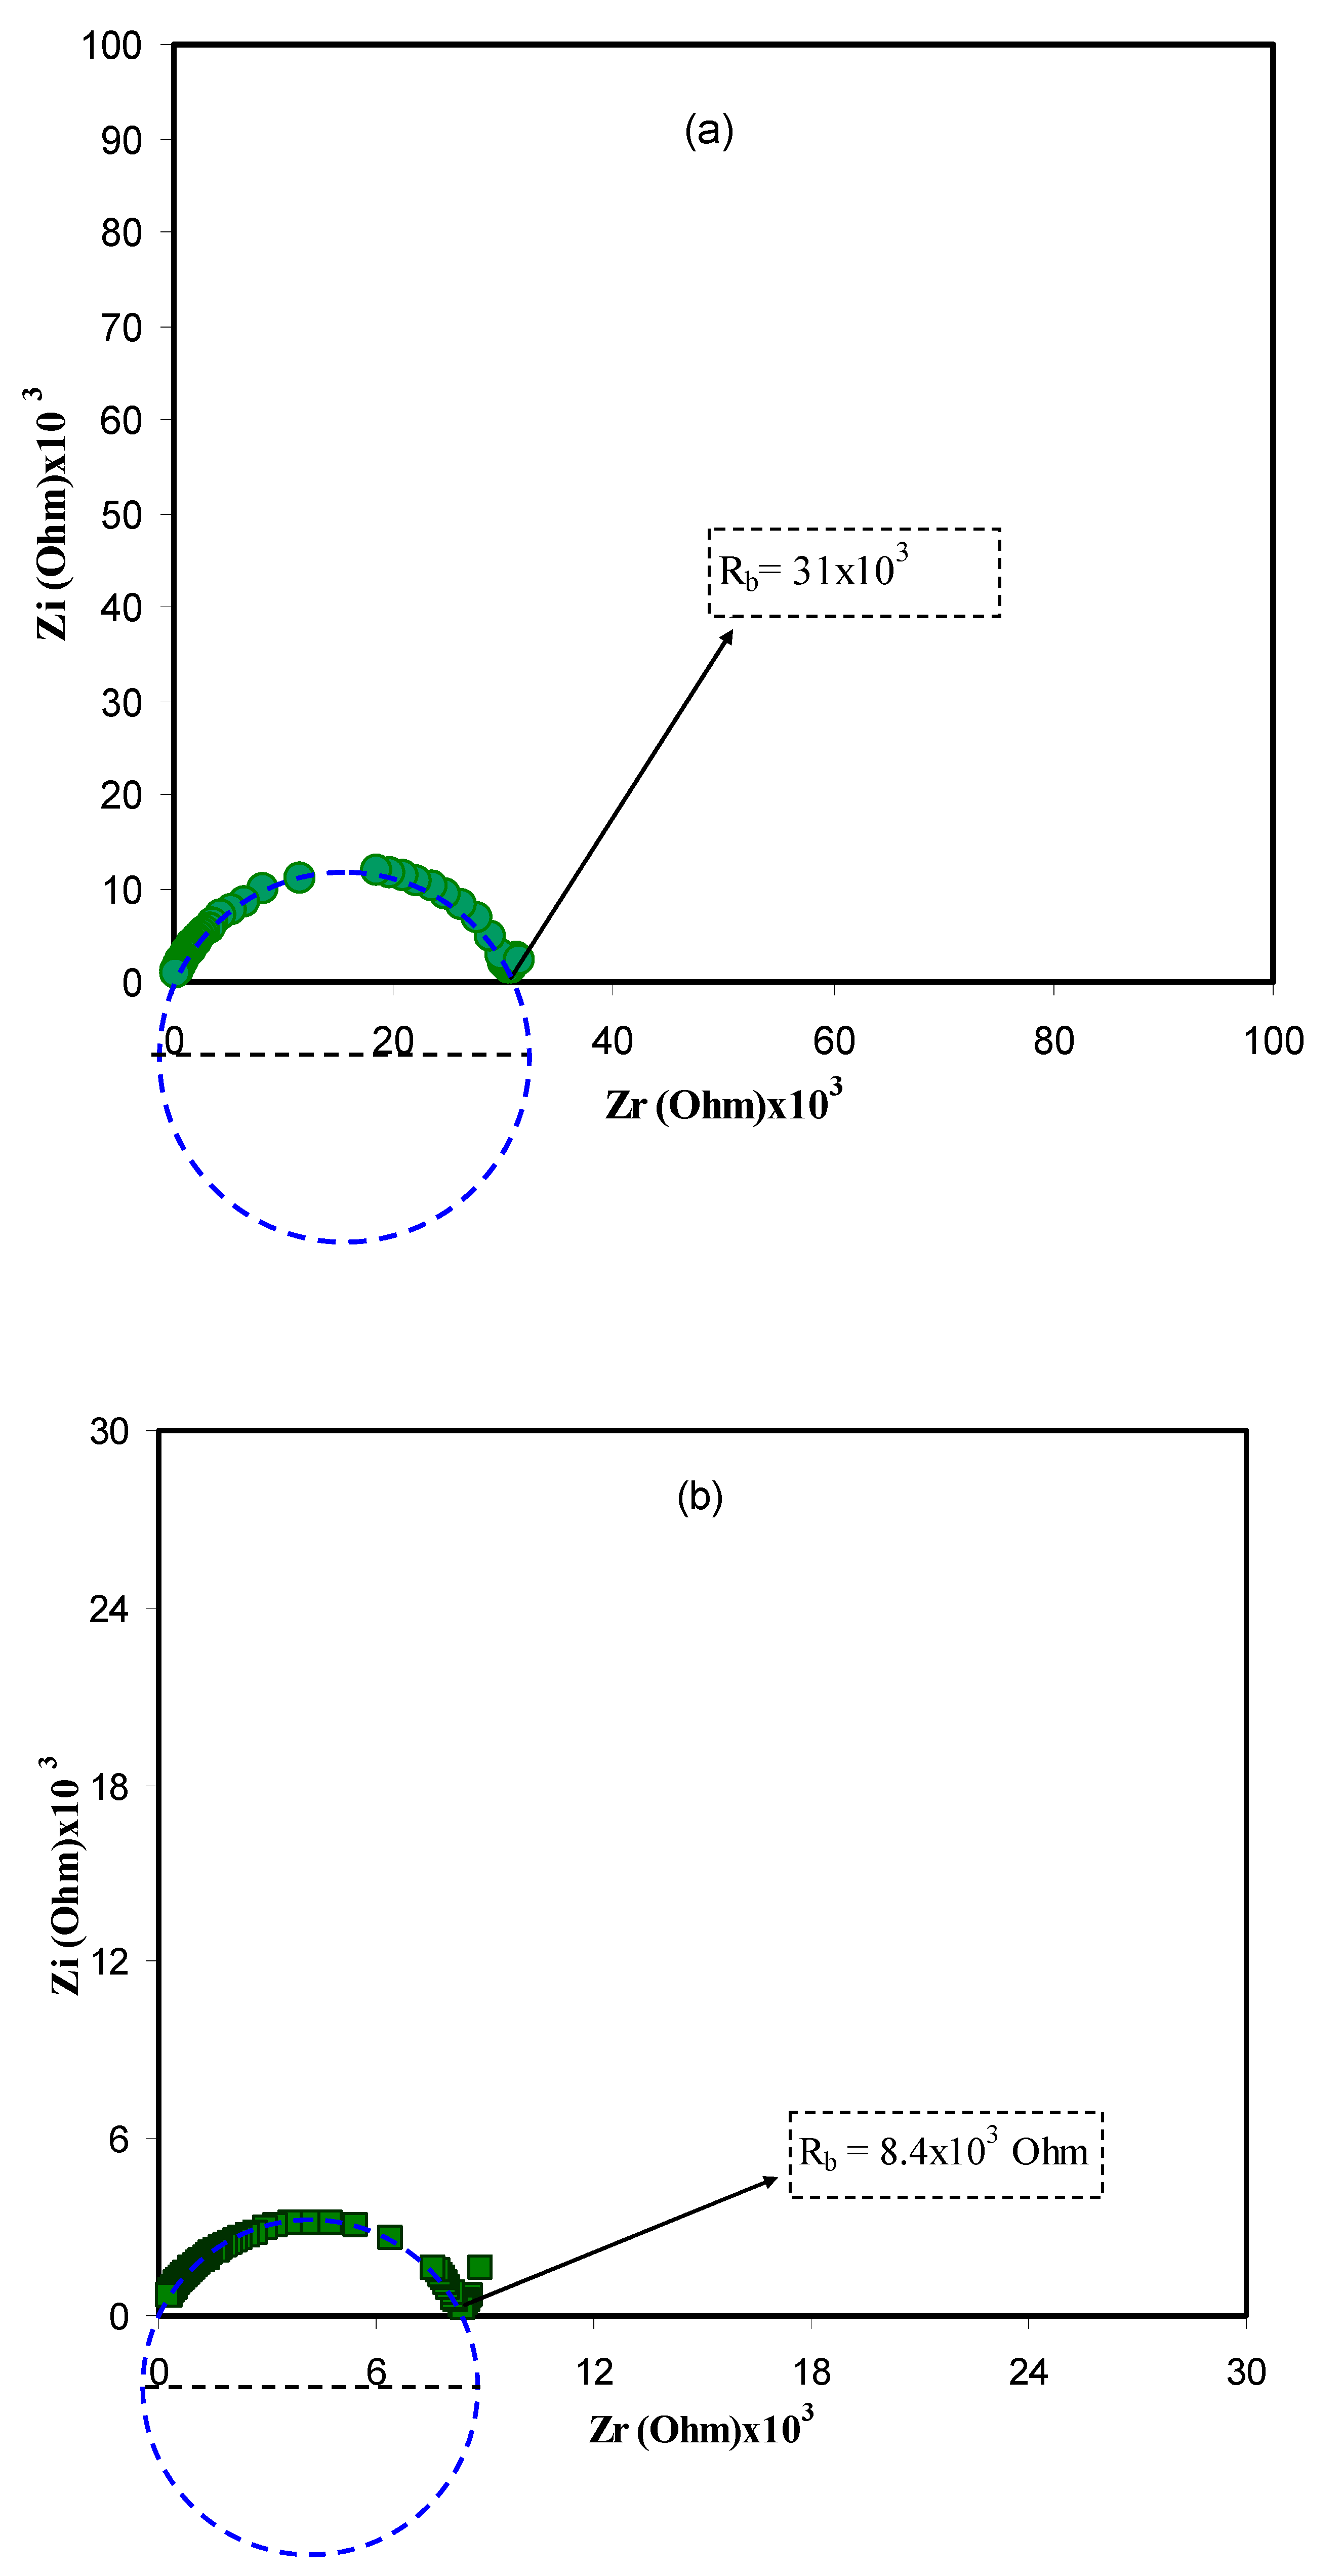
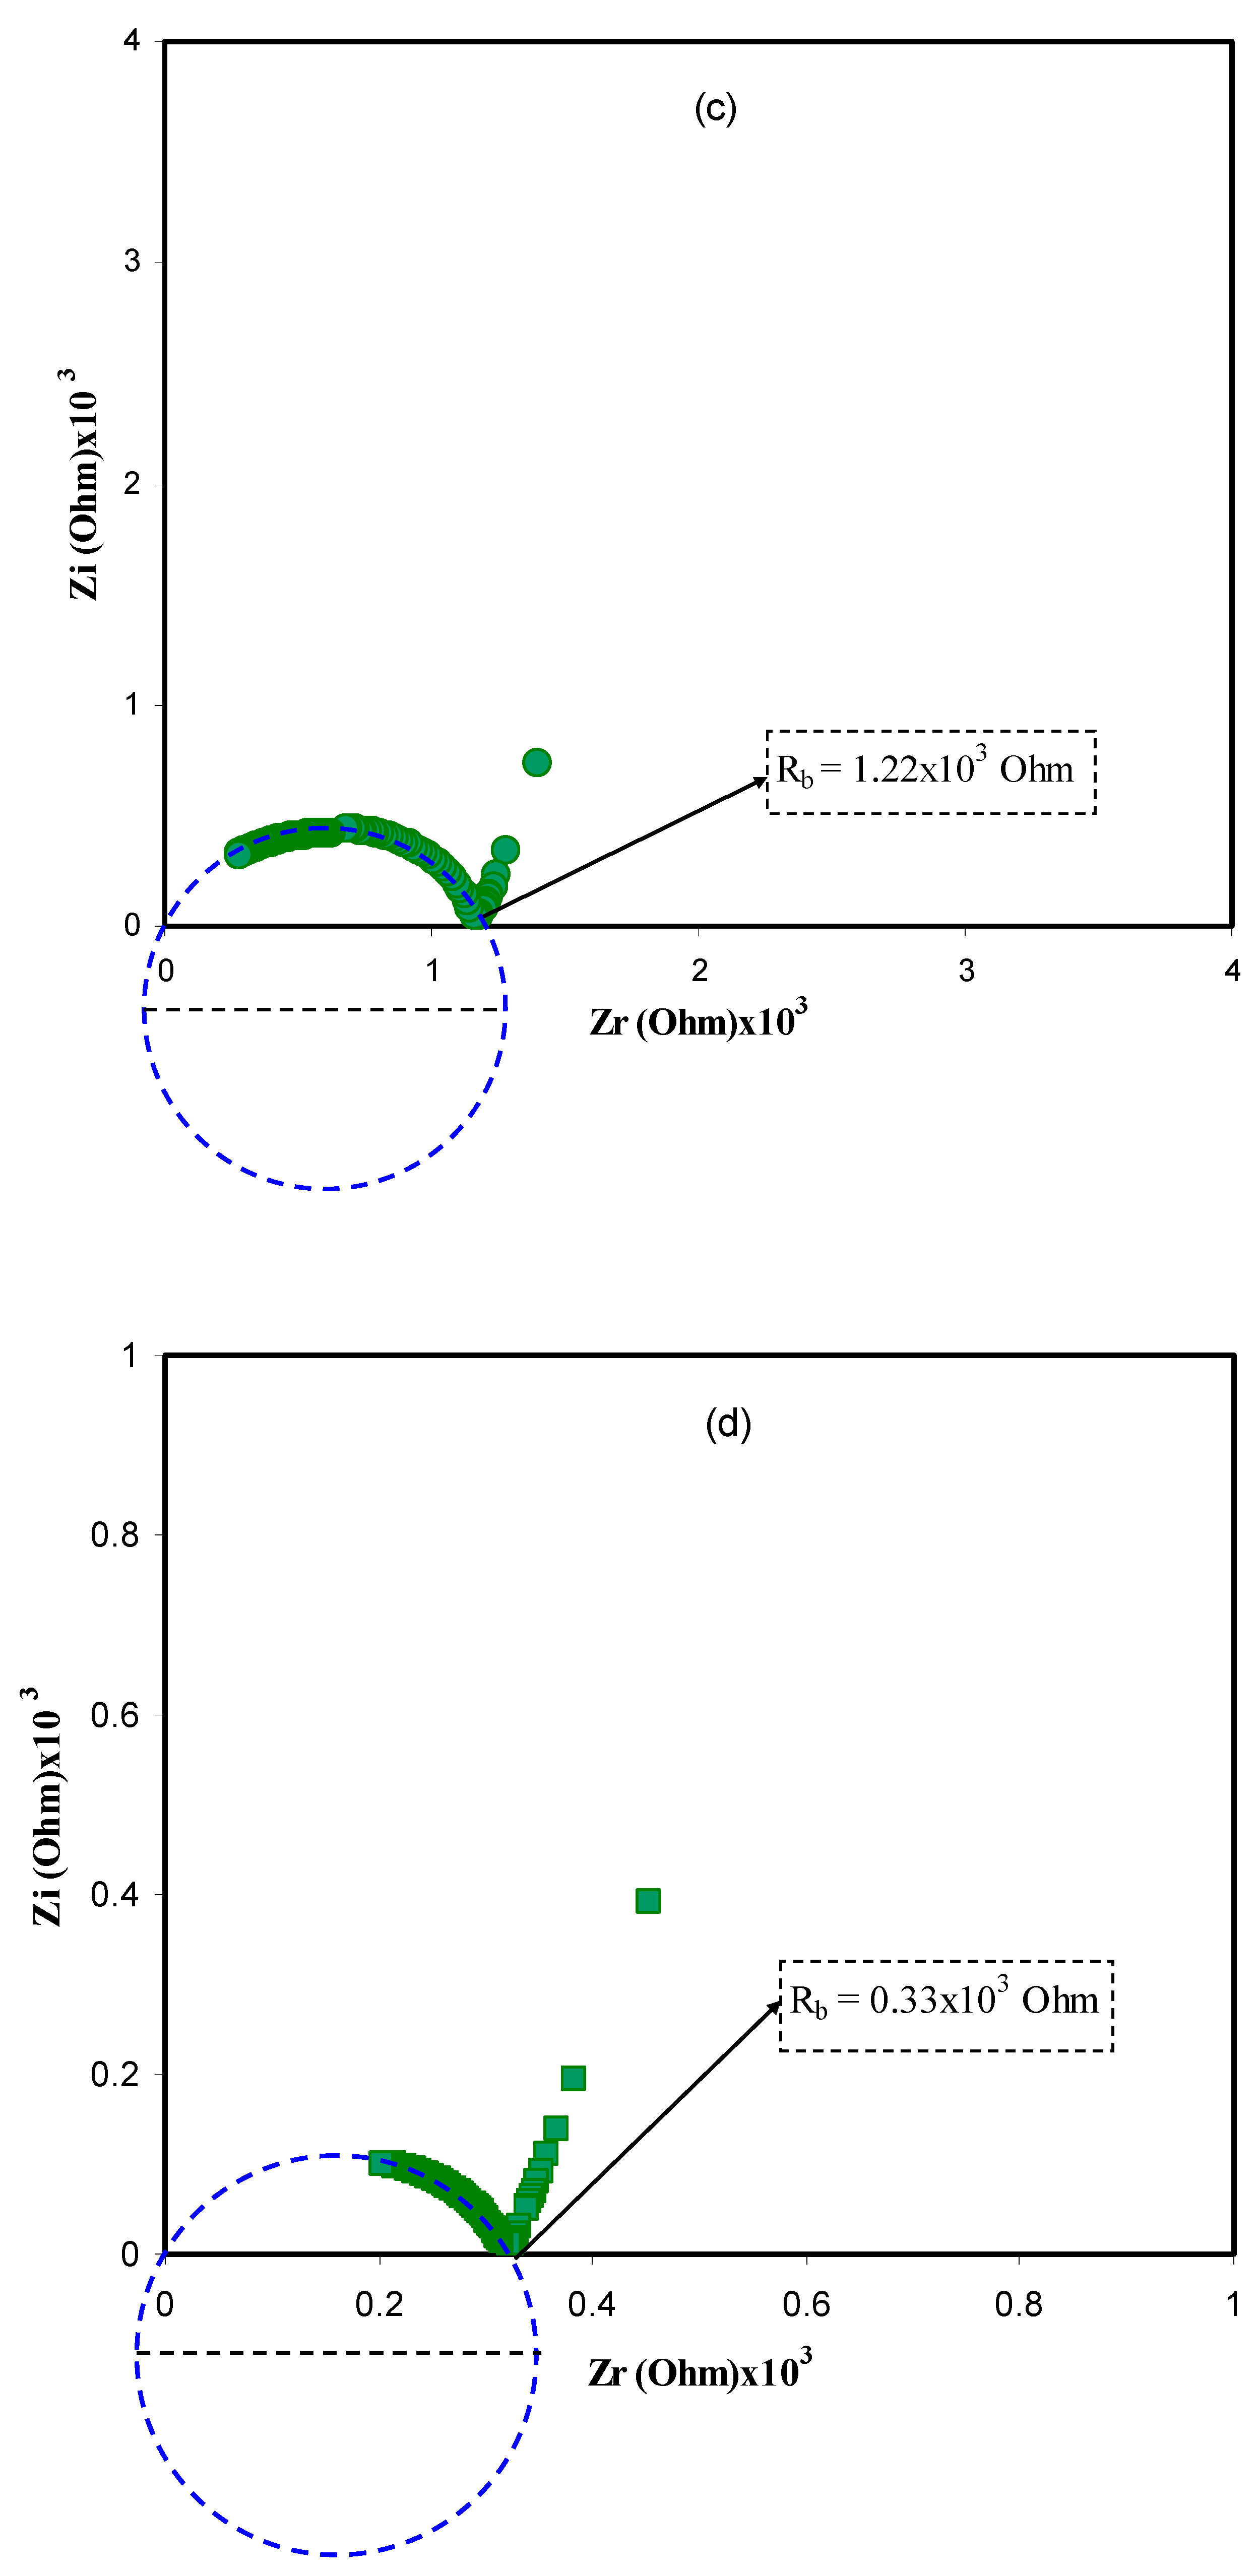
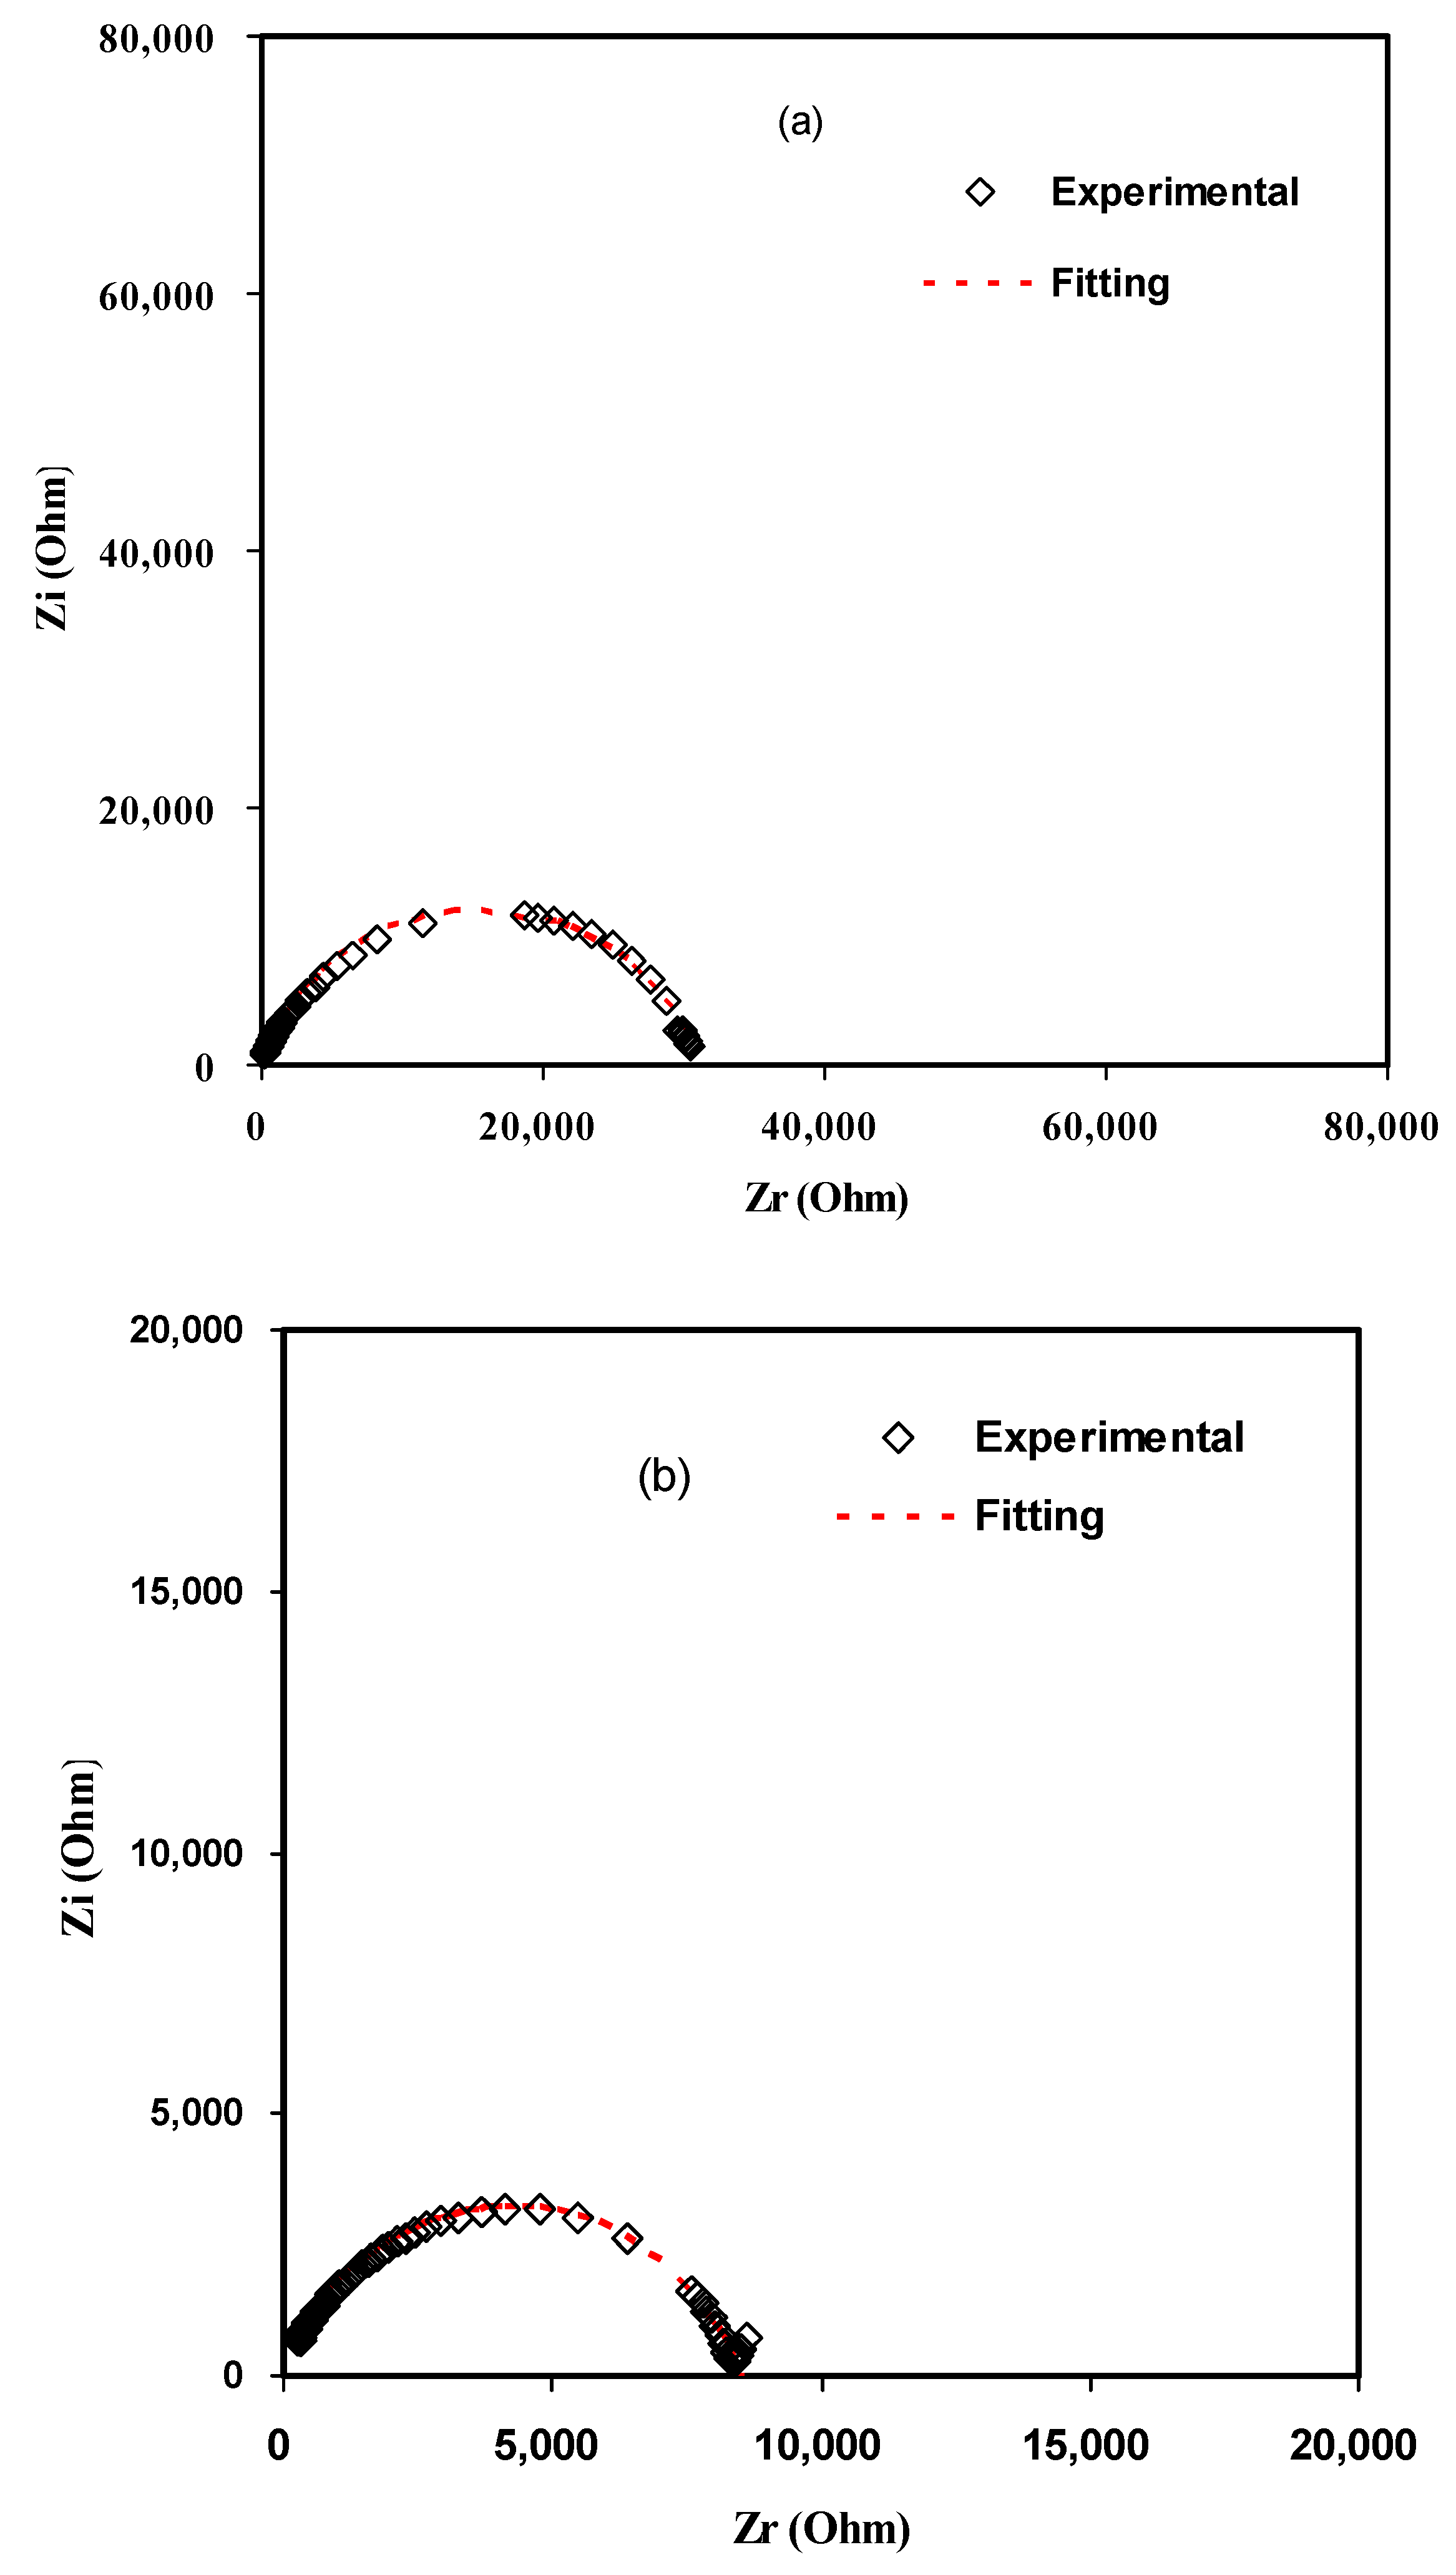
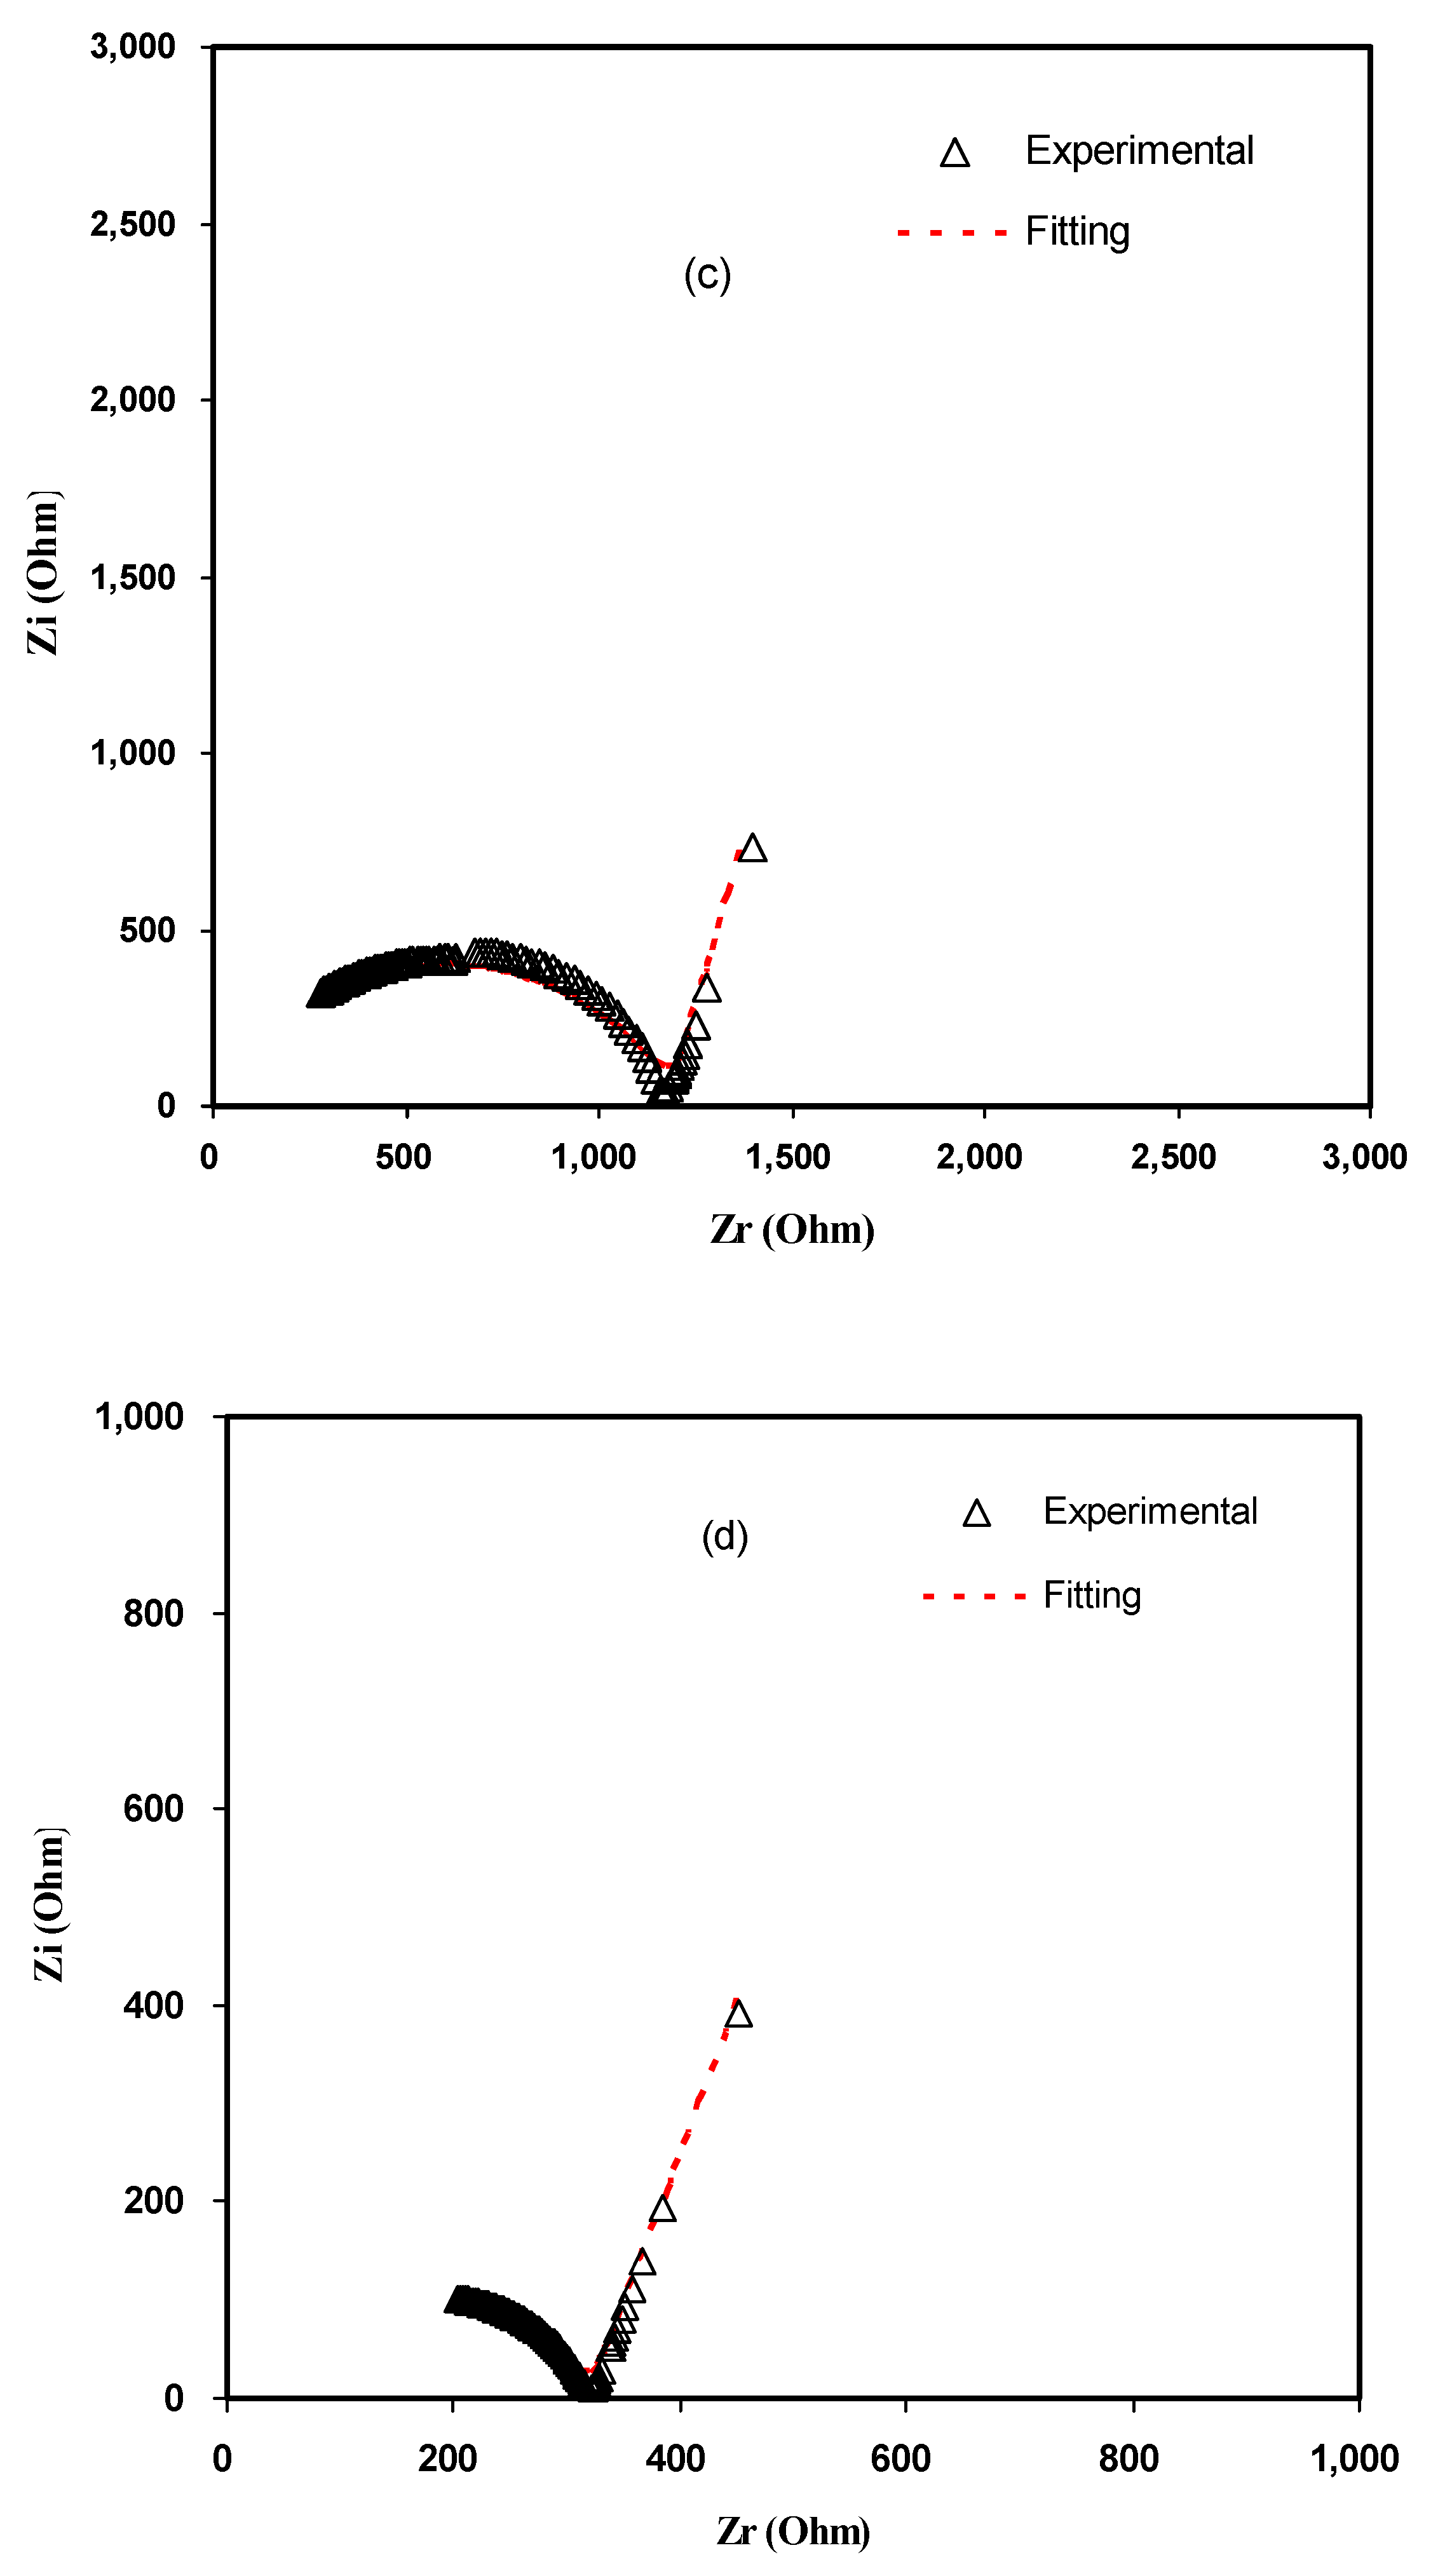
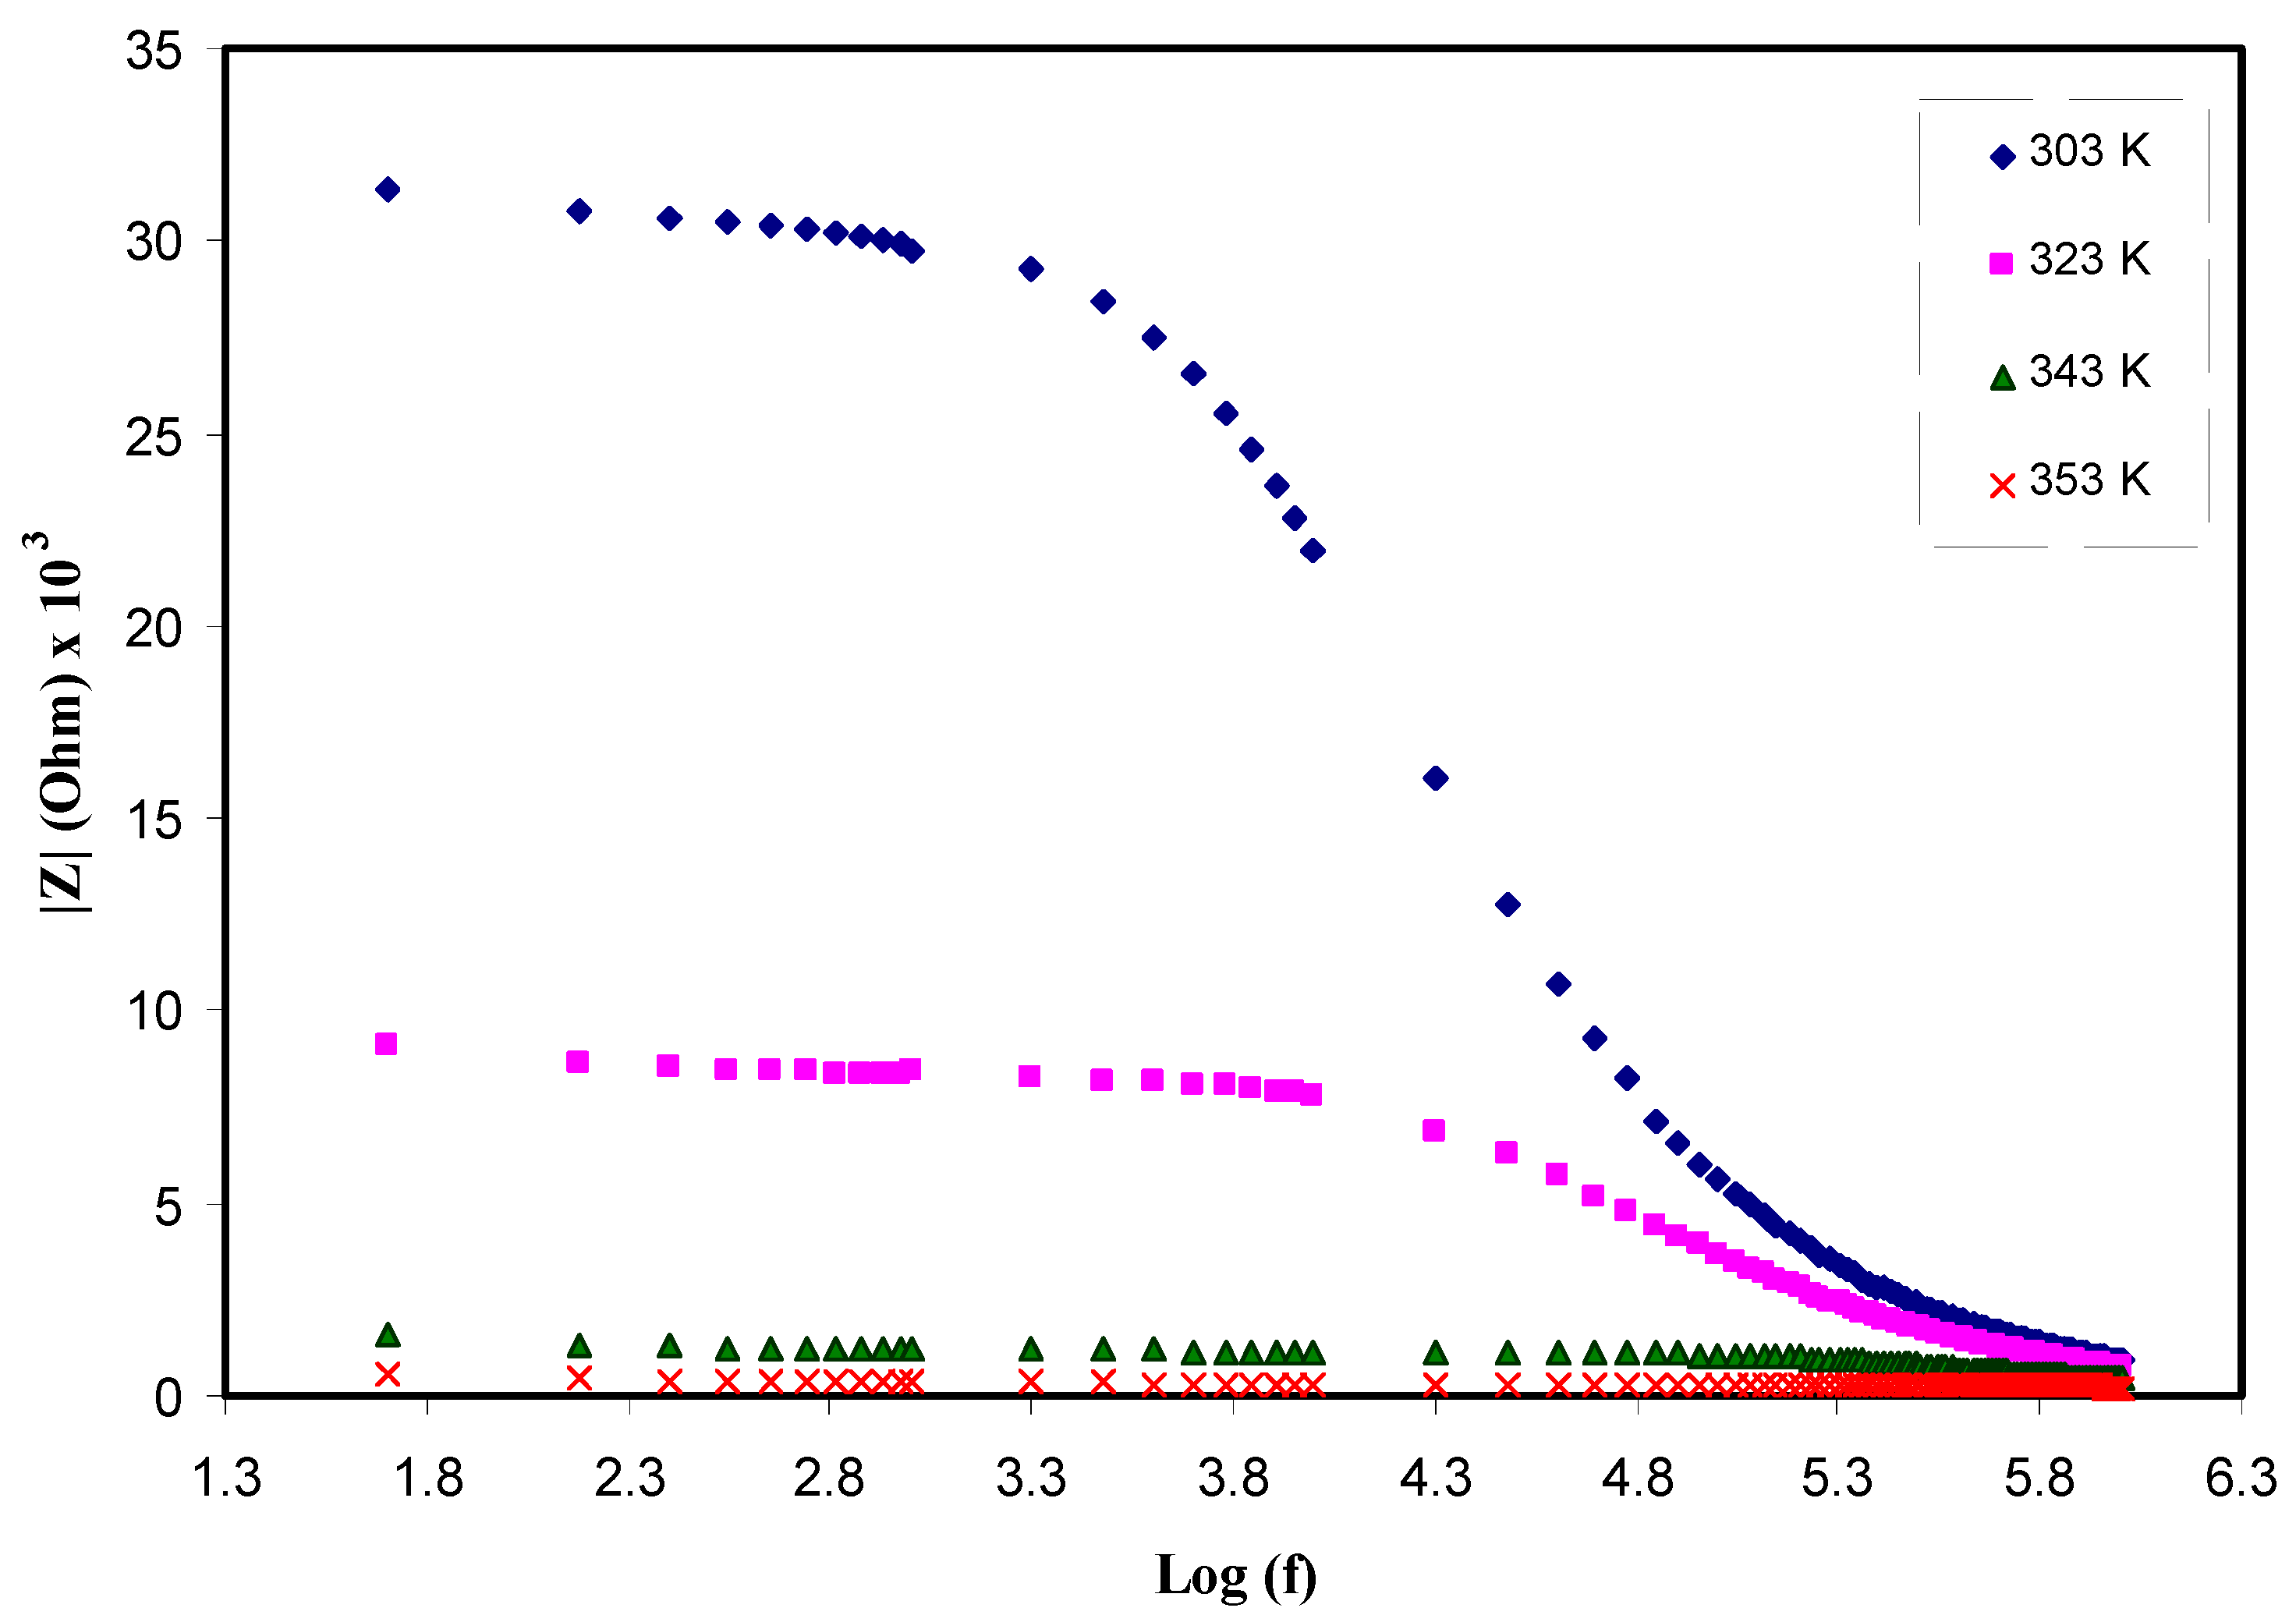
3.1. Complex Impedance Analysis
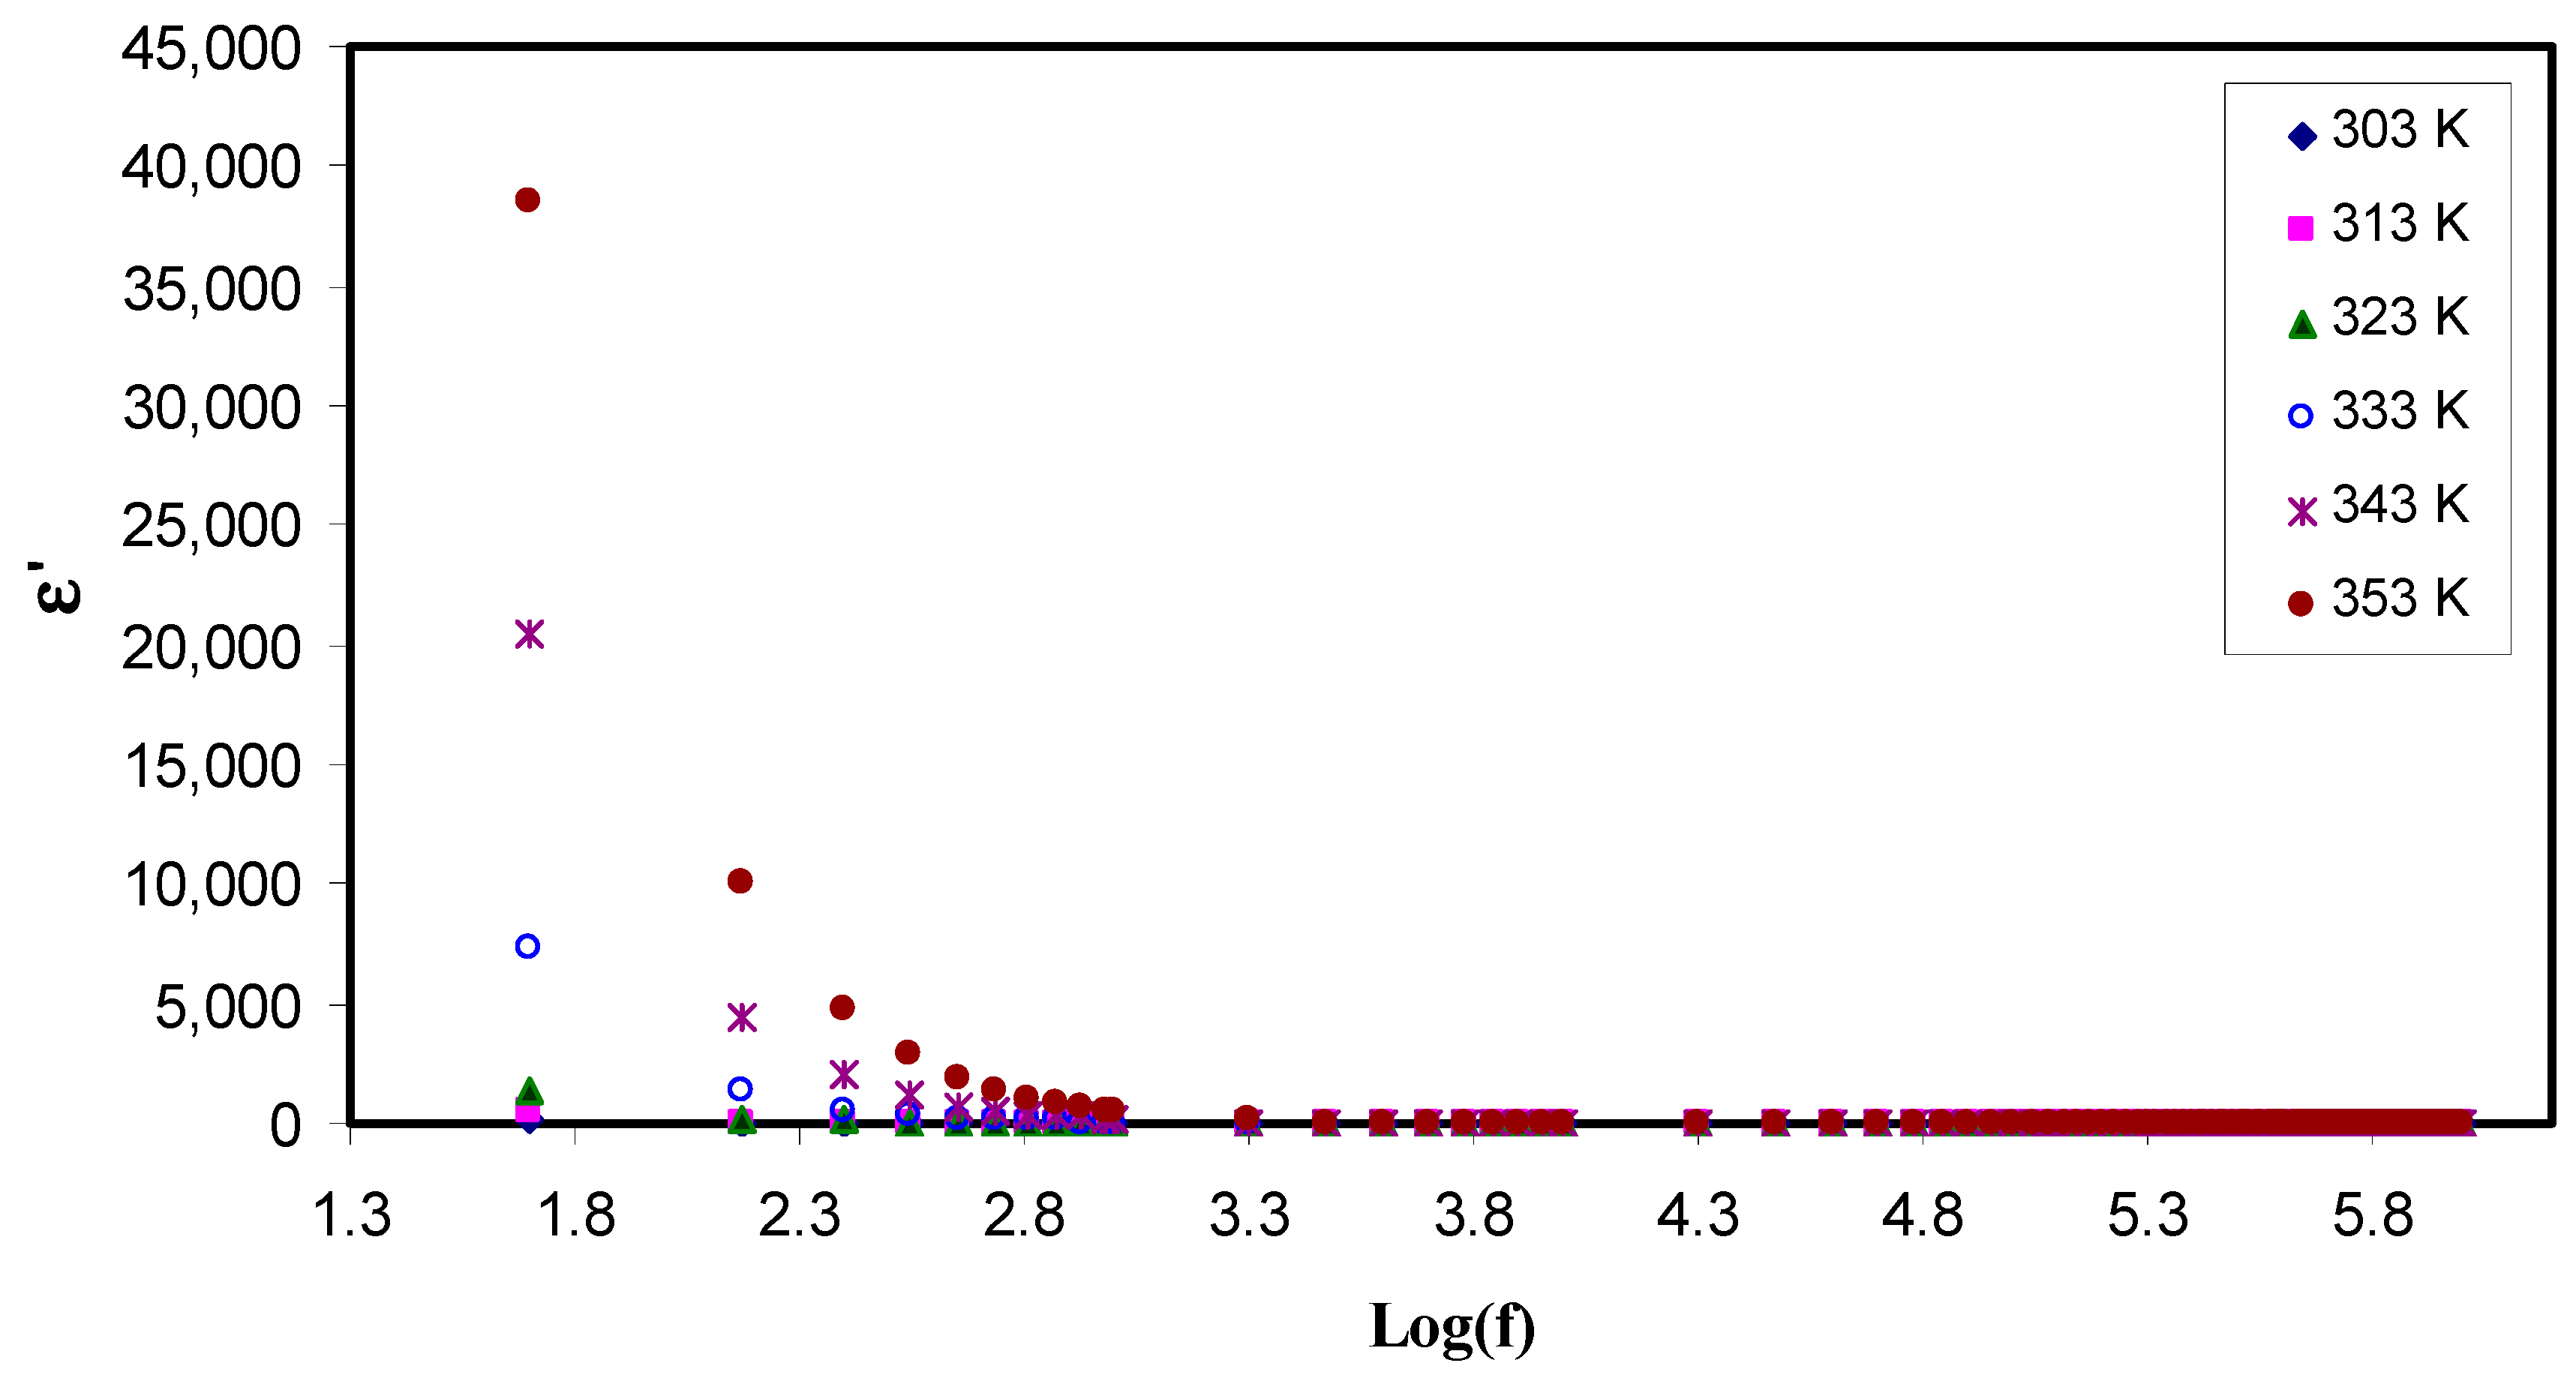
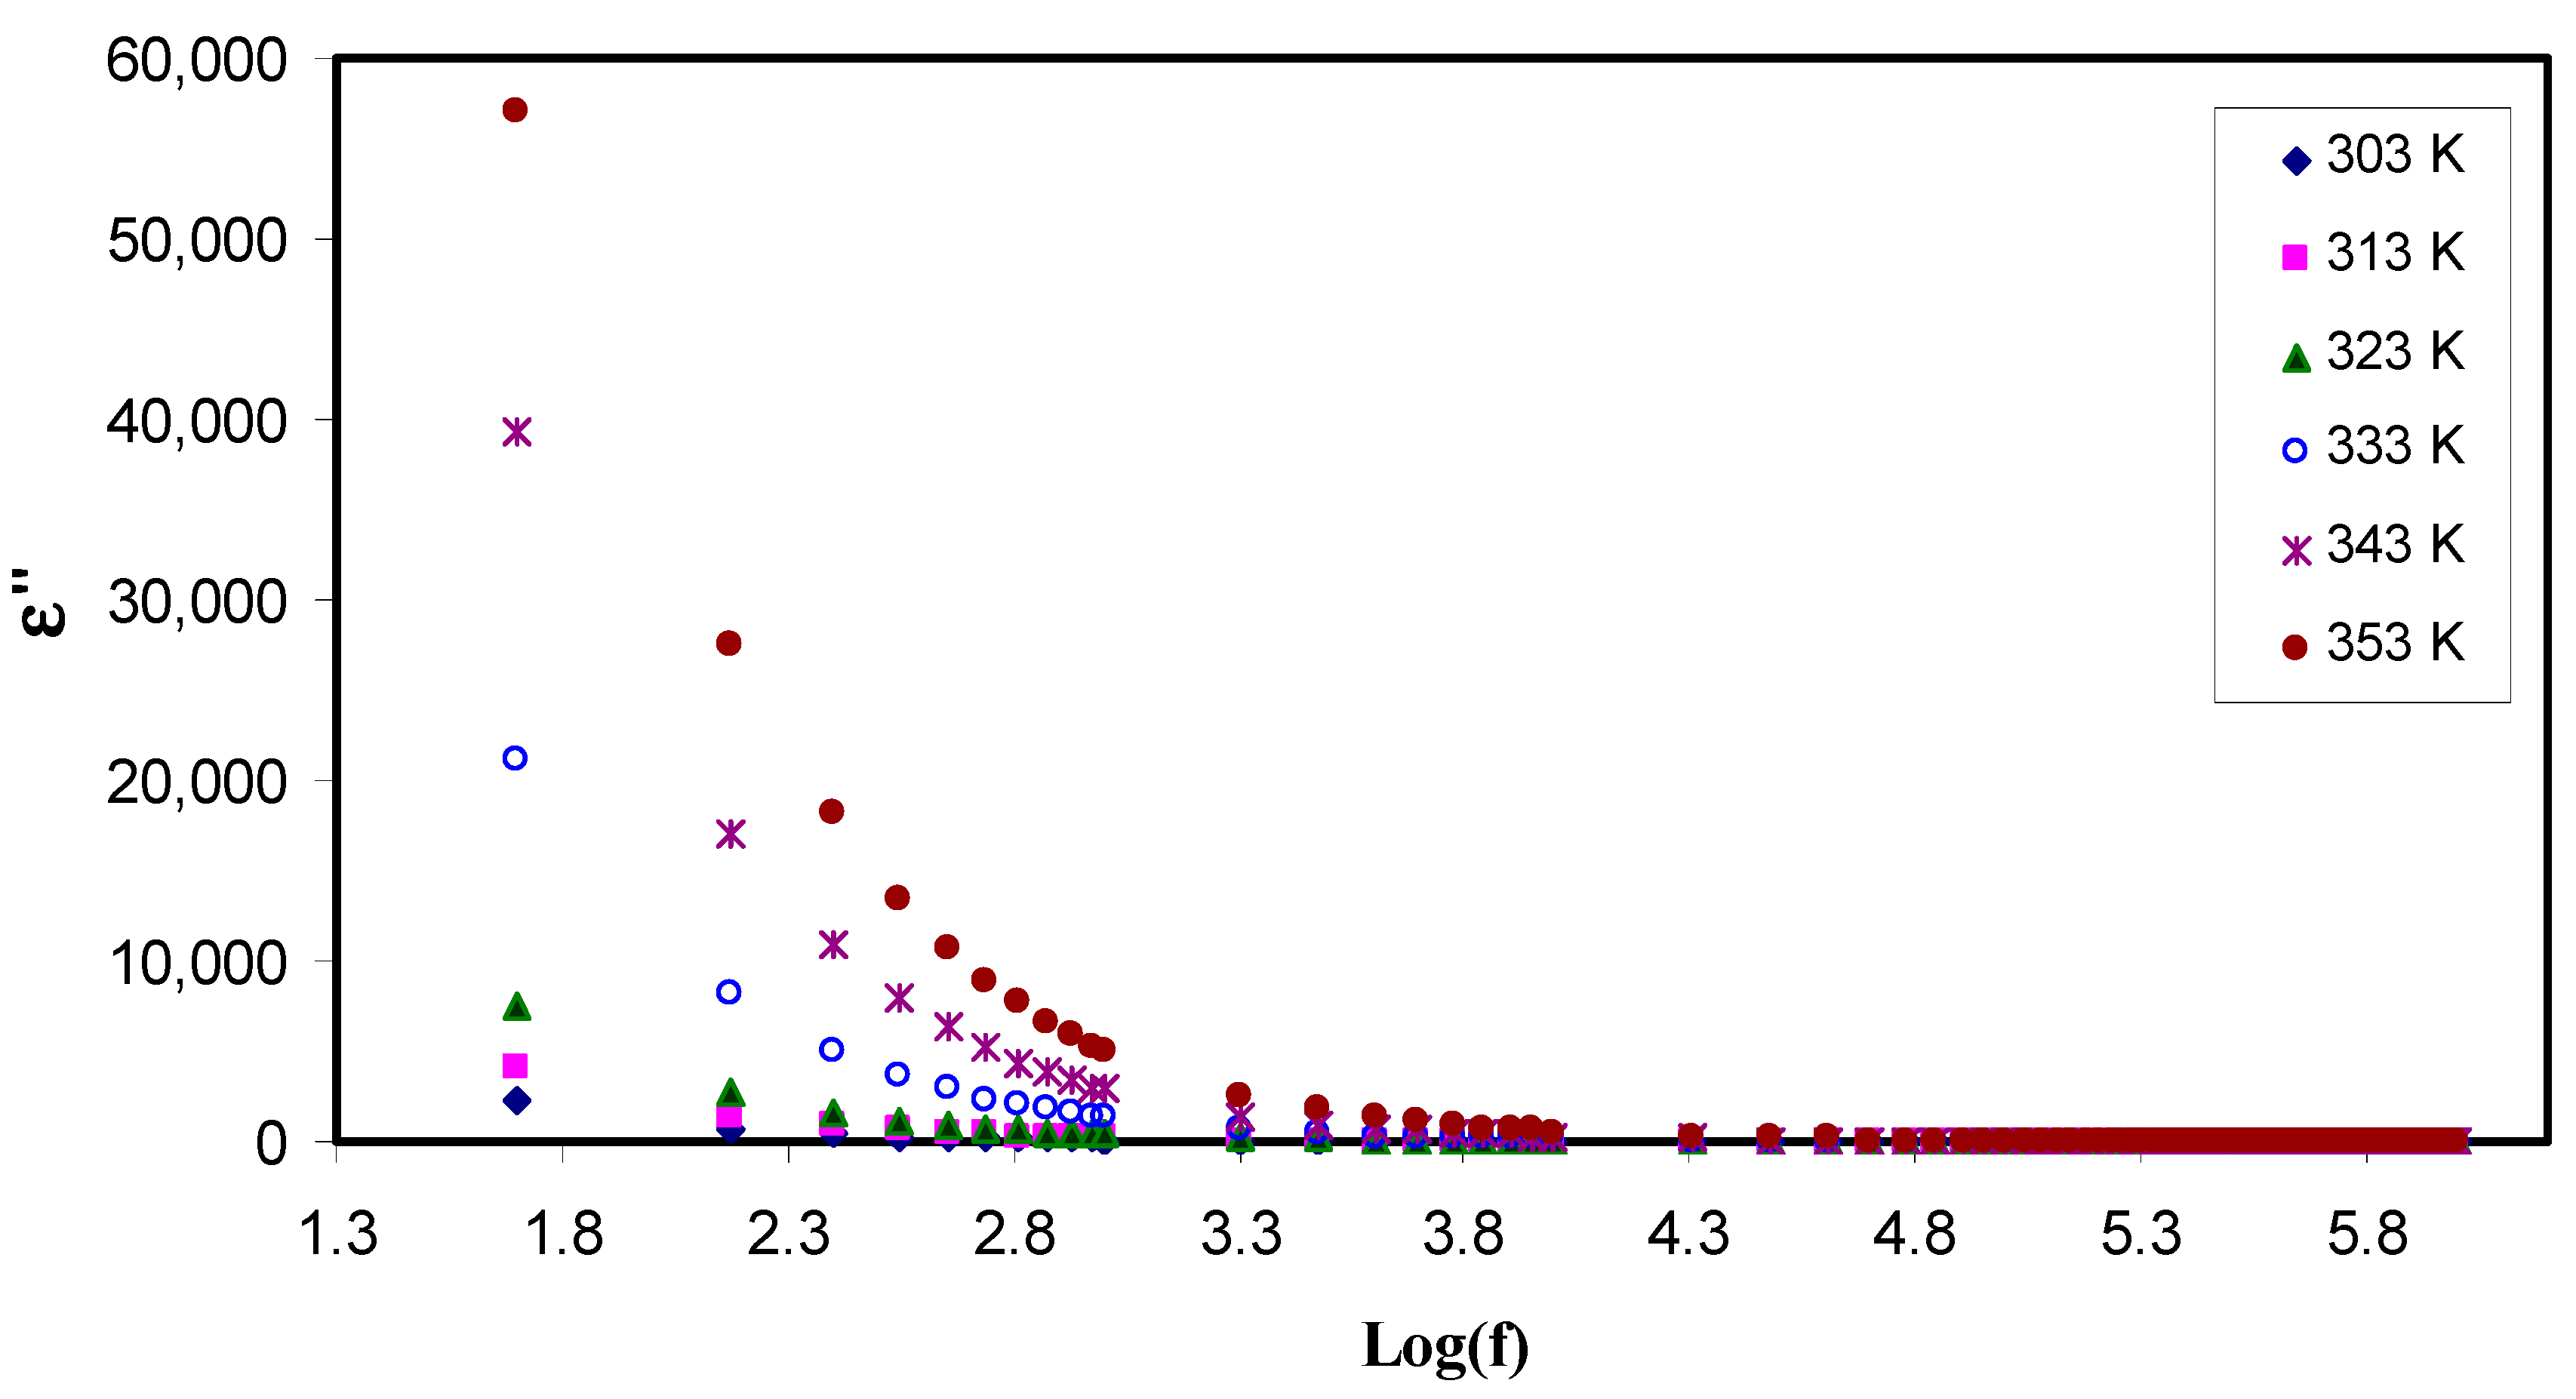
3.2. Dielectric Properties
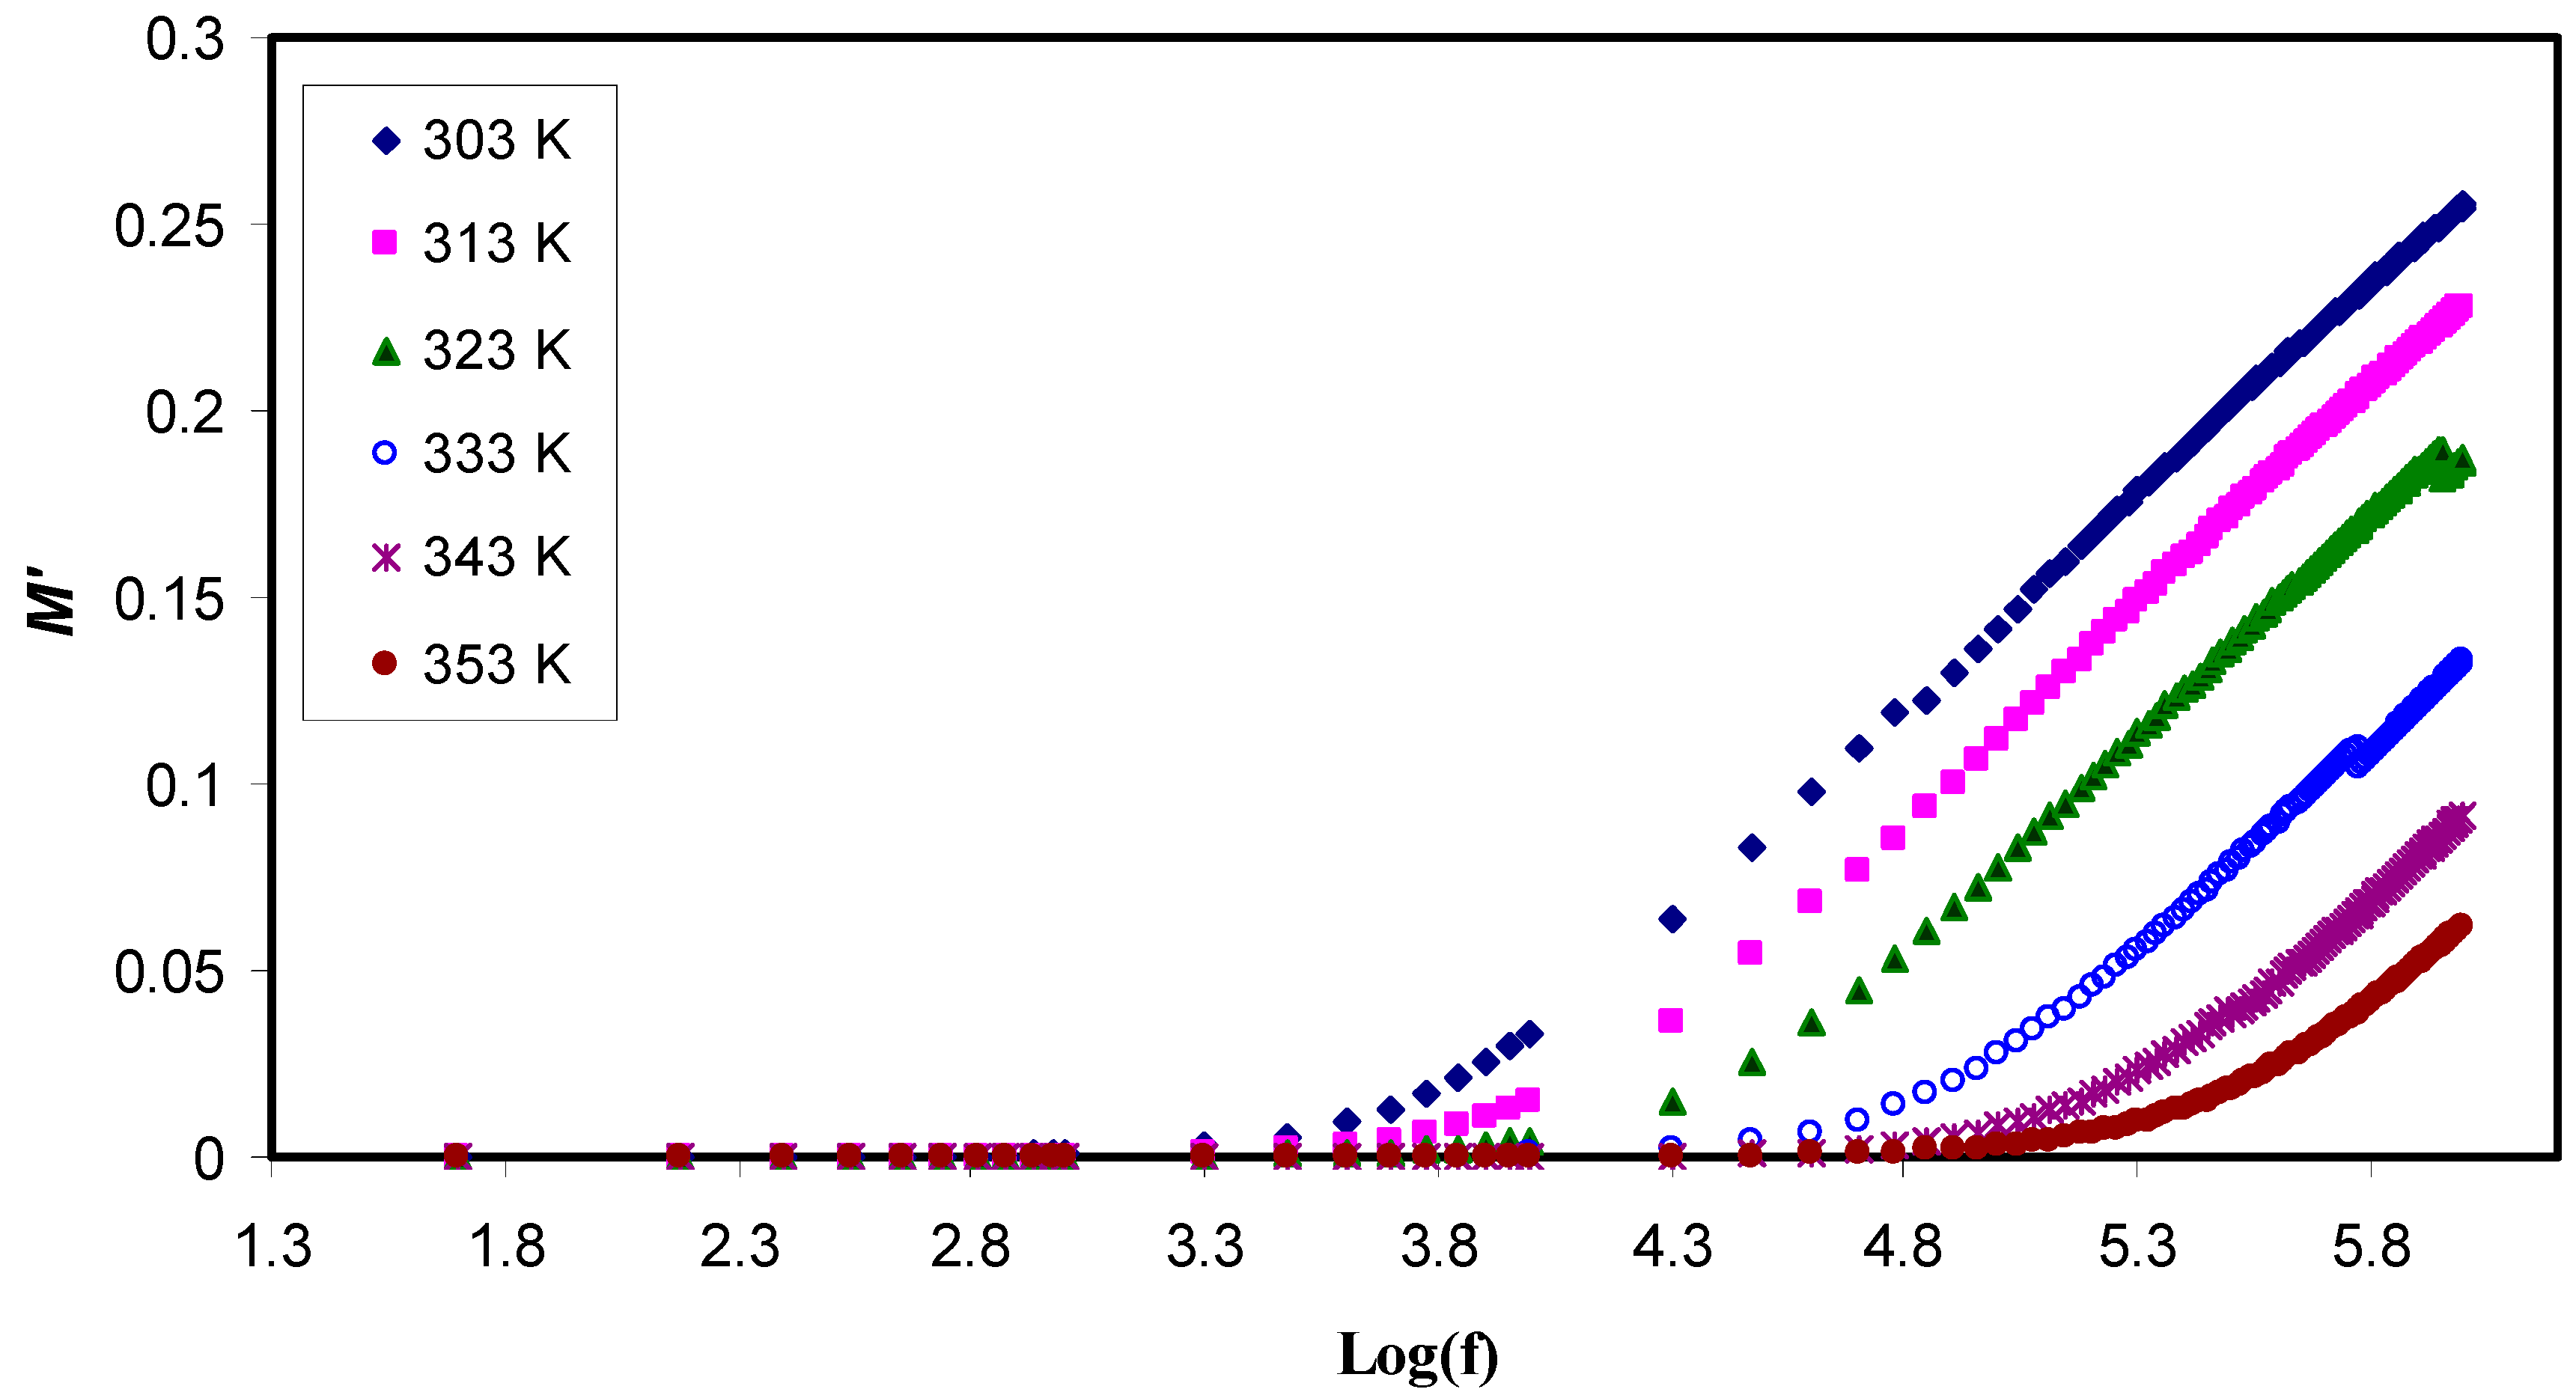
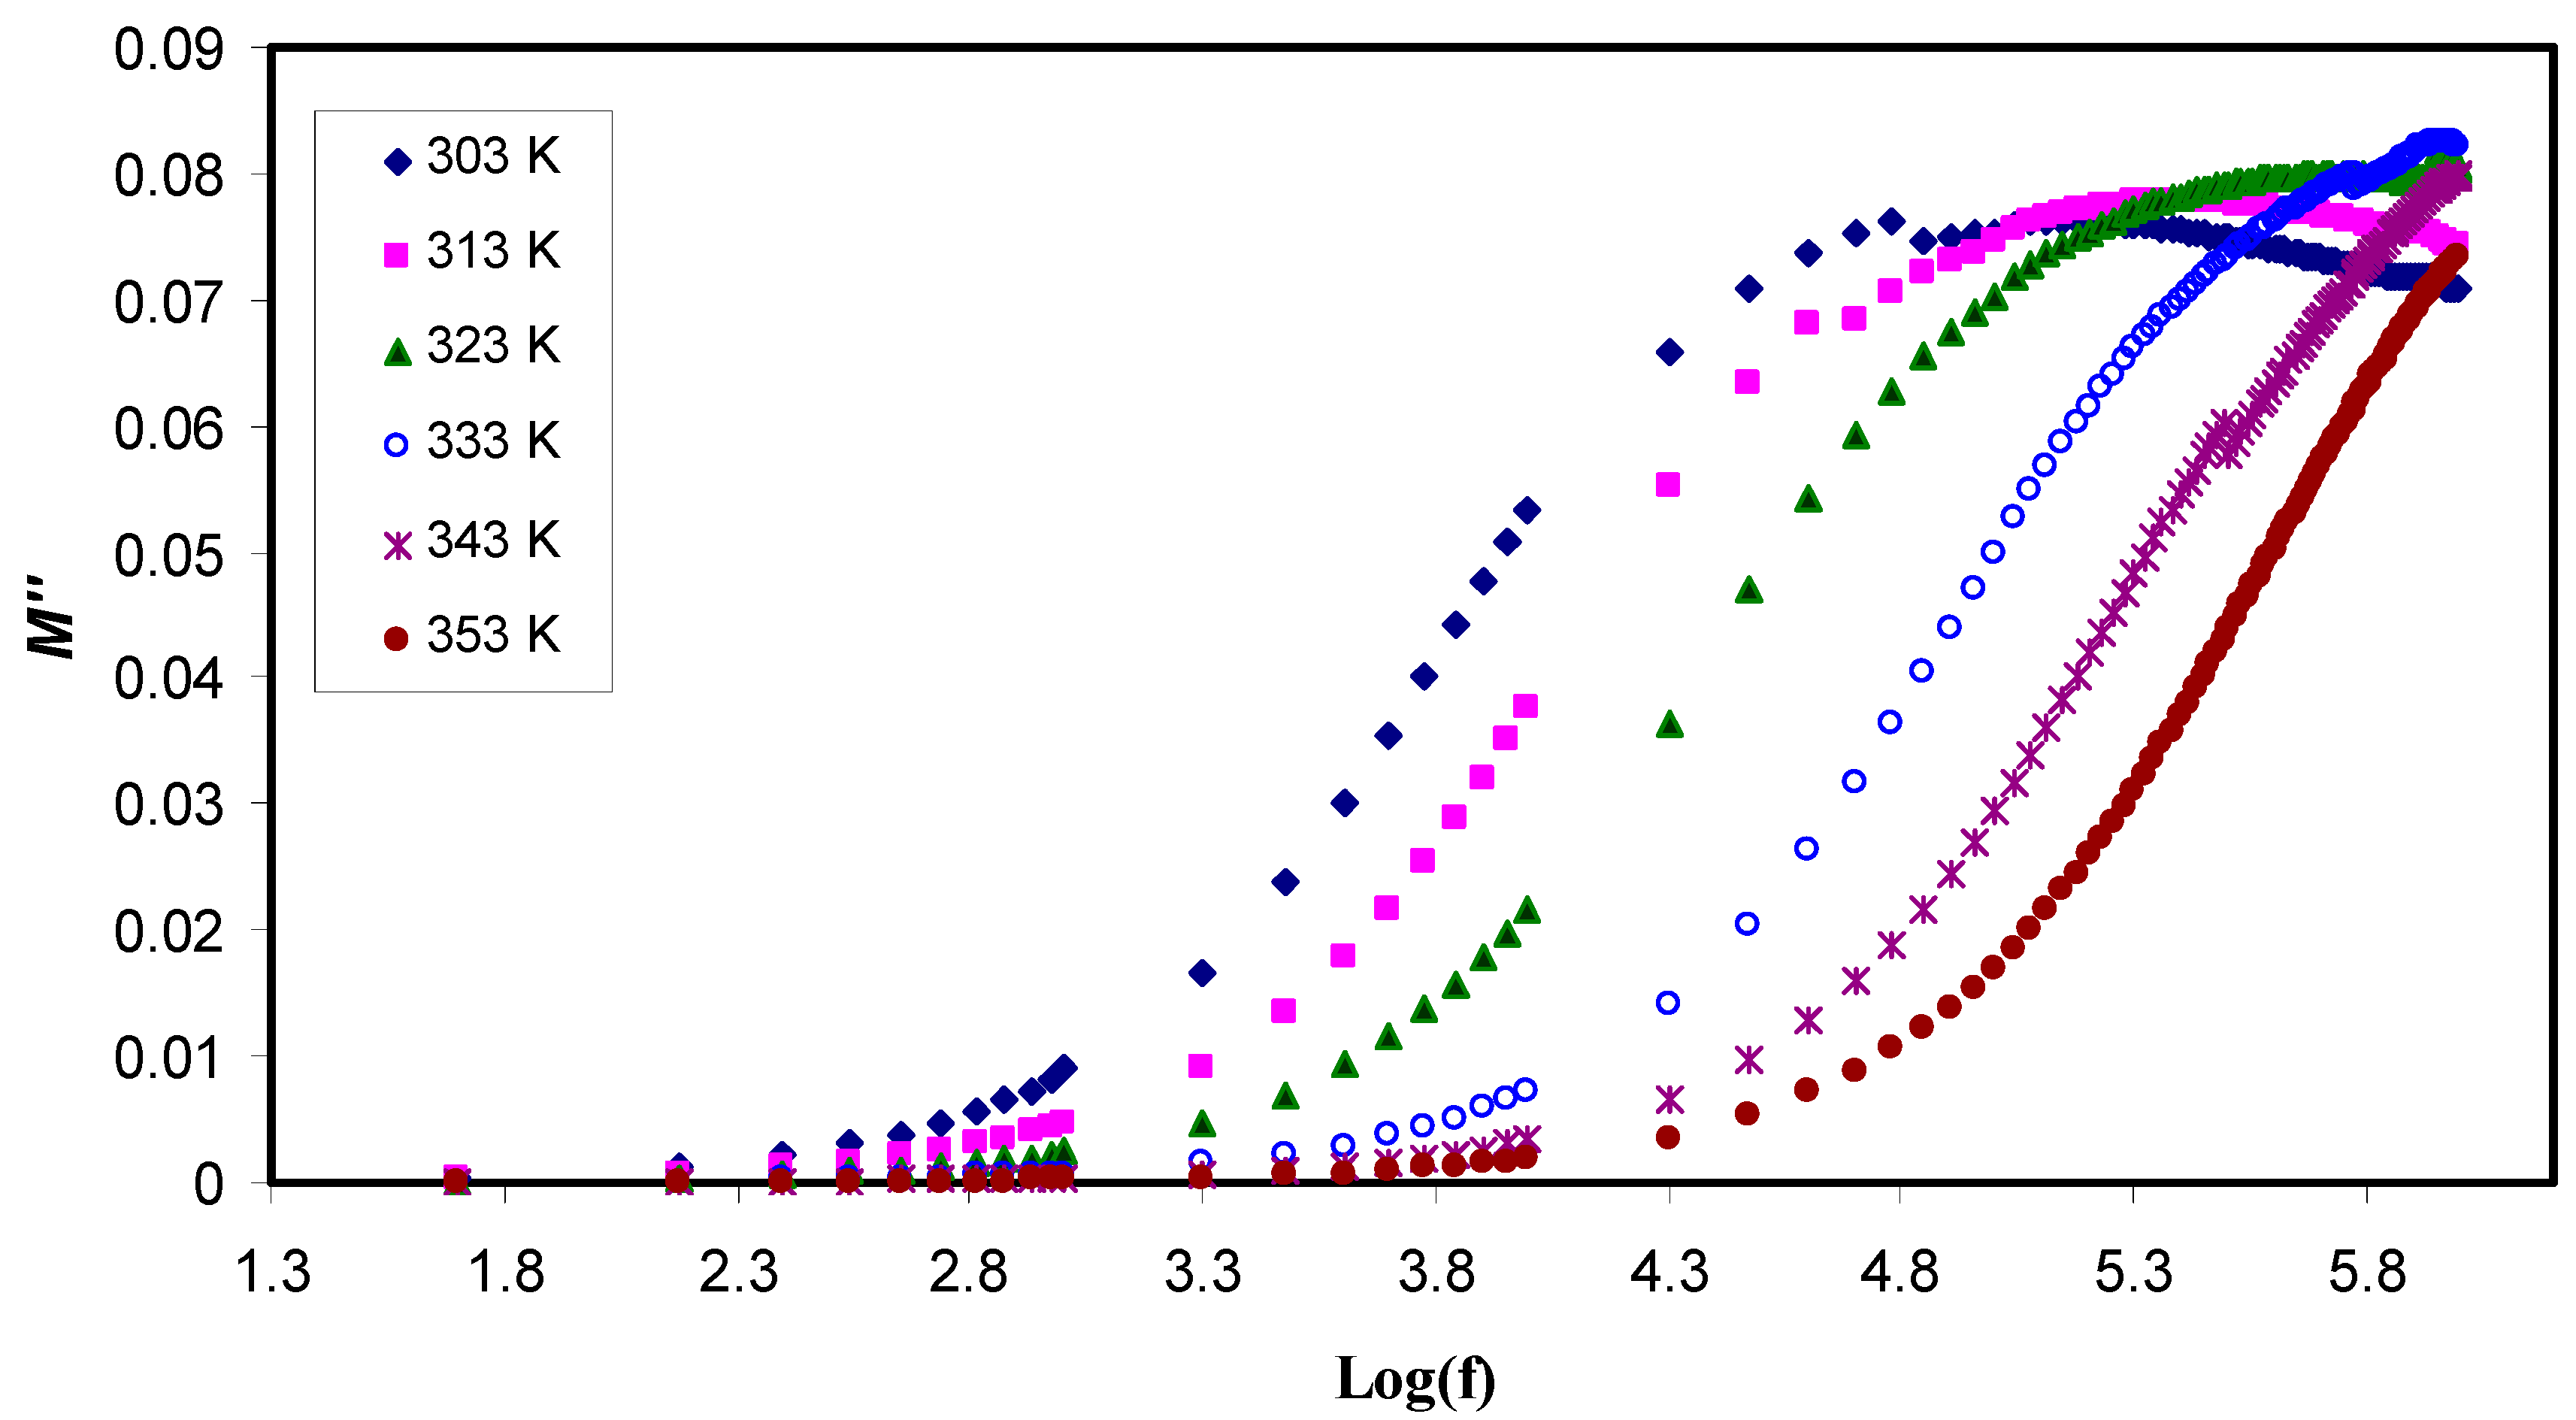
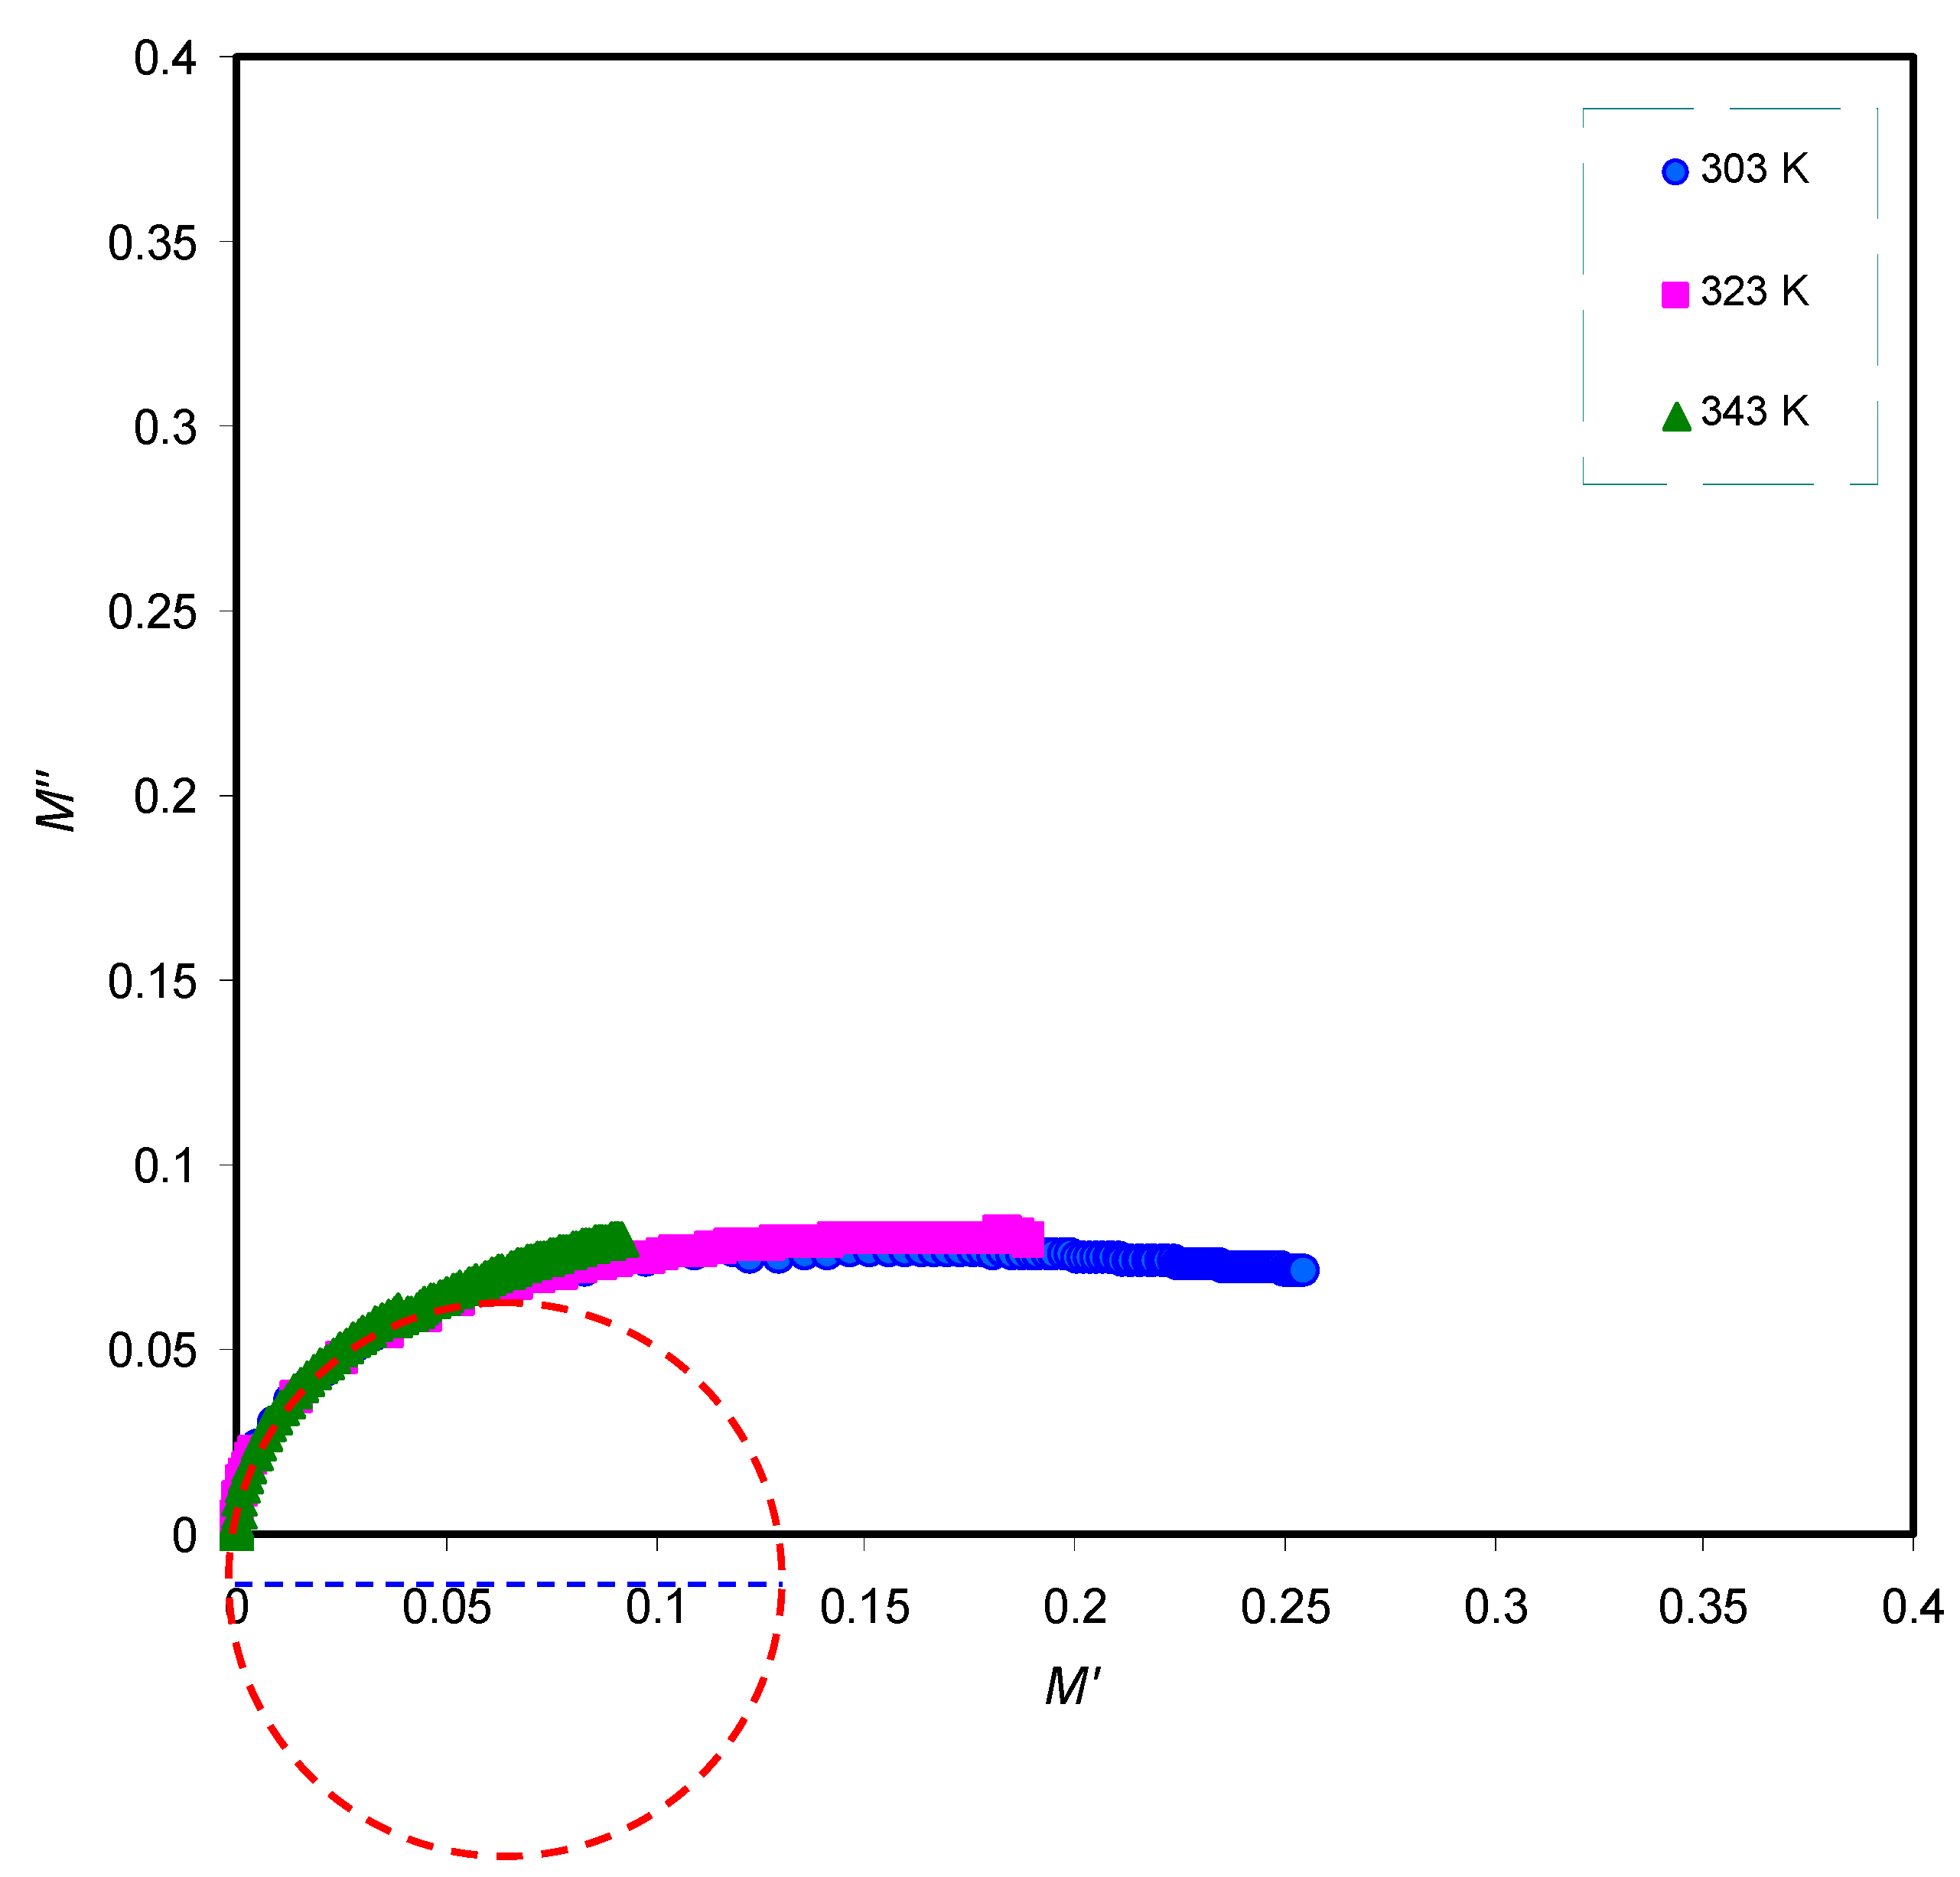
3.3. Electric Modulus Analysis
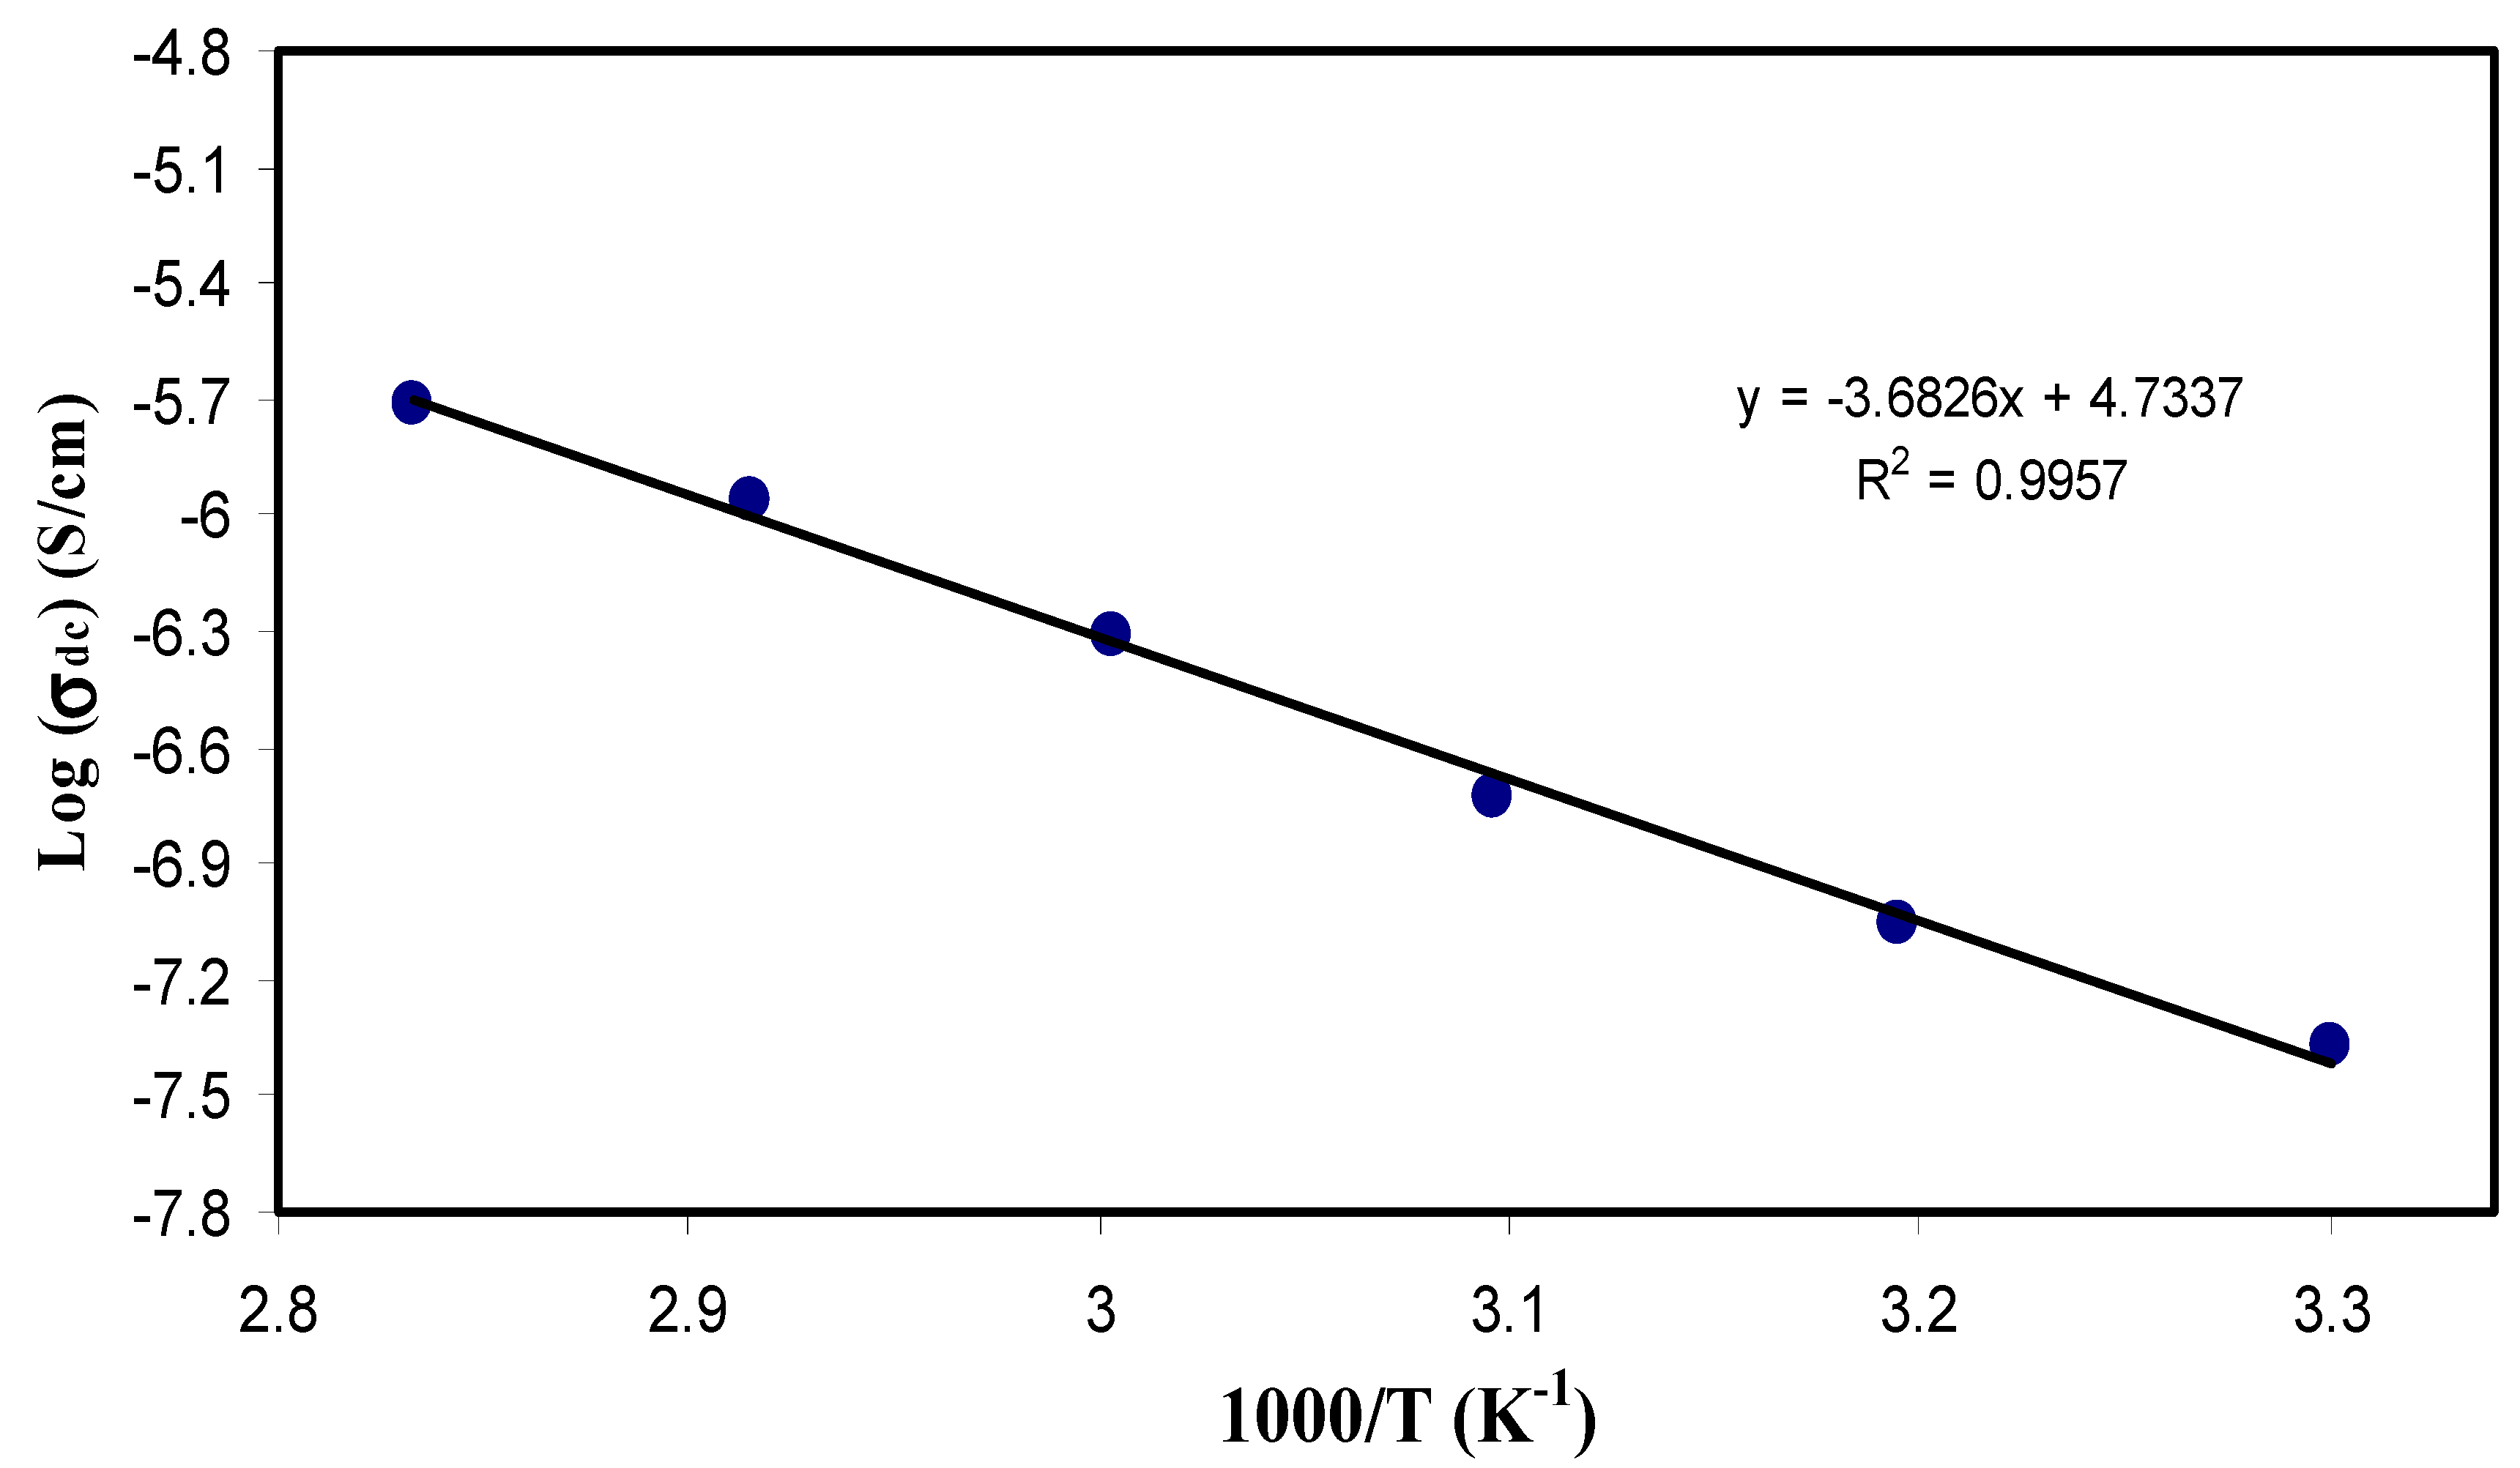
3.4. DC Conductivity Analysis
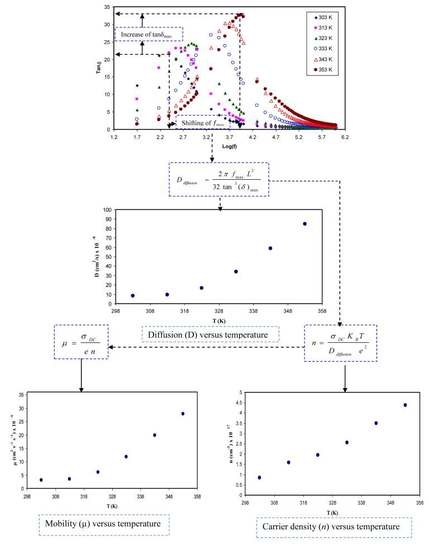
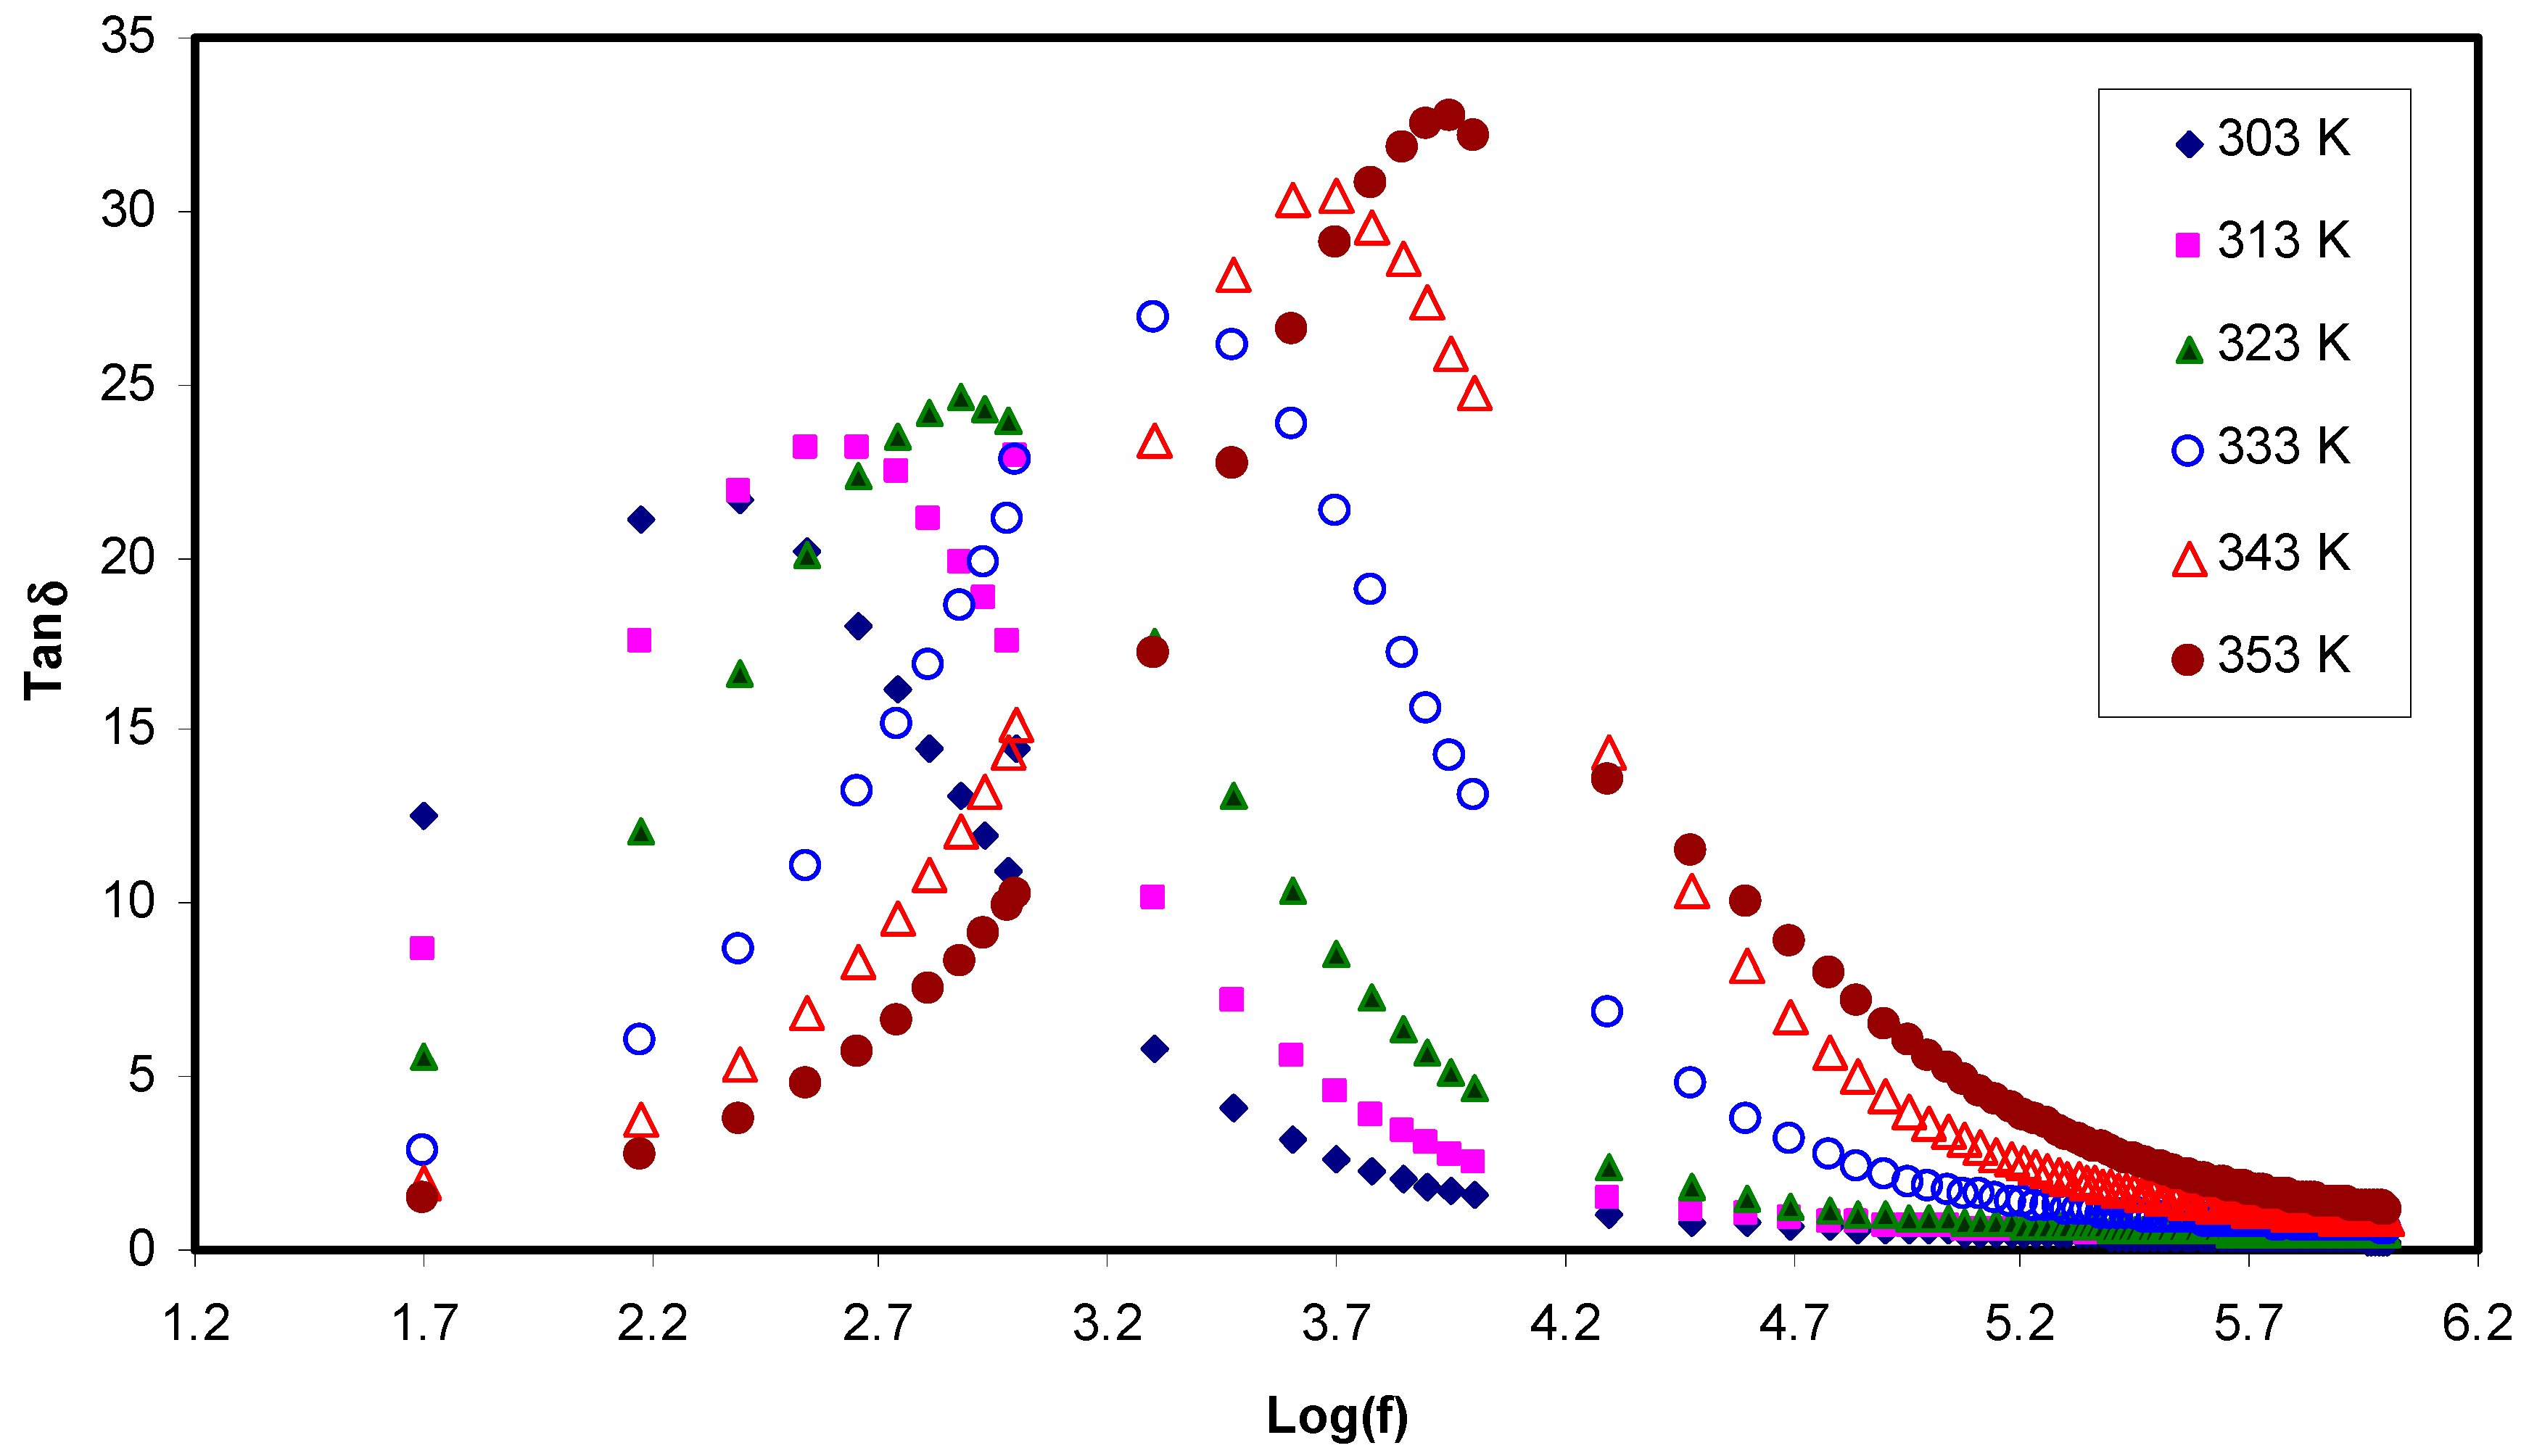
3.5. Loss Tangent Analysis and Ion Transport Parameters
3.5.1. Loss Tangent Analysis
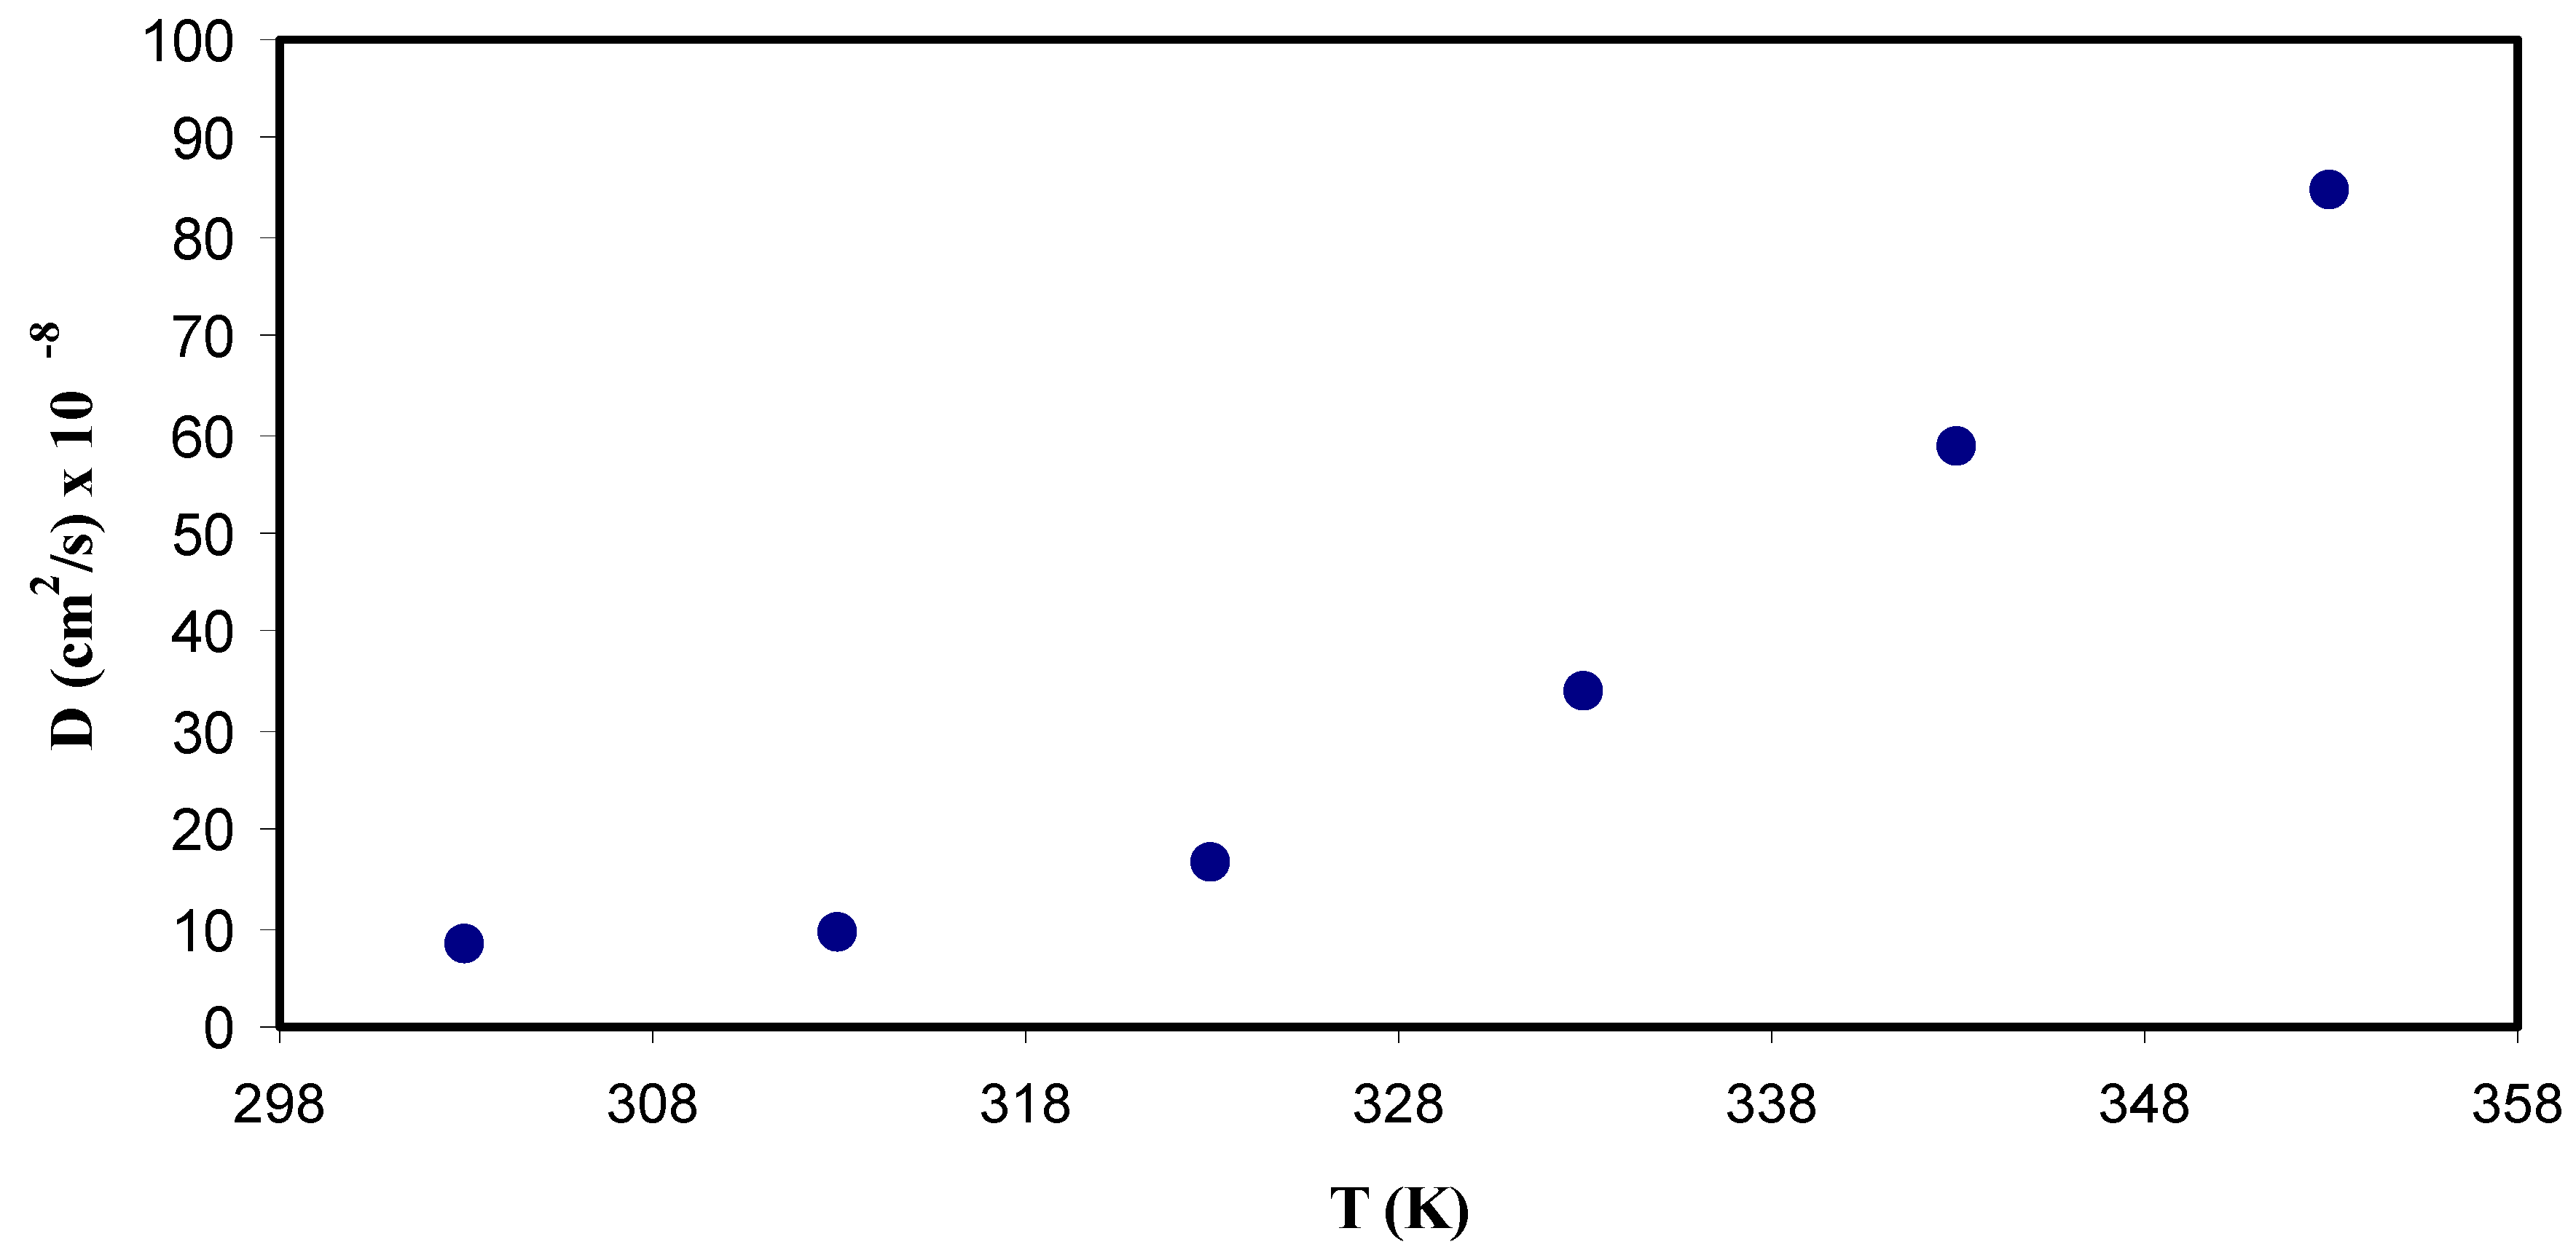
3.5.2. Diffusion Coefficient Analysis
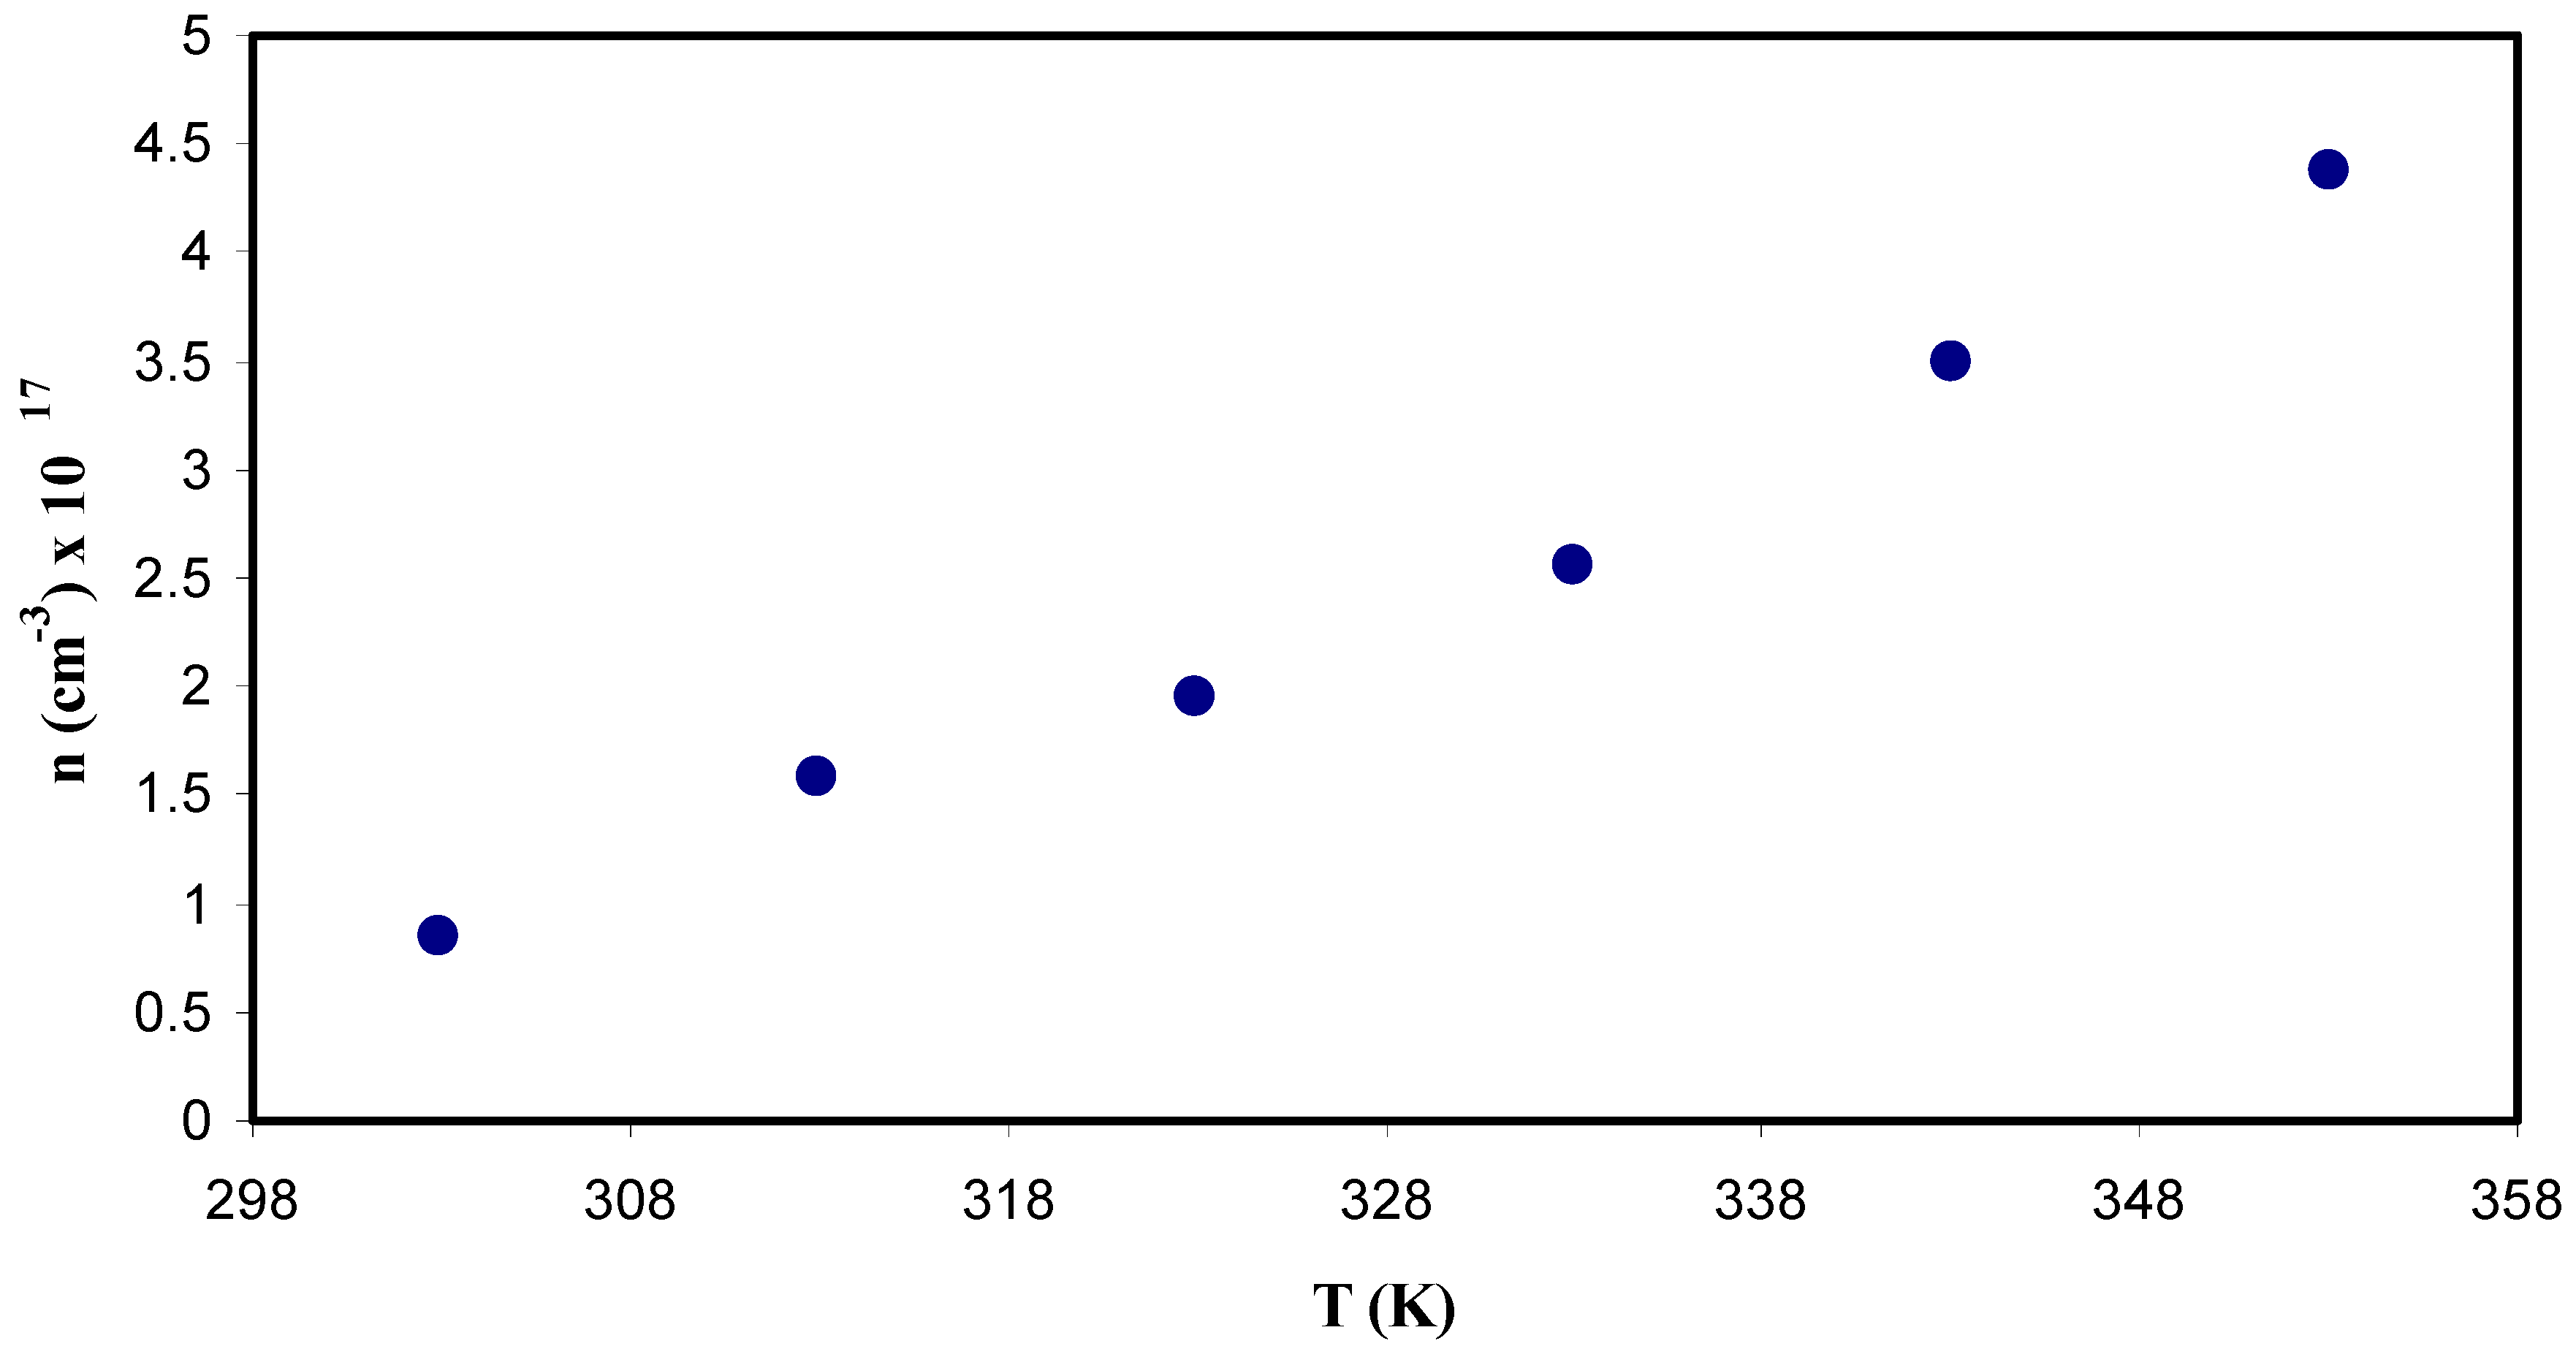
3.5.3. Carrier Density Study
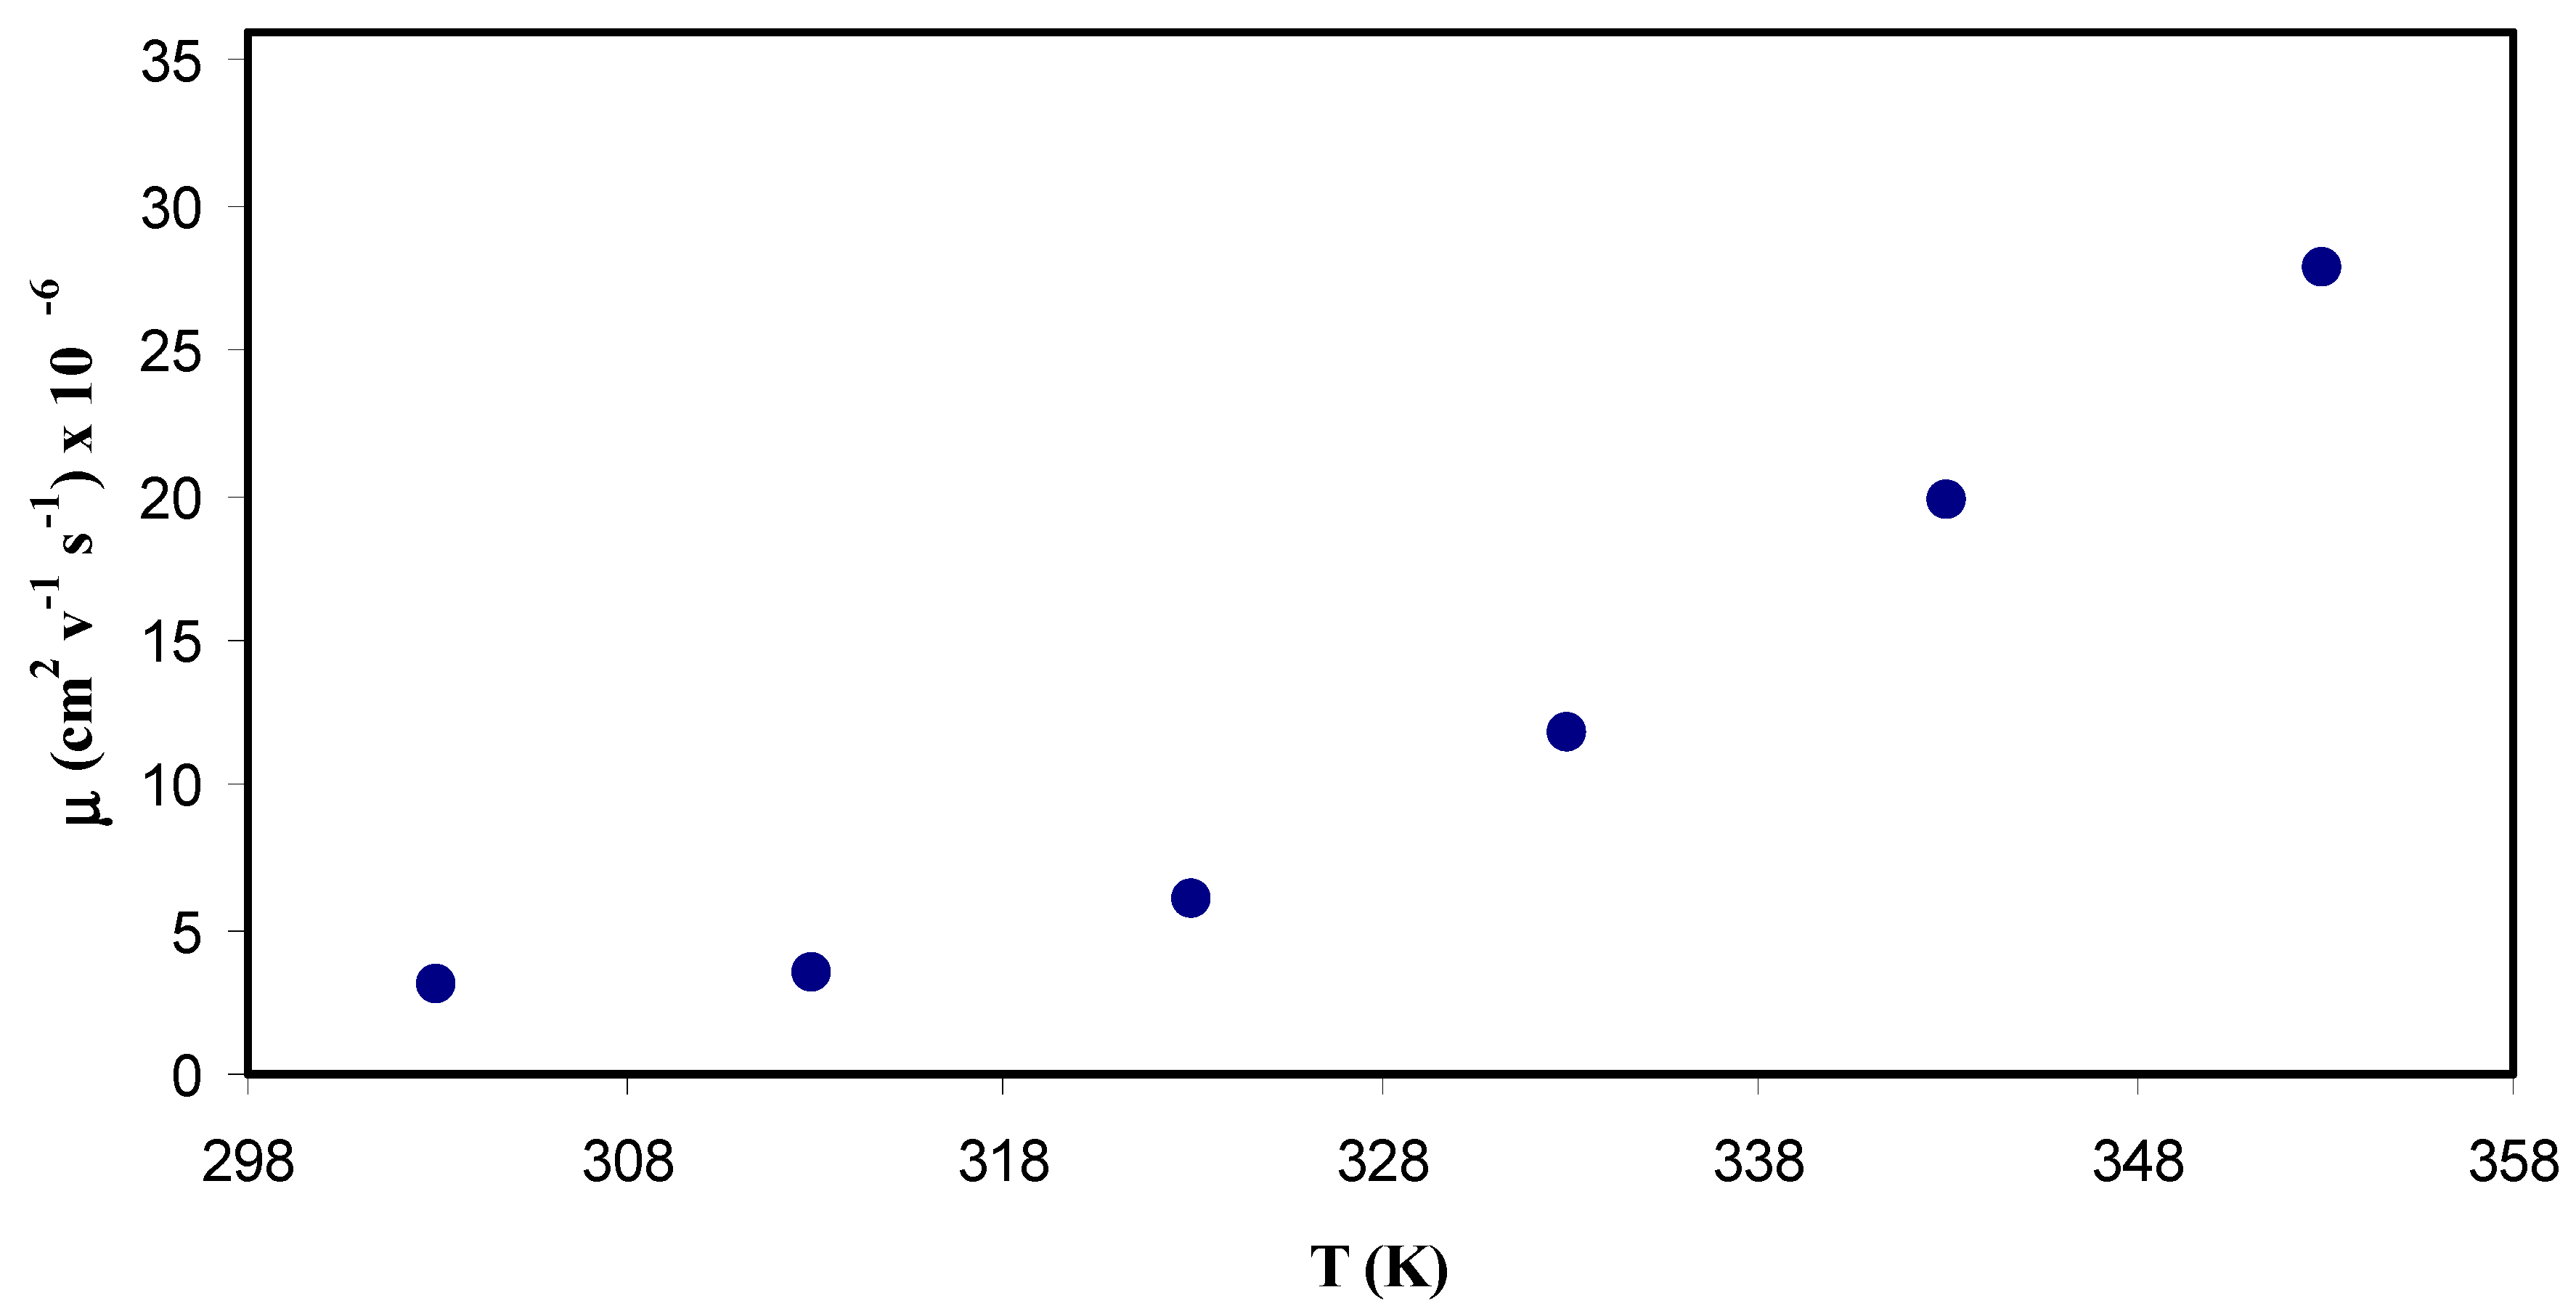
3.5.4. Ion Mobility Analysis
4. Conclusions
Author Contributions
Acknowledgments
Conflicts of Interest
References
- Turner, J.A. A Realizable Renewable Energy Future. Science 1999, 285, 687–689. [Google Scholar] [CrossRef] [Green Version]
- Fergus, J.W. Ceramic and polymeric solid electrolytes for lithium-ion batteries. J. Power Sources 2010, 195, 4554–4569. [Google Scholar] [CrossRef]
- Ngai, K.S.; Ramesh, S.; Ramesh, K.; Juan, J.C. A review of polymer electrolytes: Fundamental, approaches and applications. Ionics 2016, 22, 1259–1279. [Google Scholar] [CrossRef]
- Tambelli, C.; Bloise, A.; Rosario, A.; Pereira, E.; Magon, C.; Donoso, J.P.; Pereira, E. Characterisation of PEO–Al2O3 composite polymer electrolytes. Electrochim. Acta 2002, 47, 1677–1682. [Google Scholar] [CrossRef]
- Xue, Z.; Heb, D.; Xie, X. Poly(ethylene oxide)-based electrolytes for lithium-ion batteries. J. Mater. Chem. A 2015, 3, 19218–19253. [Google Scholar] [CrossRef]
- Hema, M.; Selvasekerapandian, S.; Sakunthala, A.; Arunkumar, D.; Nithya, H. Structural, vibrational and electrical characterization of PVA–NH4Br polymer electrolyte system. Phys. B Condens. Matter 2008, 403, 2740–2747. [Google Scholar] [CrossRef]
- Albu, A.; Maior, I.; Nicolae, C.A.; Bocăneală, F.L. Novel PVA proton conducting membranes doped with polyaniline generated by in-situ polymerization. Electrochim. Acta 2016, 211, 911–917. [Google Scholar] [CrossRef]
- Yang, C.-C.; Hsu, S.-T.; Chien, W.-C. All solid-state electric double-layer capacitors based on alkaline polyvinyl alcohol polymer electrolytes. J. Power Sources 2005, 152, 303–310. [Google Scholar] [CrossRef]
- Mohamad, A.A.; Mohamed, N.S.; Yahya, M.Z.A.; Othman, R.; Ramesh, S.; Alias, Y.; Arof, A.K. Ionic conductivity studies of poly(vinyl alcohol) alkaline solid polymer electrolyte and its use in nickel–zinc cells. Solid State Ionics 2003, 156, 171–177. [Google Scholar] [CrossRef]
- Polu, A.R.; Kumar, R. Preparation and characterization of pva based solid polymer electrolytes for electrochemical cell applications. Chin. J. Polym. Sci. 2013, 31, 641–648. [Google Scholar] [CrossRef]
- Zhong, C.; Deng, Y.; Hu, W.; Qiao, J.; Zhang, L.; Zhang, J. A review of electrolyte materials and compositions for electrochemical supercapacitors. Chem. Soc. Rev. 2015, 44, 7484–7539. [Google Scholar] [CrossRef]
- Horike, S.; Umeyama, D.; Kitagawa, S. Ion Conductivity and Transport by Porous Coordination Polymers and Metal–Organic Frameworks. Acc. Chem. Res. 2013, 4611, 2376–2384. [Google Scholar] [CrossRef]
- Marcinek, M.; Syzdek, J.; Marczewski, M.; Piszcz, M.; Niedzicki, L.; Kalita, M.; Plewa-Marczewska, A.; Bitner, A.; Wieczorek, P.; Trzeciak, T.; et al. Electrolytes for Li-ion transport—Review. Solid State Ionics 2015, 276, 107–126. [Google Scholar] [CrossRef]
- Siekierski, M.; Wieczorek, W.; Przyłuski, J. AC conductivity studies of composite polymeric electrolytes. Electrochim. Acta 1998, 43, 1339–1342. [Google Scholar] [CrossRef]
- Bandara, L.R.A.K.; Dissanayake, M.A.K.L.; Mellander, B.-E. Ionic conductivity of plasticized (PEO)-LiCF3SO3 electrolytes. Electrochim. Acta 1998, 43, 1447–1451. [Google Scholar] [CrossRef]
- Klein, R.J.; Zhang, S.; Dou, S.; Jones, B.H.; Colby, R.H.; Runt, J. Modeling electrode polarization in dielectric spectroscopy: Ion mobility and mobile ion concentration of single-ion polymer electrolytes. J. Chem. Phys. 2006, 124, 144903:1–144903:8. [Google Scholar] [CrossRef]
- Bhattacharja, S.; Smoot, S.W.; Whitmore, D.H. Cation and anion diffusion in the amorphous phase of the polymer electrolyte (PEO) 8LiCF3SO3. Solid State Ionics. 1986, 18–19, 306–314. [Google Scholar] [CrossRef]
- Every, H.A.; Zhou, F.; Forsyth, M.; MacFarlane, D.R. Lithium ion mobility in poly (vinyl alcohol) based polymer electrolytes as determined by 7Li NMR spectroscopy. Electrochim. Acta 1998, 43, 1465–1469. [Google Scholar] [CrossRef]
- Saroj, A.; Singh, R. Thermal, dielectric and conductivity studies on PVA/Ionic liquid [EMIM][EtSO4] based polymer electrolytes. J. Phys. Chem. Solids. 2012, 73, 162–168. [Google Scholar] [CrossRef]
- Hema, M.; Selvasekarapandian, S.; Hirankumar, G.; Sakunthala, A.; Arunkumar, D.; Nithya, H. Laser Raman and ac impedance spectroscopic studies of PVA: NH4NO3 polymer electrolyte. Spectrochim. Acta Part A Mol. Biomol. Spectrosc. 2010, 75, 474–478. [Google Scholar] [CrossRef]
- Johansson, A.; Wendsjö, Å.; Tegenfeldt, J. NMR spectroscopy of peo-based polymer electrolytes. Electrochim. Acta 1992, 37, 1487–1489. [Google Scholar] [CrossRef]
- Arof, A.K.; Amirudin, S.; Yusof, S.Z.; Noor, I.M. A method based on impedance spectroscopy to determine transport properties of polymer electrolytes. Phys. Chem. Chem. Phys. 2014, 16, 1856–1867. [Google Scholar] [CrossRef]
- Munar, A.; Andrio, A.; Iserte, R.; Compañ, V. Ionic conductivity and diffusion coefficients of lithium salt polymer electrolytes measured with dielectric spectroscopy. J. Non-Cryst. Solids 2011, 357, 3064–3069. [Google Scholar] [CrossRef]
- Aziz, S.B.; Abidin, Z.H.Z. Ion-transport study in nanocomposite solid polymer electrolytes based on chitosan: Electrical and dielectric analysis. J. Appl. Polym. Sci. 2015, 132, 41774. [Google Scholar] [CrossRef]
- Aziz, S.B.; Abidin, Z.H.Z. Electrical and morphological analysis of chitosan:AgTf solid electrolyte. Mater. Chem. Phys. 2014, 144, 280–286. [Google Scholar] [CrossRef]
- Aziz, S.B.; Mamand, S.M. The Study of Dielectric Properties and Conductivity Relaxation of Ion Conducting Chitosan: NaTf Based Solid Electrolyte. Int. J. Electrochem. Sci. 2018, 13, 10274–10288. [Google Scholar] [CrossRef]
- Aziz, S.B.; Brza, M.A.; Kadir, M.F.Z.; Hamsan, M.H.; Abidin, Z.H.Z.; Tahir, D.A.; Abdullah, O.G. Investigation on Degradation and Viscoelastic Relaxation of Li Ion in Chitosan Based Solid Electrolyte. Int. J. Electrochem. Sci. 2019, 14, 5521–5534. [Google Scholar] [CrossRef]
- Aziz, S.B. Li+ ion conduction mechanism in poly (ε-caprolactone)-based polymer electrolyte. Iran Polym.J. 2013, 22, 877. [Google Scholar] [CrossRef]
- Hatchett, D.W.; Josowicz, M. Composites of Intrinsically Conducting Polymers as Sensing Nanomaterials. Chem. Rev. 2008, 108, 746–769. [Google Scholar] [CrossRef]
- Cho, S.; Chen, C.-F.; Mukherjee, P.P. Influence of Microstructure on Impedance Response in Intercalation Electrodes. J. Electrochem. Soc. 2015, 162, A1202–A1214. [Google Scholar] [CrossRef]
- Svensson, A.M.; Valøen, L.O.; Tunold, R. Modeling of the impedance response of porous metal hydride electrodes. Electrochim. Acta 2005, 50, 2647–2653. [Google Scholar] [CrossRef]
- Kumar, M.; Tiwari, T.; Chauhan, J.K.; Srivastava, N. Understanding the ion dynamics and relaxation behavior from impedance spectroscopy of NaI doped Zwitterionic polymer system. Mater. Res. Express 2014, 1, 45003. [Google Scholar] [CrossRef]
- Aziz, S.; Abidin, Z.H.Z.; Arof, A.K. Influence of silver ion reduction on electrical modulus parameters of solid polymer electrolyte based on chitosan-silver triflate electrolyte membrane. Express Polym. Lett. 2010, 4, 300–310. [Google Scholar] [CrossRef]
- Fu, K.K.; Gong, Y.; Dai, J.; Gong, A.; Han, X.; Yao, Y.; Wang, C.; Wang, Y.; Chen, Y.; Yan, C.; et al. Flexible, solid-state, ion-conducting membrane with 3D garnet nanofiber networks for lithium batteries. Proc. Natl. Acad. Sci. USA 2016, 113, 7094–7099. [Google Scholar] [CrossRef] [Green Version]
- Malathi, J.; Kumaravadivel, M.; Brahmanandhan, G.M.; Hema, M.; Baskaran, R.; Selvasekarapandian, S. Structural, thermal and electrical properties of PVA–LiCF3SO3 polymer electrolyte. J. Non-Cryst. Solids 2010, 356, 2277–2281. [Google Scholar] [CrossRef]
- Aziz, S.B.; Brza, M.; Mohamed, P.A.; Kadir, M.; Hamsan, M.; Abdulwahid, R.T.; Woo, H. Increase of metallic silver nanoparticles in Chitosan:AgNt based polymer electrolytes incorporated with alumina filler. Results Phys. 2019, 13, 102326. [Google Scholar] [CrossRef]
- Pradhan, D.K.; Choudhary, P.; Samantaray, B.K.; Karan, N.K.; Katiyar, R.S. Effect of Plasticizer on Structural and Electrical Properties of Polymer Nanocompsoite Electrolytes. Int. J. Electrochem. Sci. 2007, 2, 861–871. [Google Scholar]
- Mohapatra, S.R.; Thakur, A.K.; Choudhary, R.N.P. Effect of nanoscopic confinement on improvement in ion conduction and stability properties of an intercalated polymer nanocomposite electrolyte for energy storage applications. J. Power Sources 2009, 191, 601–613. [Google Scholar] [CrossRef]
- Aziz, S.B.; Abdullah, R.M.; Kadir, M.; Ahmed, H.M. Non suitability of silver ion conducting polymer electrolytes based on chitosan mediated by barium titanate (BaTiO3) for electrochemical device applications. Electrochim. Acta 2019, 296, 494–507. [Google Scholar] [CrossRef]
- Shukur, M.; Ithnin, R.; Kadir, M. Electrical characterization of corn starch-LiOAc electrolytes and application in electrochemical double layer capacitor. Electrochim. Acta 2014, 136, 204–216. [Google Scholar] [CrossRef]
- Teo, L.P.; Buraidah, M.H.; Nor, A.F.M.; Majid, S.R. Conductivity and dielectric studies of Li2SnO3. Ionics 2012, 18, 655–665. [Google Scholar] [CrossRef]
- Eftekhari, A. The mechanism of ultrafast supercapacitors. J. Mater. Chem. A 2018, 6, 2866–2876. [Google Scholar] [CrossRef]
- Aziz, S.B.; Faraj, M.G.; Abdullah, O.G. Impedance Spectroscopy as a Novel Approach to Probe the Phase Transition and Microstructures Existing in CS:PEO Based Blend Electrolytes. Sci. Rep. 2018, 8, 14308. [Google Scholar] [CrossRef] [PubMed]
- Cebeci, F.Ç.; Geyik, H.; Sezer, E.; Sarac, A.S. Synthesis, electrochemical characterization and impedance studies on novel thiophene-nonylbithiazole-thiophenecomonomer. J. Electroanal. Chem. 2007, 610, 113–121. [Google Scholar] [CrossRef]
- Vergaz, R.; Barrios, D.; Sánchez-Pena, J.-M.; Pozo-Gonzalo, C.; Salsamendi, M. Relating cyclic voltammetry and impedance analysis in a viologenelectrochromic device. Sol. Energy Mater. Sol. Cells 2009, 93, 2125–2132. [Google Scholar] [CrossRef]
- Aziz, S.B.; Hamsan, M.H.; Abdullah, R.M.; Kadir, M.F.Z. A Promising Polymer Blend Electrolytes Based on Chitosan: Methyl Cellulose for EDLC Application with High Specific Capacitance and Energy Density. Molecules 2019, 24, 2503. [Google Scholar] [CrossRef] [PubMed]
- Vijil Vani, C.; Thanikaikarasan, S.; Mahalingam, T.; Sebastian, P.J.; Verea, L.E.; Shajan, X.S. Effect of X-ray Irradiation on Dielectric Properties of Polymer Electrolytes Complexed with LiCF3SO3. J. New Mater. Electrochem. Syst. 2014, 17, 139–145. [Google Scholar] [CrossRef]
- Pradhan, D.K.; Choudhary, R.N.P.; Samantaray, B.K. Studies of Dielectric Relaxation and AC Conductivity Behavior of Plasticized Polymer Nanocomposite Electrolytes. Int. J. Electrochem. Sci. 2008, 3, 597–608. [Google Scholar]
- Woo, H.J.; Majid, S.R.; Arof, A.K. Dielectric properties and morphology of polymer electrolyte based on poly(ε-caprolactone) and ammonium thiocyanate. Mater. Chem. Phys. 2012, 134, 755–761. [Google Scholar] [CrossRef]
- Ravi, M.; Pavani, Y.; Kumar, K.K.; Bhavani, S.; Sharma, A.; Rao, V.N. Studies on electrical and dielectric properties of PVP:KBrO4 complexed polymer electrolyte films. Mater. Chem. Phys. 2011, 130, 442–448. [Google Scholar] [CrossRef]
- Polu, A.R.; Kumar, R. AC impedance and dielectric spectroscopic studies of Mg2+ ion-conducting PVA–PEG blended polymer electrolytes. Bull. Mater. Sci. 2011, 34, 1063–1067. [Google Scholar] [CrossRef]
- Das-Gupta, D. Molecular processes in polymer electrets. J. Electrost. 2001, 51, 159–166. [Google Scholar] [CrossRef]
- Kumar, M.S.; Bhat, D.K. Polyvinyl alcohol–polystyrene sulphonic acid blend electrolyte for supercapacitor application. Phys. B 2009, 404, 1143–1147. [Google Scholar] [CrossRef]
- Pradhan, D.K.; Choudhary, R.N.P.; Samantaray, B.K. Studies of dielectric and electrical properties of plasticized polymer nanocompositeelectrolytes. Mater. Chem. Phys. 2009, 115, 557–561. [Google Scholar] [CrossRef]
- Tian, F.; Ohki, Y. Electric modulus powerful tool for analyzing dielectric behavior. IEEE Trans. Dielectr. Electr. Insul. 2014, 21, 929–931. [Google Scholar] [CrossRef]
- Aziz, S.B.; Woo, T.J.; Kadir, M.F.; Ahmed, H.M.; Ahmed, H.M. A conceptual review on polymer electrolytes and ion transport models. J. Sci. Adv. Mater. Devices 2018, 3, 1–17. [Google Scholar] [CrossRef]
- Aziz, S.B. Occurrence of electrical percolation threshold and observation of phase transition in chitosan(1 − x):AgIx (0.05 ≤ x ≤ 0.2)-based ion-conducting solid polymer composites. Appl. Phys. A 2016, 122, 706. [Google Scholar] [CrossRef]
- Aziz, S.B. Role of Dielectric Constant on Ion Transport: Reformulated Arrhenius Equation. Adv. Mater. Sci. Eng. 2016, 2016, 2527013. [Google Scholar] [CrossRef]
- Aziz, S.B. The Mixed Contribution of Ionic and Electronic Carriers to Conductivity in Chitosan Based Solid Electrolytes Mediated by CuNt Salt. J. Inorg. Organomet. Polym. Mater. 2018, 28, 1942–1952. [Google Scholar] [CrossRef]
- Aziz, S.B.; Abdullah, R.M. Crystalline and amorphous phase identification from the tanδ relaxation peaks and impedance plots in polymer blend electrolytes based on [CS:AgNt]x:PEO(x−1) (10 ≤ x ≤ 50). Electrochim. Acta 2018, 285, 30–46. [Google Scholar] [CrossRef]
- Agrawal, S.L.; Singh, M.; Tripathi, M.; Dwivedi, M.M.; Pandey, K. Dielectric relaxation studies on [PEO–SiO2]:NH4SCN nanocomposite polymer electrolyte films. J. Mater. Sci. 2009, 44, 6060–6068. [Google Scholar] [CrossRef]
- Karmakar, A.; Ghosh, A. Dielectric permittivity and electric modulus of polyethylene oxide (PEO)–LiClO4 composite electrolytes. Curr. Appl. Phys. 2012, 12, 539–543. [Google Scholar] [CrossRef]
- Sengwa, R.J.; Choudhary, S.; Sankhla, S. Low frequency dielectric relaxation processes and ionic conductivity of montmorillonite clay nanoparticles colloidal suspension in poly(vinyl pyrrolidone)−ethylene glycol blends. Express Polym. Lett. 2008, 2, 800–809. [Google Scholar] [CrossRef]
- Castillo, J.; Chacon, M.; Castillo, R.; Vargas, R.A.; Bueno, P.R.; Varela, J.A. Dielectricrelaxation and dcconductivityonthe PVOH-CF3COONH4 polymersystem. Ionics 2009, 15, 537–544. [Google Scholar] [CrossRef]
- Bello, A.; Laredo, E.; Grimau, M. Comparison of analysis of dielectric spectra of PCL in the ε∗ and the M∗ formalism. J. Non-Cryst. Solids 2007, 353, 4283–4287. [Google Scholar] [CrossRef]
- Reddy, C.V.S.; Han, X.; Zhu, Q.-Y.; Mai, L.-Q.; Chen, W. Dielectric spectroscopy studies on (PVP + PVA) polyblend film. Microelectron. Eng. 2006, 83, 281–285. [Google Scholar] [CrossRef]
- Yamamoto, T.; Inami, M.; Kanbara, T. Preparation and properties of polymer solid electrolytes using poly(vinyl alcohol) and thermally resistive poly[arylene(1,3-imidazolidine-2,4,5-trione-1,3-diyl)] as matrix polymers. Chem. Mater. 1994, 61, 44–50. [Google Scholar] [CrossRef]
- Takaki, K.; Minoru, I.; Takakazu, Y.; Atsushi, N.; Tooru, T.; Masayoshi, W.; Naoya, O. New Lithium Salt Ionic Conductor Using Poly(vinyl alcohol) Matrix. Chem. Lett. 1989, 18, 1913–1916. [Google Scholar]
- Sheha, E.; Khoder, H.; Shanap, T.S.; El-Shaarawy, M.G.; El Mansy, M.K. Structure, dielectric and optical properties of p-type (PVA/CuI) nanocomposite polymer electrolyte for photovoltaic cells. Optik 2012, 123, 1161–1166. [Google Scholar] [CrossRef]
- Choi, U.H.; Liang, S.; Chen, Q.; Runt, J.; Colby, R.H. Segmental Dynamics and Dielectric Constant of Polysiloxane Polar Copolymers as Plasticizers for Polymer Electrolytes. ACS Appl. Mater. Interfaces 2016, 8, 3215–3225. [Google Scholar] [CrossRef]
- Aziz, S.B. Study of electrical percolation phenomenon from the dielectric and electric modulus analysis. Bull. Mater. Sci. 2015, 38, 1597–1602. [Google Scholar] [CrossRef]
- Aziz, S.B.; Abdullah, R.M.; Rasheed, M.A.; Ahmed, H.M. Role of Ion Dissociation on DC Conductivity and Silver Nanoparticle Formation in PVA:AgNt Based Polymer Electrolytes: Deep Insights to Ion Transport Mechanism. Polymers 2017, 9, 338. [Google Scholar] [CrossRef]
- Mohan, V.M.; Qiu, W.; Shen, J.; Chen, W. Electrical properties of poly(vinyl alcohol) (PVA) based on LiFePO4 complex polymer electrolyte films. J. Polym. Res. 2010, 17, 143. [Google Scholar] [CrossRef]
- Fan, L.; Dang, Z.; Wei, G.; Nan, C.W.; Li, M. Effect of nanosizedZnO on the electrical properties of (PEO)16LiClO4 electrolytes. Mater. Sci. Eng. B 2003, 99, 340–343. [Google Scholar] [CrossRef]
- Jayathilaka, P.A.R.D.; Dissanayake, M.A.K.L.; Albinsson, I.; Mellander, B.E. Dielectric relaxation, ionic conductivity and thermal studies of the gel polymer electrolyte system PAN/EC/PC/LiTFSI. Solid State Ionics 2003, 156, 179–195. [Google Scholar] [CrossRef]
- Khatri, P.; Behera, B.; Srinivas, V.; Choudhary, R.N.P. Structural and dielectric properties of Ba3V2O8 ceramics. Curr. Appl. Phys. 2009, 9, 515–519. [Google Scholar] [CrossRef]
- Louati, B.; Hlel, F.; Guidara, K. Ac electrical properties and dielectric relaxation of the new mixed crystal (Na0.8Ag0.2)2PbP2O7. J. Alloy. Compd. 2009, 486, 299–303. [Google Scholar] [CrossRef]
- Idris, N.H.; Senin, H.B.; Arof, A.K. Dielectric spectra of LiTFSI-doped chitosan/PEO blends. Ionics 2007, 13, 213–217. [Google Scholar] [CrossRef]
- Fan, F. Ion Transport in Polymer Electrolytes. Ph.D. Thesis, University of Tennessee, Knoxville, TN, USA, 2015. [Google Scholar]
- Tiong, T.S.; Buraidah, M.H.; Teo, L.P.; Arof, A.K. Conductivity studies of poly(ethylene oxide)(PEO)/poly(vinyl alcohol) (PVA) blend gel polymer electrolytes for dye-sensitized solar cells. Ionics 2016, 22, 2133–2142. [Google Scholar] [CrossRef]
- Eschen, T.; Kösters, J.; Schönhoff, M.; Stolwijk, N.A. Ionic Transport in Polymer Electrolytes Based on PEO and the PMImI Ionic Liquid: Effects of Salt Concentration and Iodine Addition. J. Phys. Chem. B 2012, 116, 8290–8298. [Google Scholar] [CrossRef]
- Aziz, S.B.; Abidin, Z.; Arof, A. Effect of silver nanoparticles on the DC conductivity in chitosan–silver triflate polymer electrolyte. Phys. B Condens. Matter 2010, 405, 4429–4433. [Google Scholar] [CrossRef]
- Arya, A.; Sharma, A.L. Optimization of salt concentration and explanation of two peakpercolation in blend solid polymer nanocomposite films. J. Solid State Electrochem. 2018, 22, 2725. [Google Scholar] [CrossRef]
- Sun, B.; Mindemark, J.; Morozov, E.V.; Costa, L.T.; Bergman, M.; Johansson, P.; Fang, Y.; Furó, I.; Brandell, D. Ion transport in polycarbonate based solid polymer electrolytes: Experimental and computational investigations. Phys. Chem. Chem. Phys. 2016, 18, 9504–9513. [Google Scholar] [CrossRef]
- Rice, M.J.; Roth, W.L. Ionic transport in super ionic conductors: A theoretical model. J. Solid State Chem. 1972, 4, 294–310. [Google Scholar] [CrossRef]
- Maurya, K.K.; Hashmi, S.A.; Chandra, S. Evidence of ion association in polymer electrolyte by direct mobility measurement. In Solid State Ionics: Materials and Applications; Chowdari, B.V.R., Chandra, S., Singh, S., Srivastava, P.C., Eds.; World Scientific: Singapore, 1992; pp. 573–577. [Google Scholar]
- Majid, S.; Arof, A. Proton-conducting polymer electrolyte films based on chitosan acetate complexed with NH4NO3 salt. Phys. B Condens. Matter 2005, 355, 78–82. [Google Scholar] [CrossRef]
- Chandra, A.; Agrawal, R.C.; Mahipal, Y.K. Ion transport property studies on PEO–PVP blended solid polymer electrolyte membranes. J. Phys. D Appl. Phys. 2009, 42, 135107. [Google Scholar] [CrossRef]
- Winie, T.; Ramesh, S.; Arof, A. Studies on the structure and transport properties of hexanoyl chitosan-based polymer electrolytes. Phys. B Condens. Matter 2009, 404, 4308–4311. [Google Scholar] [CrossRef]
- Agrawal, R.C.; Chandra, A.; Bhatt, A.; Mahipal, Y.K. Investigations on ion transport properties of and battery discharge characteristic studies on hot-pressed Ag+-ion-conducting nano-composite polymer electrolytes: (1 − x) [90PEO:10AgNO3]:xSiO2. New J. Phys. 2008, 10, 043023. [Google Scholar] [CrossRef]
- Patla, S.K.; Ray, R.; Karmakar, S.; Das, S.; Tarafdar, S. Nanofiller-Induced Ionic Conductivity Enhancement and Relaxation Property Analysis of the Blend Polymer Electrolyte Using Non-Debye Electric Field Relaxation Function. J. Phys. Chem. C 2019, 123, 5188–5197. [Google Scholar] [CrossRef]


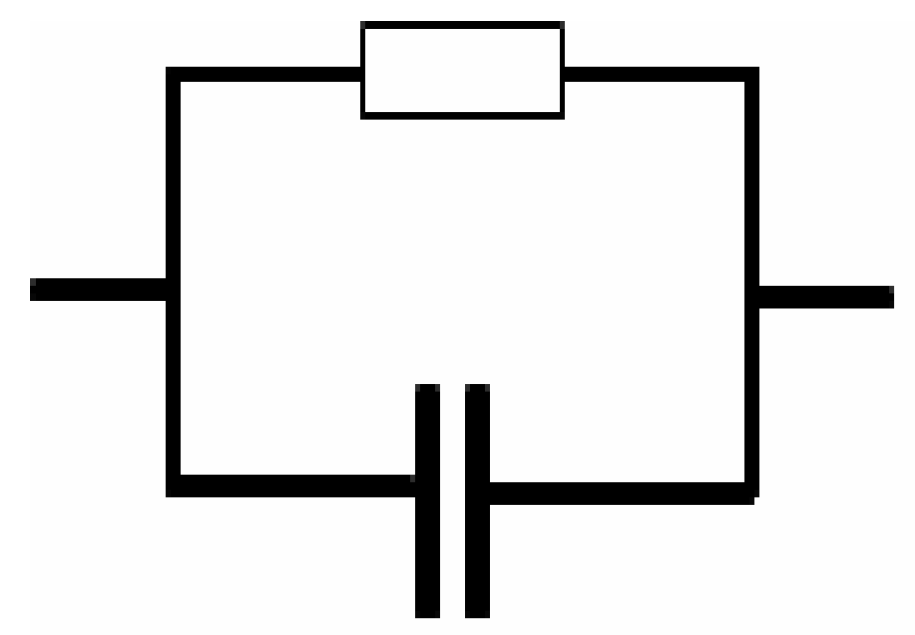
 and capacitor represented by
  .
and capacitor represented by .
.
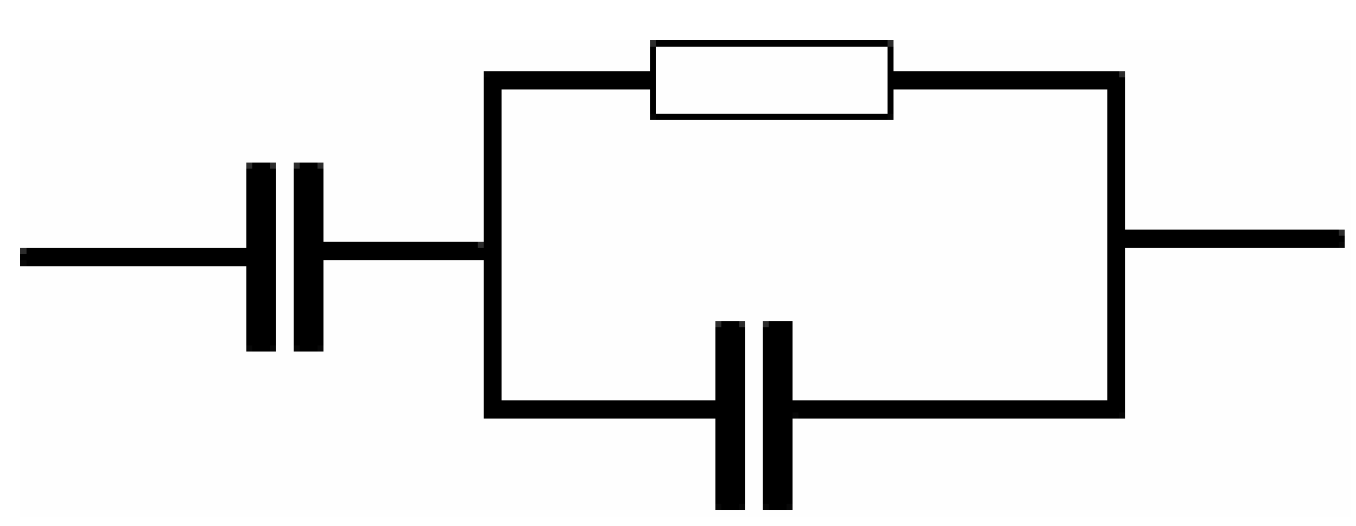
and capacitor represented by . and capacitor represented by .
and capacitor represented by .
and capacitor represented by .


| Temperature (K) | p1 (rad) | p2 (rad) | k1 (F−1) | k2 (F−1) | C1 (F) | C2 (F) |
|---|---|---|---|---|---|---|
| 303 | 0.84 | - | 5.60 × 10⁸ | - | 1.79 × 10⁻⁹ | - |
| 323 | 0.83 | - | 5.50 × 10⁸ | - | 1.82 × 10⁻⁹ | - |
| 343 | 0.75 | 0.85 | 8.00 × 10⁷ | 6.50 × 10⁵ | 1.25 × 10⁻⁸ | 1.56 × 10⁻⁶ |
| 353 | 0.74 | 0.80 | 5.50 × 10⁻⁷ | 2.50 × 10⁵ | 1.82 × 10⁻⁸ | 4.00 × 10⁻⁶ |
© 2019 by the authors. Licensee MDPI, Basel, Switzerland. This article is an open access article distributed under the terms and conditions of the Creative Commons Attribution (CC BY) license (http://creativecommons.org/licenses/by/4.0/).
Share and Cite
Aziz, S.B.; B. Marif, R.; Brza, M.A.; Hamsan, M.H.; Kadir, M.F.Z. Employing of Trukhan Model to Estimate Ion Transport Parameters in PVA Based Solid Polymer Electrolyte. Polymers 2019, 11, 1694. https://doi.org/10.3390/polym11101694
Aziz SB, B. Marif R, Brza MA, Hamsan MH, Kadir MFZ. Employing of Trukhan Model to Estimate Ion Transport Parameters in PVA Based Solid Polymer Electrolyte. Polymers. 2019; 11(10):1694. https://doi.org/10.3390/polym11101694
Chicago/Turabian StyleAziz, Shujahadeen B., Rawezh B. Marif, M. A. Brza, M. H. Hamsan, and M. F. Z. Kadir. 2019. "Employing of Trukhan Model to Estimate Ion Transport Parameters in PVA Based Solid Polymer Electrolyte" Polymers 11, no. 10: 1694. https://doi.org/10.3390/polym11101694