Nucleation and Crystallization of PA6 Composites Prepared by T-RTM: Effects of Carbon and Glass Fiber Loading

 , and
, and
Abstract
:
1. Introduction
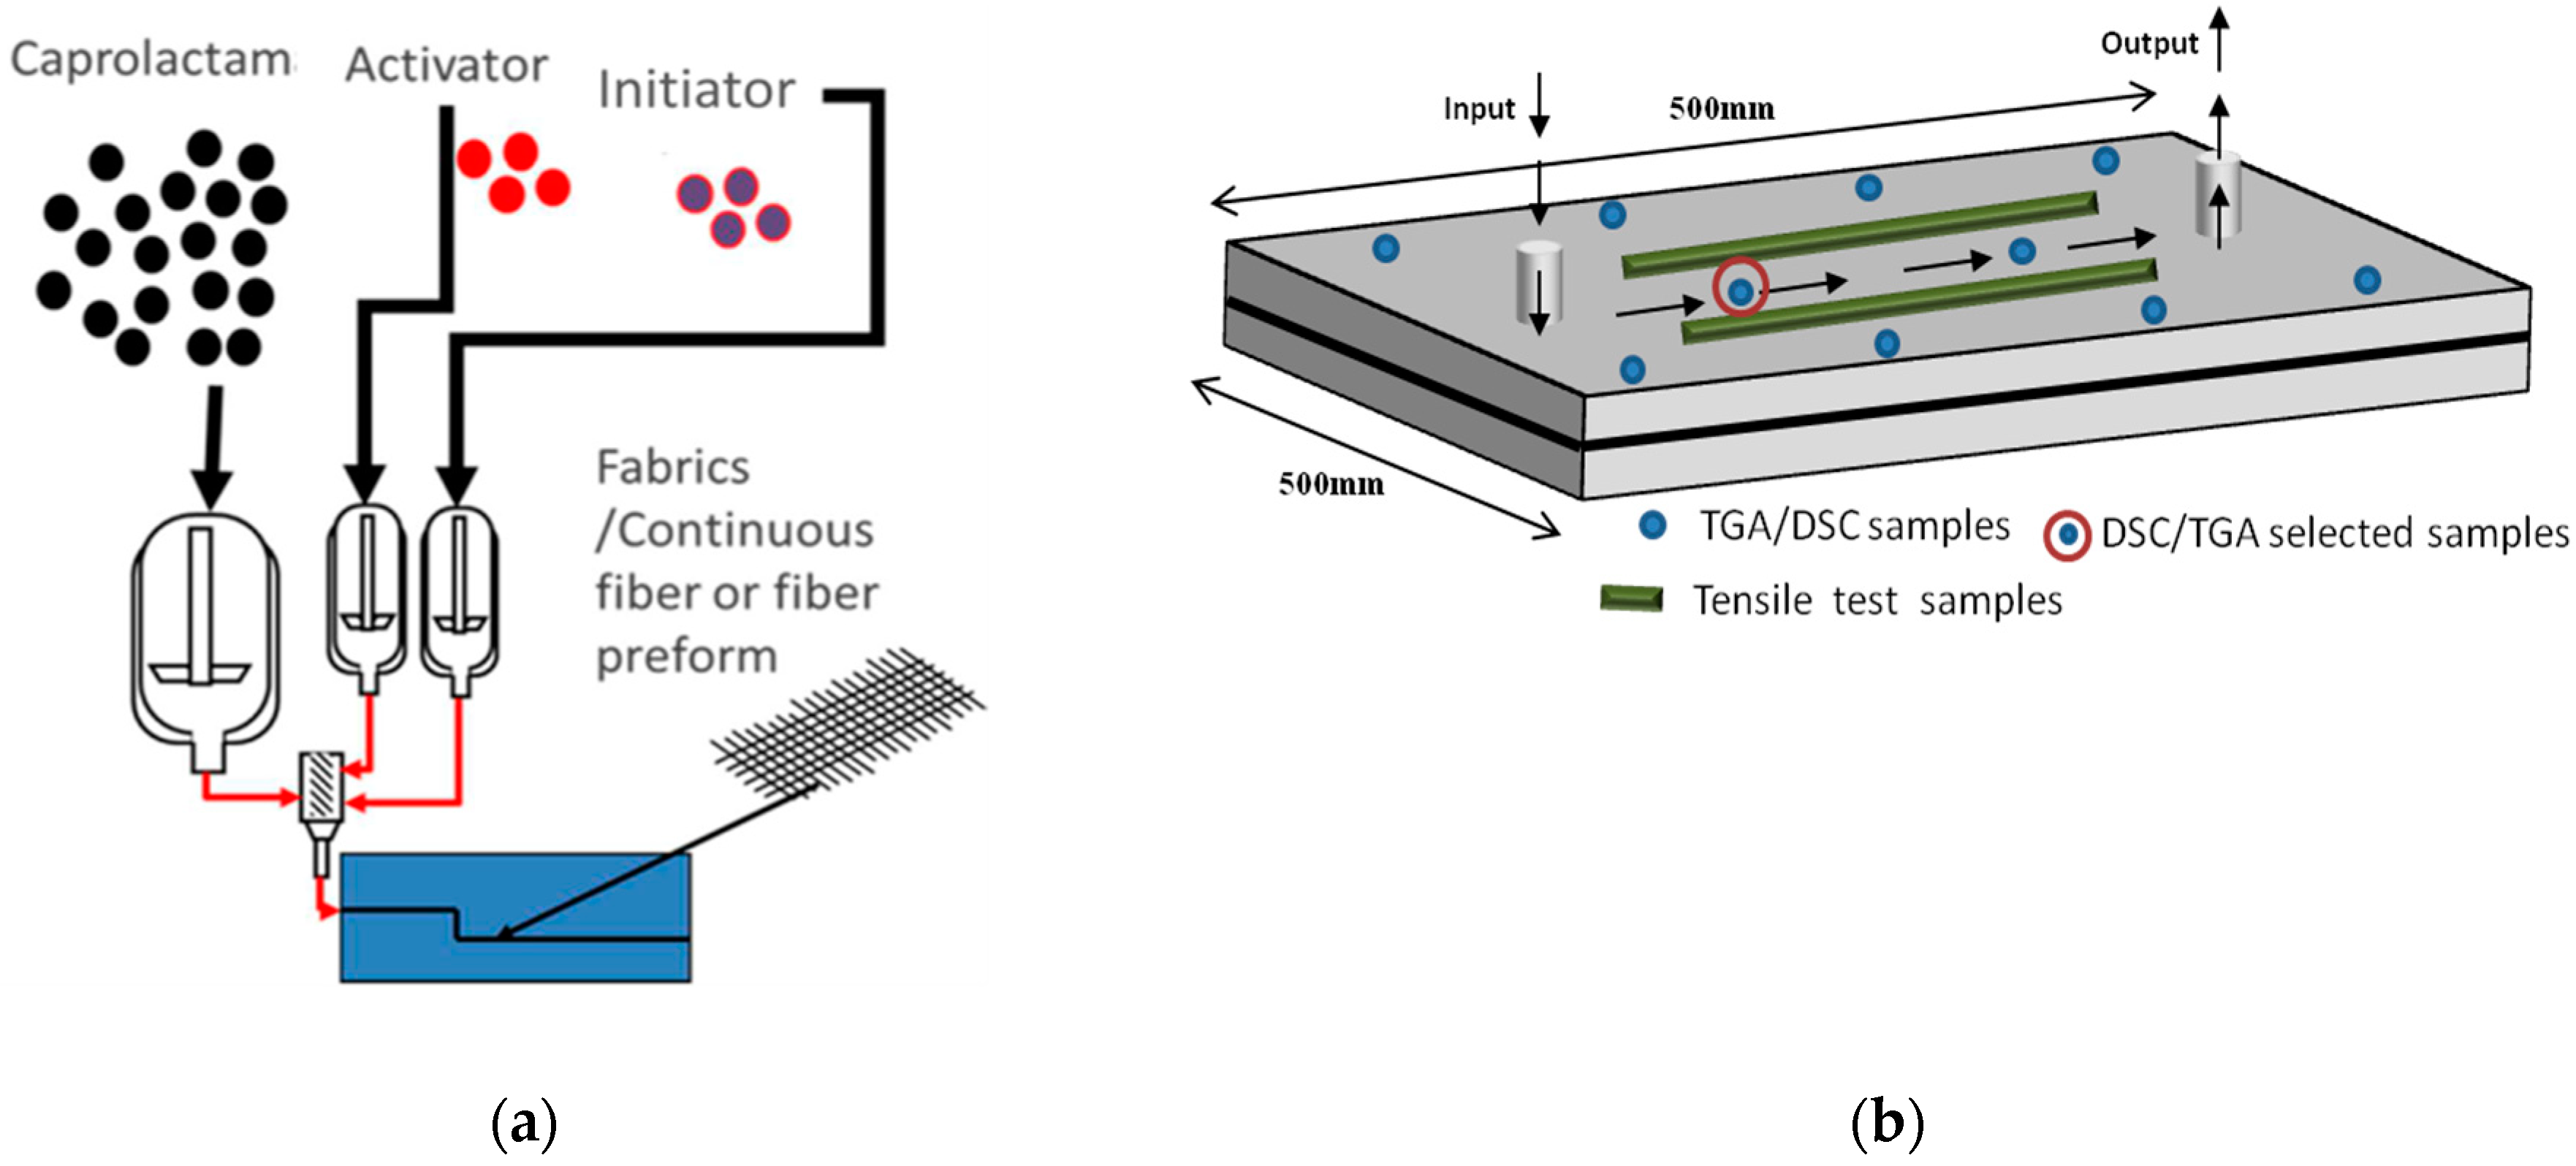
2. Materials and Methods
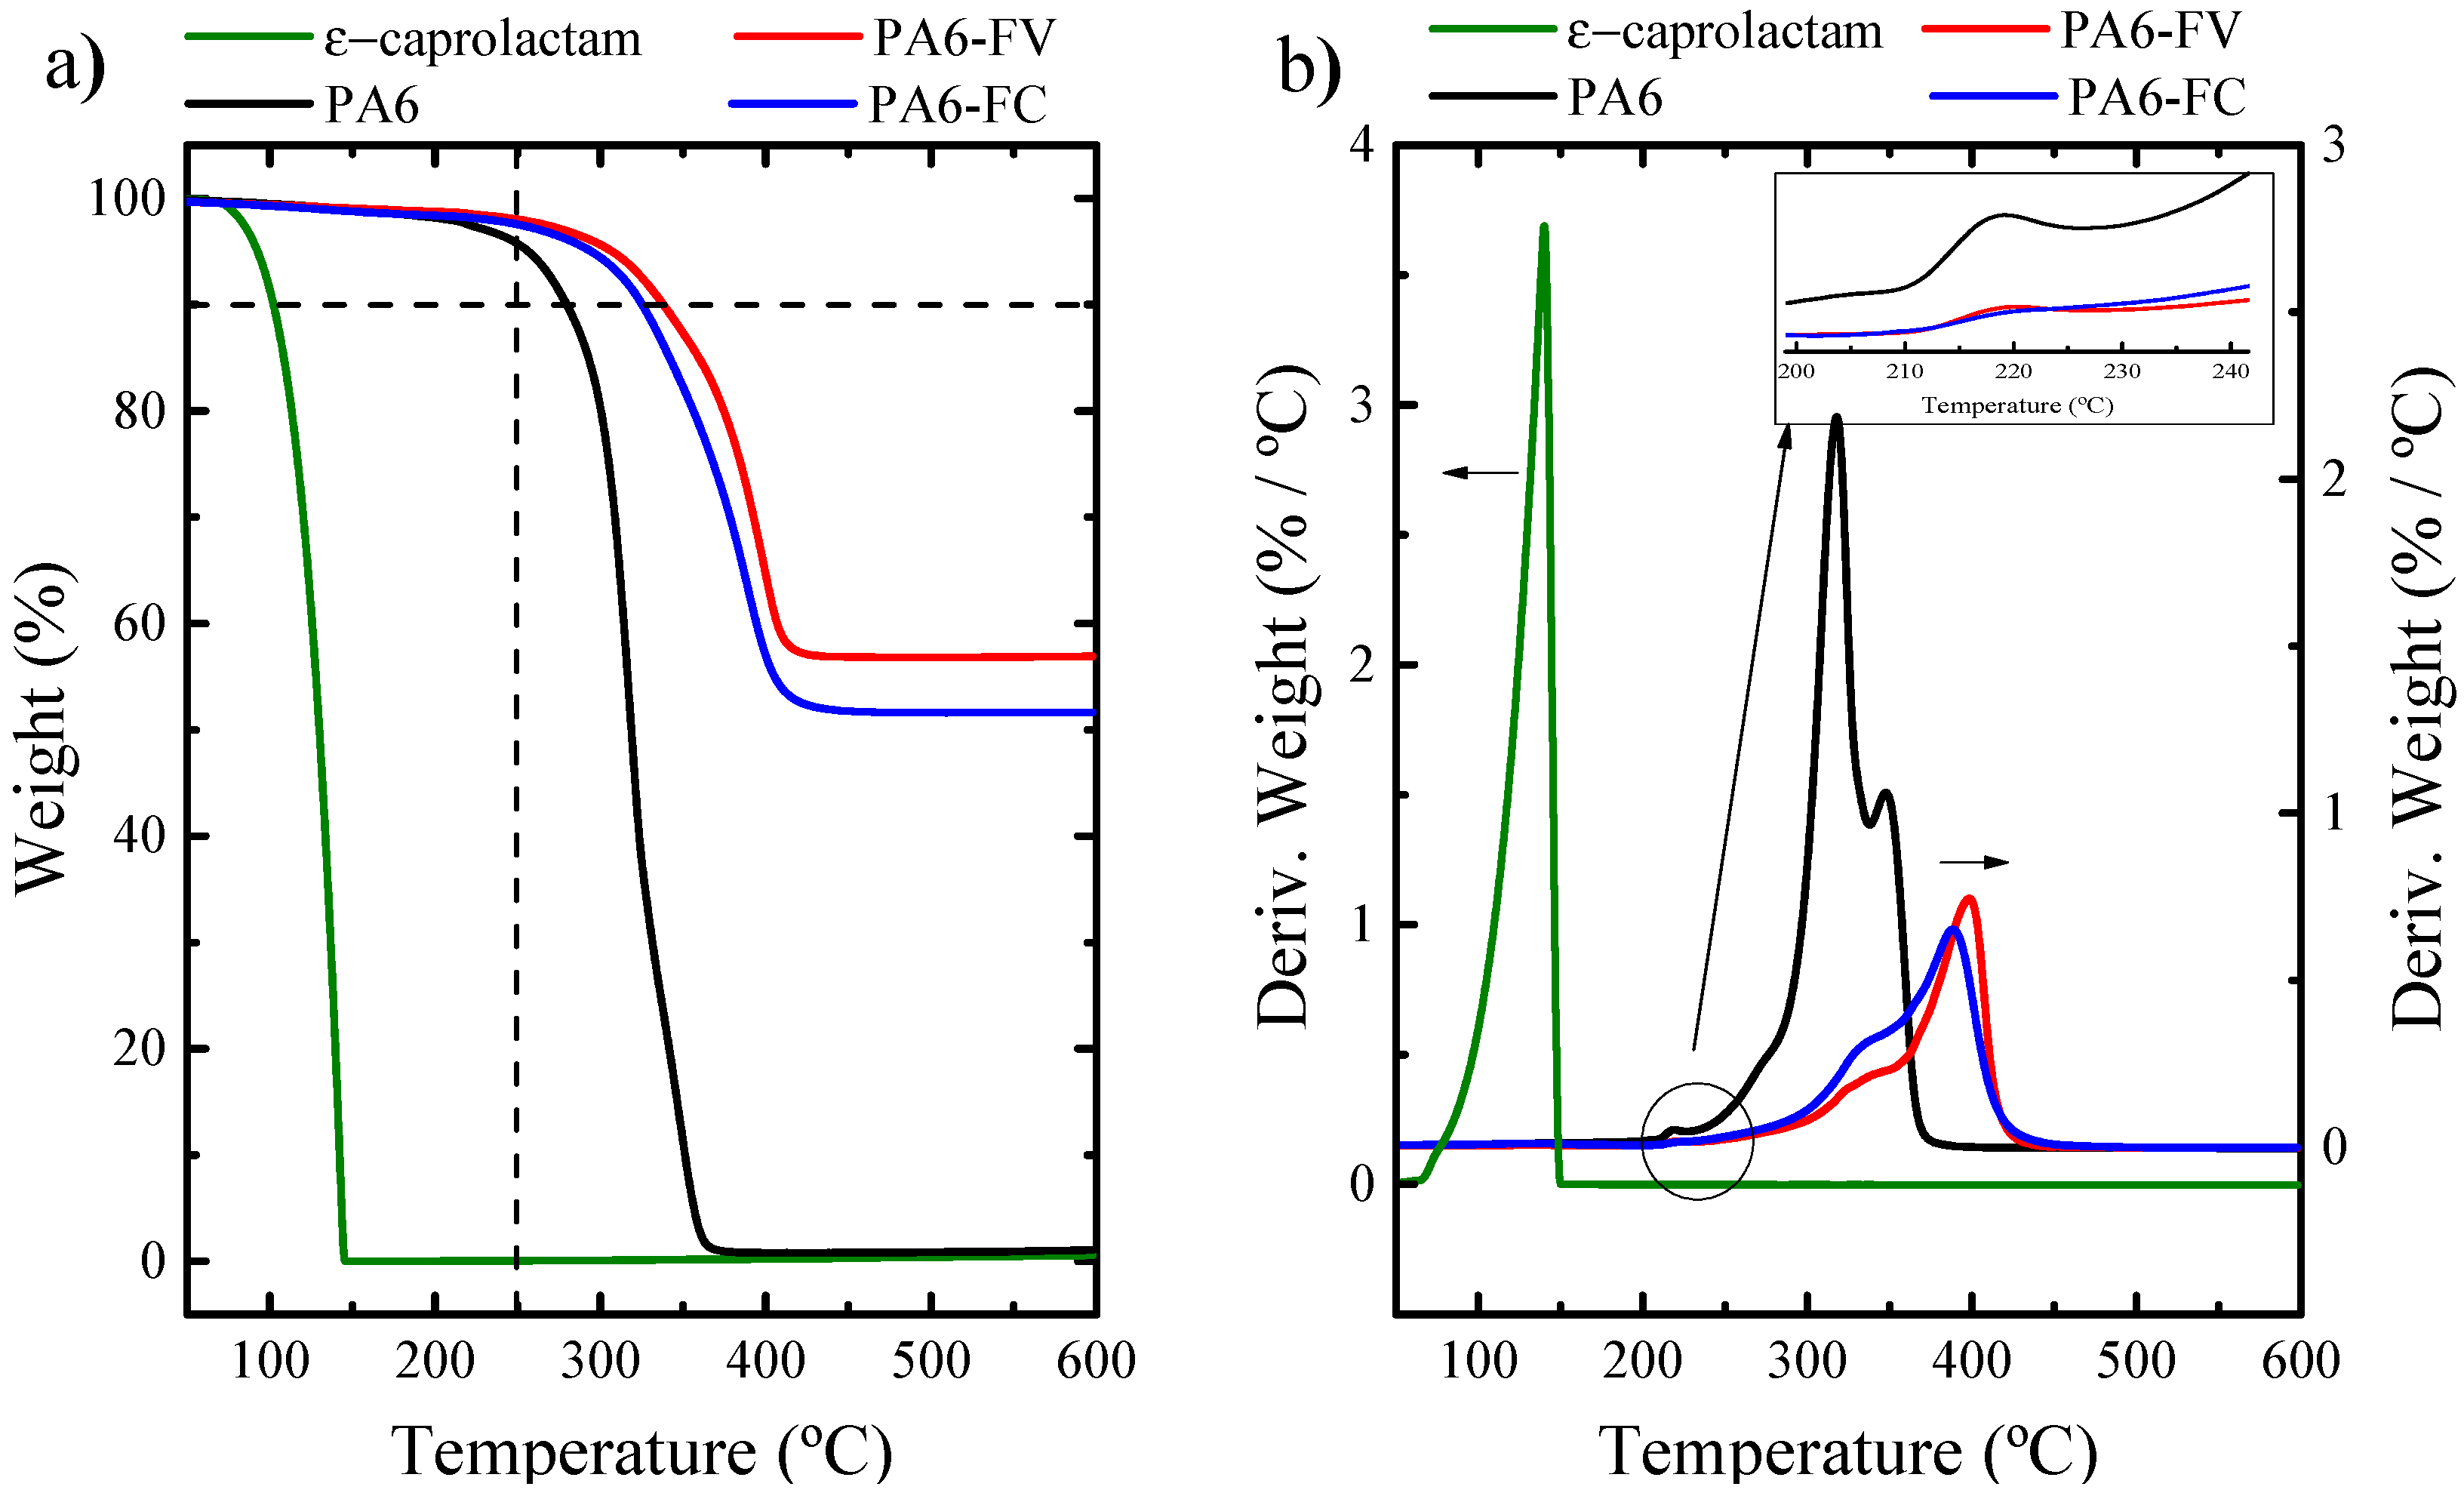
TGA—Monomer Conversion
Dilute Solution Viscosimetry
DSC—Crystallinity Characterization
SAXS/WAXS—Crystalline Structure
AFM—Morphological Observations
Tensile Properties
TGA and DSC Results: Estimation of Errors
3. Results and Discussion
Degree of Conversion and Molecular Weight
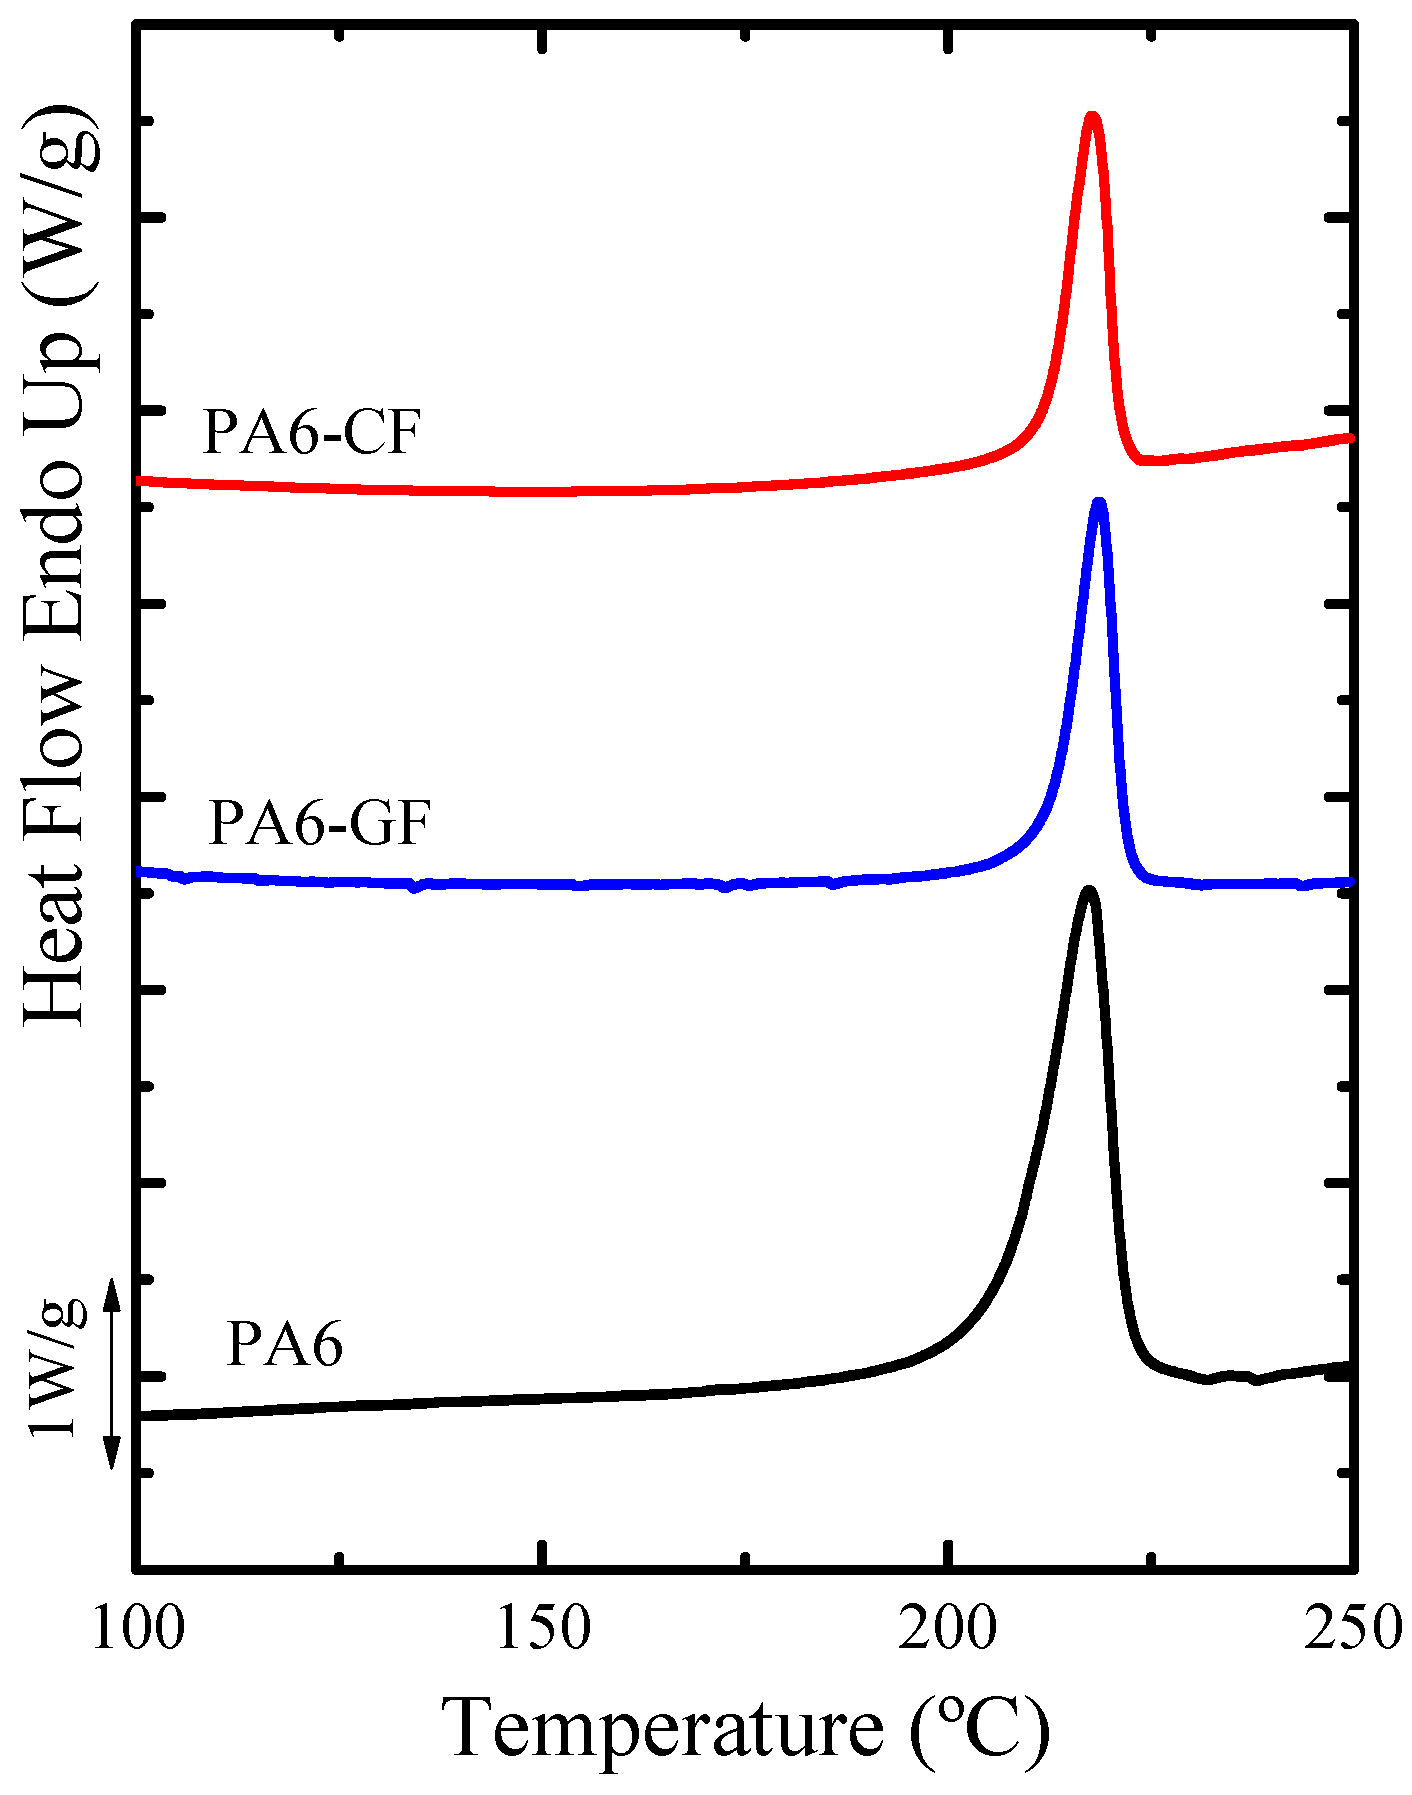
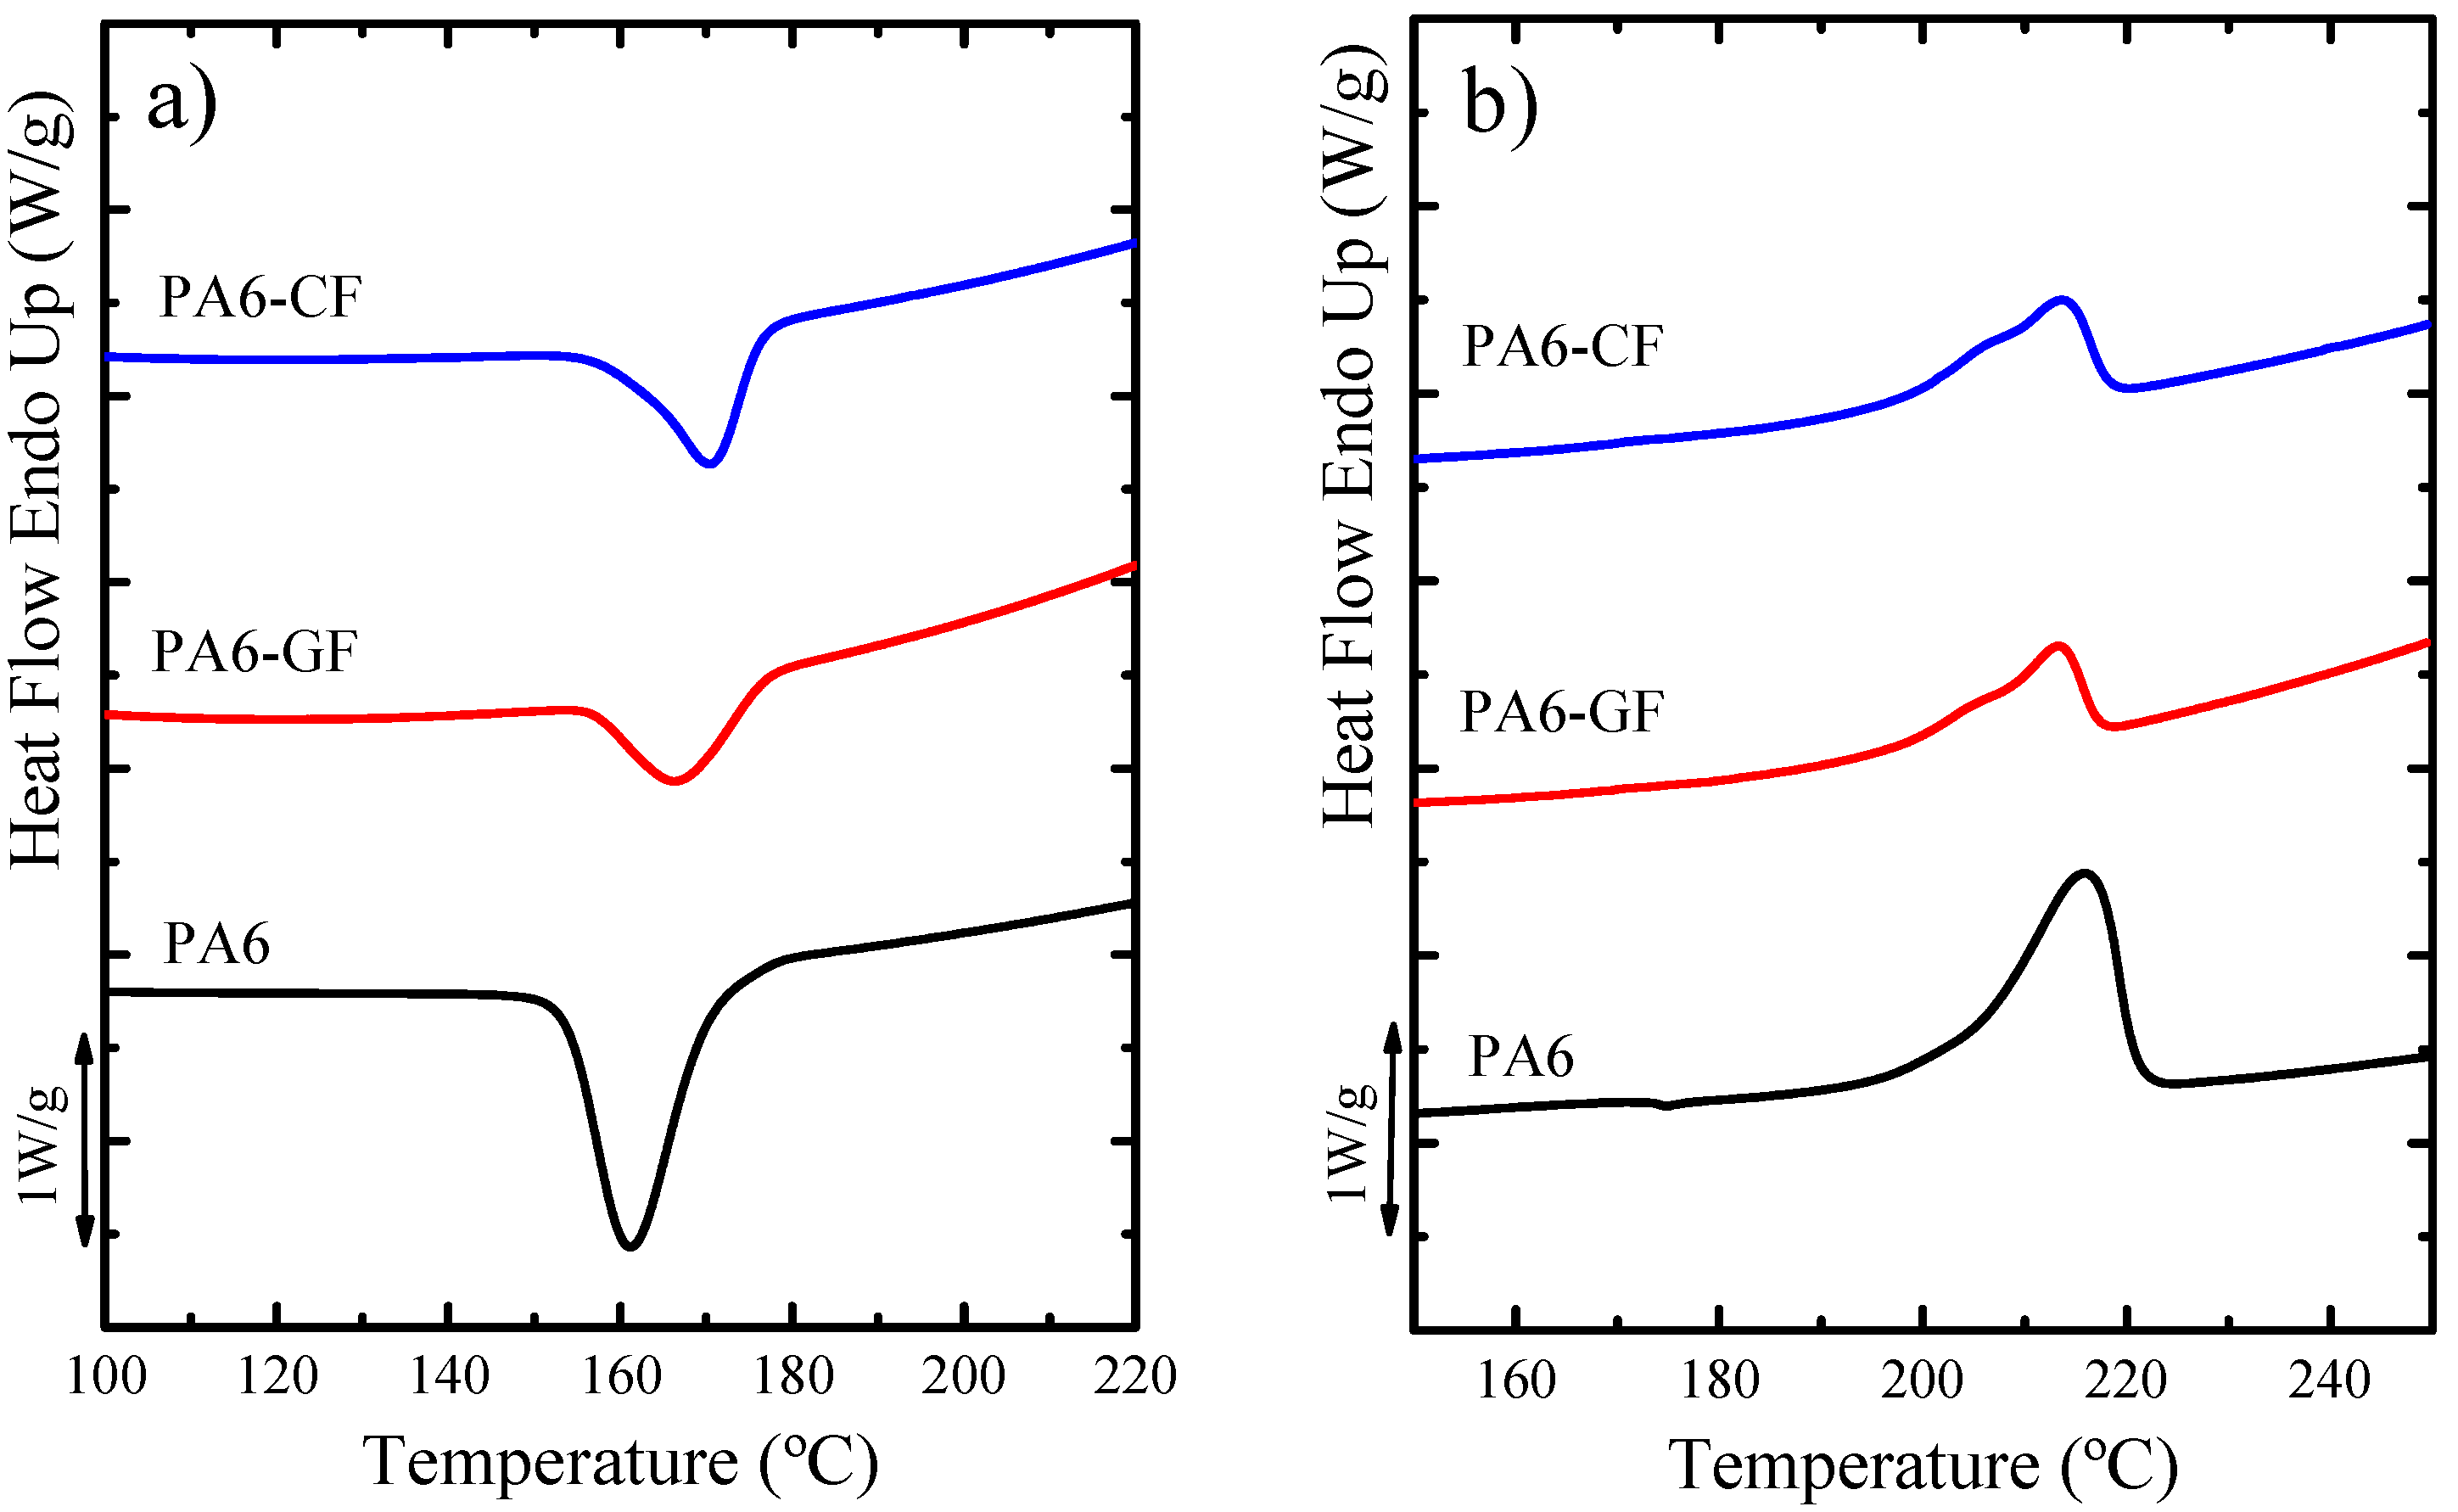
DSC—Thermal Properties and Crystallinity Degree
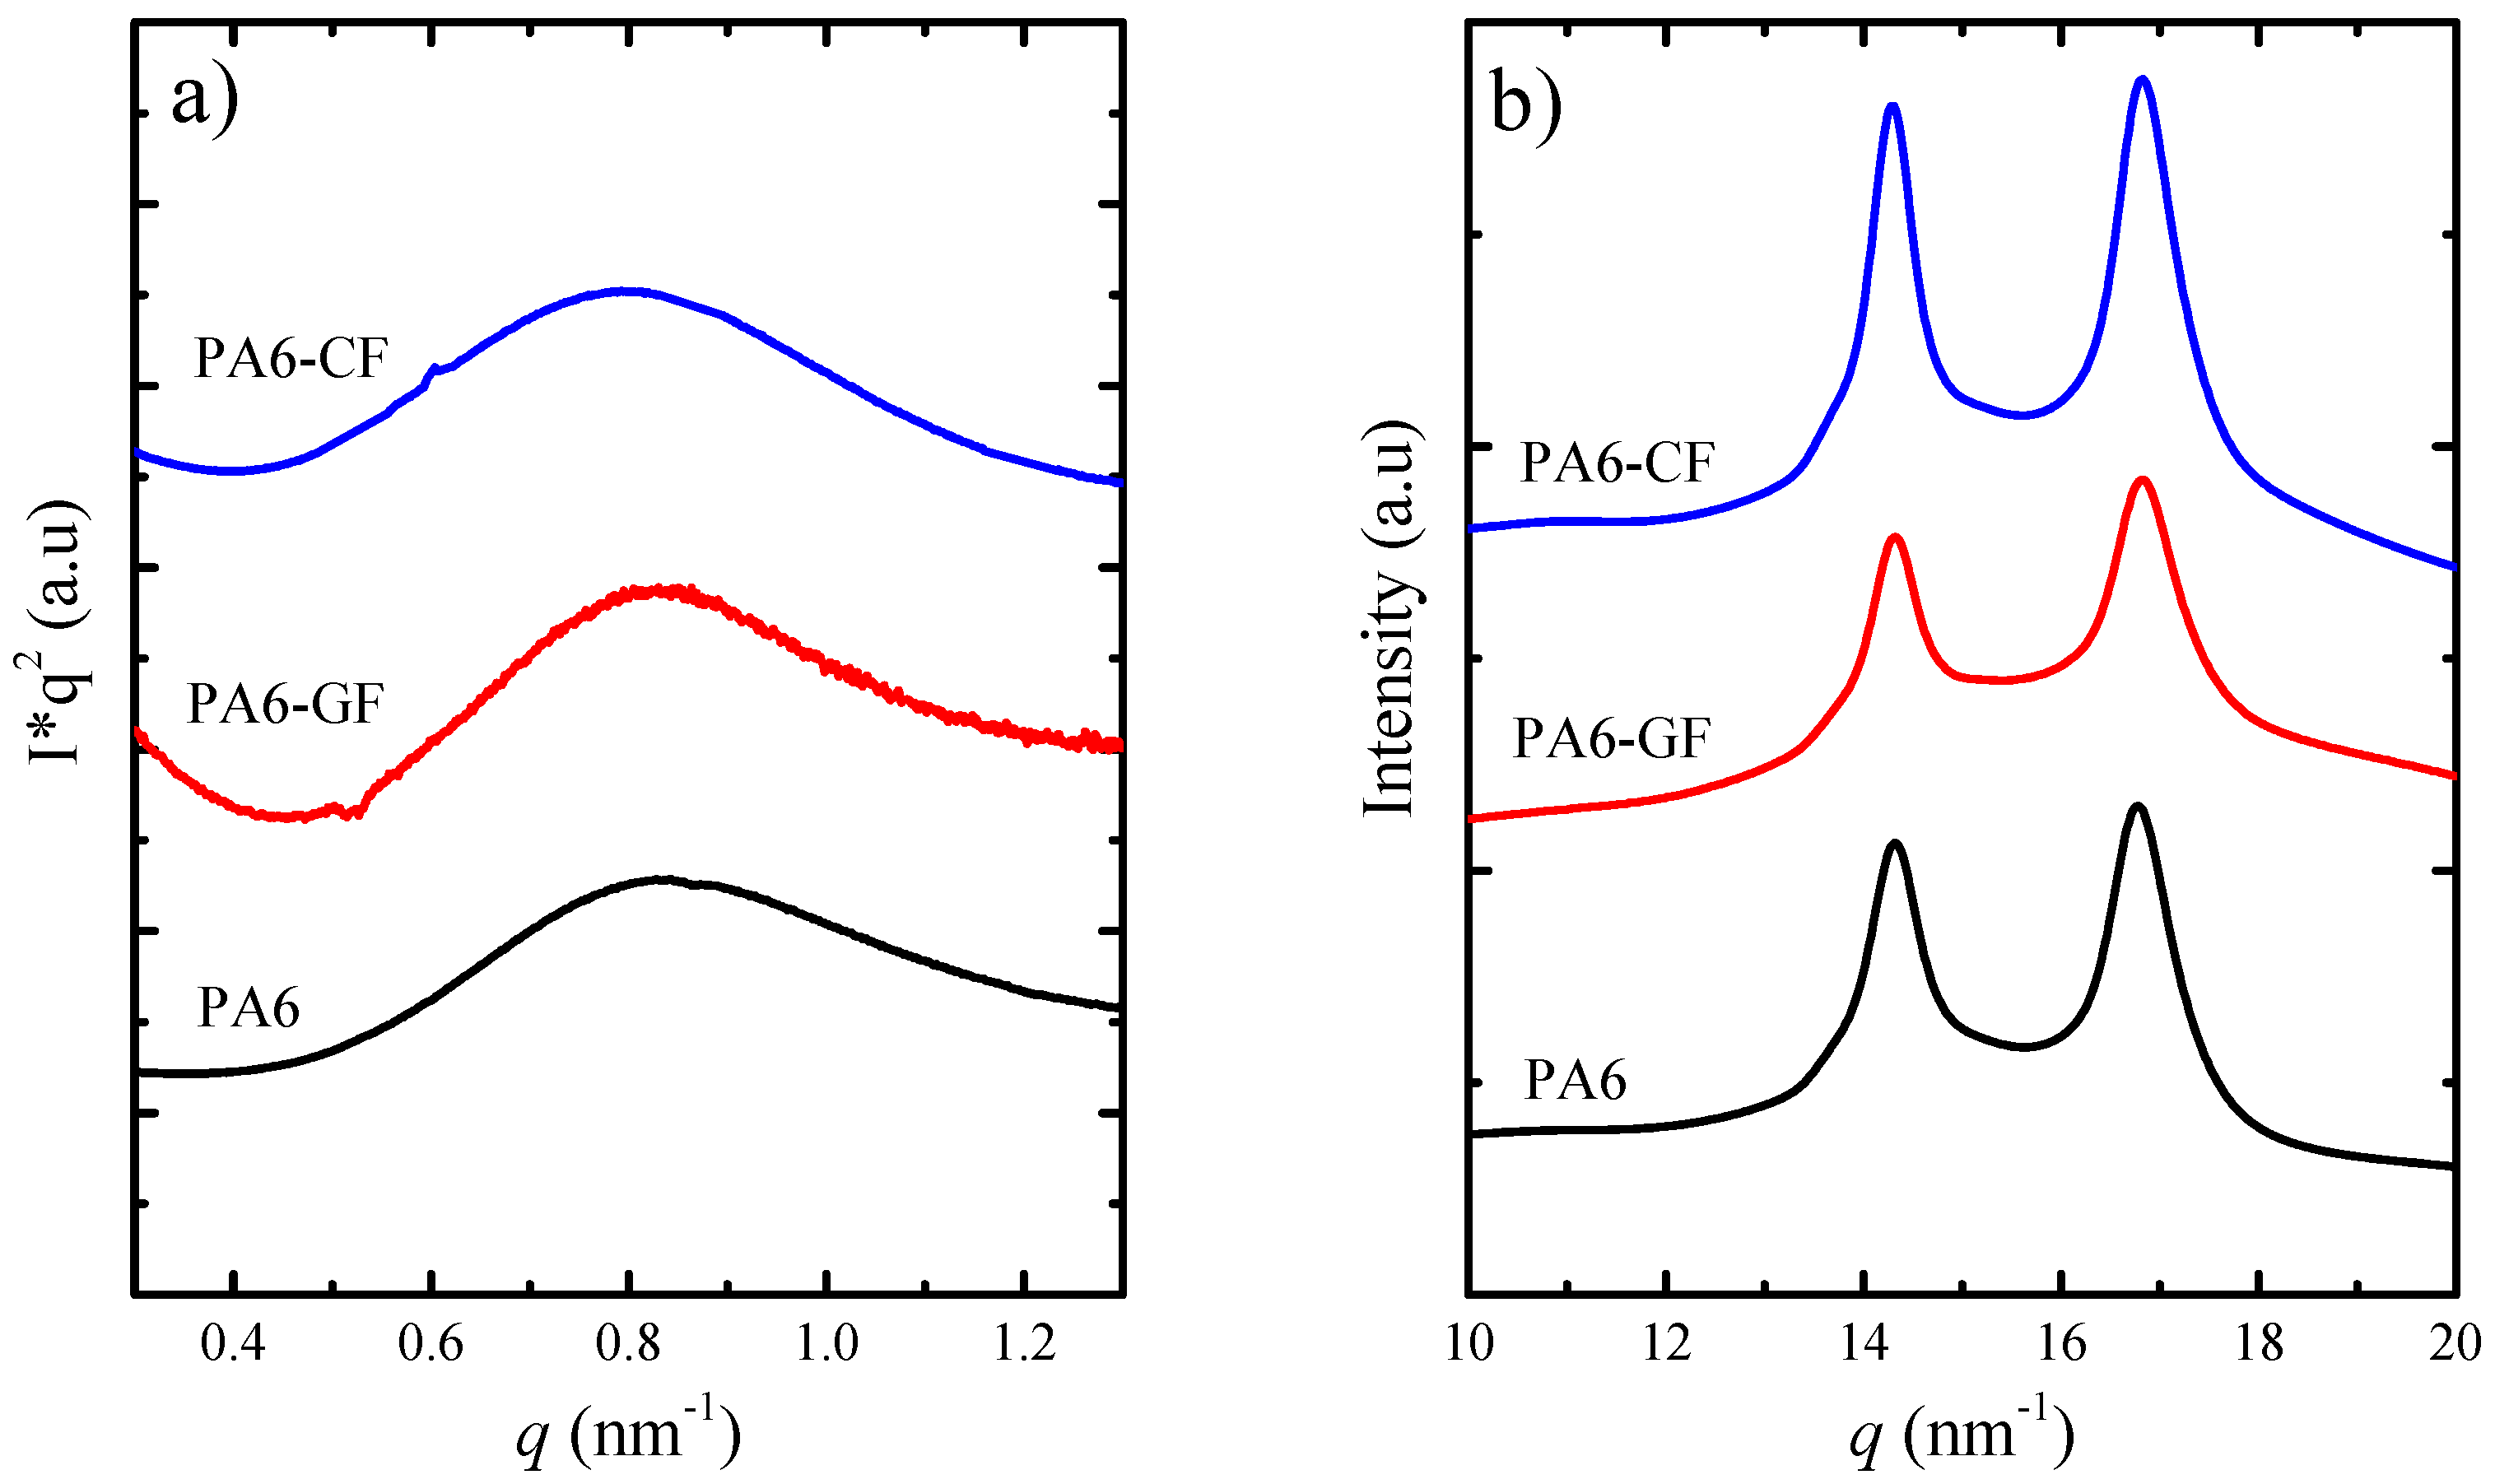
SAXS/WAXS—Crystalline Structure
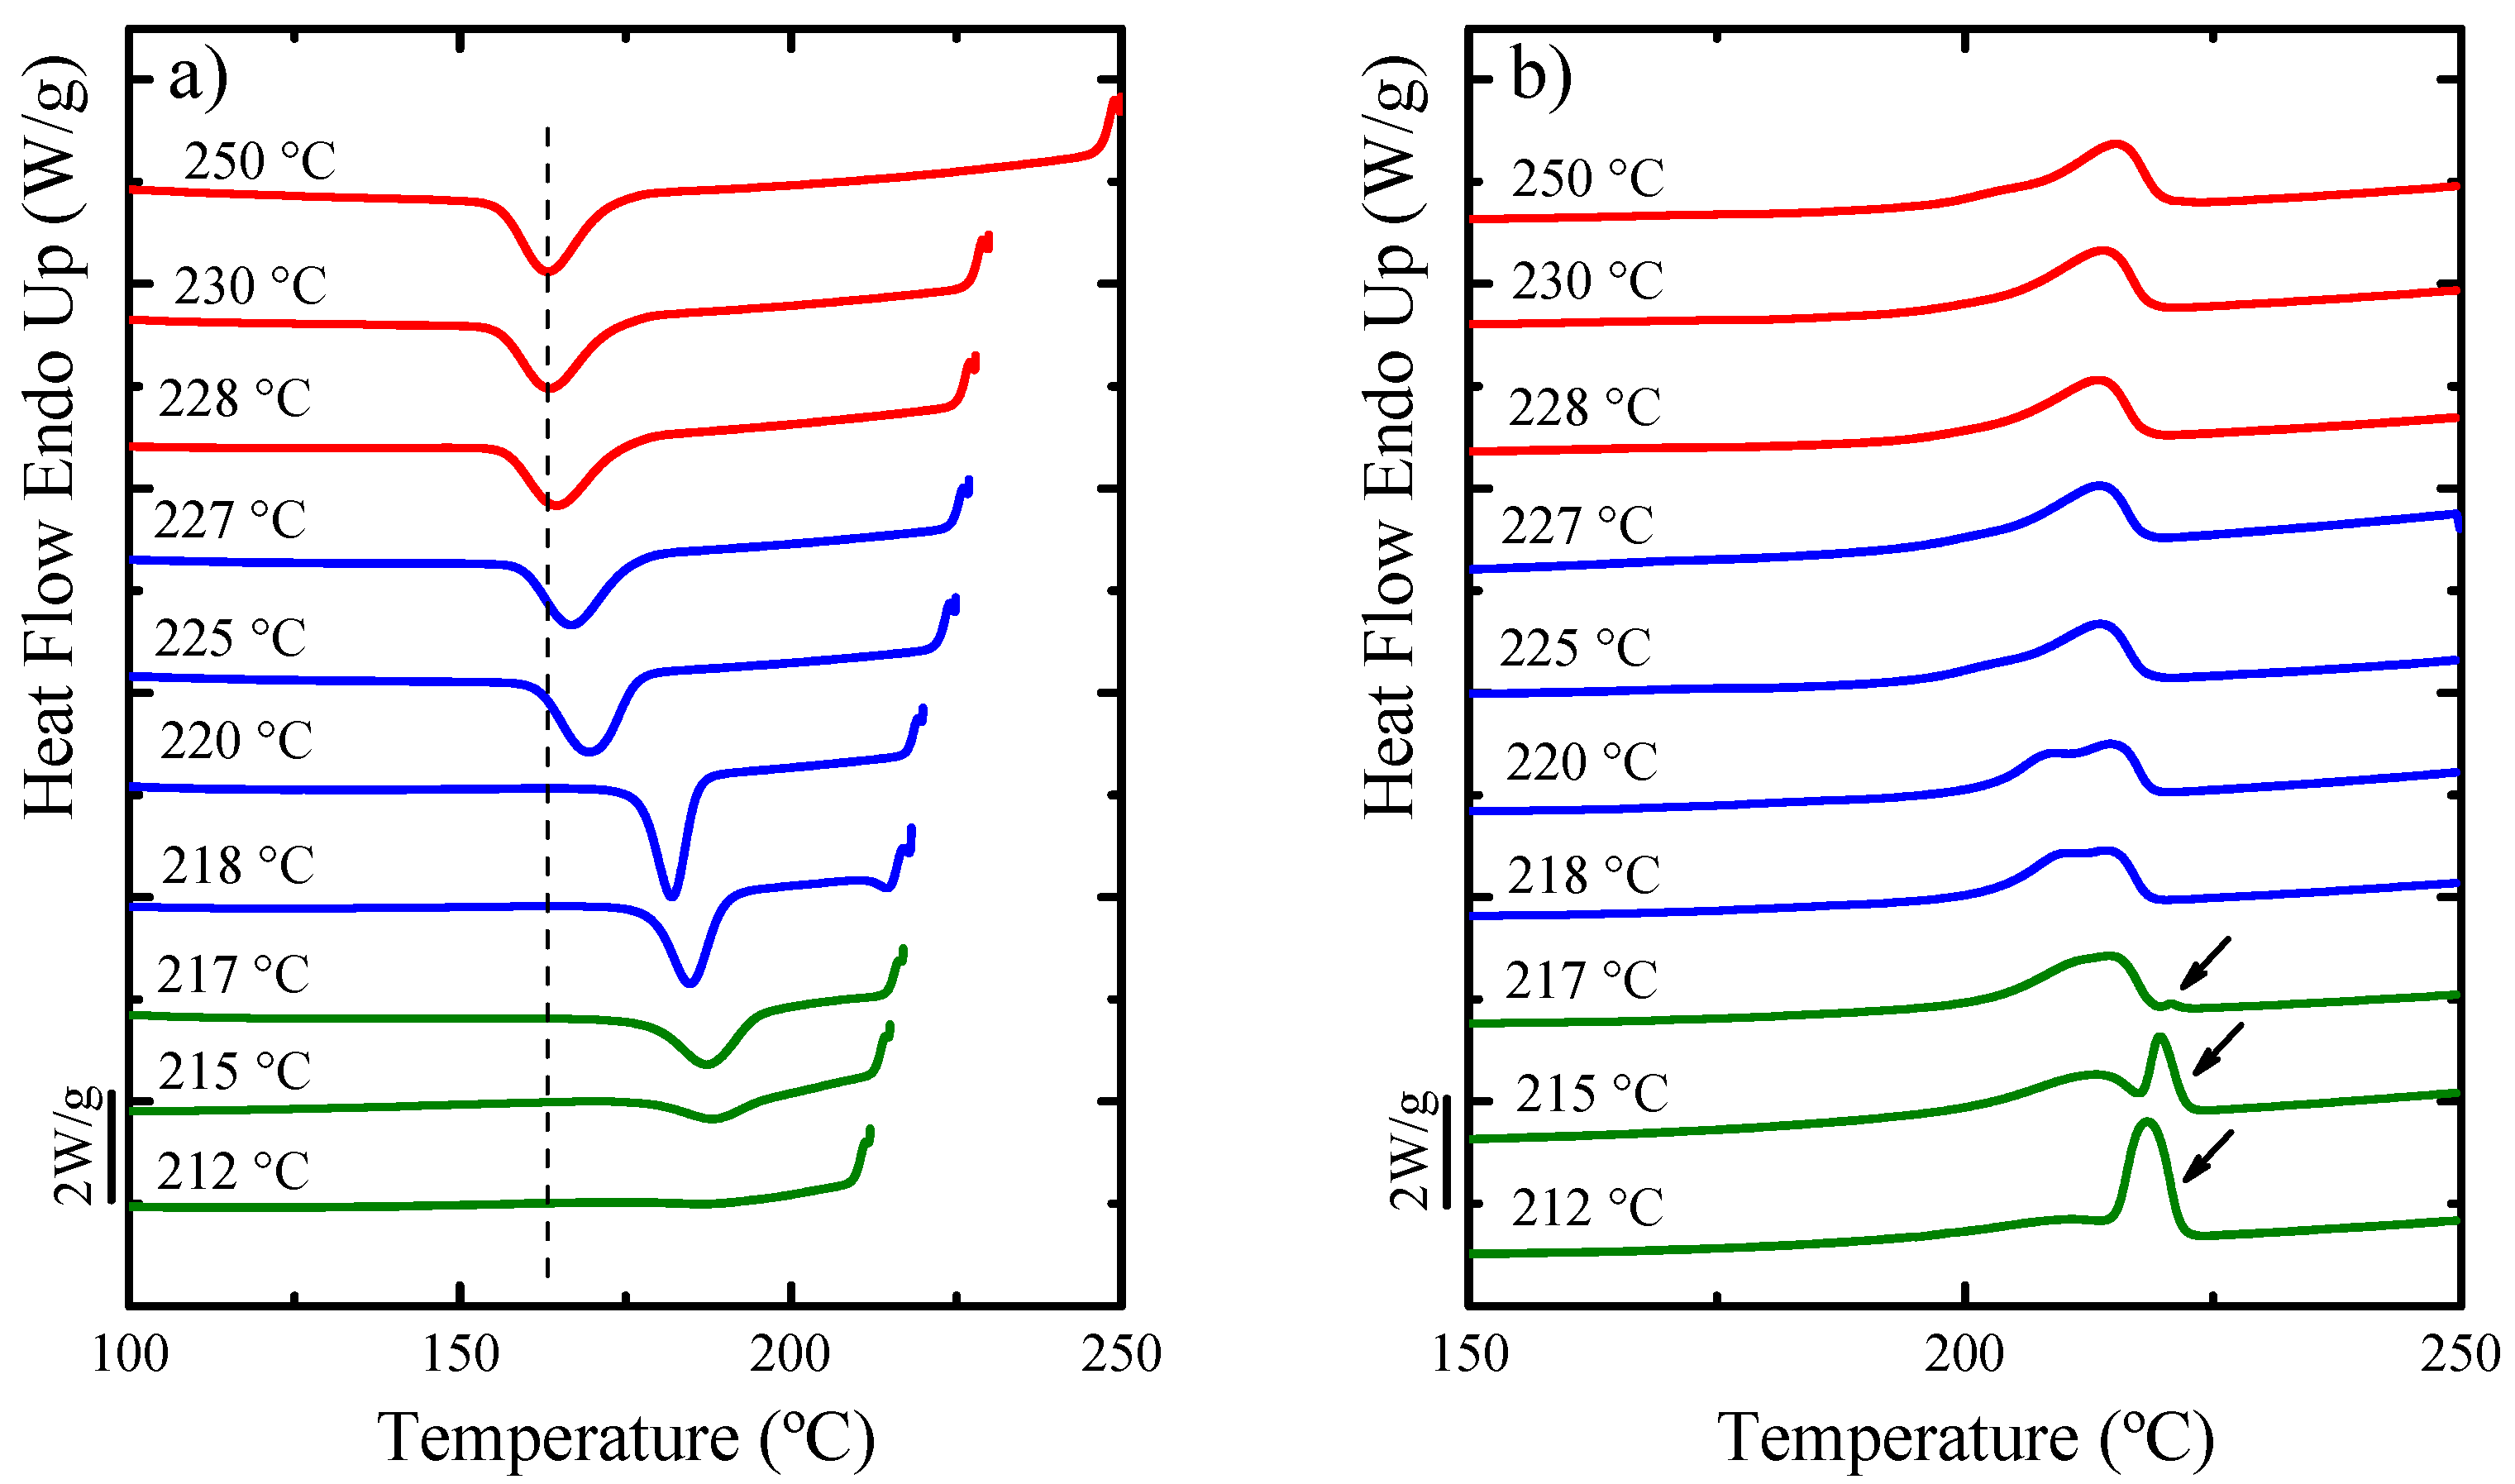
Self-Nucleation (SN)
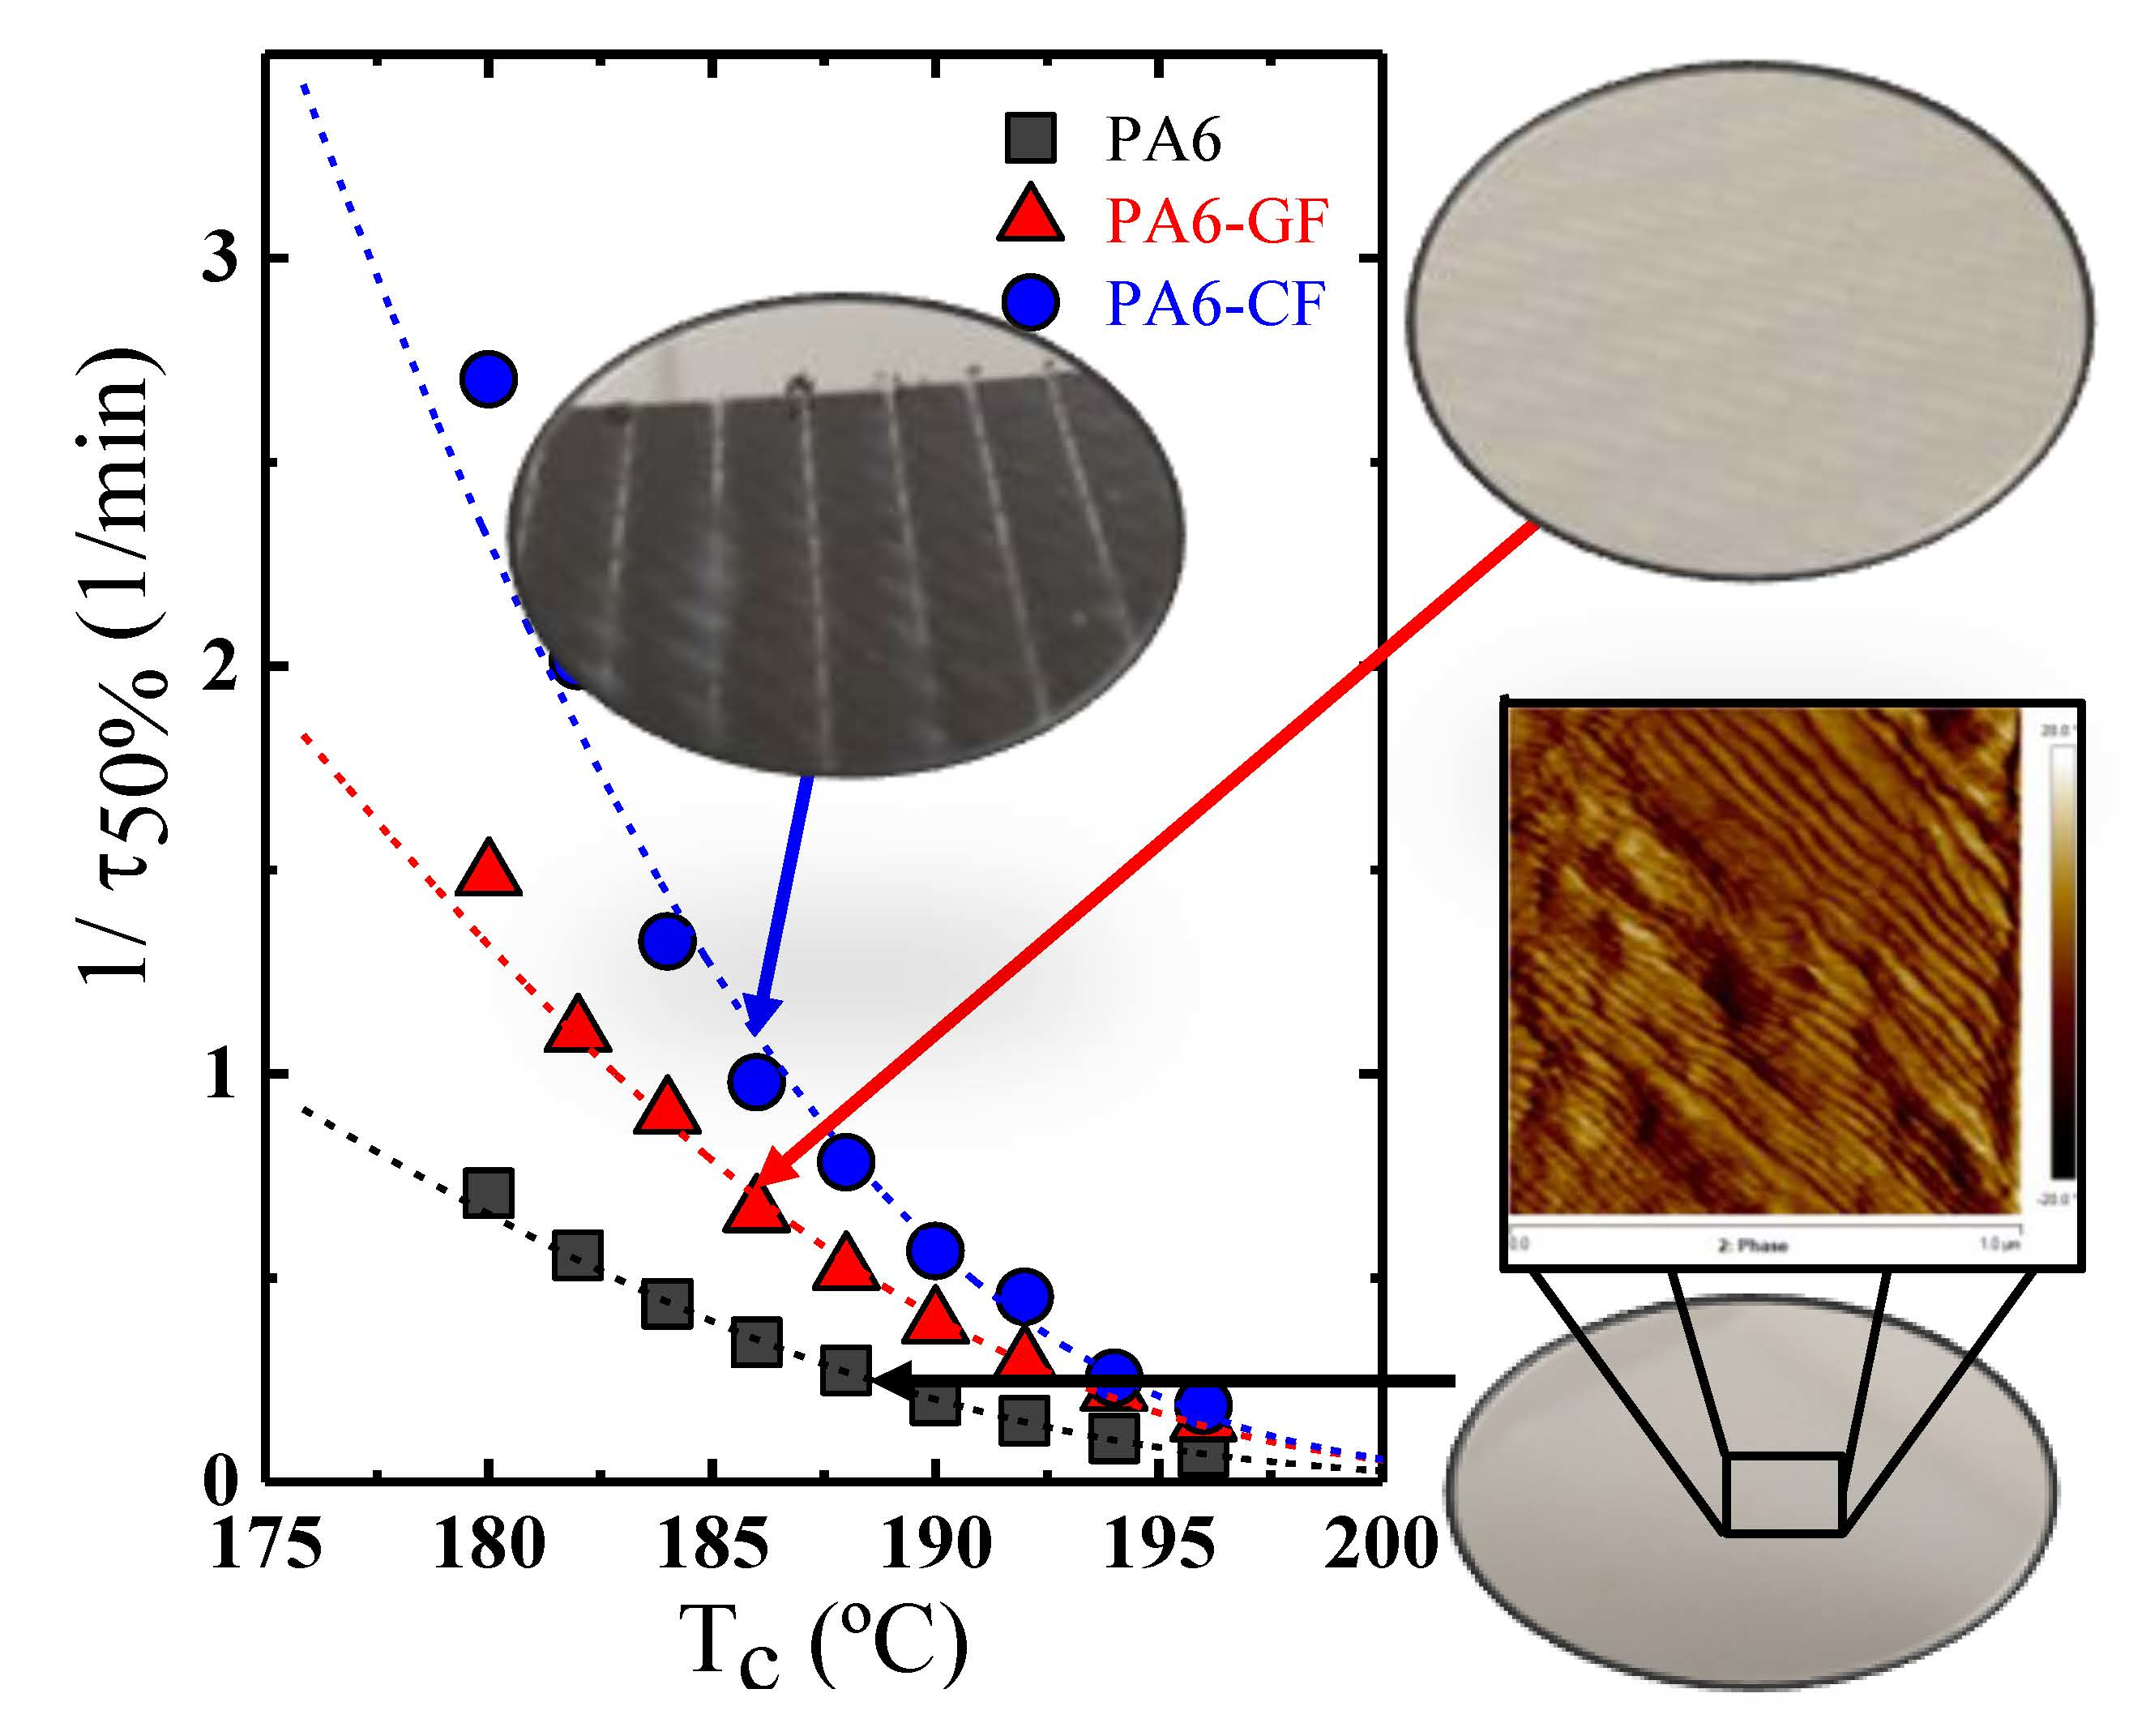
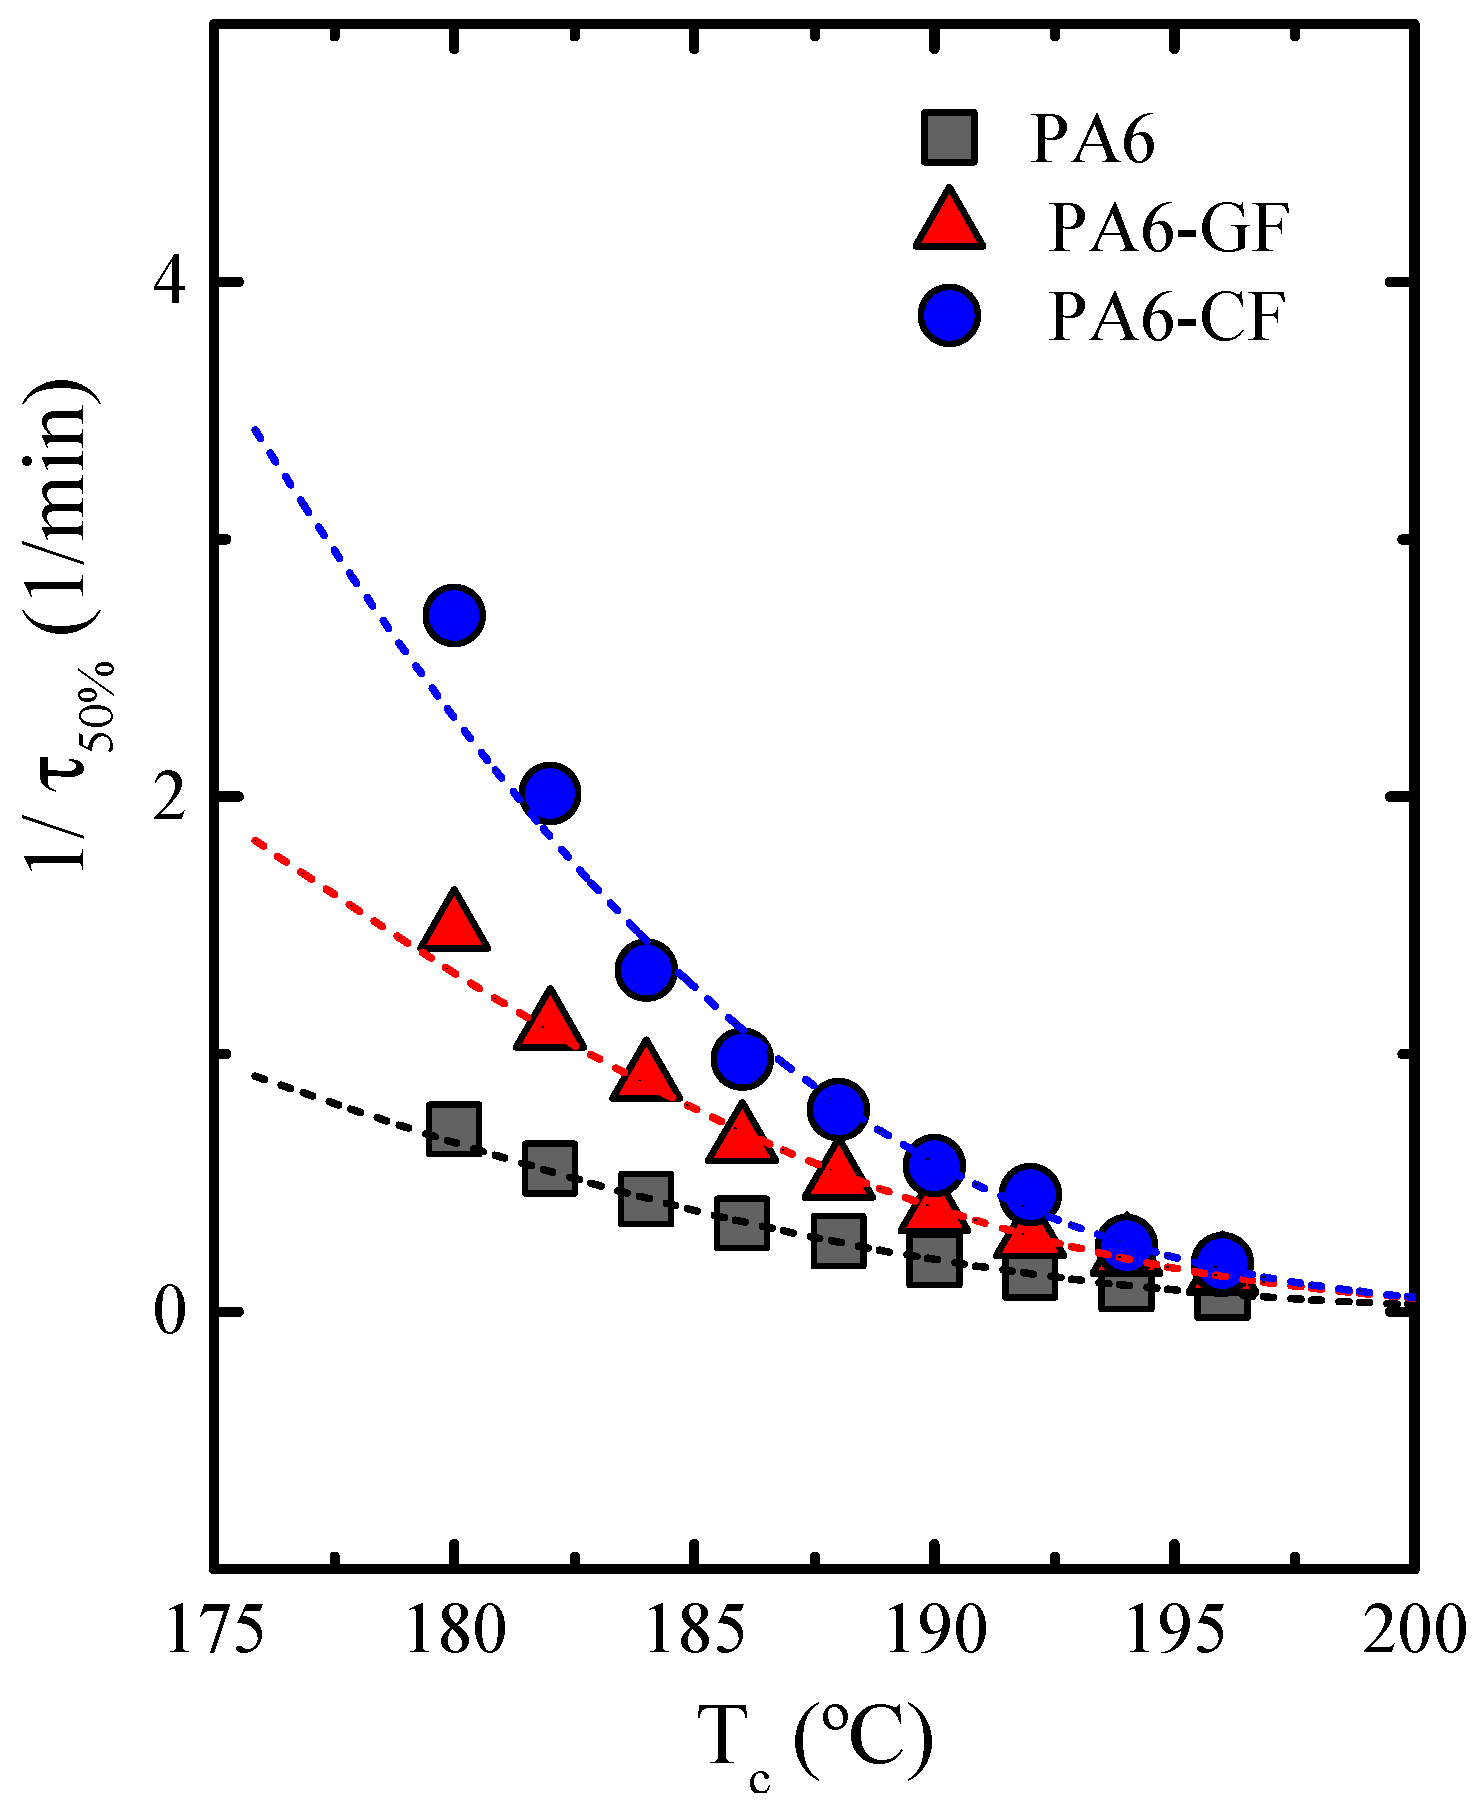
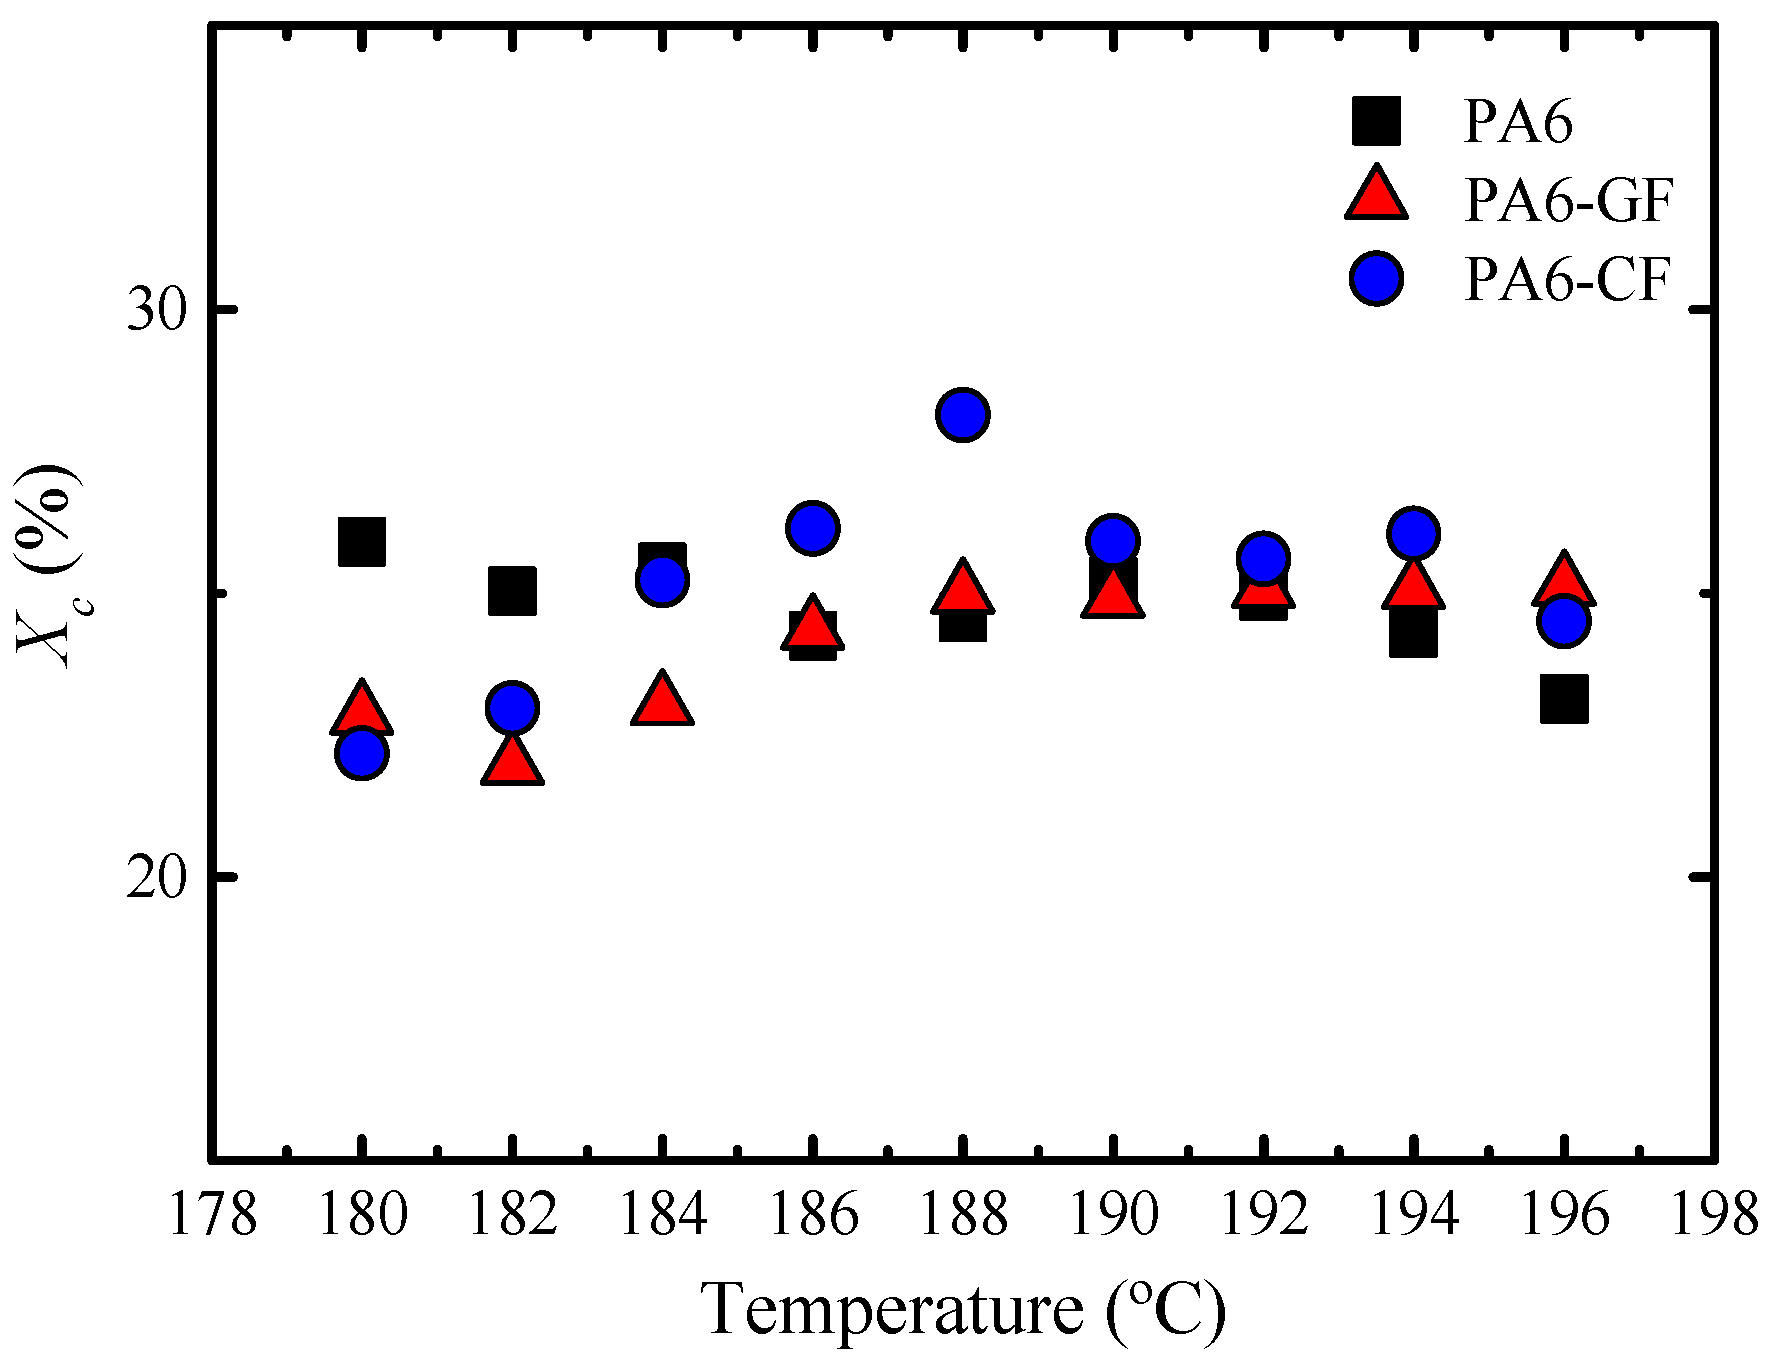
Overall Isothermal Crystallization Studied by DSC
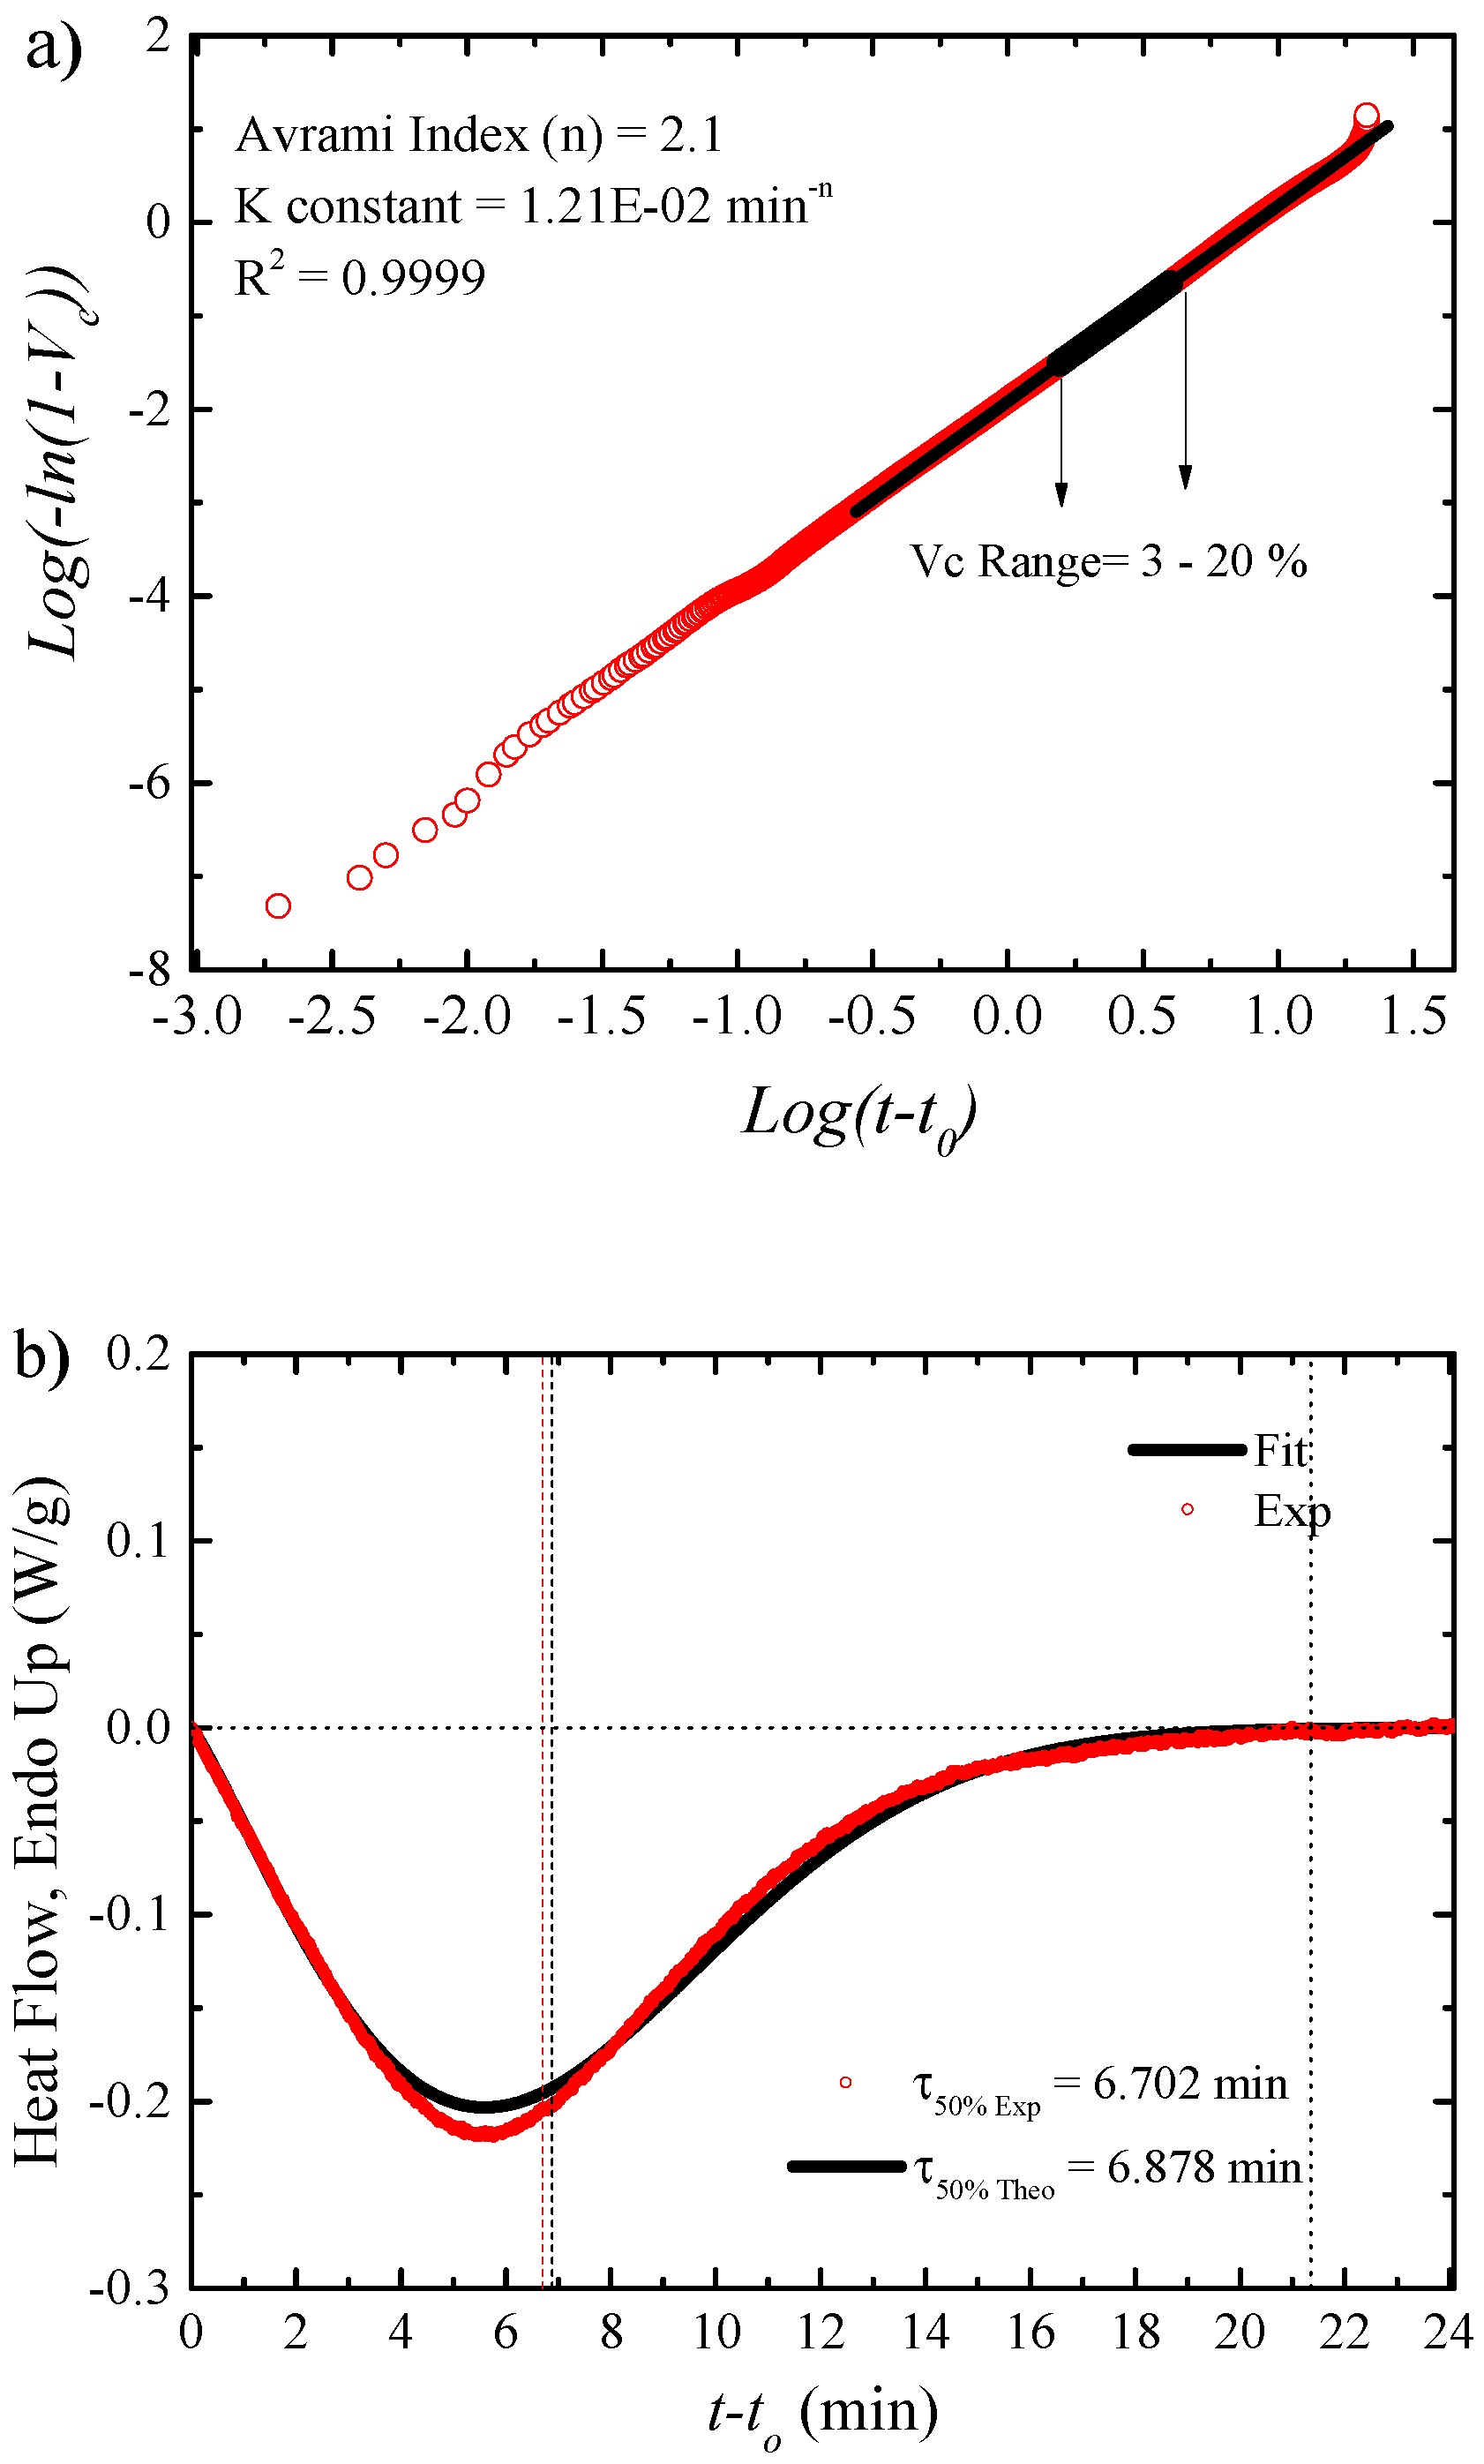
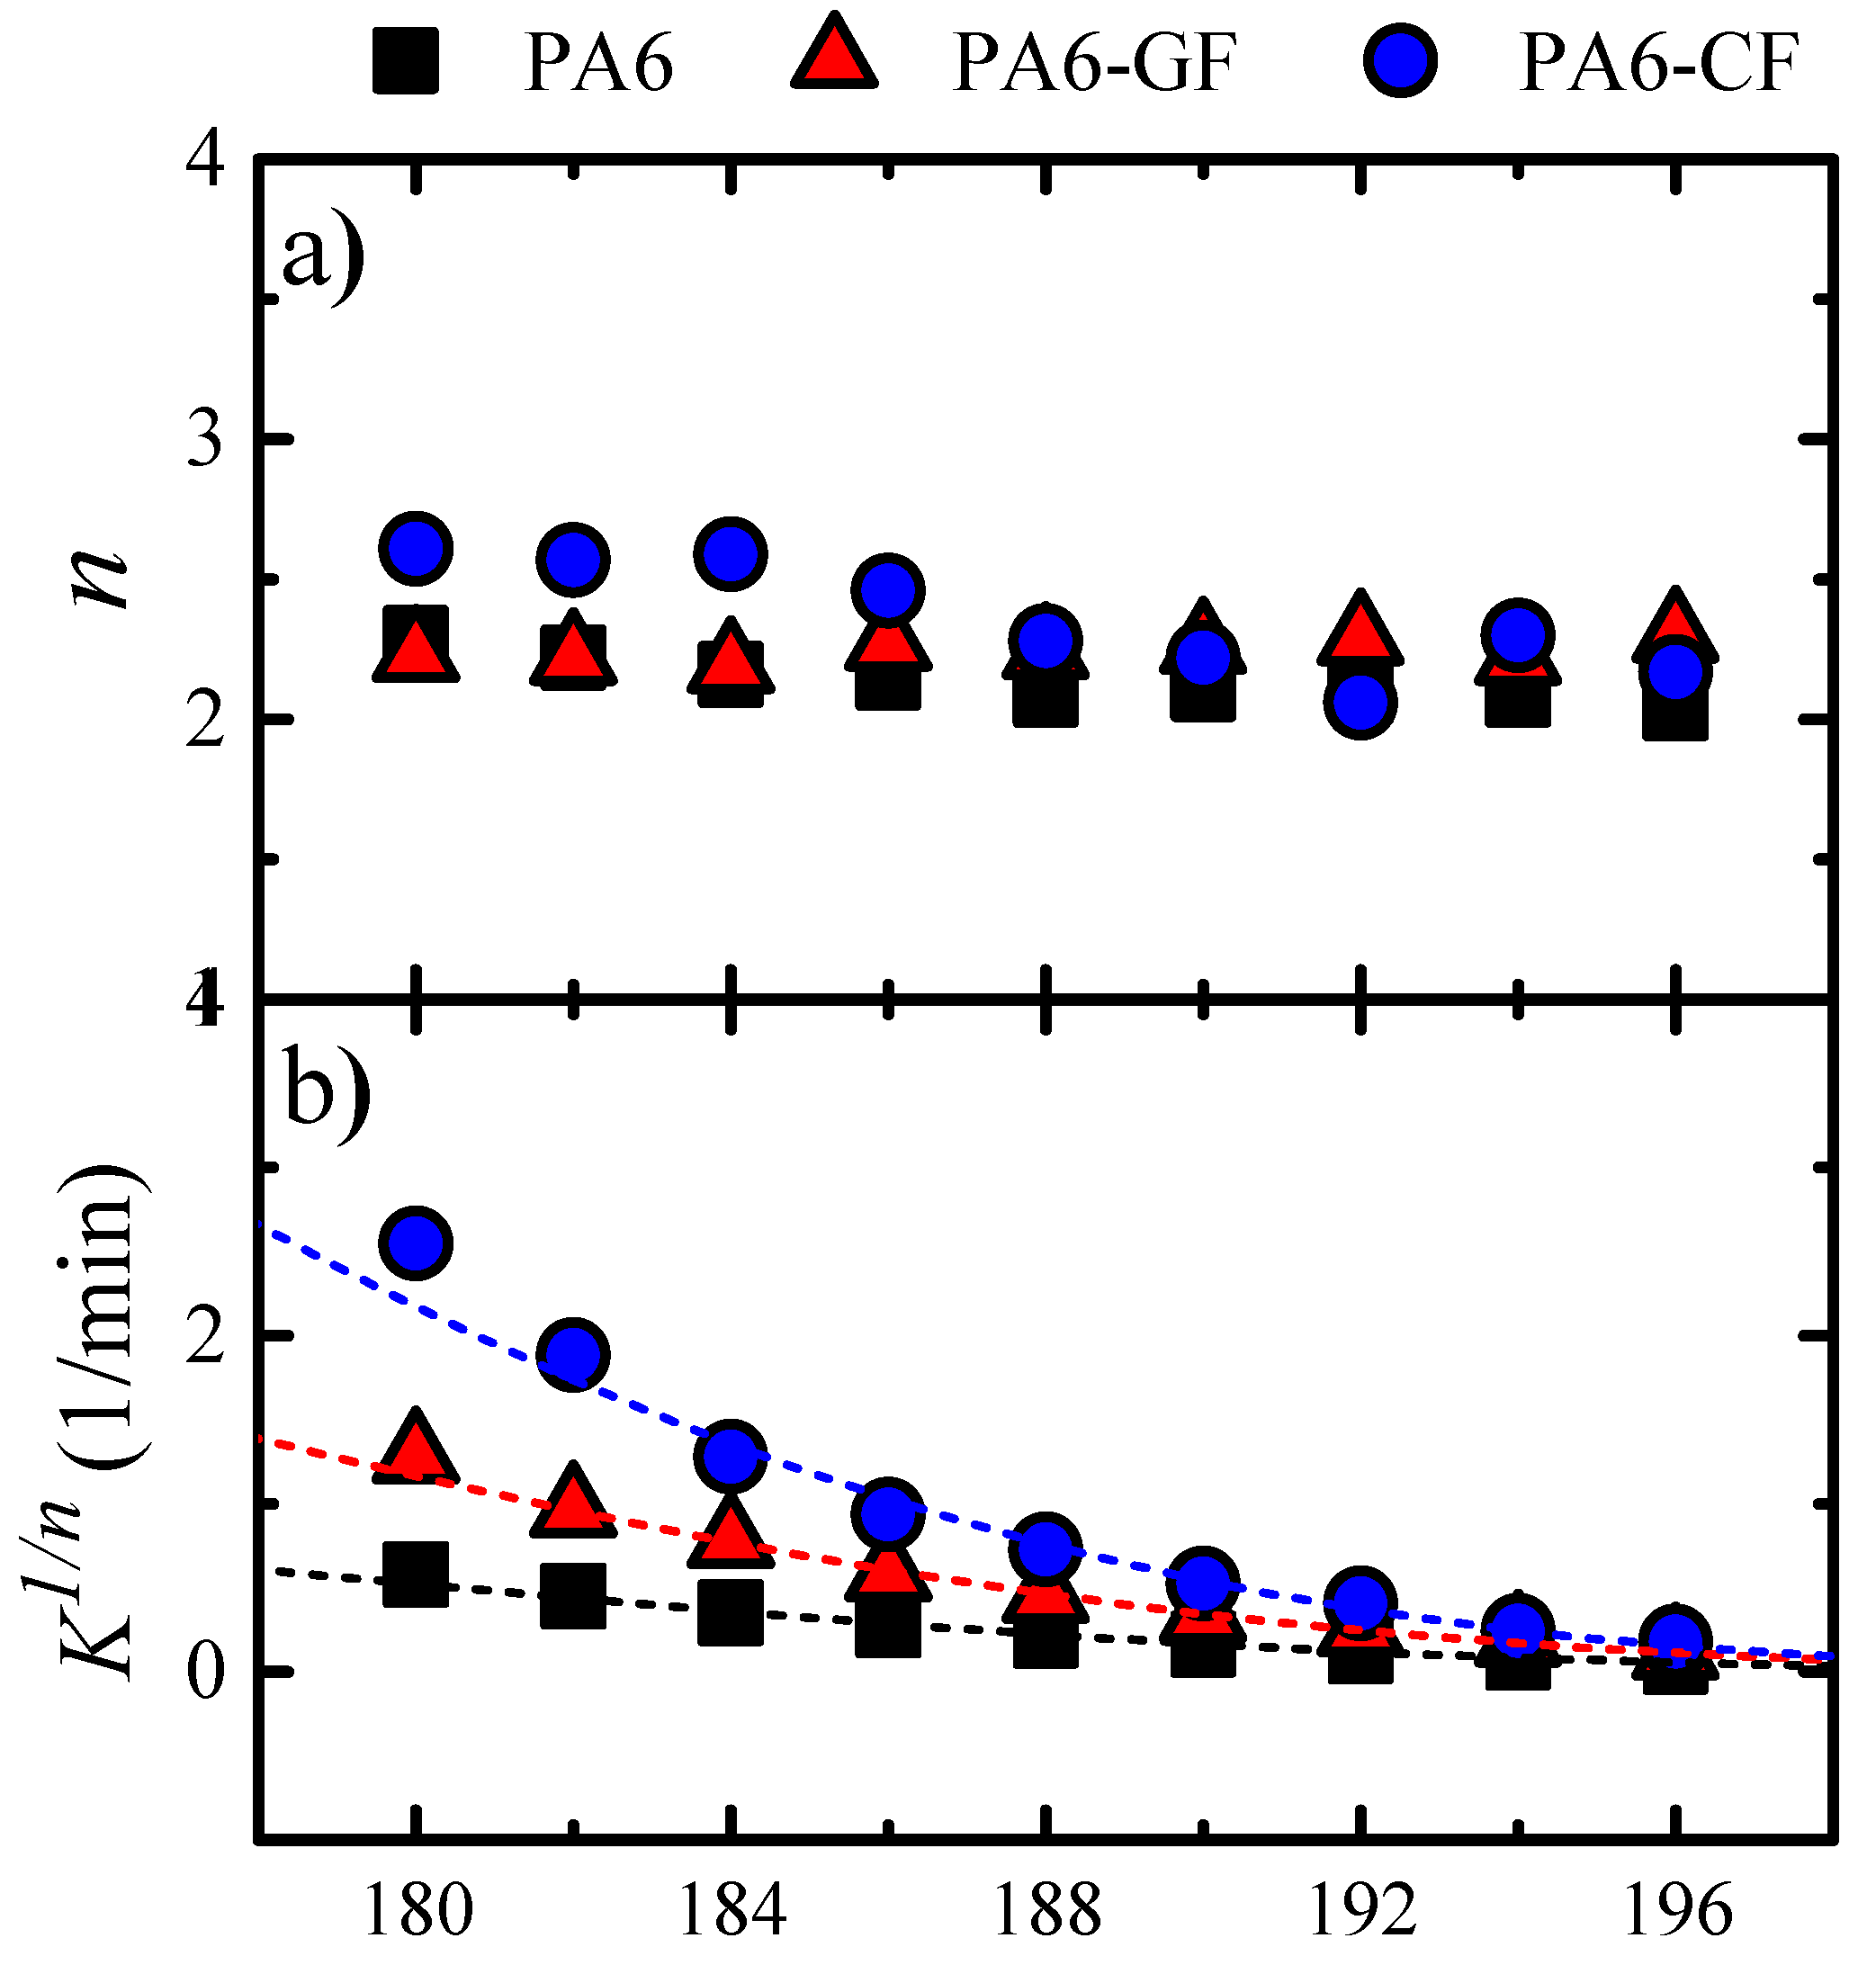
Fitting Isothermal Data to the Avrami Model
Tensile Properties
4. Conclusions
Supplementary Materials
Author Contributions
Funding
Acknowledgments
Conflicts of Interest
References
- Schierbaum, F. Book Reviews: Macromolecules. Starch Stärke 2006, 58, 196. [Google Scholar] [CrossRef]
- Roda, J. Polyamides. In Handbook of Ring-Opening Polymerization; Wiley VCH: Weinheim, Germany, 2009. [Google Scholar]
- Wu, Z.Y.; Xu, W.; Xia, J.K.; Liu, Y.C.; Wu, Q.X.; Xu, W.J. Flame retardant polyamide 6 by in situ polymerization of ɛ-caprolactam in the presence of melamine derivatives. Chin. Chem. Lett. 2008, 19, 241–244. [Google Scholar] [CrossRef]
- Kudva, R.A.; Keskkula, H.; Paul, D.R. Properties of compatibilized nylon 6/ABS blends: Part I. Effect of ABS type. Polymer 2000, 41, 225–237. [Google Scholar] [CrossRef]
- Joyce, R.M.; Ritter, D.M. Process for Making Polymeric Materials. U.S. Patent 2,251,519 (duPont), 5 August 1941. [Google Scholar]
- Tunc, D.; Le Coz, C.; Alexandre, M.; Desbois, P.; Lecomte, P.; Carlotti, S. Reversible Cross-Linking of Aliphatic Polyamides Bearing Thermo- and Photoresponsive Cinnamoyl Moieties. Macromolecules 2014, 47, 8247–8254. [Google Scholar] [CrossRef]
- Russo, S.; Casazza, E. Ring-Opening Polymerization of Cyclic Amides (Lactams). In Polymer Science: A Comprehensive Reference; Matyjaszewski, K., Möller, M., Eds.; Elsevier: Amsterdam, The Netherlands, 2012; pp. 331–396. [Google Scholar]
- Djamal Eddine, K.; Mohammed, B.; Saad, L. Cationic Ring Opening polymerization of ε-caprolactam by a Montmorillonite Clay Catalyst. Bull. Chem. React. Eng. Catal. 2014, 9, 74–80. [Google Scholar]
- Bourban, P.E.; Bögli, A.; Bonjour, F.; Månson, J.A.E. Integrated processing of thermoplastic composites. Compos. Sci. Technol. 1998, 58, 633–637. [Google Scholar] [CrossRef]
- Blumstein, R.B. Thermal Characterization of Polymeric Materials. J. Am. Chem. Soc. 1997, 119, 9589–9590. [Google Scholar] [CrossRef]
- Van Rijswijk, K.; Bersee, H.E.N. Reactive processing of textile fiber-reinforced thermoplastic composites—An overview. Compos. Part A Appl. Sci. Manuf. 2007, 38, 666–681. [Google Scholar] [CrossRef]
- Vicard, C.; De Almeida, O.; Cantarel, A.; Bernhart, G. Modeling of the polymerization and crystallization kinetic coupling of polyamide 6 synthesized from ε-caprolactam. Polymer 2019, 180, 121681. [Google Scholar] [CrossRef]
- Rijswijk, K.V.; Teuwen, J.J.E.; Bersee, H.E.N.; Beukers, A. Textile fiber-reinforced anionic polyamide-6 composites. Part I: The vacuum infusion process. Compos. Part A Appl. Sci. Manuf. 2009, 40, 1–10. [Google Scholar] [CrossRef]
- Zhang, X.; Fan, X.; Li, H.; Yan, C. Facile preparation route for graphene oxide reinforced polyamide 6 composites via in situ anionic ring-opening polymerization. J. Mater. Chem. 2012, 22, 24081–24091. [Google Scholar] [CrossRef]
- Barhoumi, N.; Maazouz, A.; Jaziri, M.; Abdelhedi, R. Polyamide from lactams by reactive rotational molding via anionic ring-opening polymerization: Optimization of processing parameters. Express Polym. Lett. 2013, 7, 76–87. [Google Scholar] [CrossRef]
- Huang, S.; Toh, C.L.; Yang, L.; Phua, S.; Zhou, R.; Dasari, A.; Lu, X. Reinforcing nylon 6 via surface-initiated anionic ring-opening polymerization from stacked-cup carbon nanofibers. Compos. Sci. Technol. 2014, 93, 30–37. [Google Scholar] [CrossRef]
- Van Rijswijk, K.; Bersee, H.E.N.; Beukers, A.; Picken, S.J.; van Geenen, A.A. Optimisation of anionic polyamide-6 for vacuum infusion of thermoplastic composites: Influence of polymerisation temperature on matrix properties. Polym. Test. 2006, 25, 392–404. [Google Scholar] [CrossRef]
- Ueda, K.; Nakai, M.; Hosoda, M.; Tai, K. Synthesis of High Molecular Weight Nylon 6 by Anionic Polymerization of ε-Caprolactam. Mechanism and Kinetics. Polym. J. 1997, 29, 568–573. [Google Scholar] [CrossRef]
- Van Rijswijk, K.; Bersee, H.; Jager, W.; Picken, S. Optimisation of anionic polyamide-6 for vacuum infusion of thermoplastic composites: Choice of activator and initiator. Compos. Part A Appl. Sci. Manuf. 2006, 37, 949–956. [Google Scholar] [CrossRef]
- Konomi, T.; Tani, H. High-temperature polymerization of ϵ-caprolactam by using as catalyst the Li, Na, or K salts derived from MAlEt4 or MOAlEt2·AlEt3 and monomer. J. Polym. Sci. Part A-1 Polym. Chem. 1969, 7, 2269–2280. [Google Scholar] [CrossRef]
- Stea, G.; Gechele, G. Anionic polymerization of caprolactam. Influence of various initiators. Eur. Polym. J. 1970, 6, 233–240. [Google Scholar] [CrossRef]
- Vicard, C.; De Almeida, O.; Cantarel, A.; Bernhart, G. Experimental study of polymerization and crystallization kinetics of polyamide 6 obtained by anionic ring opening polymerization of ε-caprolactam. Polymer 2017, 132, 88–97. [Google Scholar] [CrossRef]
- Maazouz, A.; Lamnawar, K.; Dkier, M. Chemorheological study and in-situ monitoring of PA6 anionic-ring polymerization for RTM processing control. Compos. Part A Appl. Sci. Manuf. 2018, 107, 235–247. [Google Scholar] [CrossRef]
- Zhang, C.-L.; Feng, L.-F.; Hu, G.-H. Anionic polymerization of lactams: A comparative study on various methods of measuring the conversion of ε-caprolactam to polyamide 6. J. Appl. Polym. Sci. 2006, 101, 1972–1981. [Google Scholar] [CrossRef]
- Chen, K.; Jia, M.; Sun, H.; Xue, P. Thermoplastic Reaction Injection Pultrusion for Continuous Glass Fiber-Reinforced Polyamide-6 Composites. Materials 2019, 12, 463. [Google Scholar] [CrossRef] [PubMed]
- Chen, K.; Jia, M.; Hua, S.; Xue, P. Optimization of initiator and activator for reactive thermoplastic pultrusion. J. Polym. Res. 2019, 26, 40. [Google Scholar] [CrossRef]
- Choi, C.-W.; Jin, J.-W.; Lee, H.; Huh, M.; Kang, K.-W. Optimal Polymerization Conditions in Thermoplastic-Resin Transfer Molding Process for Mechanical Properties of Carbon Fiber-Reinforced PA6 Composites Using the Response Surface Method. Fibers Polym. 2019, 20, 1021–1028. [Google Scholar] [CrossRef]
- Höhne, C.-C.; Wendel, R.; Käbisch, B.; Anders, T.; Henning, F.; Kroke, E. Hexaphenoxycyclotriphosphazene as FR for CFR anionic PA6 via T-RTM: A study of mechanical and thermal properties. Fire Mater. 2017, 41, 291–306. [Google Scholar] [CrossRef]
- Bessell, T.J.; Hull, D.; Shortall, J.B. The effect of polymerization conditions and crystallinity on the mechanical properties and fracture of spherulitic nylon 6. J. Mater. Sci. 1975, 10, 1127–1136. [Google Scholar] [CrossRef]
- Göschel, U.; Lutz, W.; Davidson, N.C. The influence of a polymeric nucleating additive on the crystallisation in glass fibre reinforced polyamide 6 composites. Compos. Sci. Technol. 2007, 67, 2606–2615. [Google Scholar] [CrossRef] [Green Version]
- Cartledge, H.C.Y.; Baillie, C.A. Studies of microstructural and mechanical properties of nylon/glass composite Part I The effect of thermal processing on crystallinity, transcrystallinity and crystal phases. J. Mater. Sci. 1999, 34, 5099–5111. [Google Scholar] [CrossRef]
- Klata, E.; Van de Velde, K.; Krucińska, I. DSC investigations of polyamide 6 in hybrid GF/PA 6 yarns and composites. Polym. Test. 2003, 22, 929–937. [Google Scholar] [CrossRef]
- Sanchez-Sanchez, A.; Basterretxea, A.; Mantione, D.; Etxeberria, A.; Elizetxea, C.; de la Calle, A.; García-Arrieta, S.; Sardon, H.; Mecerreyes, D. Organic-acid mediated bulk polymerization of ε-caprolactam and its copolymerization with ε-caprolactone. J. Polym. Sci. Part A Polym. Chem. 2016, 54, 2394–2402. [Google Scholar] [CrossRef]
- García, S.; Palenzuela, L. Process and Device for Polymerizing Lactams in Molds. U.S. Patent 9,293,622 B2, 22 March 2016. [Google Scholar]
- Elizetxea, C.; De La Calle, A.; Hernandez, J.I.; Casado, P.; Liceaga, M. Device for Polymerizing Lactams in Molds. European Patent Application EP 2,743,061 A1, 18 June 2014. [Google Scholar]
- DeLa Calle, A.; Elizetxea, C.; García, S. Device for Polymerizing Lactams in Molds. European Patent Application EP 3,078,465 A1, 12 October 2016. [Google Scholar]
- Mattiussi, A.; Gechele, G.B.; Francesconi, R. Polyamides in solution. III. Viscometry of linear polycaprolactam. J. Polym. Sci. Part A-2 Polym. Phys. 1969, 7, 411–422. [Google Scholar] [CrossRef]
- Lorenzo, A.T.; Arnal, M.L.; Albuerne, J.; Müller, A.J. DSC isothermal polymer crystallization kinetics measurements and the use of the Avrami equation to fit the data: Guidelines to avoid common problems. Polym. Test. 2007, 26, 222–231. [Google Scholar] [CrossRef]
- Müller, A.J.; Arnal, M.L. Thermal fractionation of polymers. Prog. Polym. Sci. 2005, 30, 559–603. [Google Scholar] [CrossRef]
- Lorenzo, A.T.; Arnal, M.L.; Sánchez, J.J.; Müller, A.J. Effect of annealing time on the self-nucleation behavior of semicrystalline polymers. J. Polym. Sci. Part B Polym. Phys. 2006, 44, 1738–1750. [Google Scholar] [CrossRef]
- Müller, A.J.; Michell, R.M.; Pérez, R.A.; Lorenzo, A.T. Successive Self-nucleation and Annealing (SSA): Correct design of thermal protocol and applications. Eur. Polym. J. 2015, 65, 132–154. [Google Scholar] [CrossRef]
- Michell, R.M.; Mugica, A.; Zubitur, M.; Müller, A.J. Self-Nucleation of Crystalline Phases Within Homopolymers, Polymer Blends, Copolymers, and Nanocomposites. In Polymer Crystallization I: From Chain Microstructure to Processing; Auriemma, F., Alfonso, G.C., de Rosa, C., Eds.; Springer International Publishing: Cham, Switzerland, 2017; pp. 215–256. [Google Scholar]
- Liang, J.; Xu, Y.; Wei, Z.; Song, P.; Chen, G.; Zhang, W. Mechanical properties, crystallization and melting behaviors of carbon fiber-reinforced PA6 composites. J. Therm. Anal. Calorim. 2014, 115, 209–218. [Google Scholar] [CrossRef]
- van Rijswijk, K. Thermoplastic Composite Wind Turbine Blades: Vacuum Infusion Technology for Anionic Polyamide-6 Composites. Ph.D. dissertation, Delft University of Technology, Delft, The Netherlands, 2007. [Google Scholar]
- Ricco, L.; Russo, S.; Orefice, G.; Riva, F. Anionic Poly(ε-caprolactam): Relationships among Conditions of Synthesis, Chain Regularity, Reticular Order, and Polymorphism. Macromolecules 1999, 32, 7726–7731. [Google Scholar] [CrossRef]
- Wichterle, O.; šebenda, J.; Králíček, J. The anionic polymerization of caprolactam. In Fortschritte Der Hochpolymeren-Forschung; Springer: Berlin/Heidelberg, Germany, 1961; pp. 578–595. [Google Scholar]
- Gedde, U.W. Polymer Physics; Chapman & Hall: London, UK; New York, NY, USA, 1995. [Google Scholar]
- Parodi, E.; Peters, G.W.M.; Govaert, L.E. Structure-Properties Relations for Polyamide 6, Part 1: Influence of the Thermal History during Compression Moulding on Deformation and Failure Kinetics. Polymers 2018, 10, 710. [Google Scholar] [CrossRef]
- Fornes, T.D.; Paul, D.R. Crystallization behavior of nylon 6 nanocomposites. Polymer 2003, 44, 3945–3961. [Google Scholar] [CrossRef]
- Fillon, B.; Wittmann, J.C.; Lotz, B.; Thierry, A. Self-nucleation and recrystallization of isotactic polypropylene (α phase) investigated by differential scanning calorimetry. J. Polym. Sci. Part B Polym. Phys. 1993, 31, 1383–1393. [Google Scholar] [CrossRef]
- Fillon, B.; Lotz, B.; Thierry, A.; Wittmann, J.C. Self-nucleation and enhanced nucleation of polymers. Definition of a convenient calorimetric “efficiency scale” and evaluation of nucleating additives in isotactic polypropylene (α phase). J. Polym. Sci. Part B Polym. Phys. 1993, 31, 1395–1405. [Google Scholar] [CrossRef]
- Müller, A.; Michell, R.M.; Lorenzo, A. Isothermal Crystallization Kinetics of Polymers. In Polymer Morphology; Guo, Q., Ed.; Wiley VCH: Weinheim, Germany, 2016; pp. 181–203. [Google Scholar]
- Avrami, M. Kinetics of Phase Change. II Transformation-Time Relations for Random Distribution of Nuclei. J. Chem. Phys. 1940, 8, 212–224. [Google Scholar] [CrossRef]
- Avrami, M. Kinetics of Phase Change. I General Theory. J. Chem. Phys. 1939, 7, 1103–1112. [Google Scholar] [CrossRef]
- Avrami, M. Granulation, Phase Change, and Microstructure Kinetics of Phase Change. III. J. Chem. Phys. 1941, 9, 177–184. [Google Scholar] [CrossRef]
- Wu, S.-H.; Wang, F.-Y.; Ma, C.-C.M.; Chang, W.-C.; Kuo, C.-T.; Kuan, H.-C.; Chen, W.-J. Mechanical, thermal and morphological properties of glass fiber and carbon fiber reinforced polyamide-6 and polyamide-6/clay nanocomposites. Mater. Lett. 2001, 49, 327–333. [Google Scholar] [CrossRef]


| Grammage | Nominal Fiber Content wt.% | Mη (kg/mol) | Xp (%) | T10% (°C) | TGA Residue (α) (%) | |
|---|---|---|---|---|---|---|
| PA6 | - | - | 205 | 97 | 278 | 1 |
| PA6-GF | 600 | 60 | 195 | 98 | 338 | 57 |
| PA6-CF | 300 | 47 | 196 | 97 | 325 | 51 |
| 1st Heating | Cooling and 2nd Heating | ||||||||||
|---|---|---|---|---|---|---|---|---|---|---|---|
| Tm (°C) | ΔHm (J/g) | ΔHm,cor * (J/g) | Xc (%) | Tc (°C) | ΔHm (J/g) | ΔHc,cor. (J/g) | Tm (°C) | ΔHm (J/g) | ΔHm,cor. (J/g) | Xc (%) | |
| PA6 | 217.8 | 81.0 | 43 | 161.3 | 46.2 | 214.2 | 45.6 | 23 | |||
| PA6-GF | 217.9 | 37.8 | 87.9 | 47 | 166.6 | 20.4 | 47.4 | 213.2 | 21.4 | 49.7 | 26 |
| PA6-CF | 218.6 | 46.5 | 94.9 | 51 | 170.5 | 24.6 | 50.2 | 213.5 | 25.8 | 52.6 | 28 |
| % Fiber (in wt.%) | Elastic Modulus (GPa) | Tensile Strength (MPa) | |
|---|---|---|---|
| PA6 | - | 0.8 | 48 |
| PA6-GF | 60 | 17.3 | 337 |
| SD | - | 0.18 | 12 |
| PA6-CF | 47 | 44 | 620 |
| SD | - | 4.9 | 92 |
© 2019 by the authors. Licensee MDPI, Basel, Switzerland. This article is an open access article distributed under the terms and conditions of the Creative Commons Attribution (CC BY) license (http://creativecommons.org/licenses/by/4.0/).
Share and Cite
Zaldua, N.; Maiz, J.; de la Calle, A.; García-Arrieta, S.; Elizetxea, C.; Harismendy, I.; Tercjak, A.; Müller, A.J. Nucleation and Crystallization of PA6 Composites Prepared by T-RTM: Effects of Carbon and Glass Fiber Loading. Polymers 2019, 11, 1680. https://doi.org/10.3390/polym11101680
Zaldua N, Maiz J, de la Calle A, García-Arrieta S, Elizetxea C, Harismendy I, Tercjak A, Müller AJ. Nucleation and Crystallization of PA6 Composites Prepared by T-RTM: Effects of Carbon and Glass Fiber Loading. Polymers. 2019; 11(10):1680. https://doi.org/10.3390/polym11101680
Chicago/Turabian StyleZaldua, Nerea, Jon Maiz, Amaia de la Calle, Sonia García-Arrieta, Cristina Elizetxea, Isabel Harismendy, Agnieszka Tercjak, and Alejandro J. Müller. 2019. "Nucleation and Crystallization of PA6 Composites Prepared by T-RTM: Effects of Carbon and Glass Fiber Loading" Polymers 11, no. 10: 1680. https://doi.org/10.3390/polym11101680