Mass Spectrometry Reveals Molecular Structure of Polyhydroxyalkanoates Attained by Bioconversion of Oxidized Polypropylene Waste Fragments

 ,
,  , and
, and
Abstract
: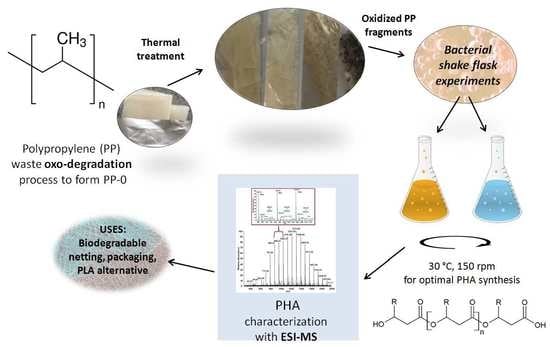
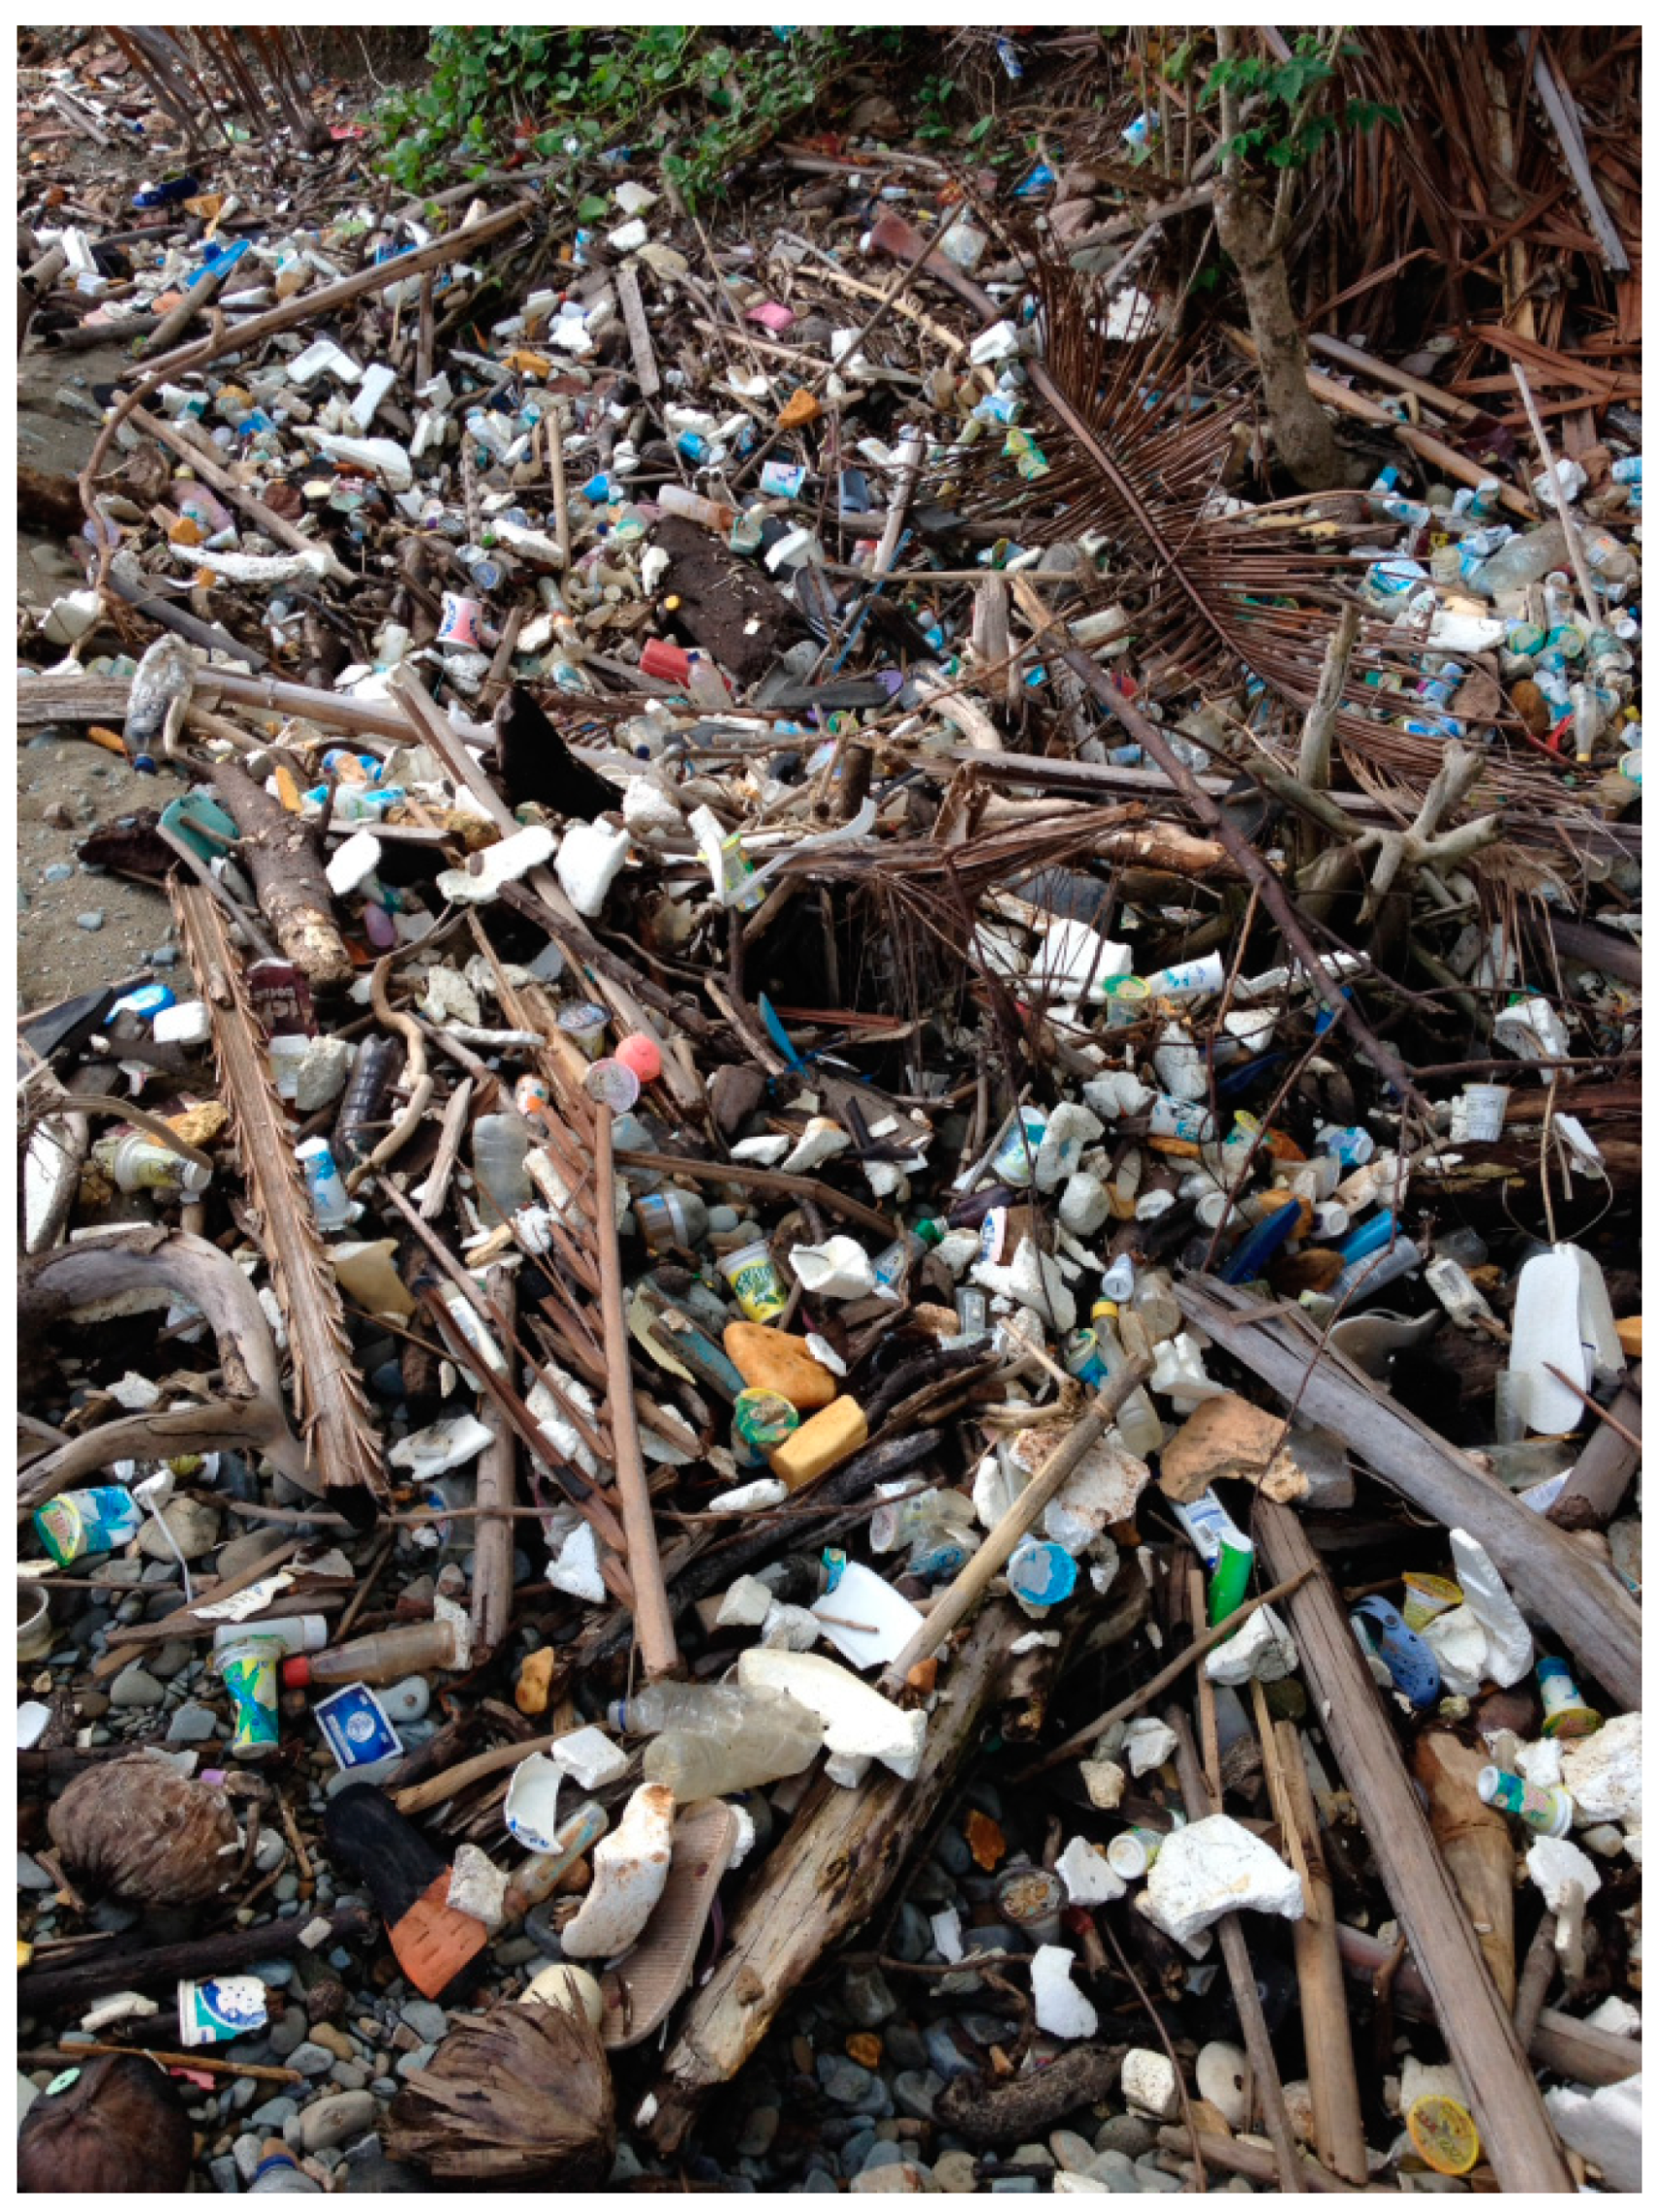
1. Introduction
2. Materials and Methods
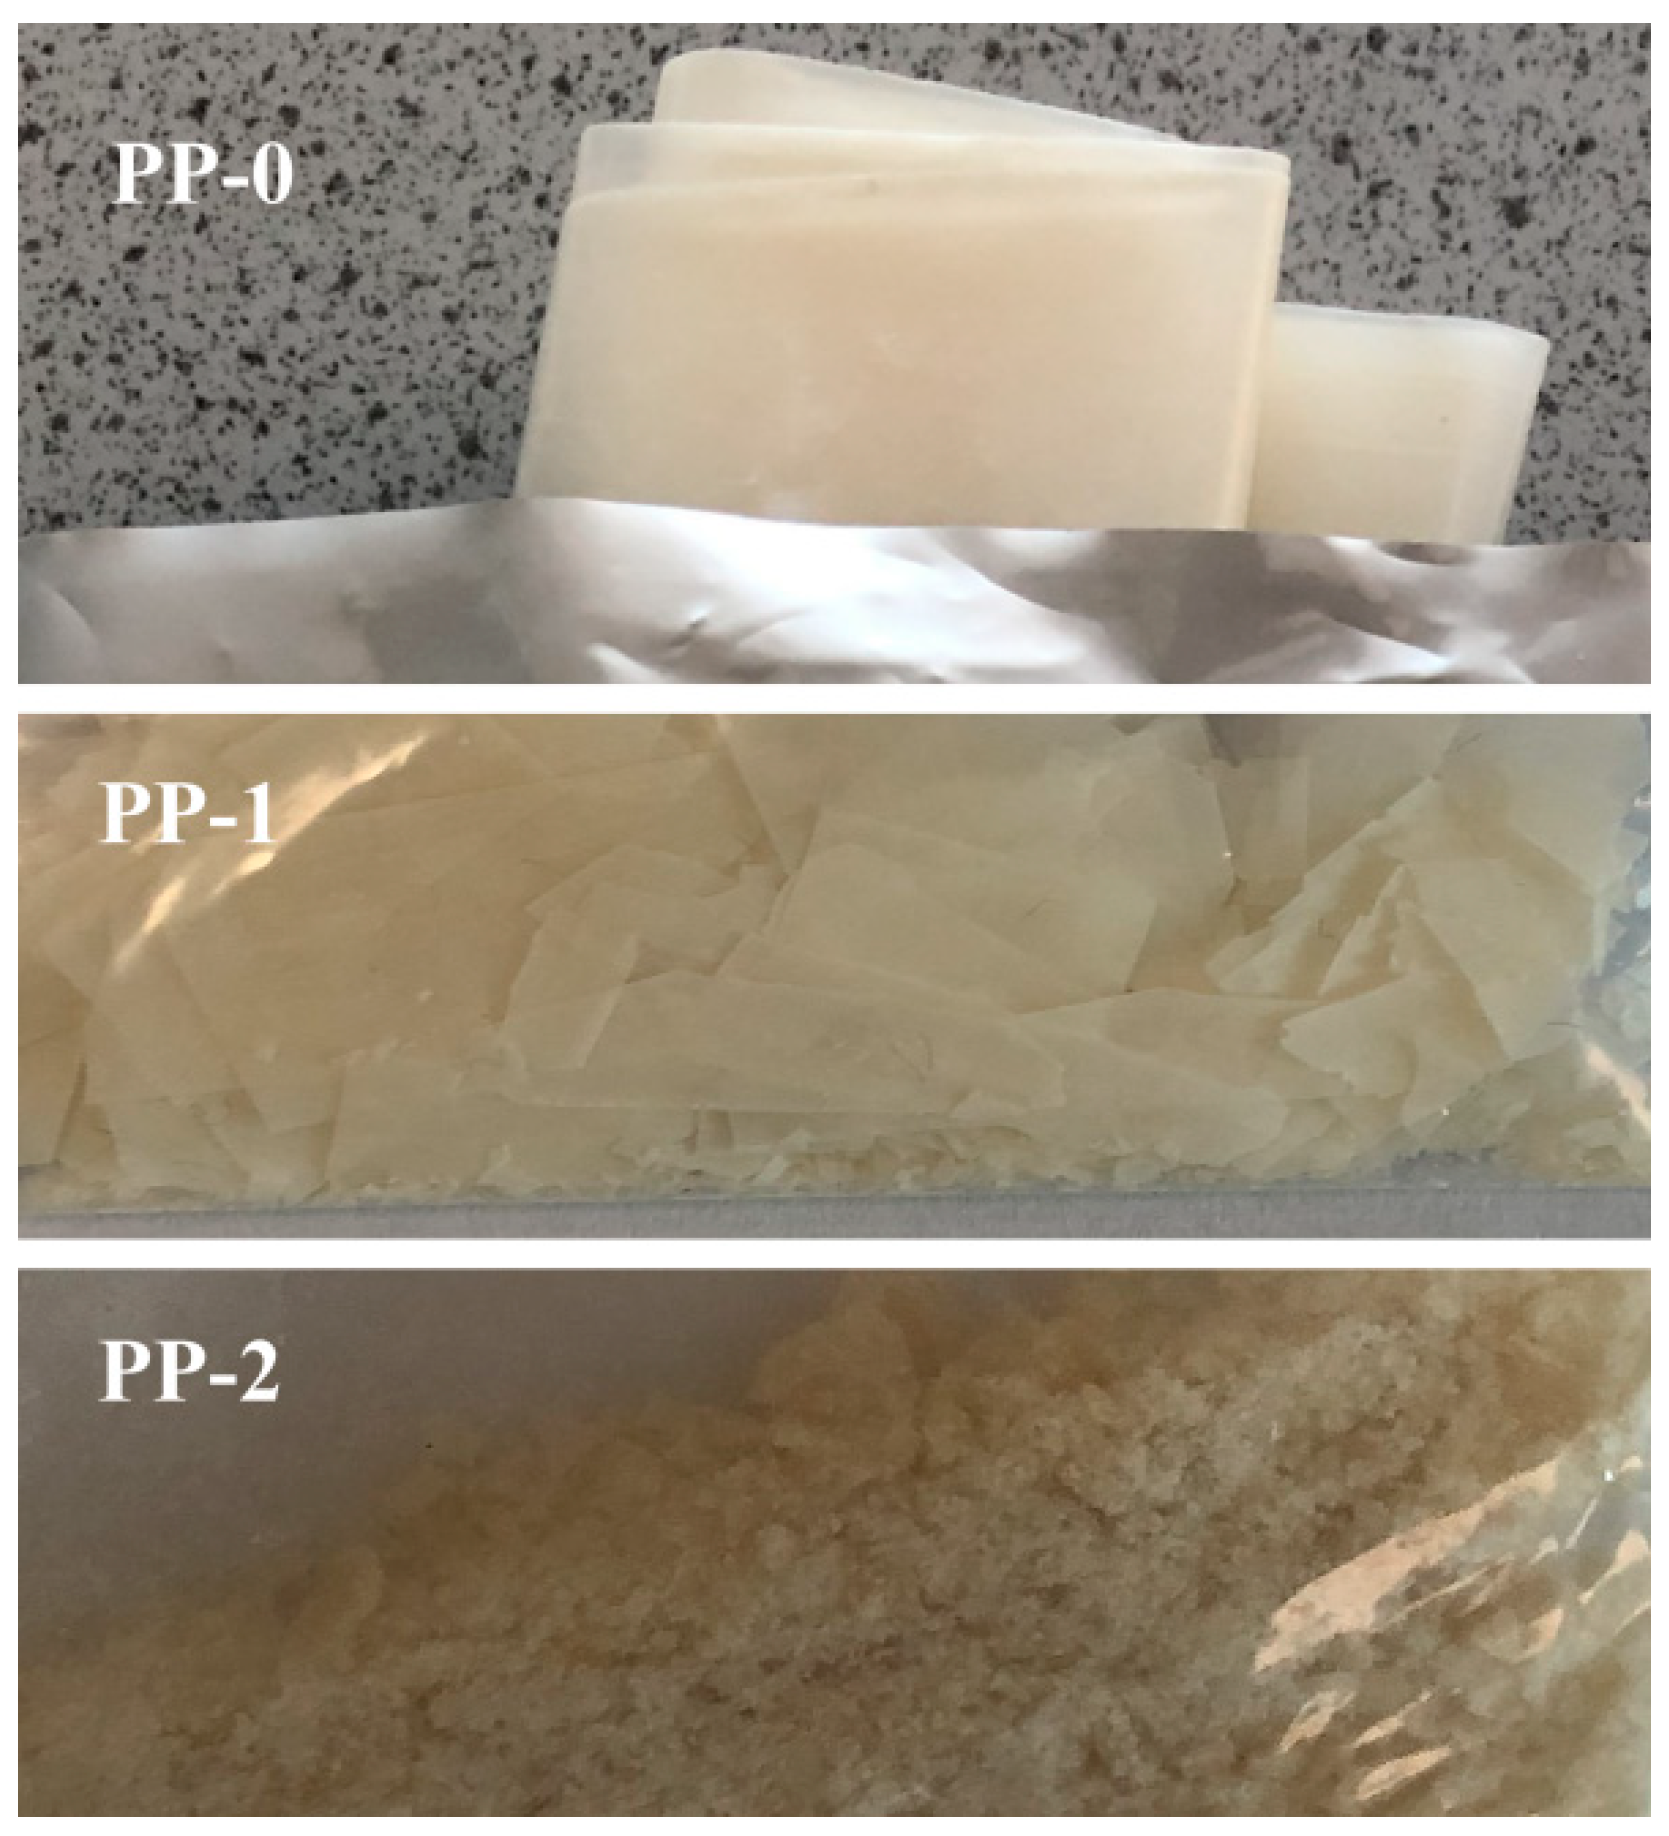
2.1. PP Carbon Source
2.2. Selected Microorganism
2.3. Growth Media and Chemicals
2.4. Shake Flask Procedure
2.5. PHA Extraction Method
2.6. Characterization Methods
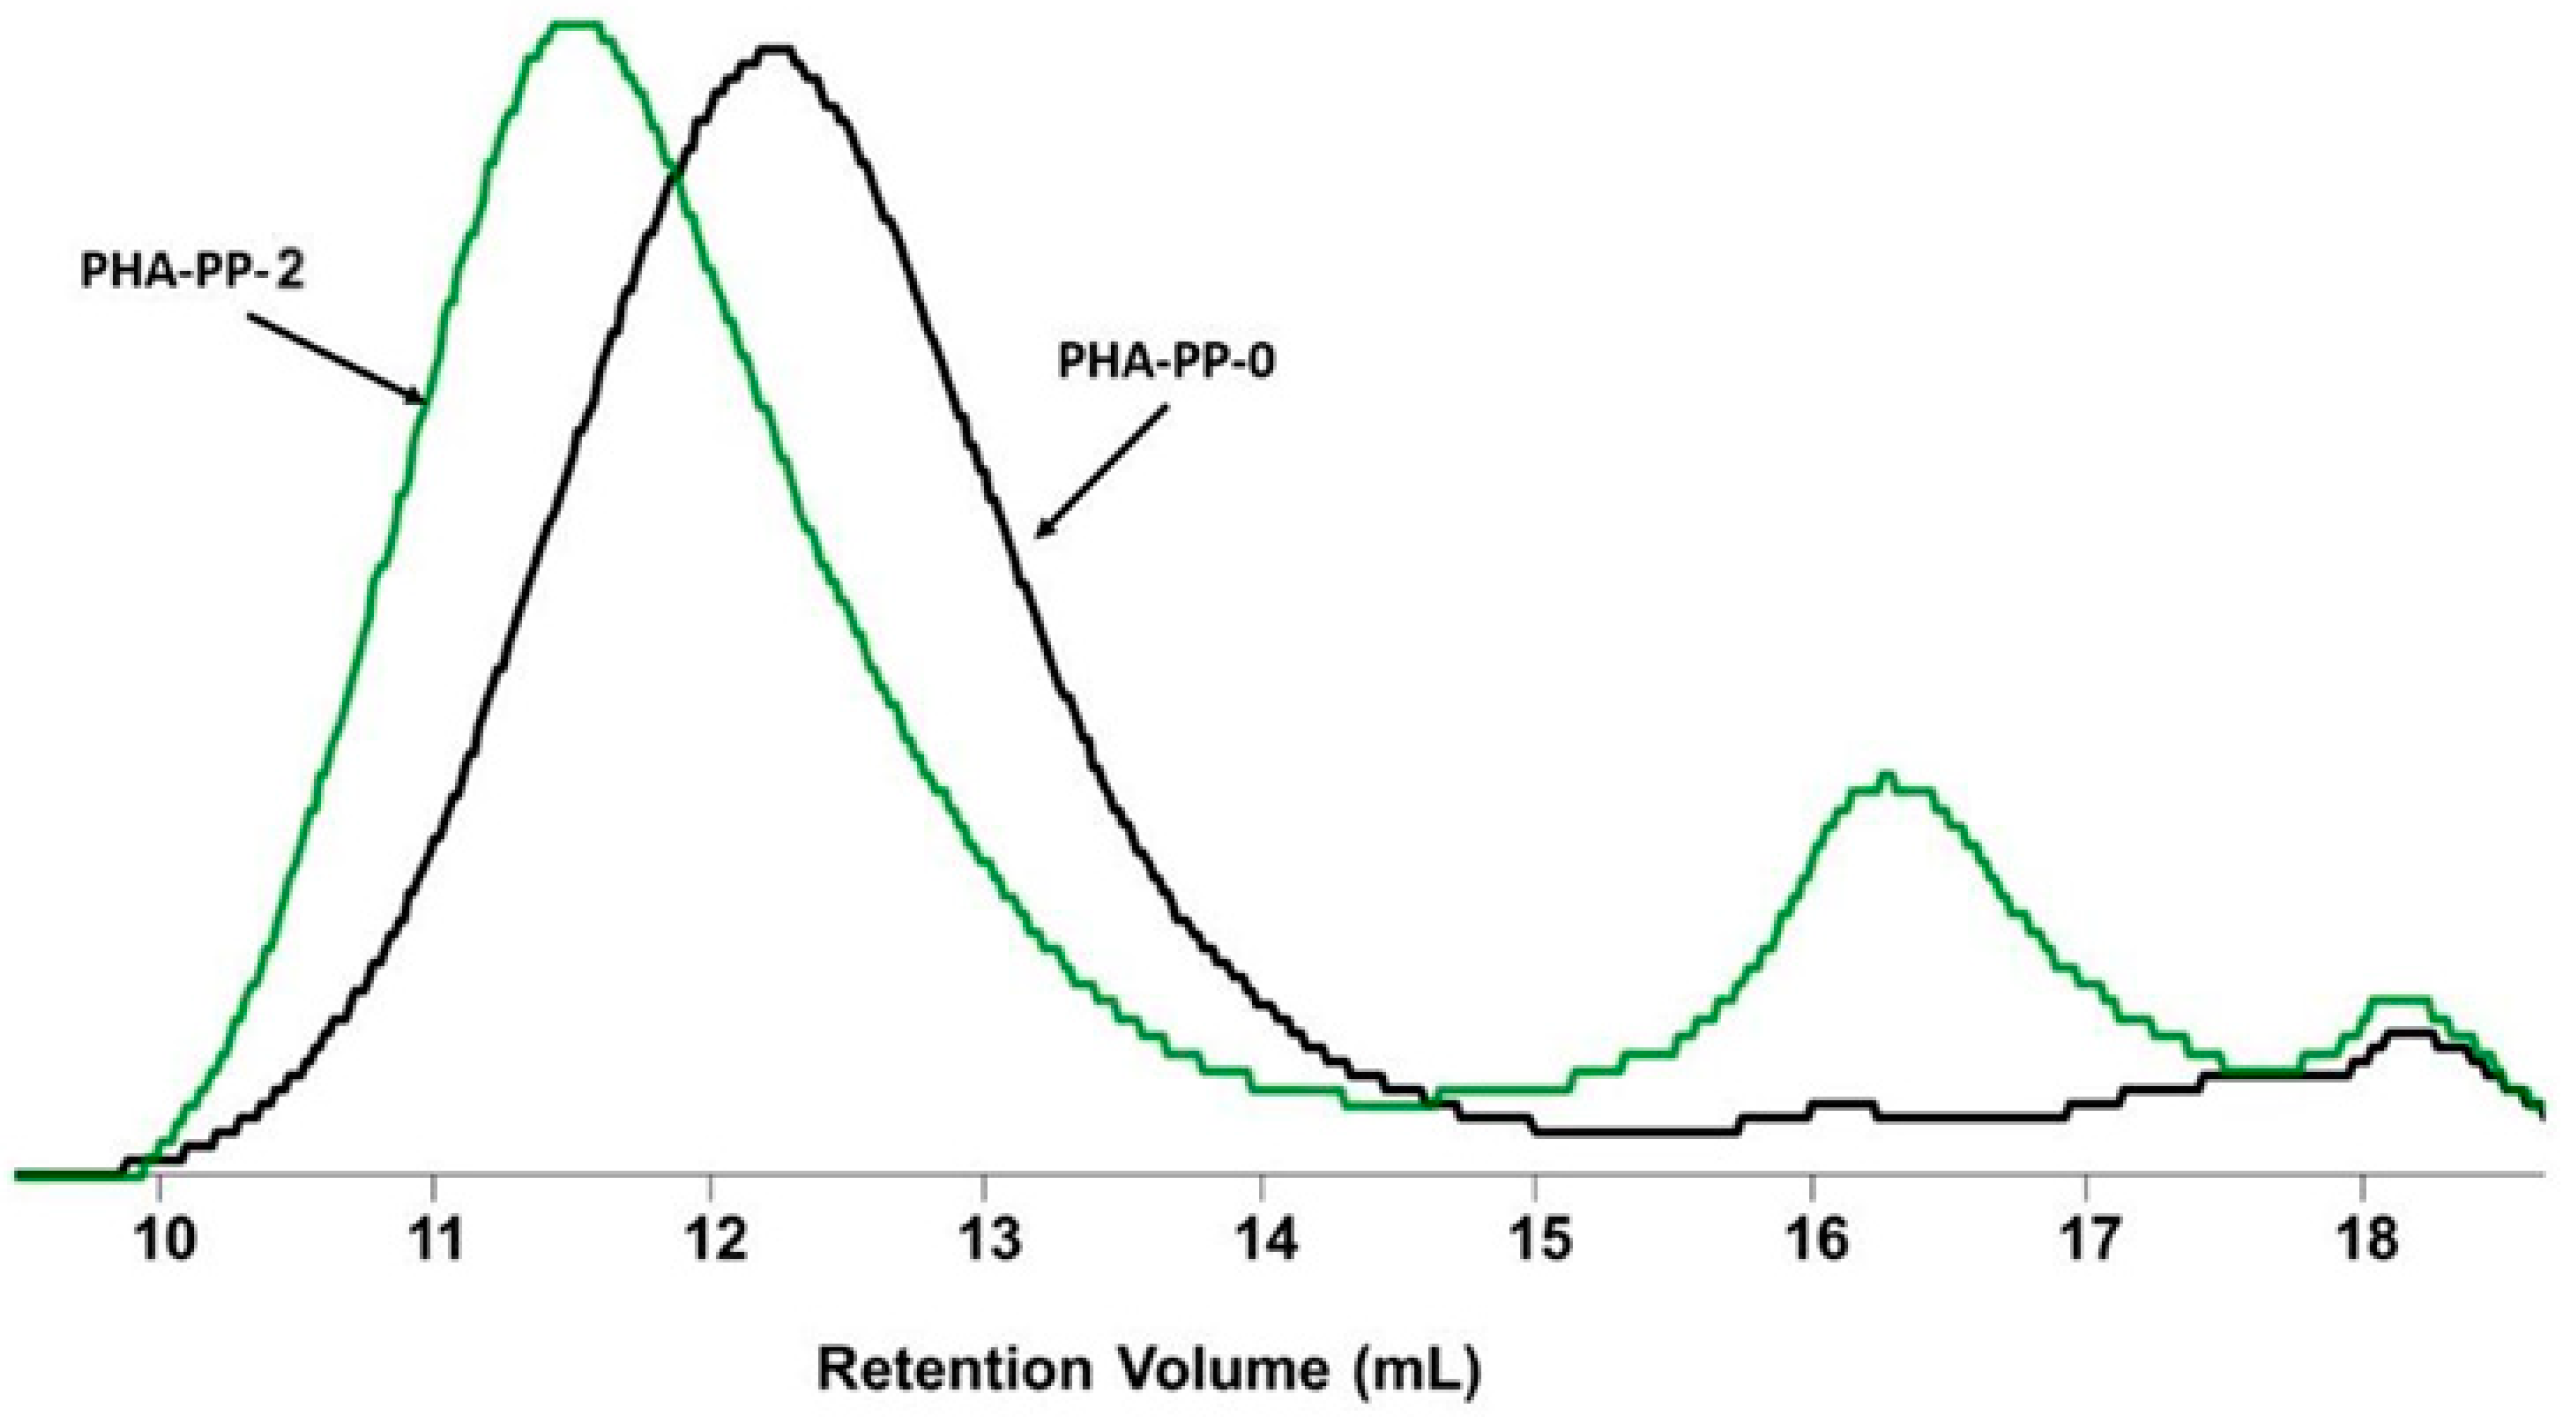
2.6.1. GPC Analysis
2.6.2. FTIR Analysis
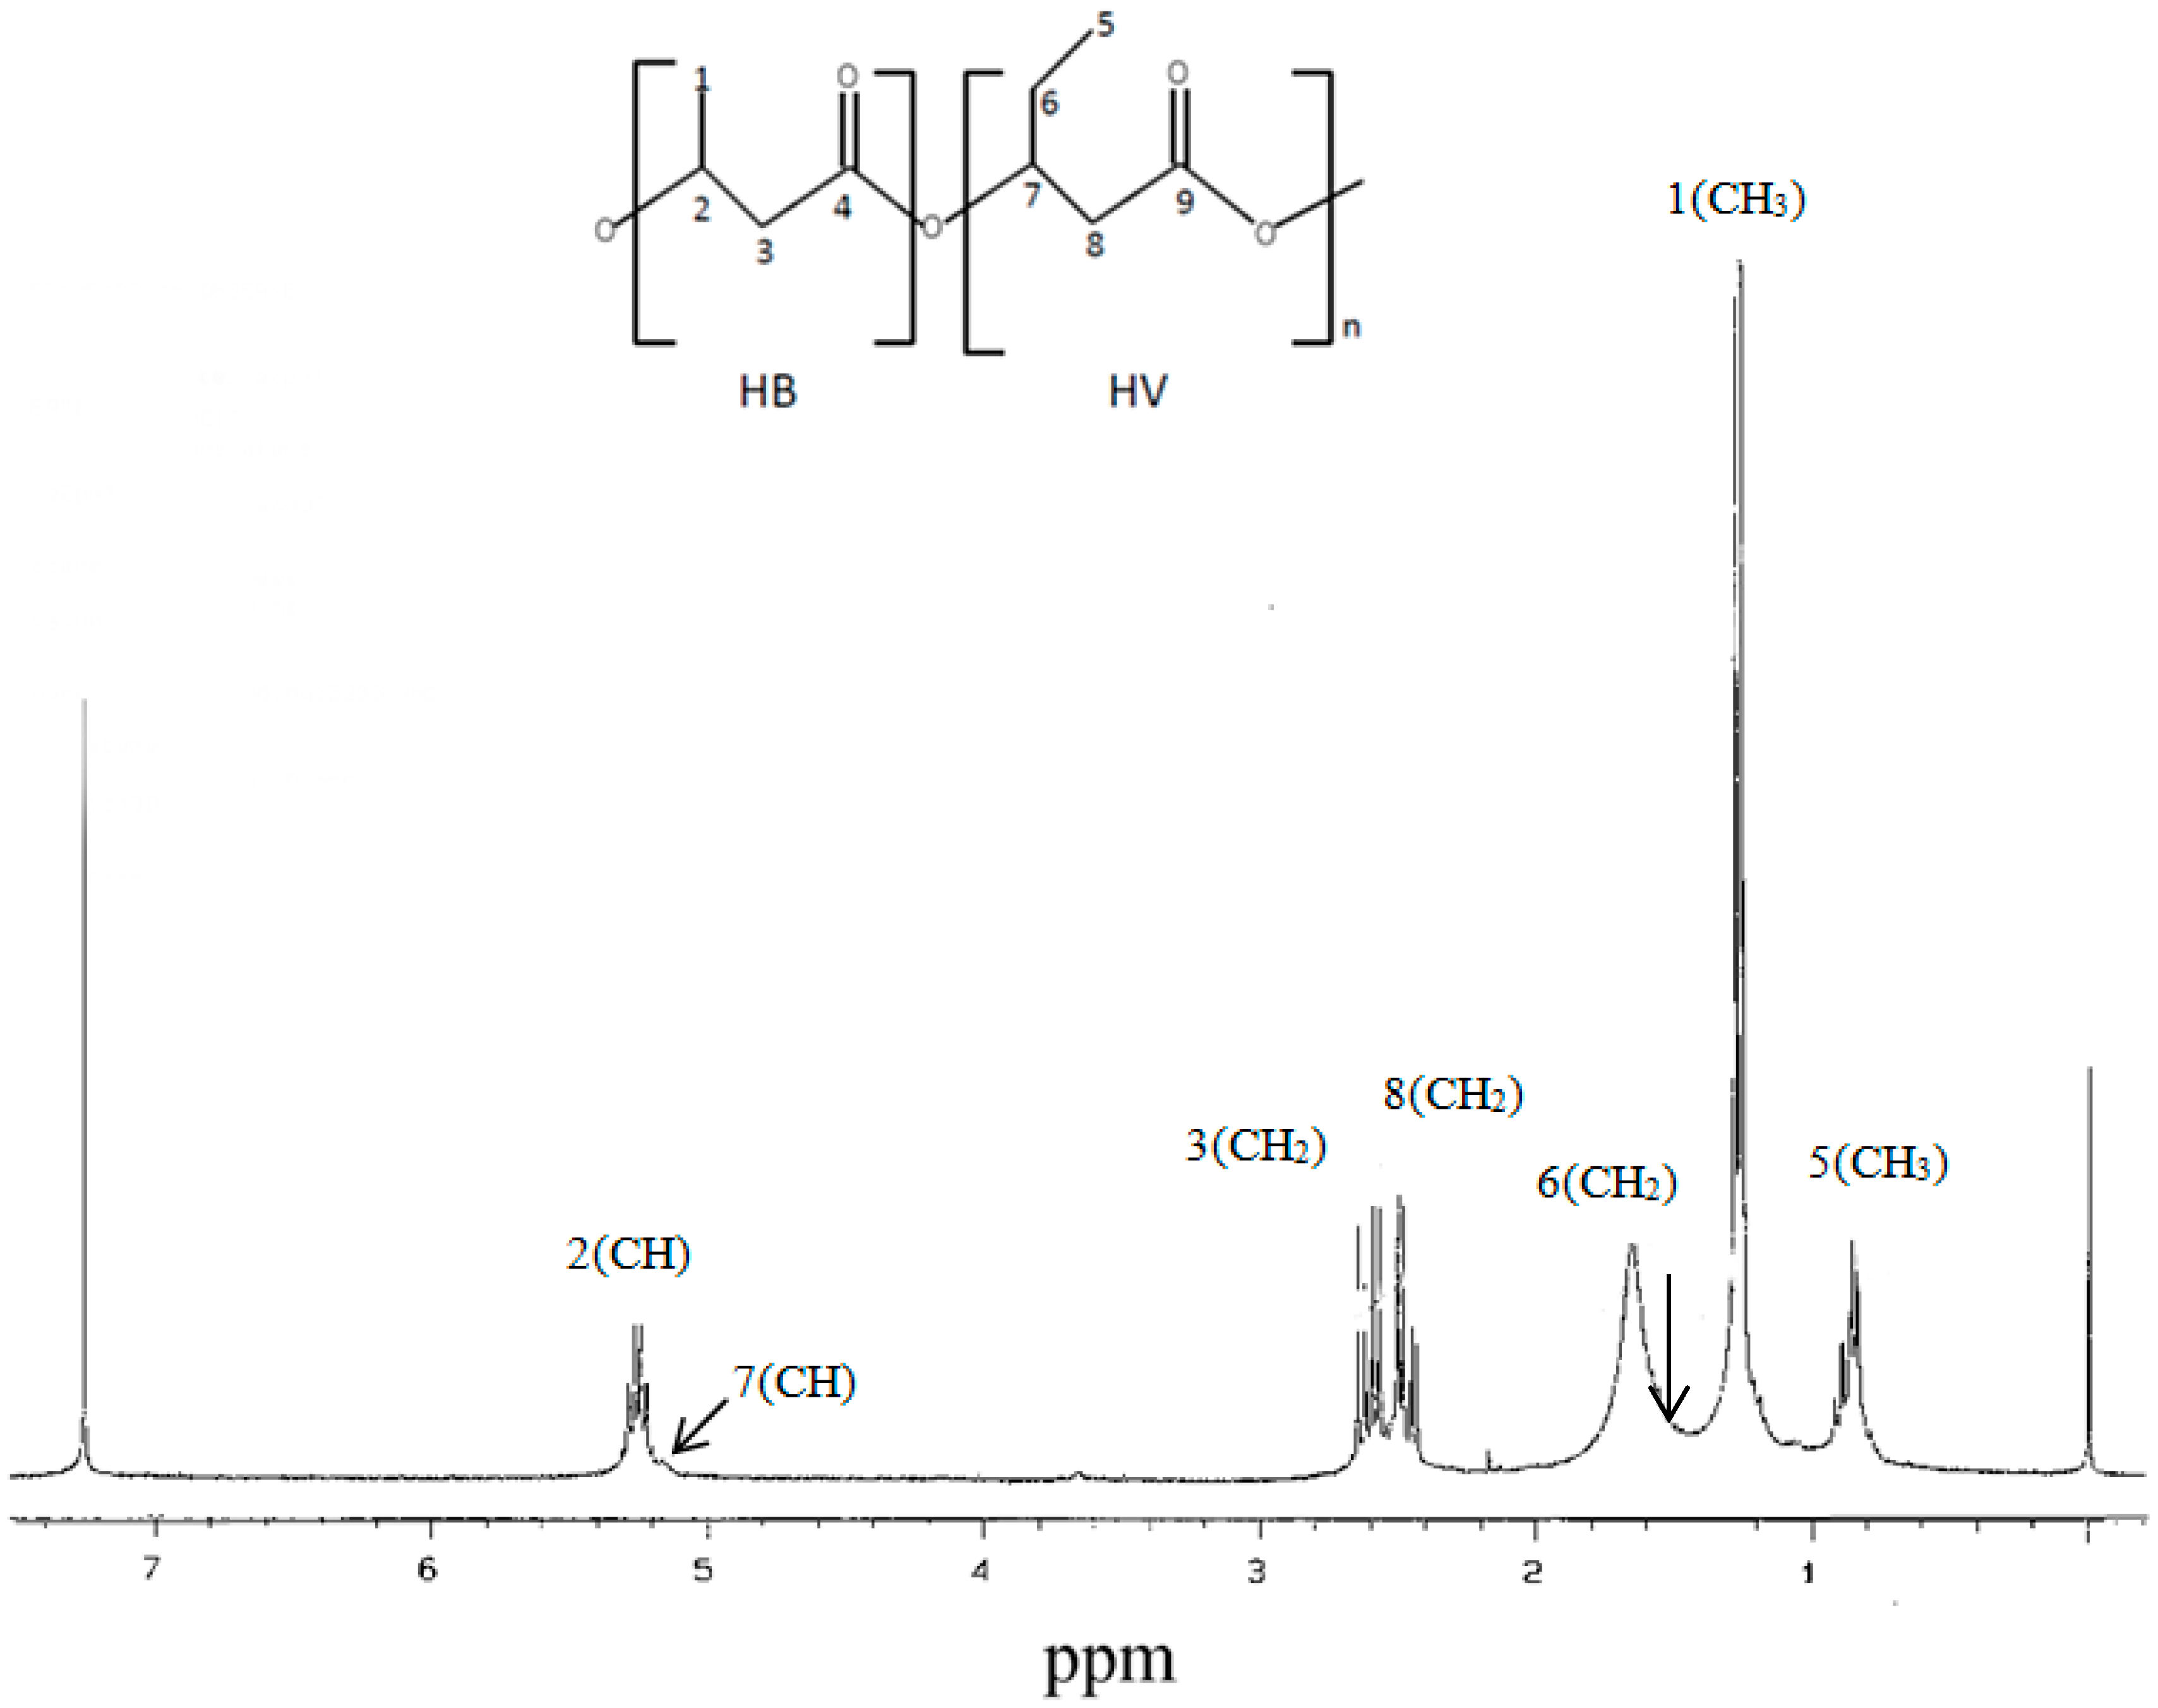
2.6.3. NMR Analysis
2.6.4. TGA Characterization
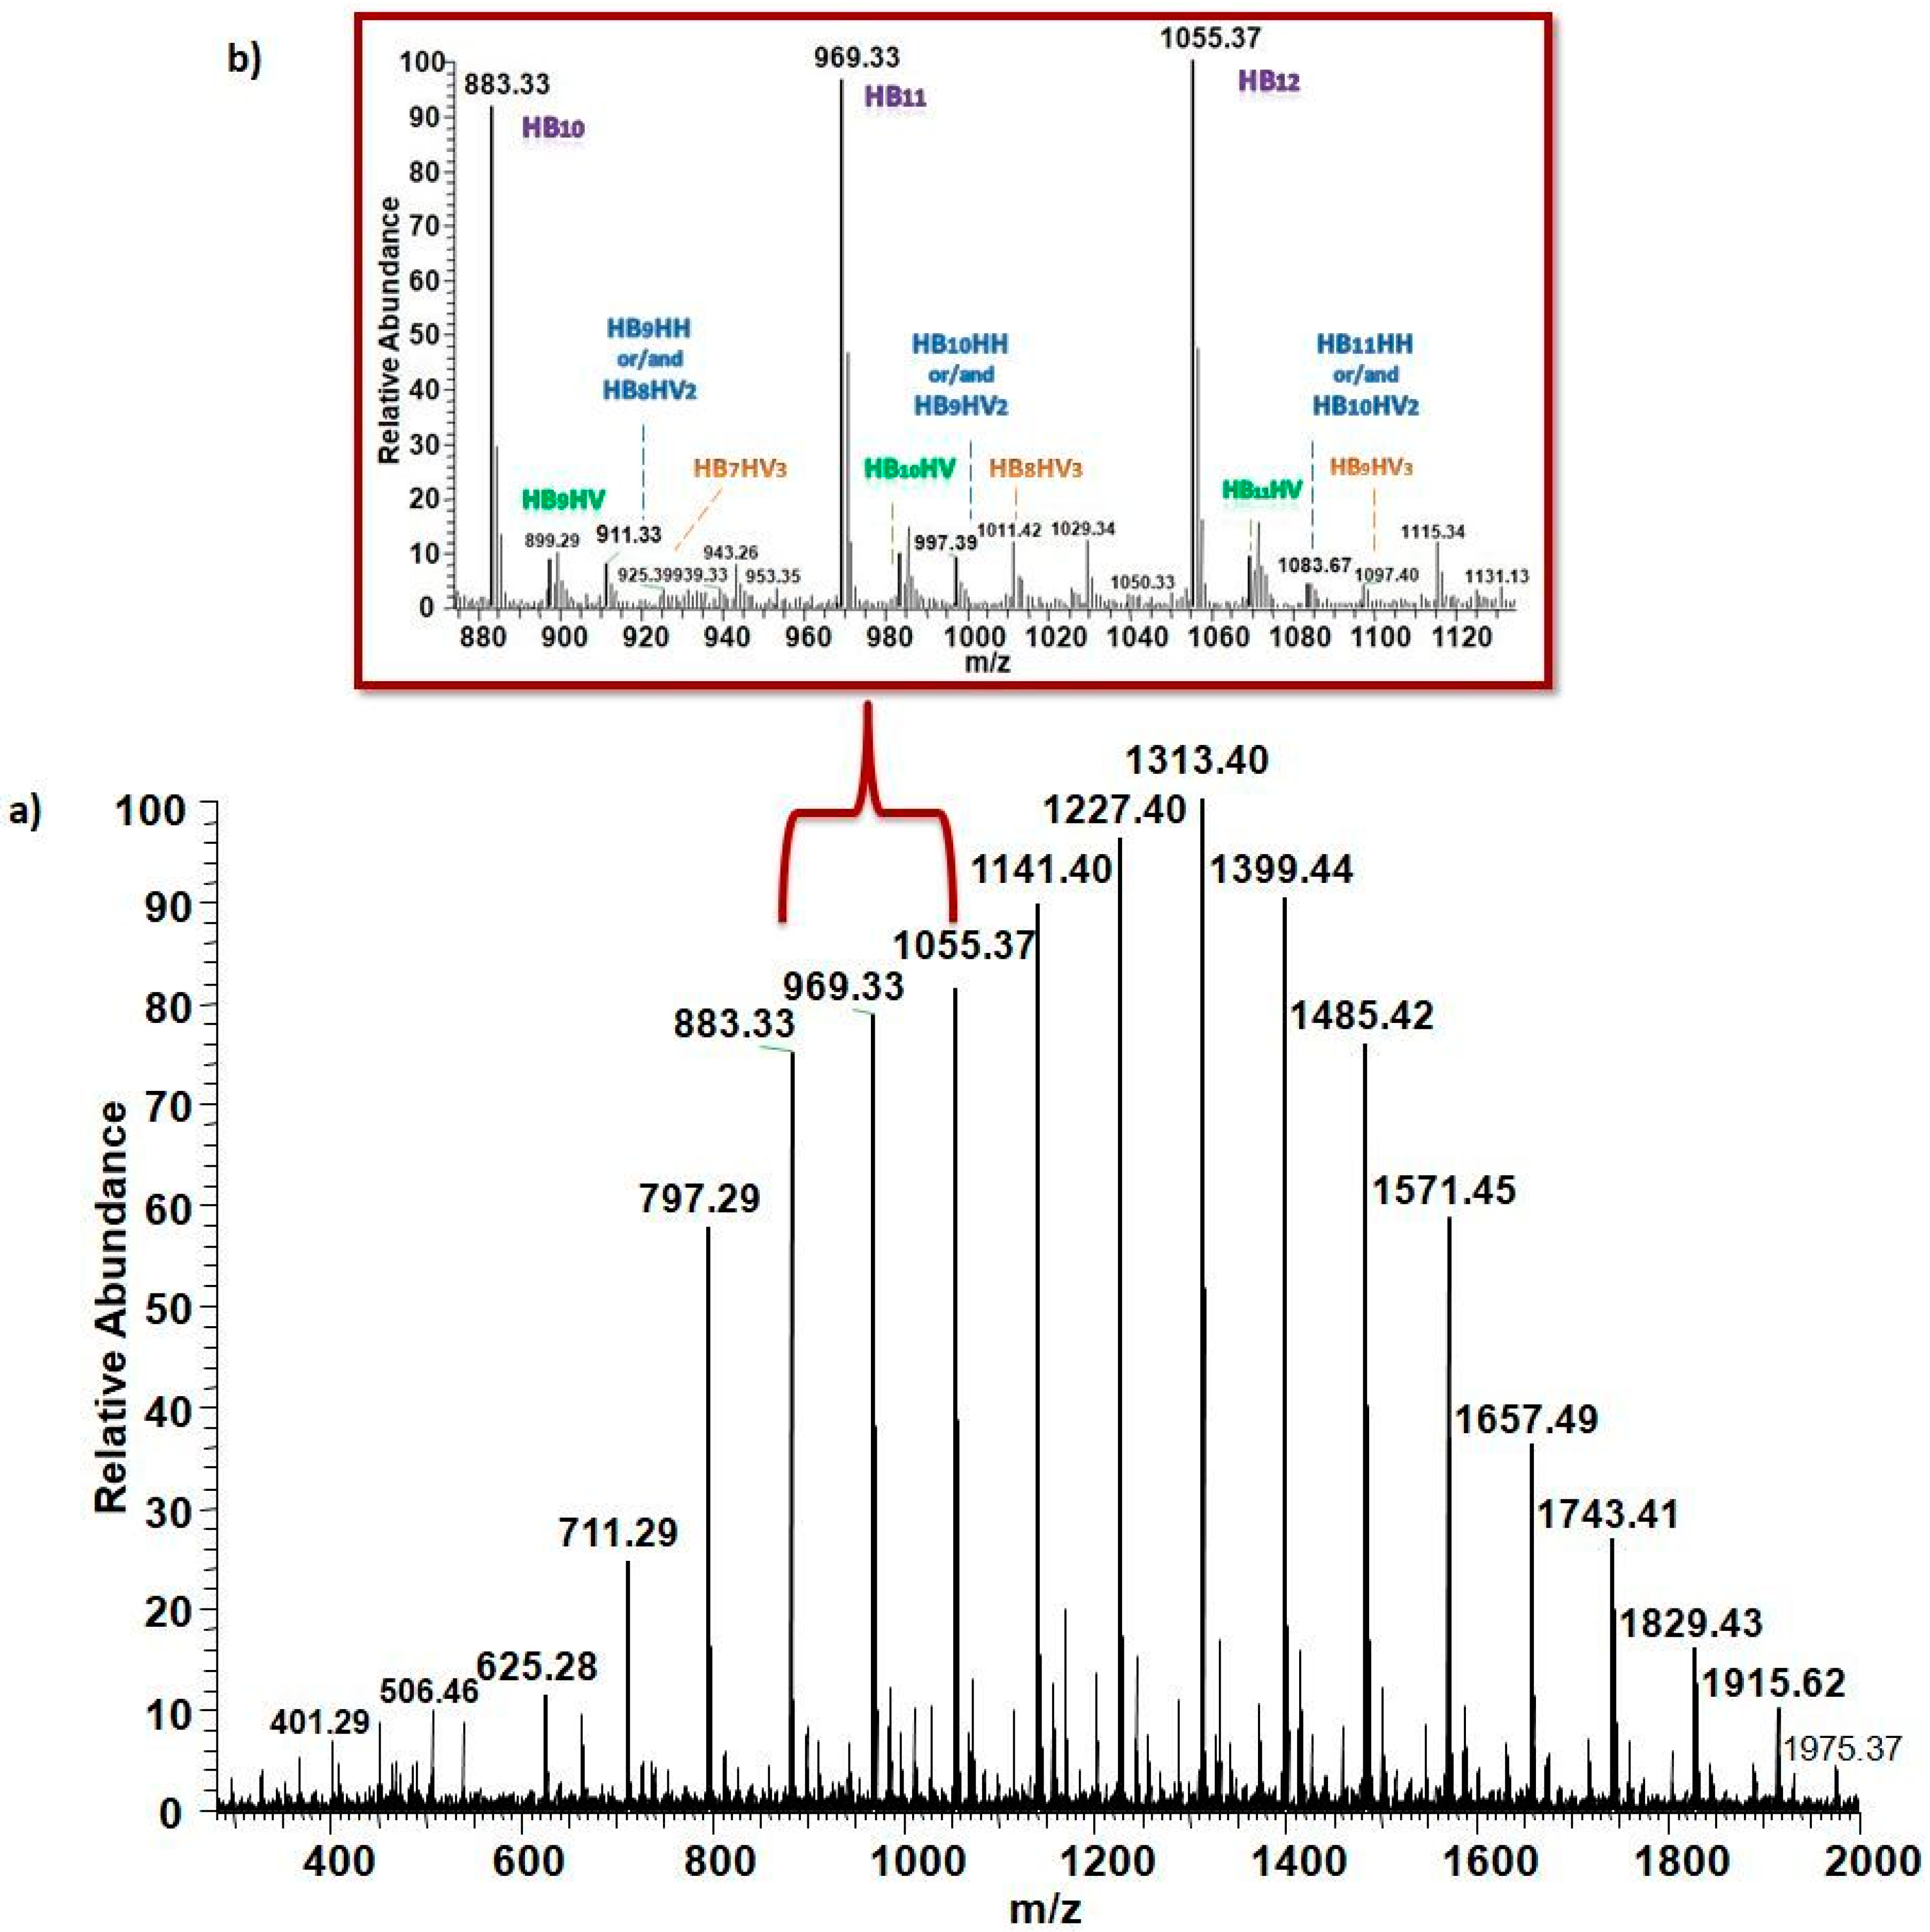
2.6.5. PHA Characterization at the Molecular Level by ESI-MS/MS
3. Results
3.1. Characterization of PP Carbon Source - Acid Number (AN)
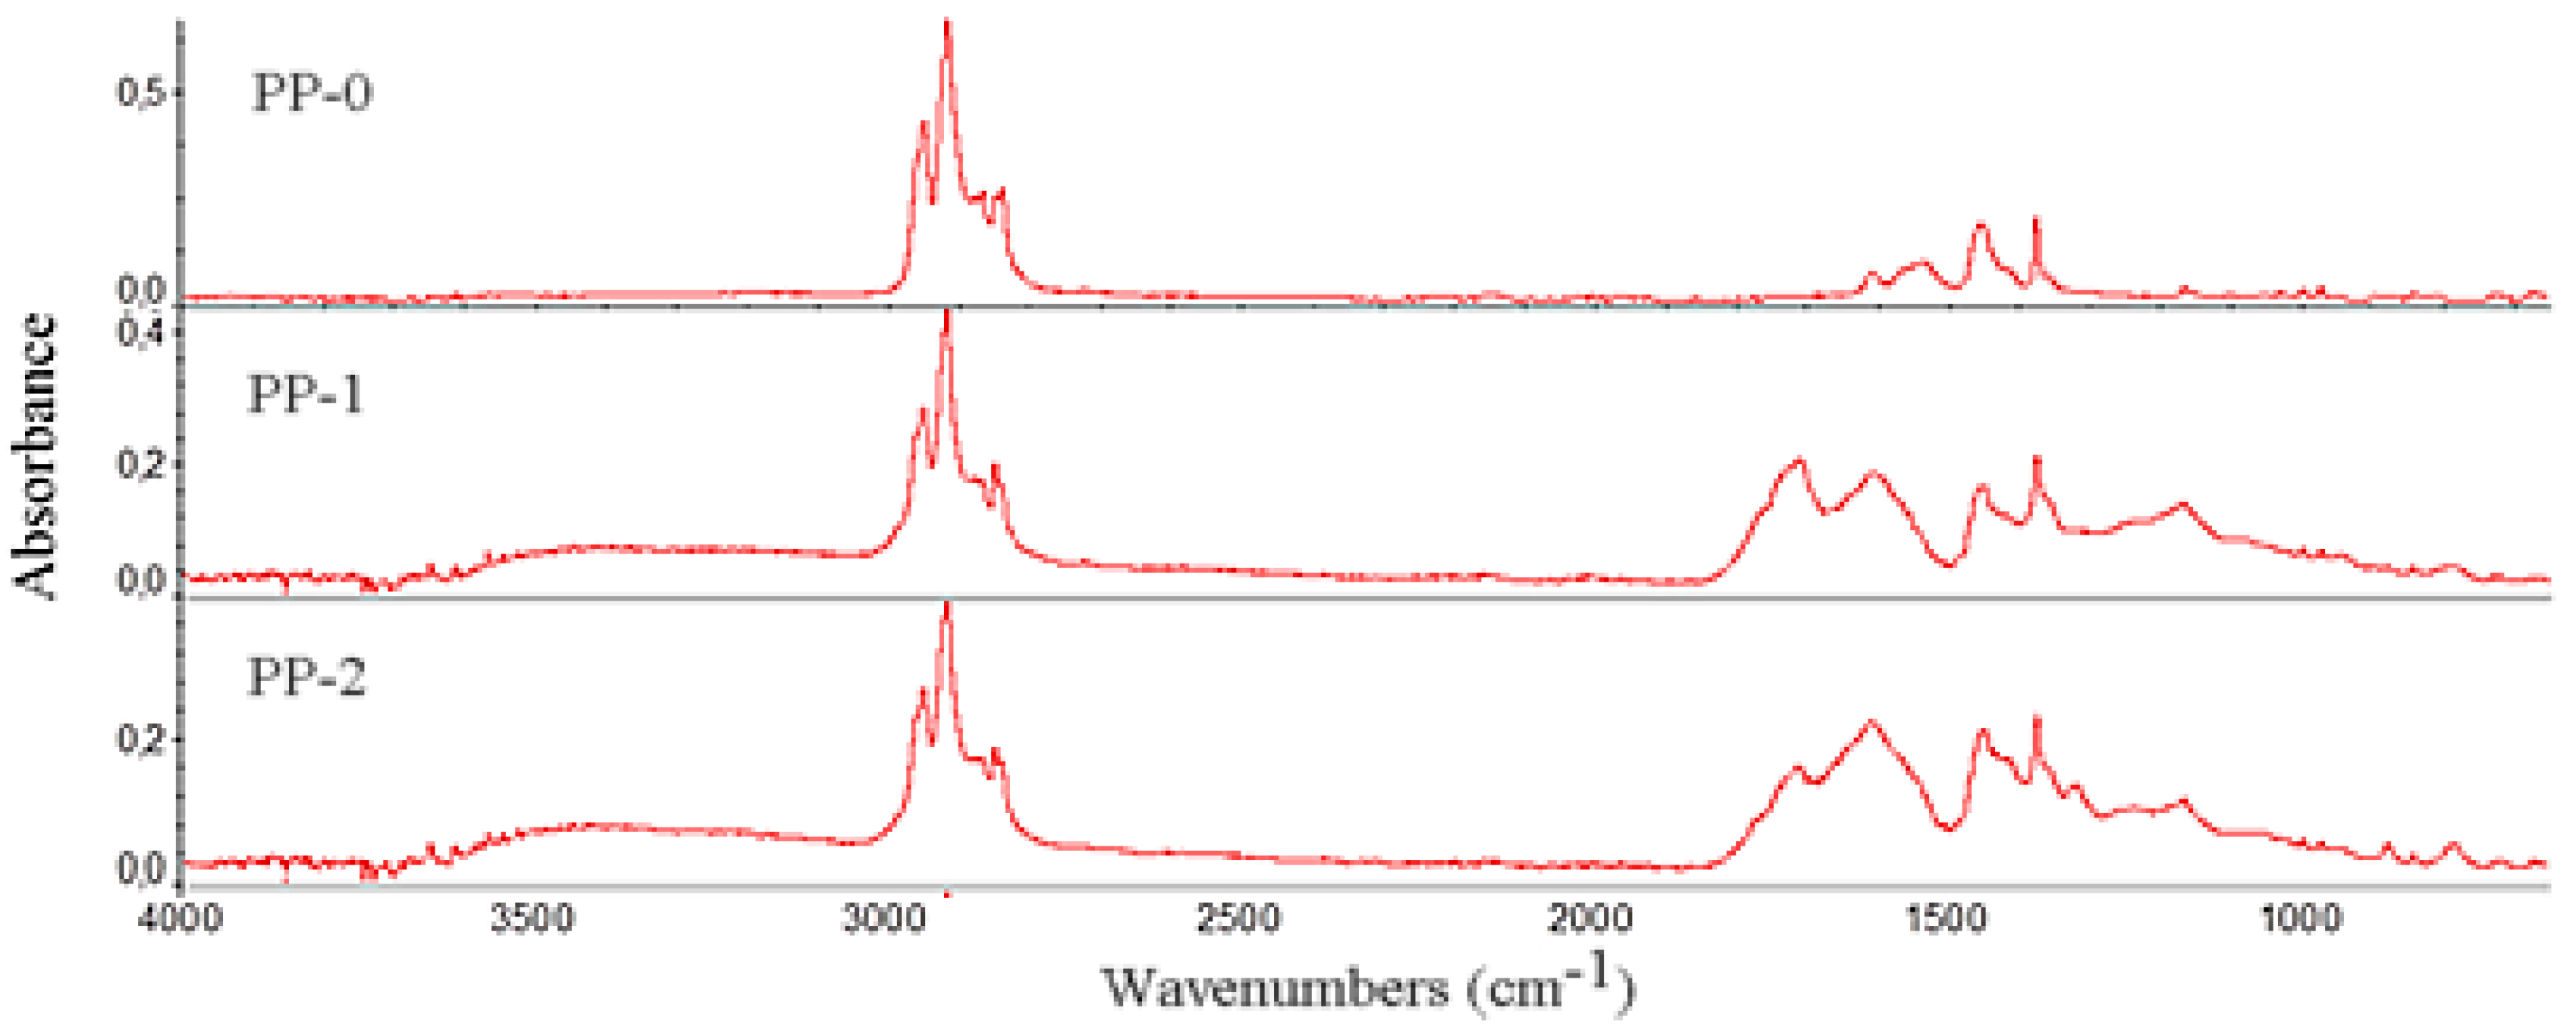
3.2. FTIR Analysis of PP Carbon Sources
3.3. GPC Analysis of the PP Carbon Sources
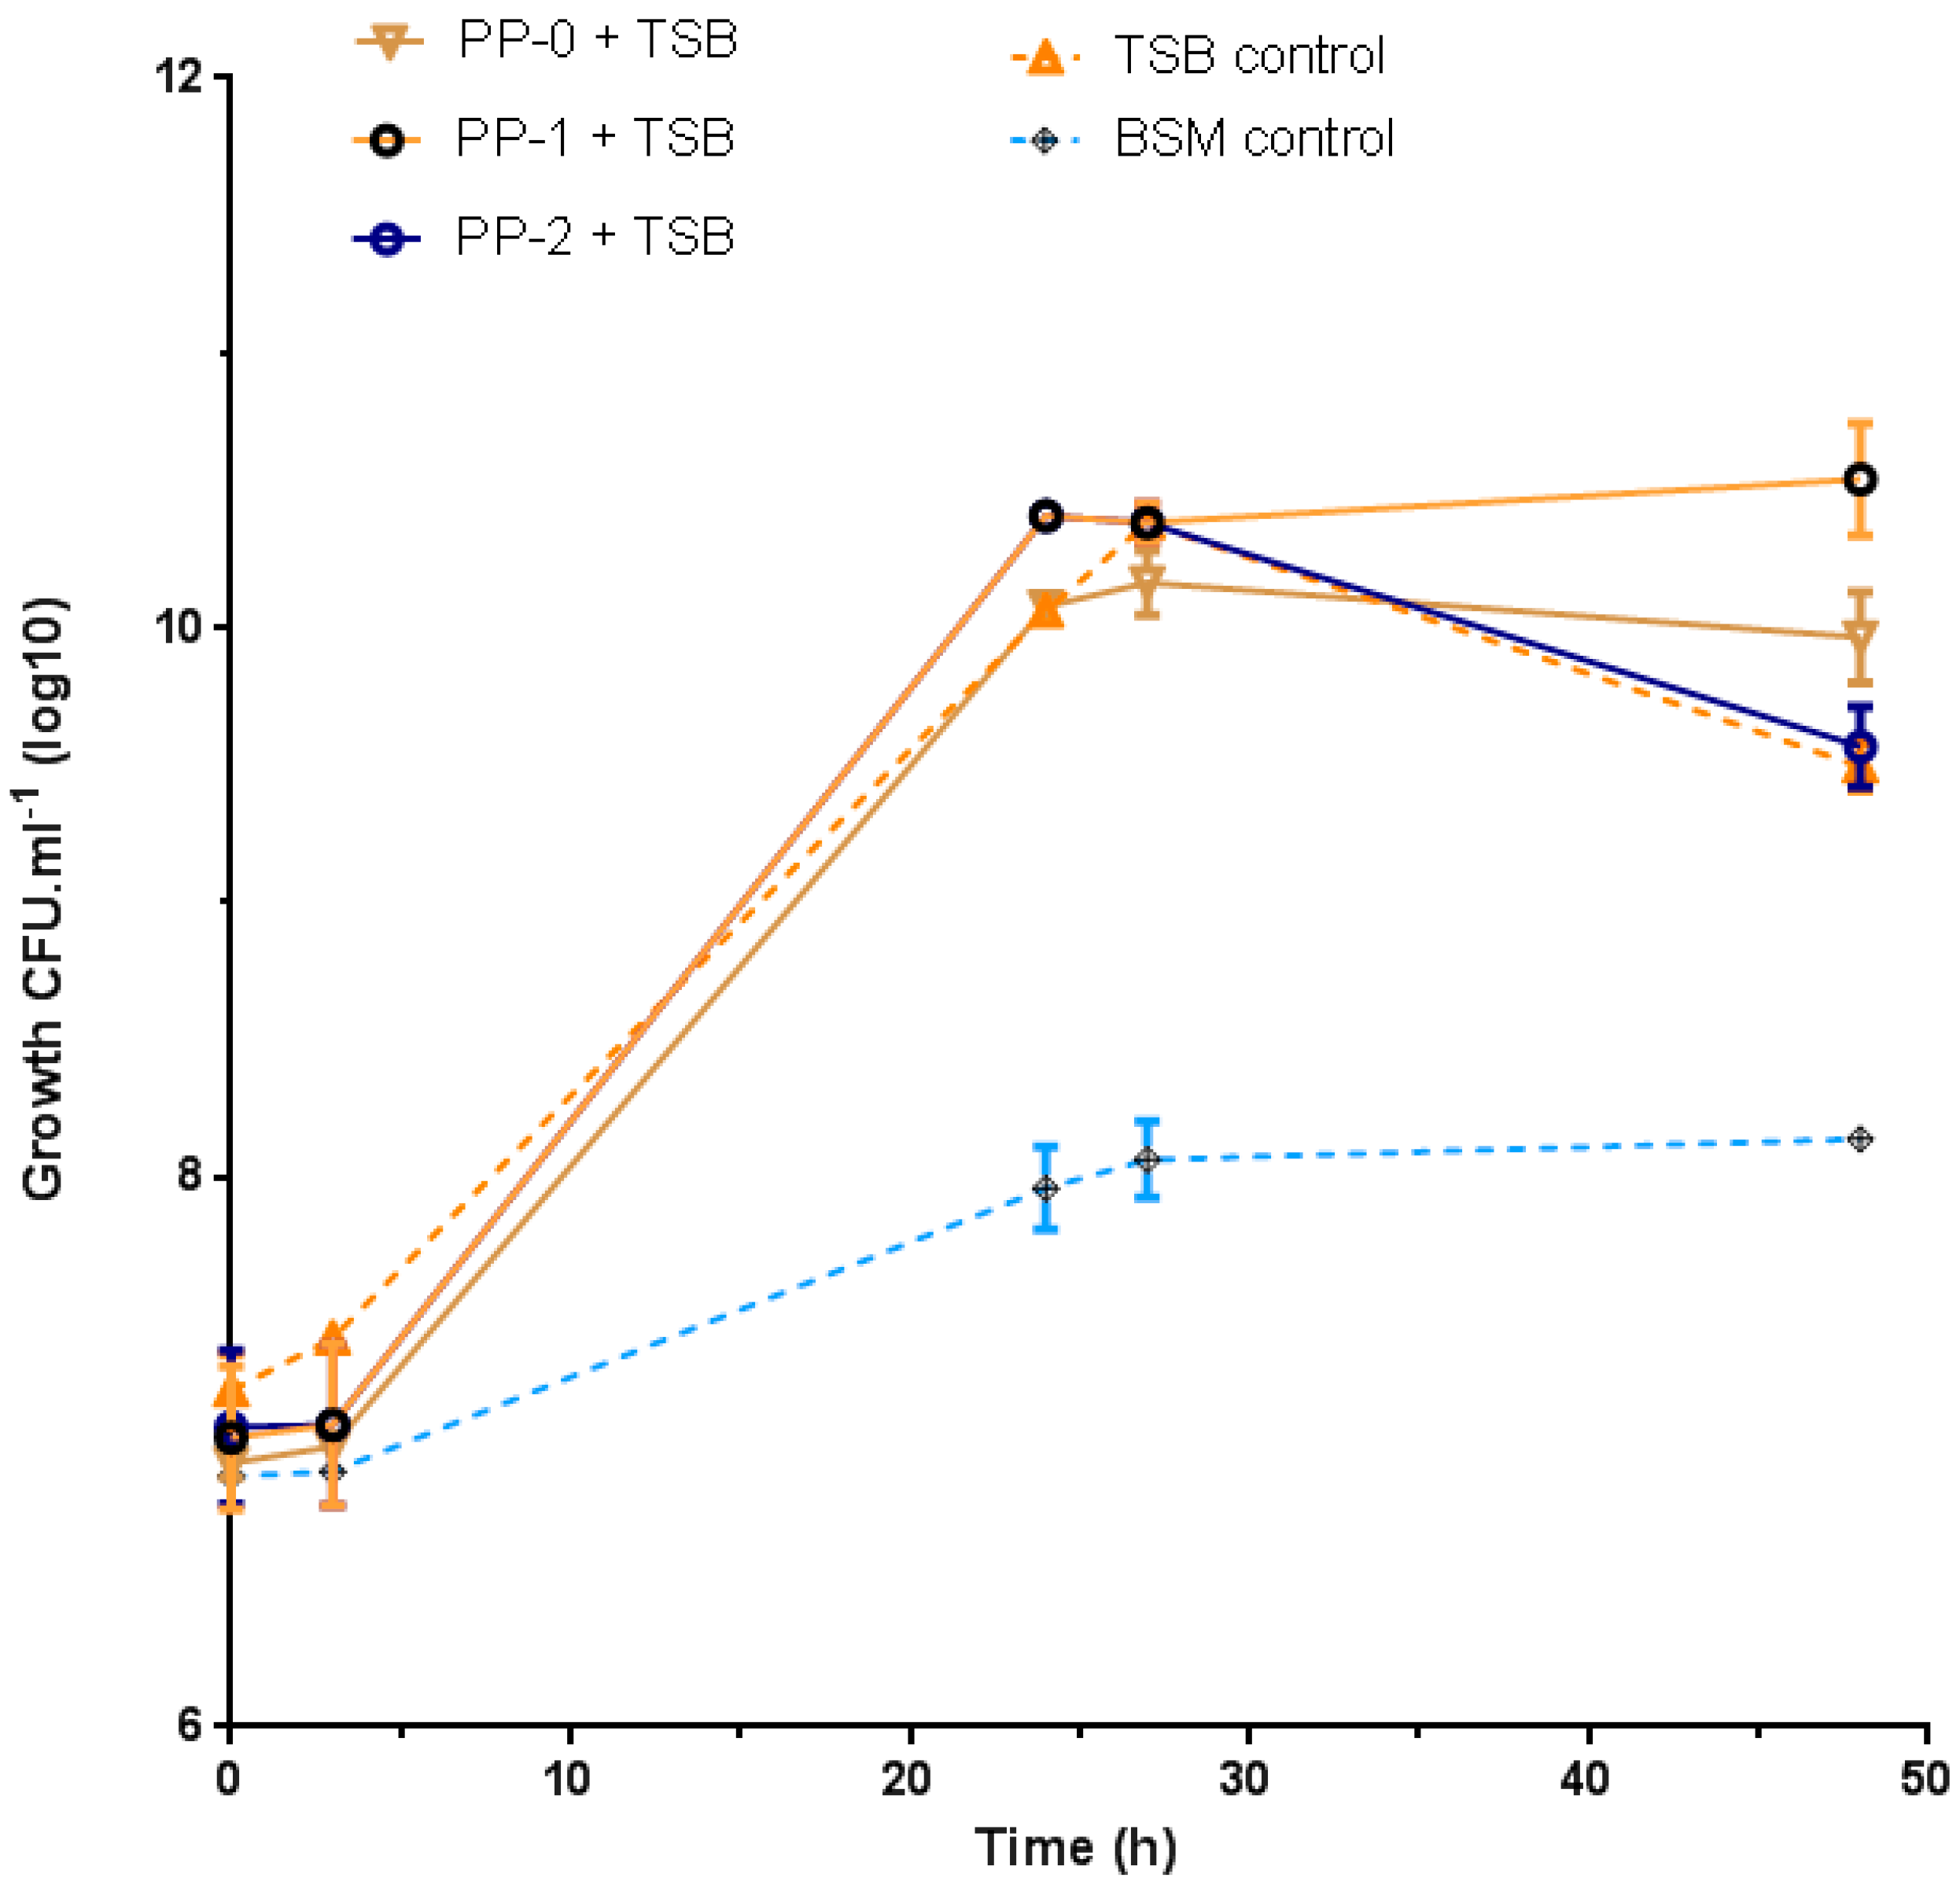
3.4. Bacteria Growth
3.5. PHA Identification and Characterization
3.5.1. NMR, FTIR, GPC, and Thermal Analysis of PHA
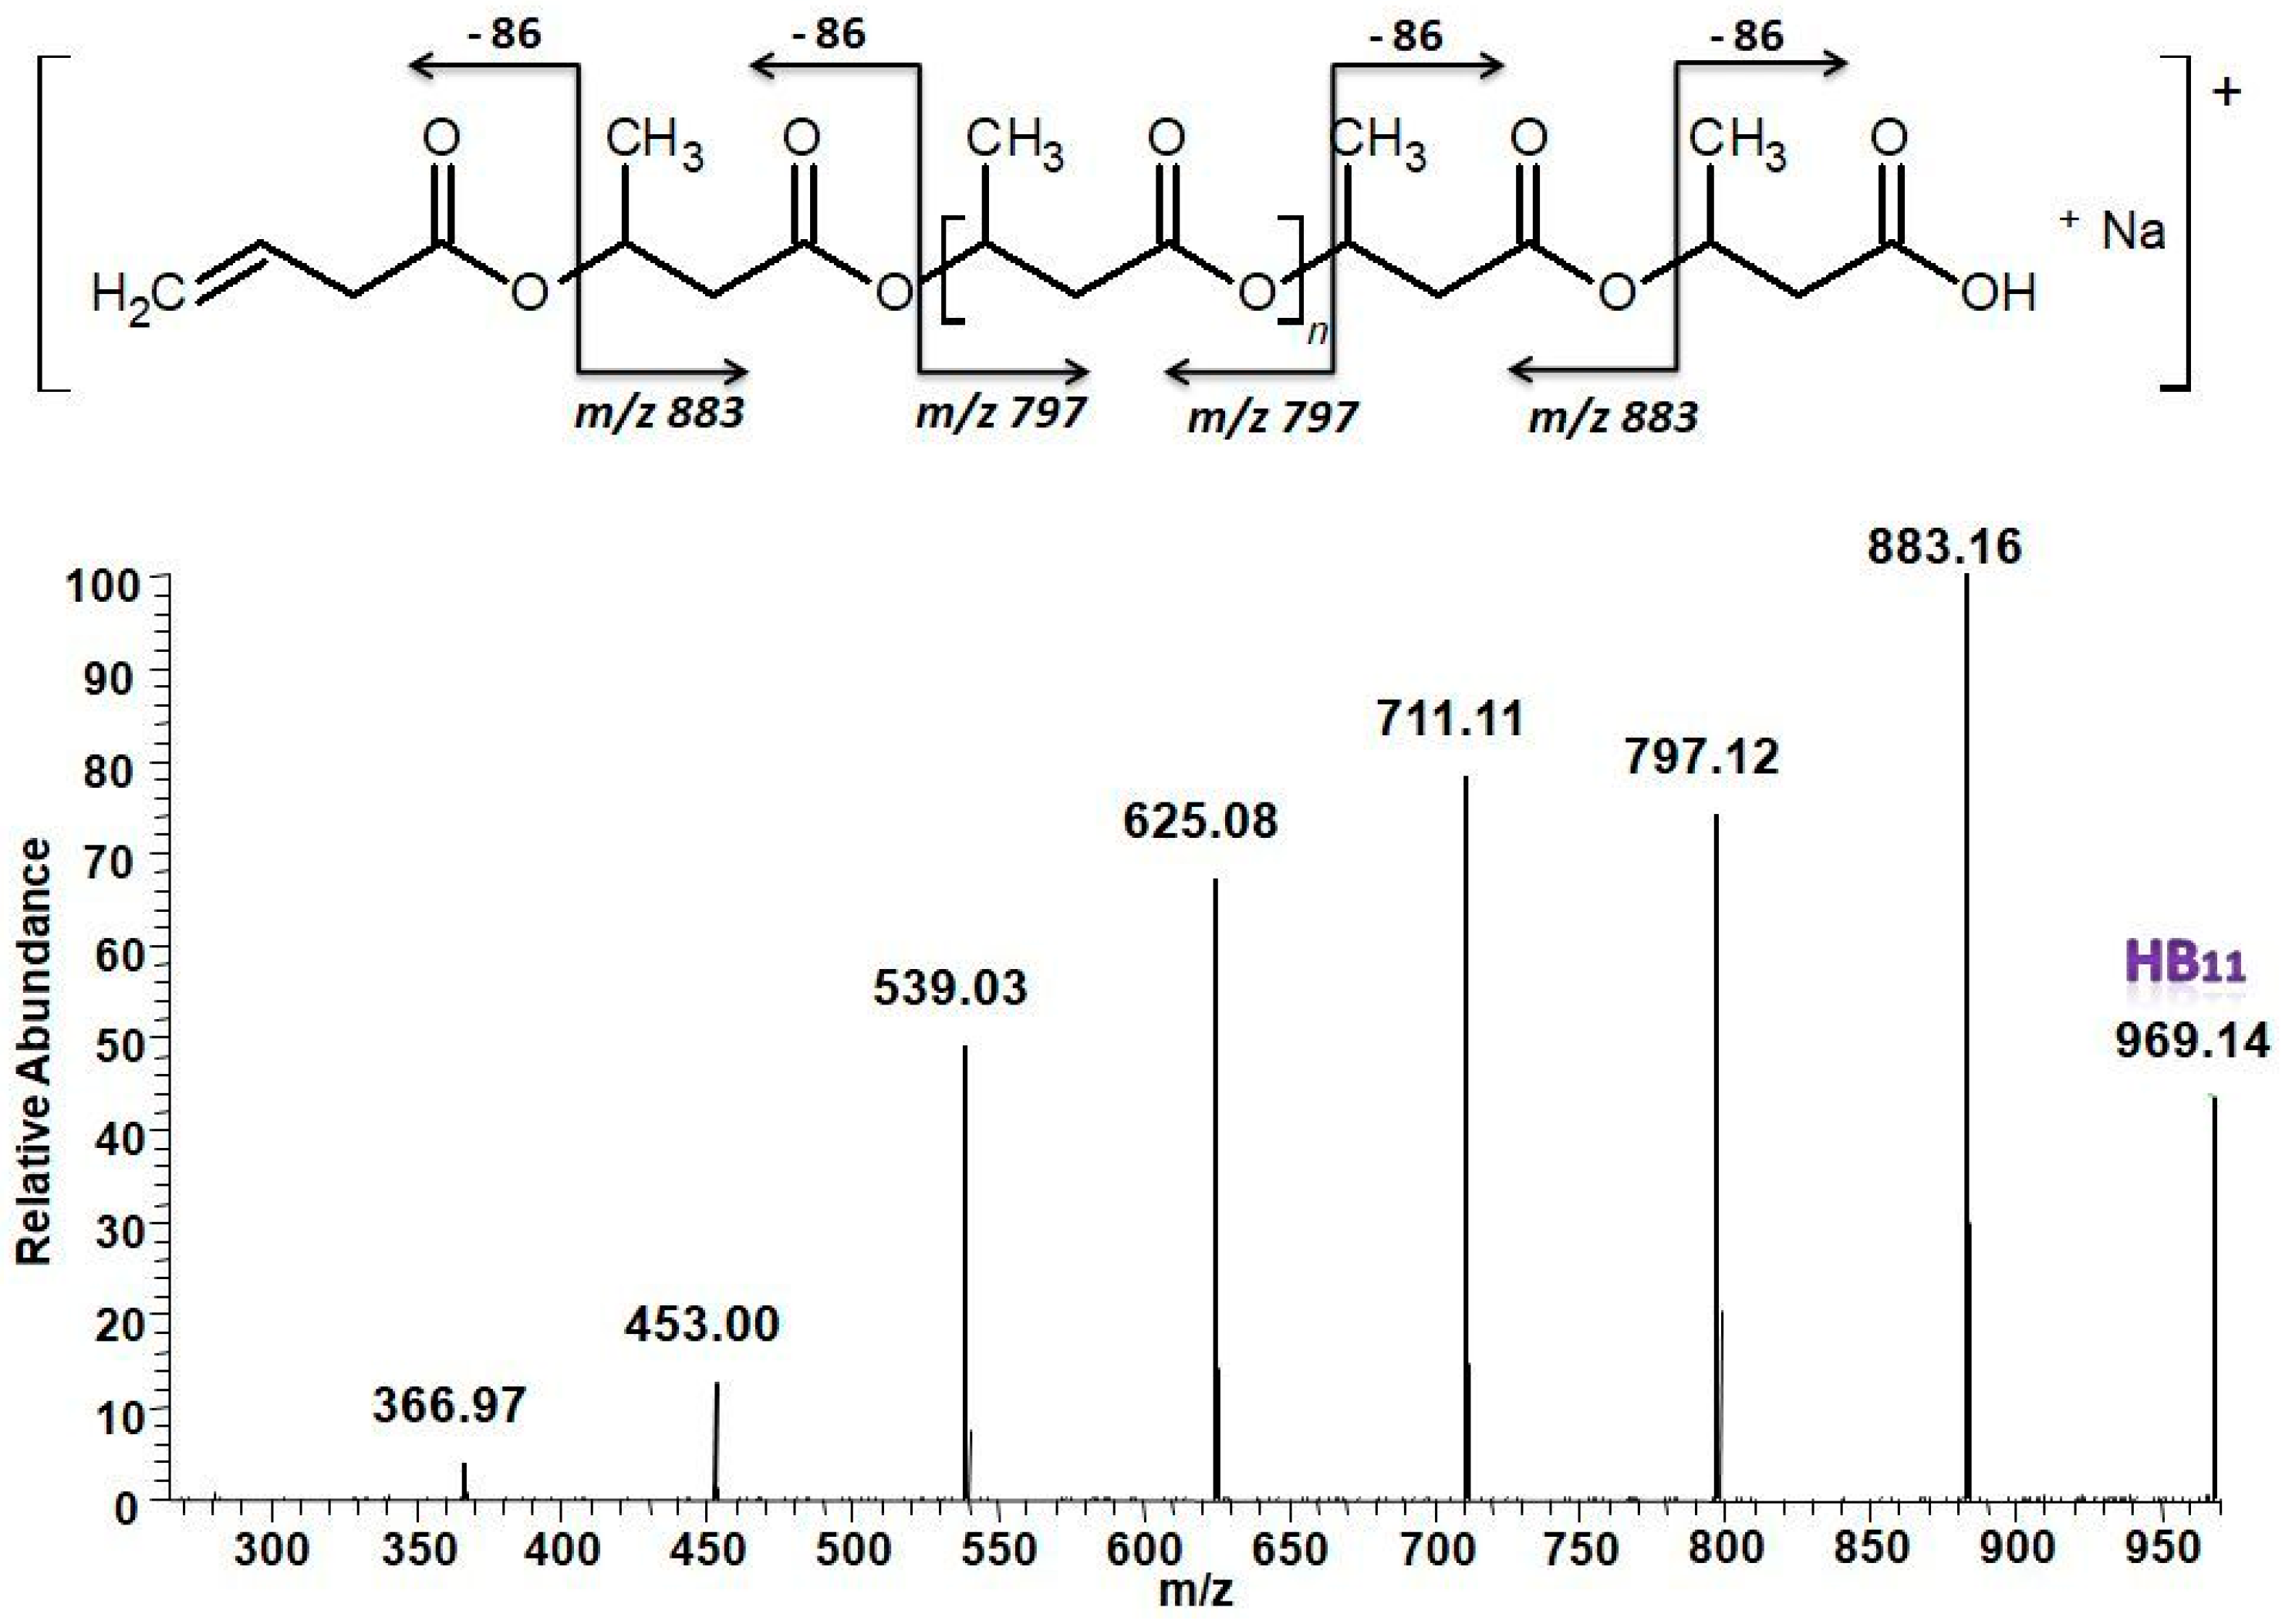
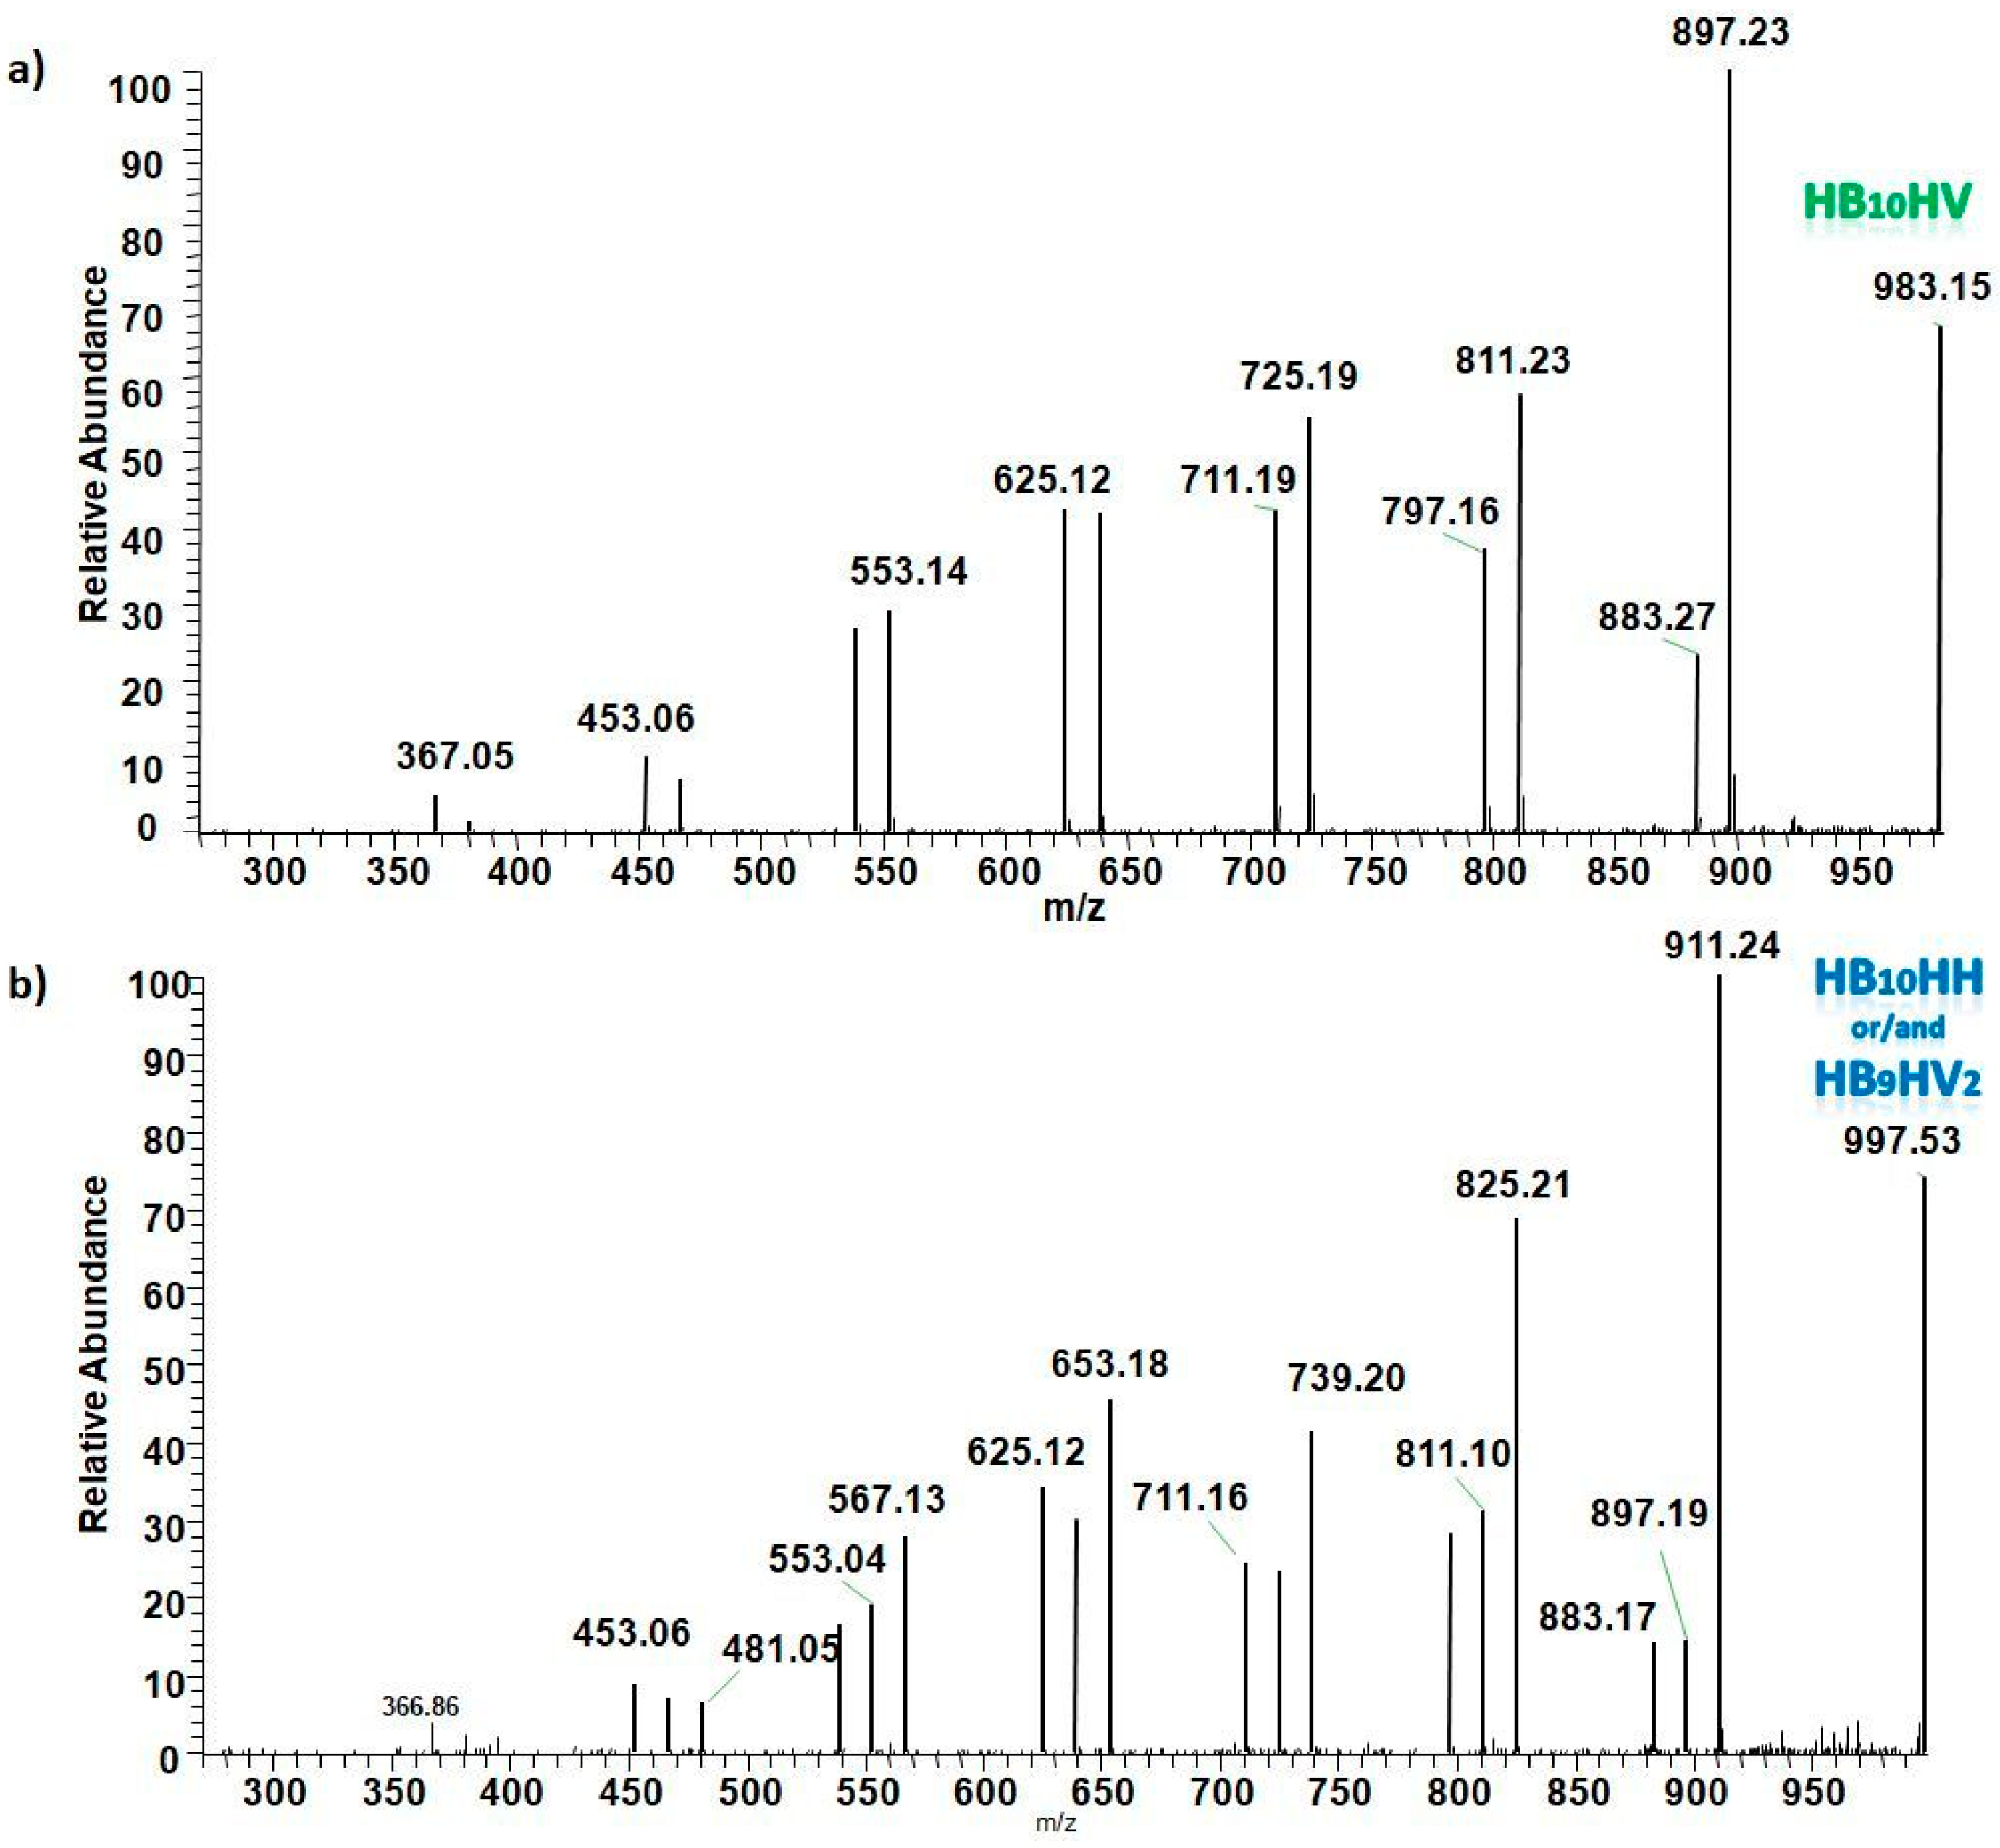
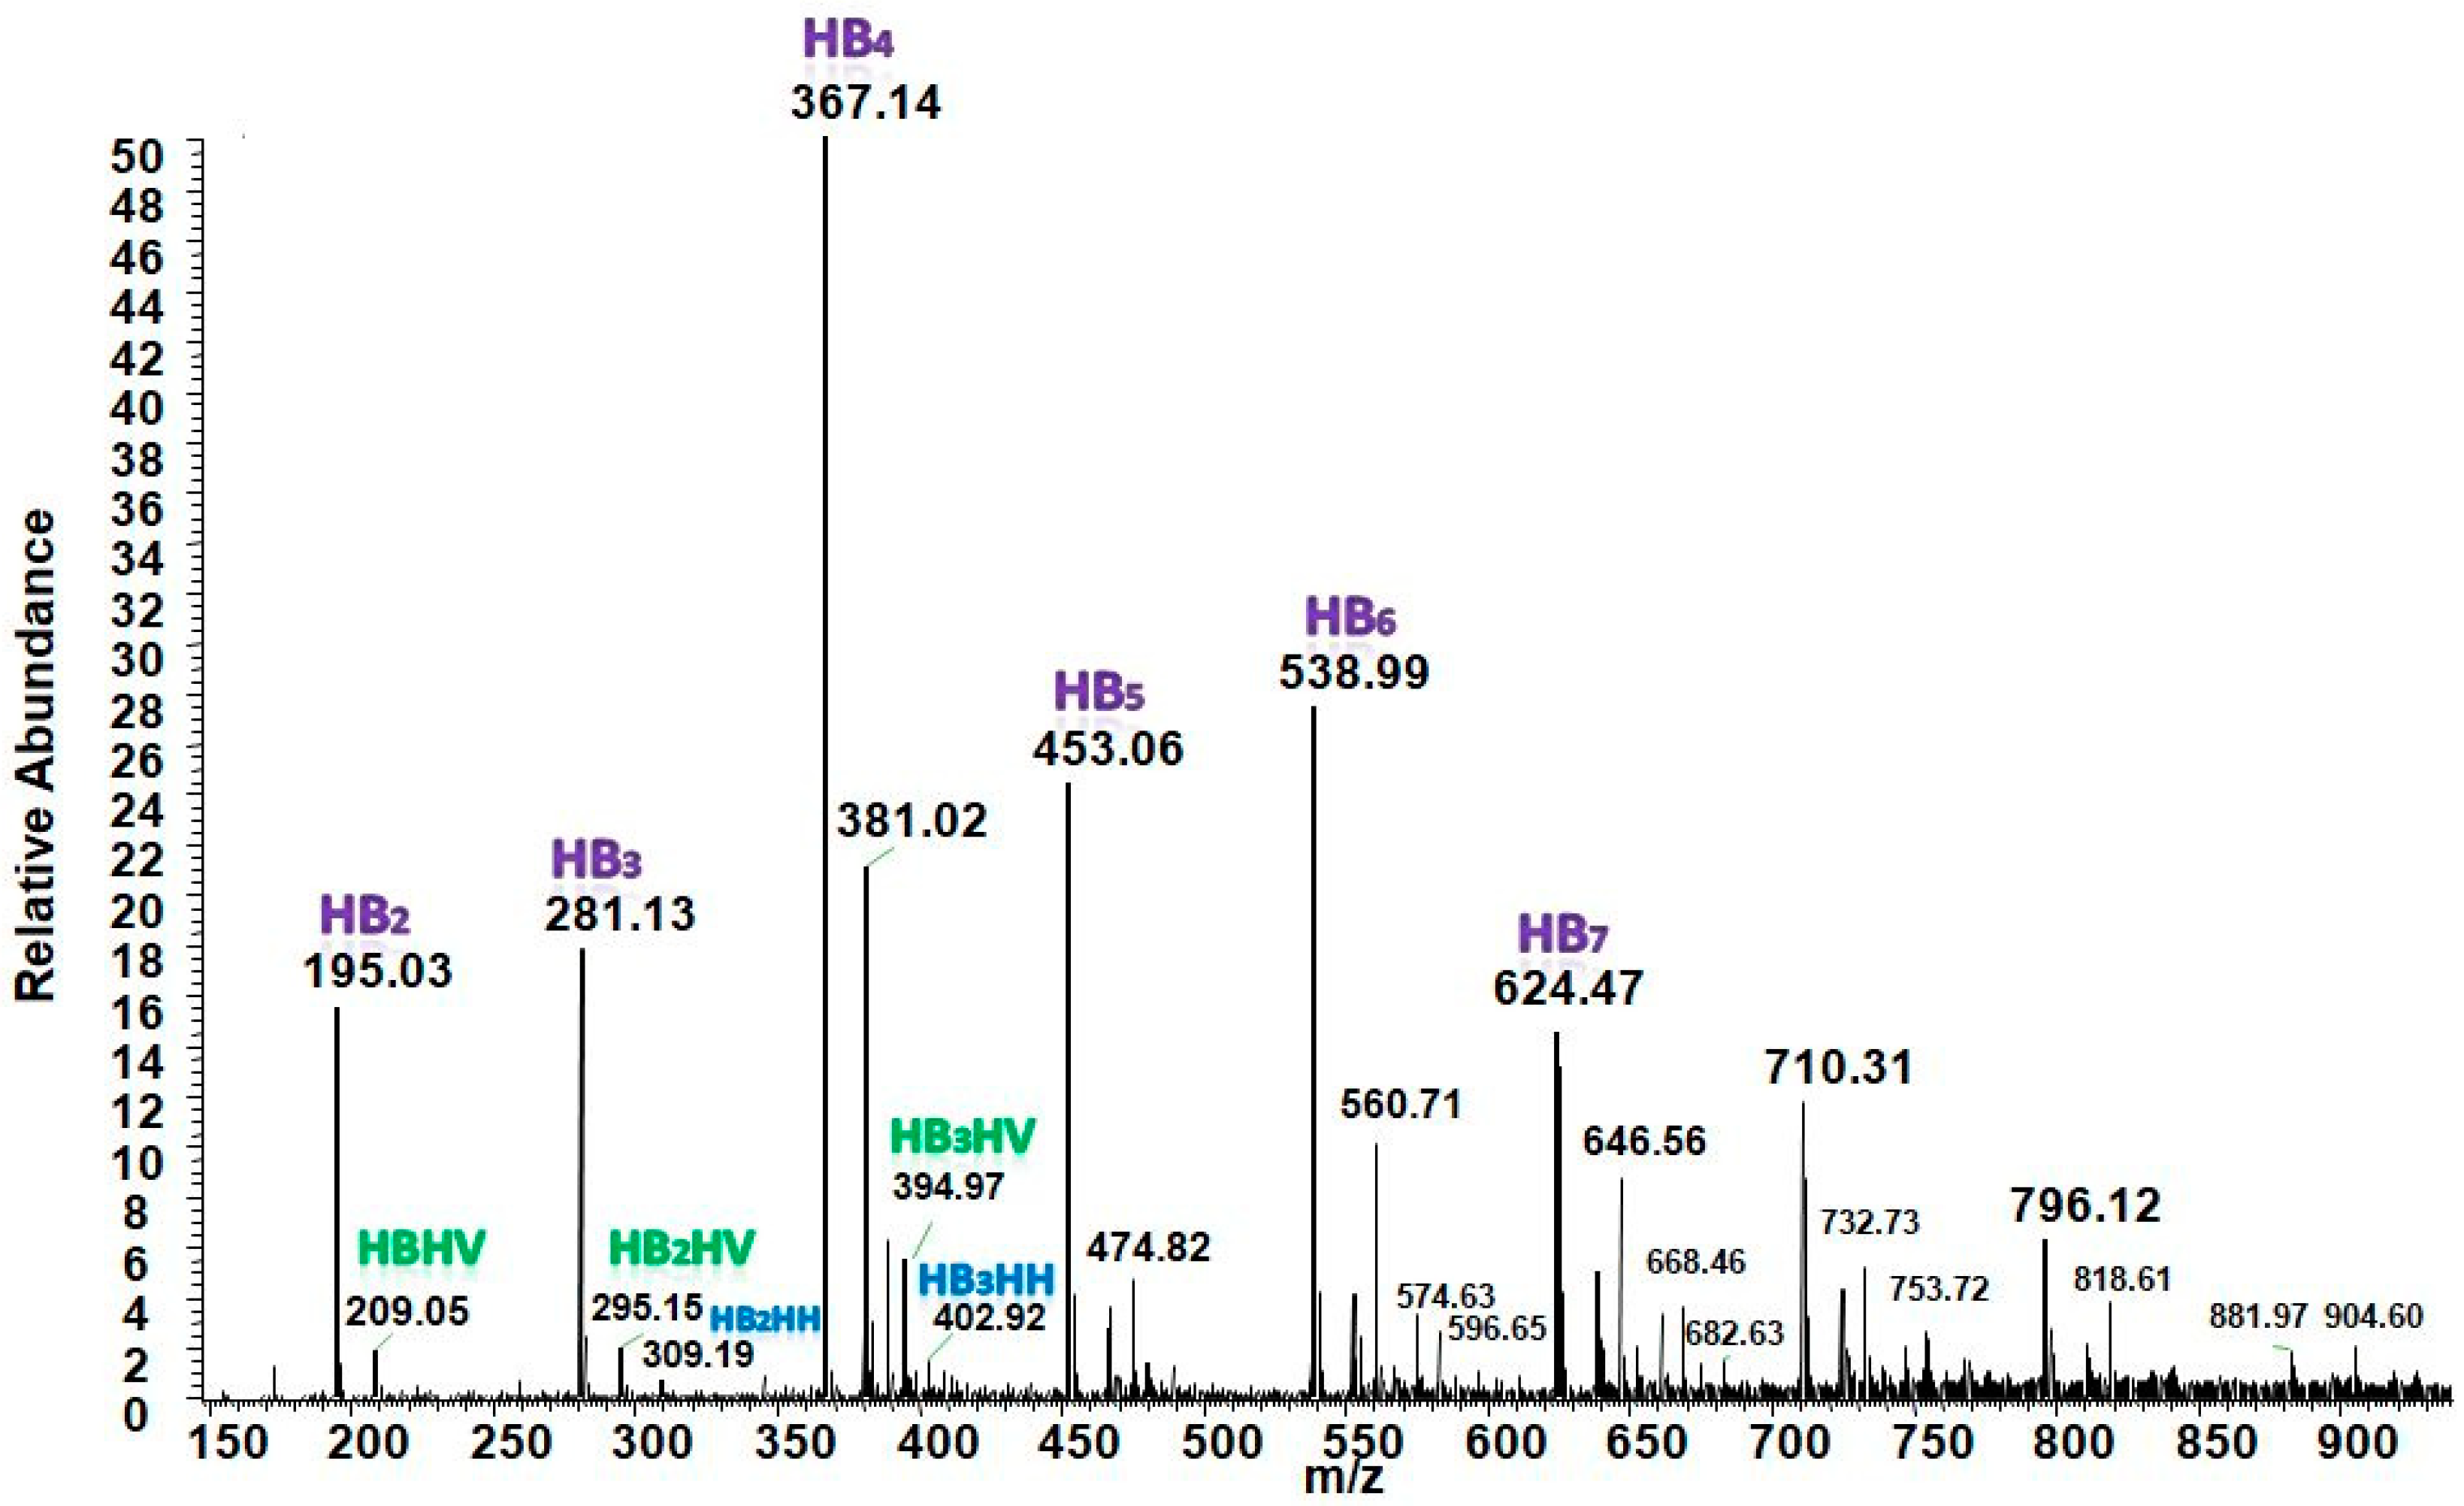
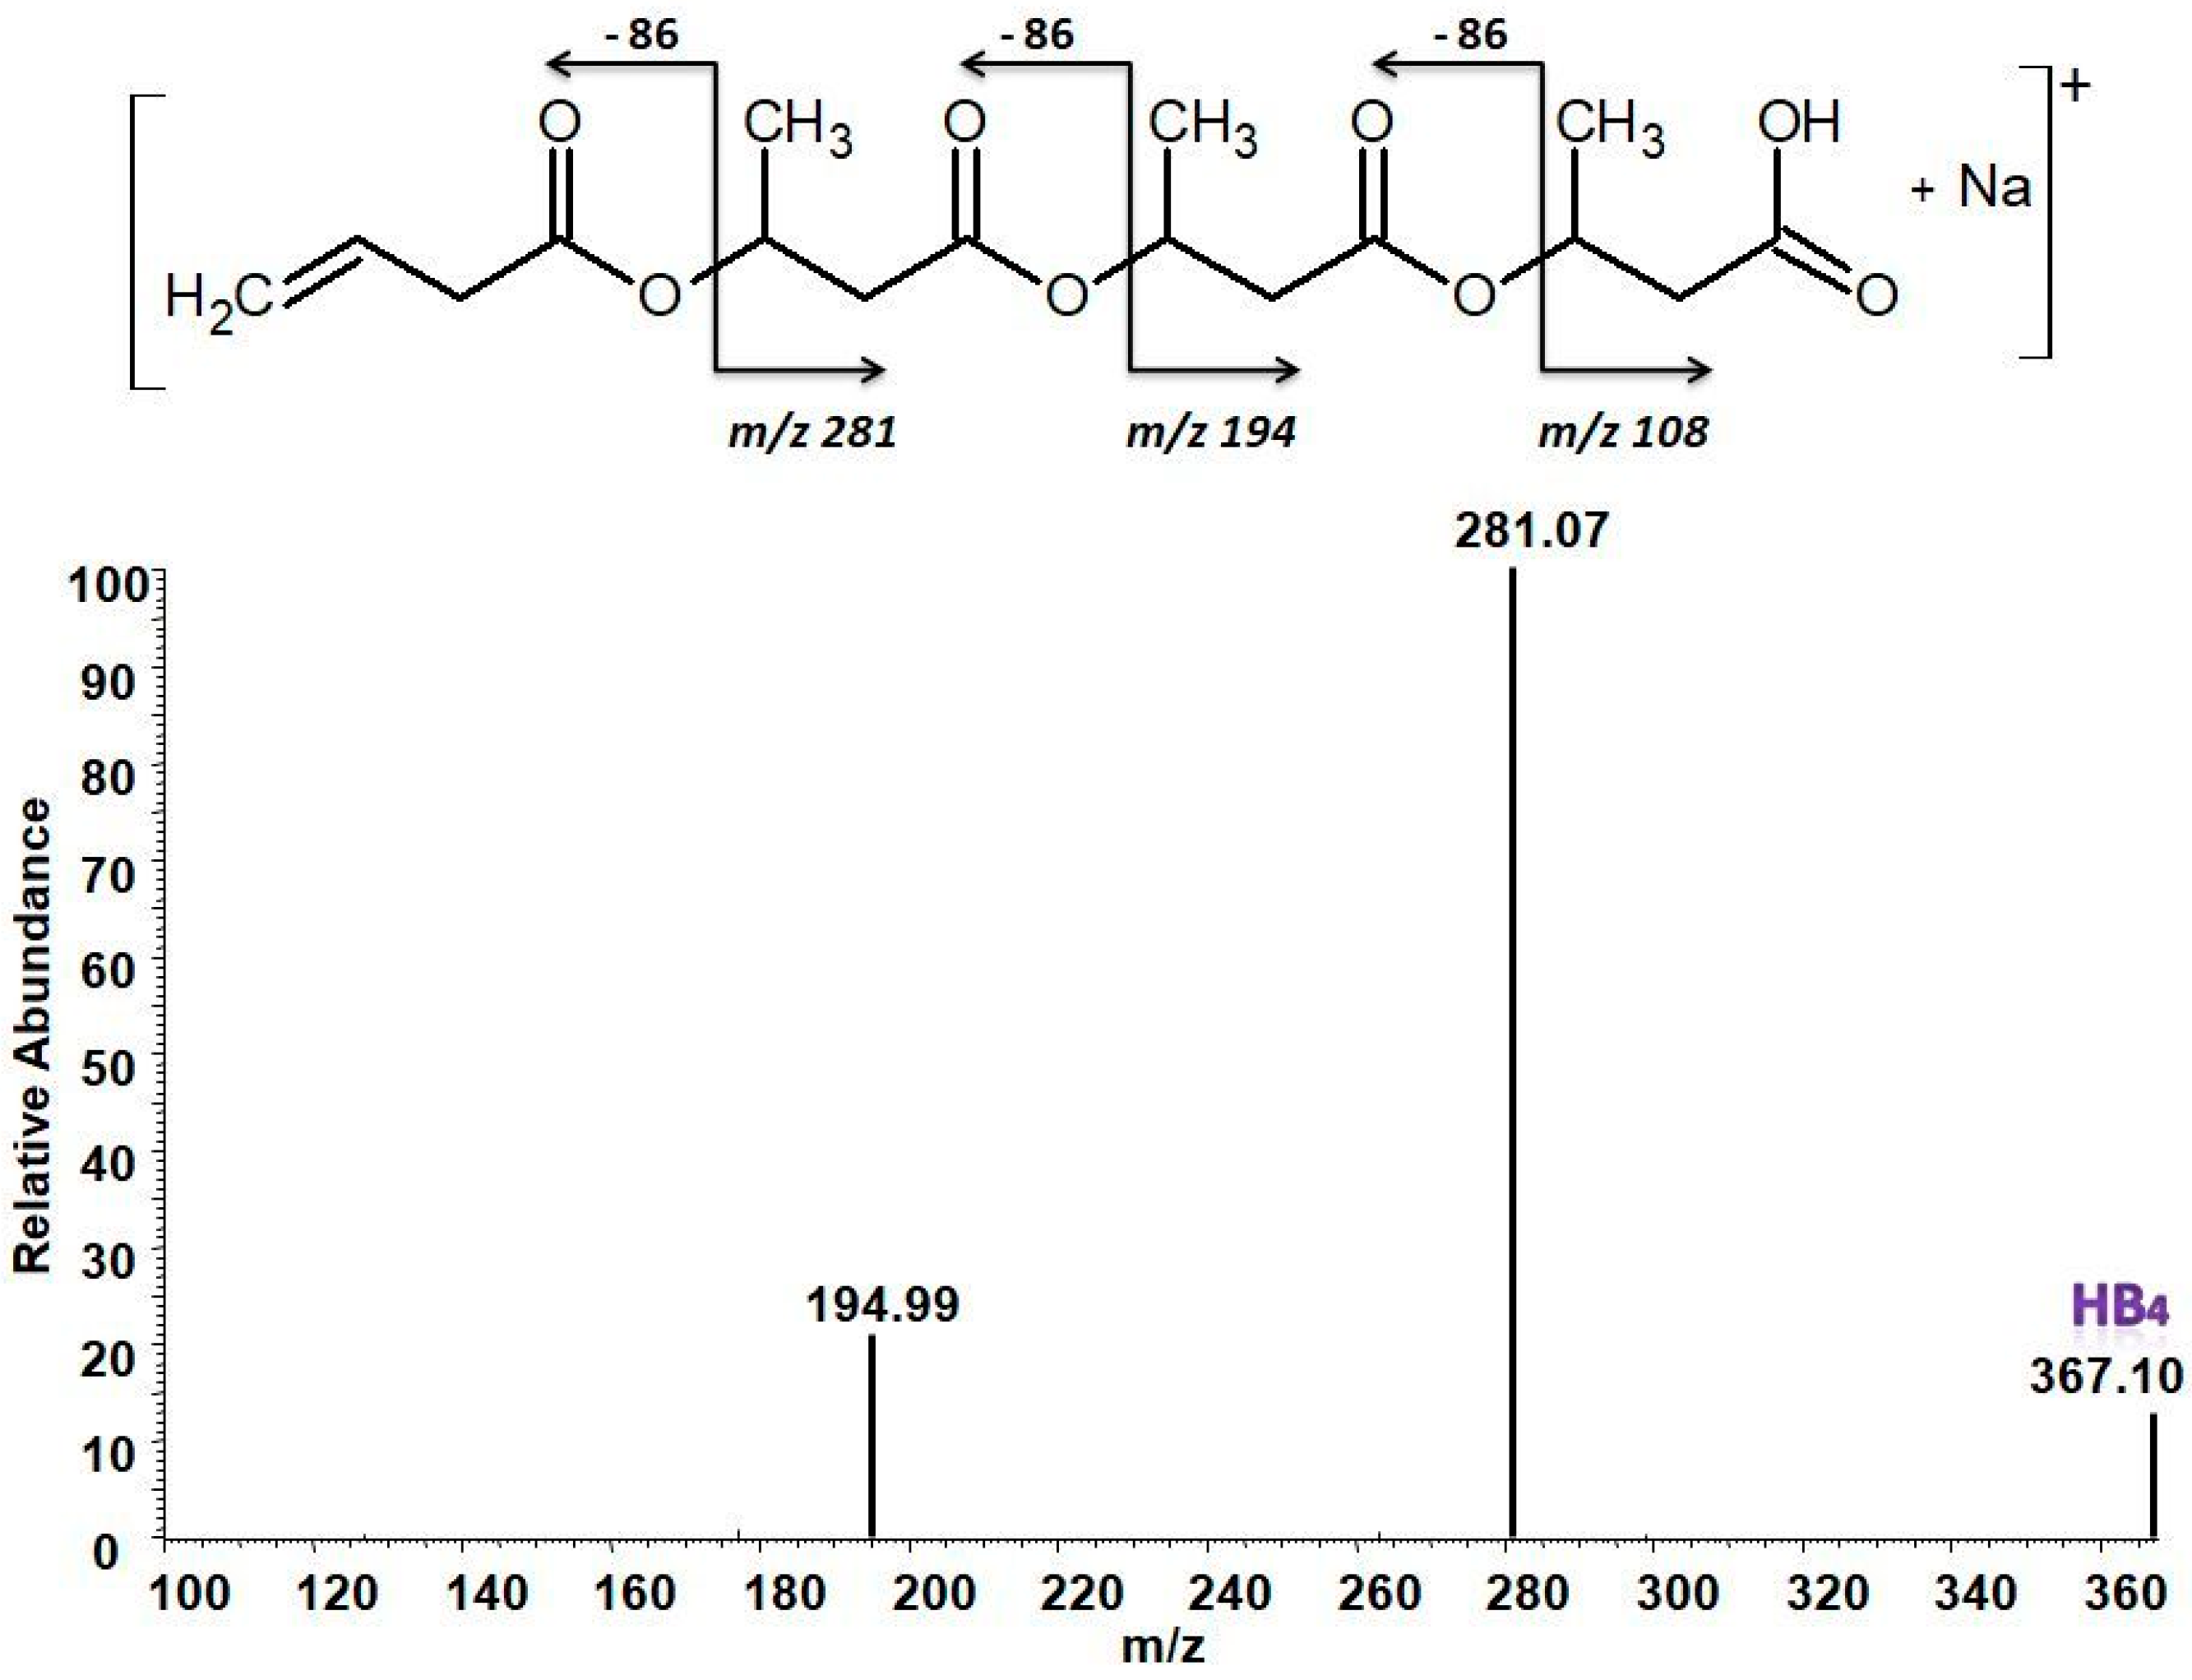
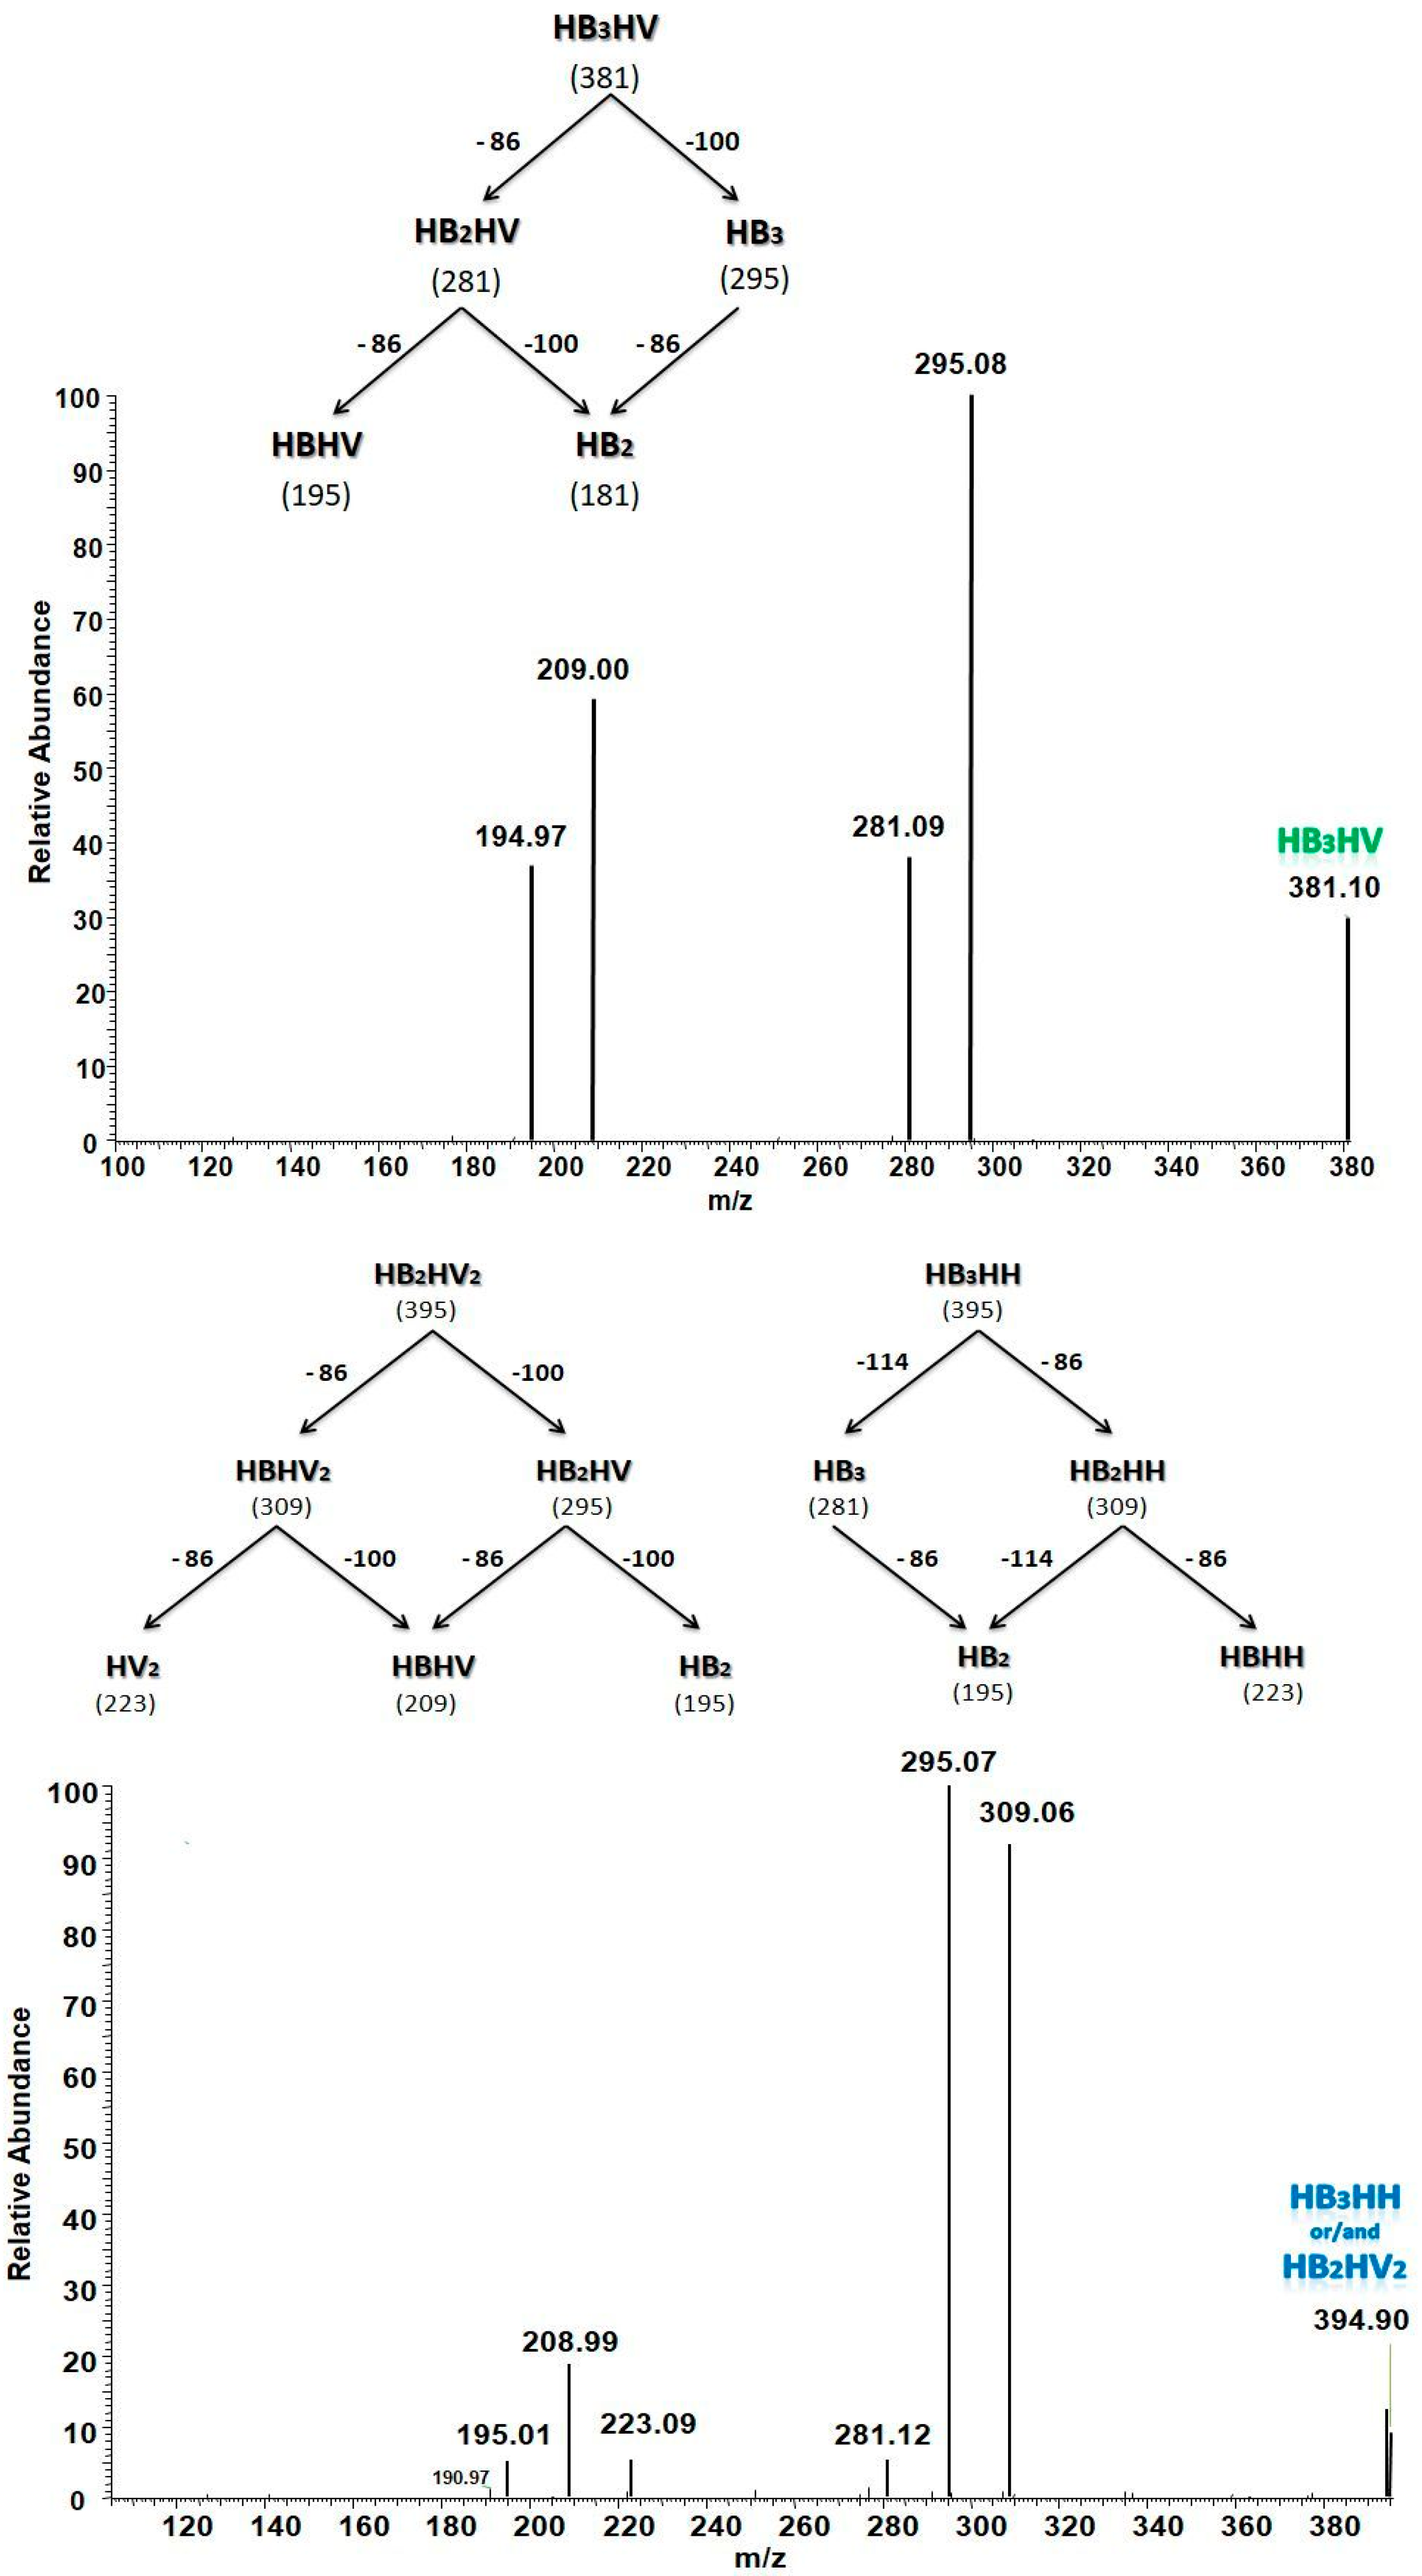
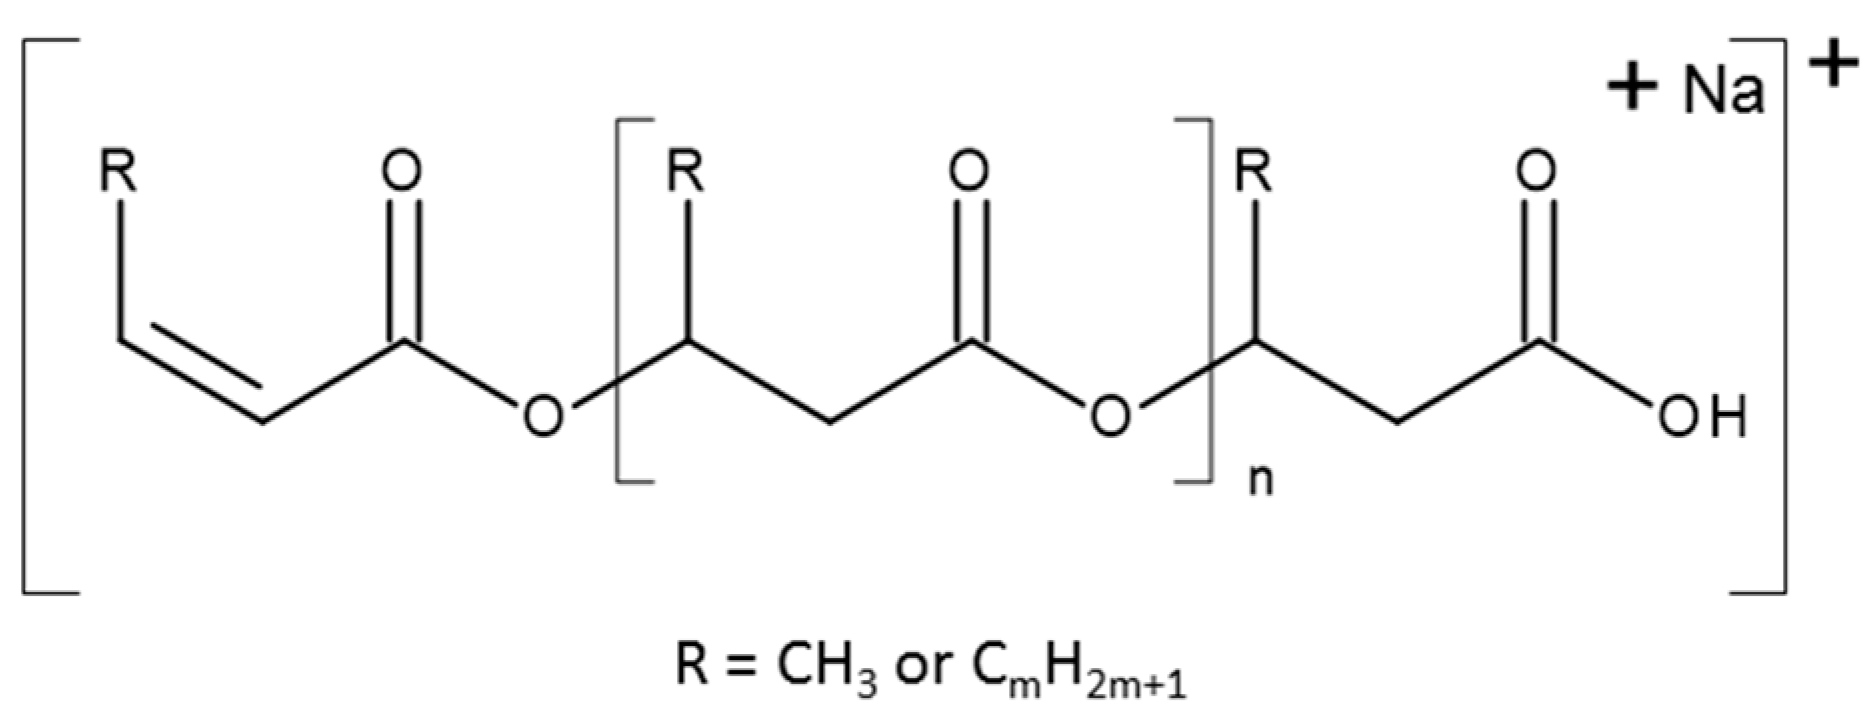
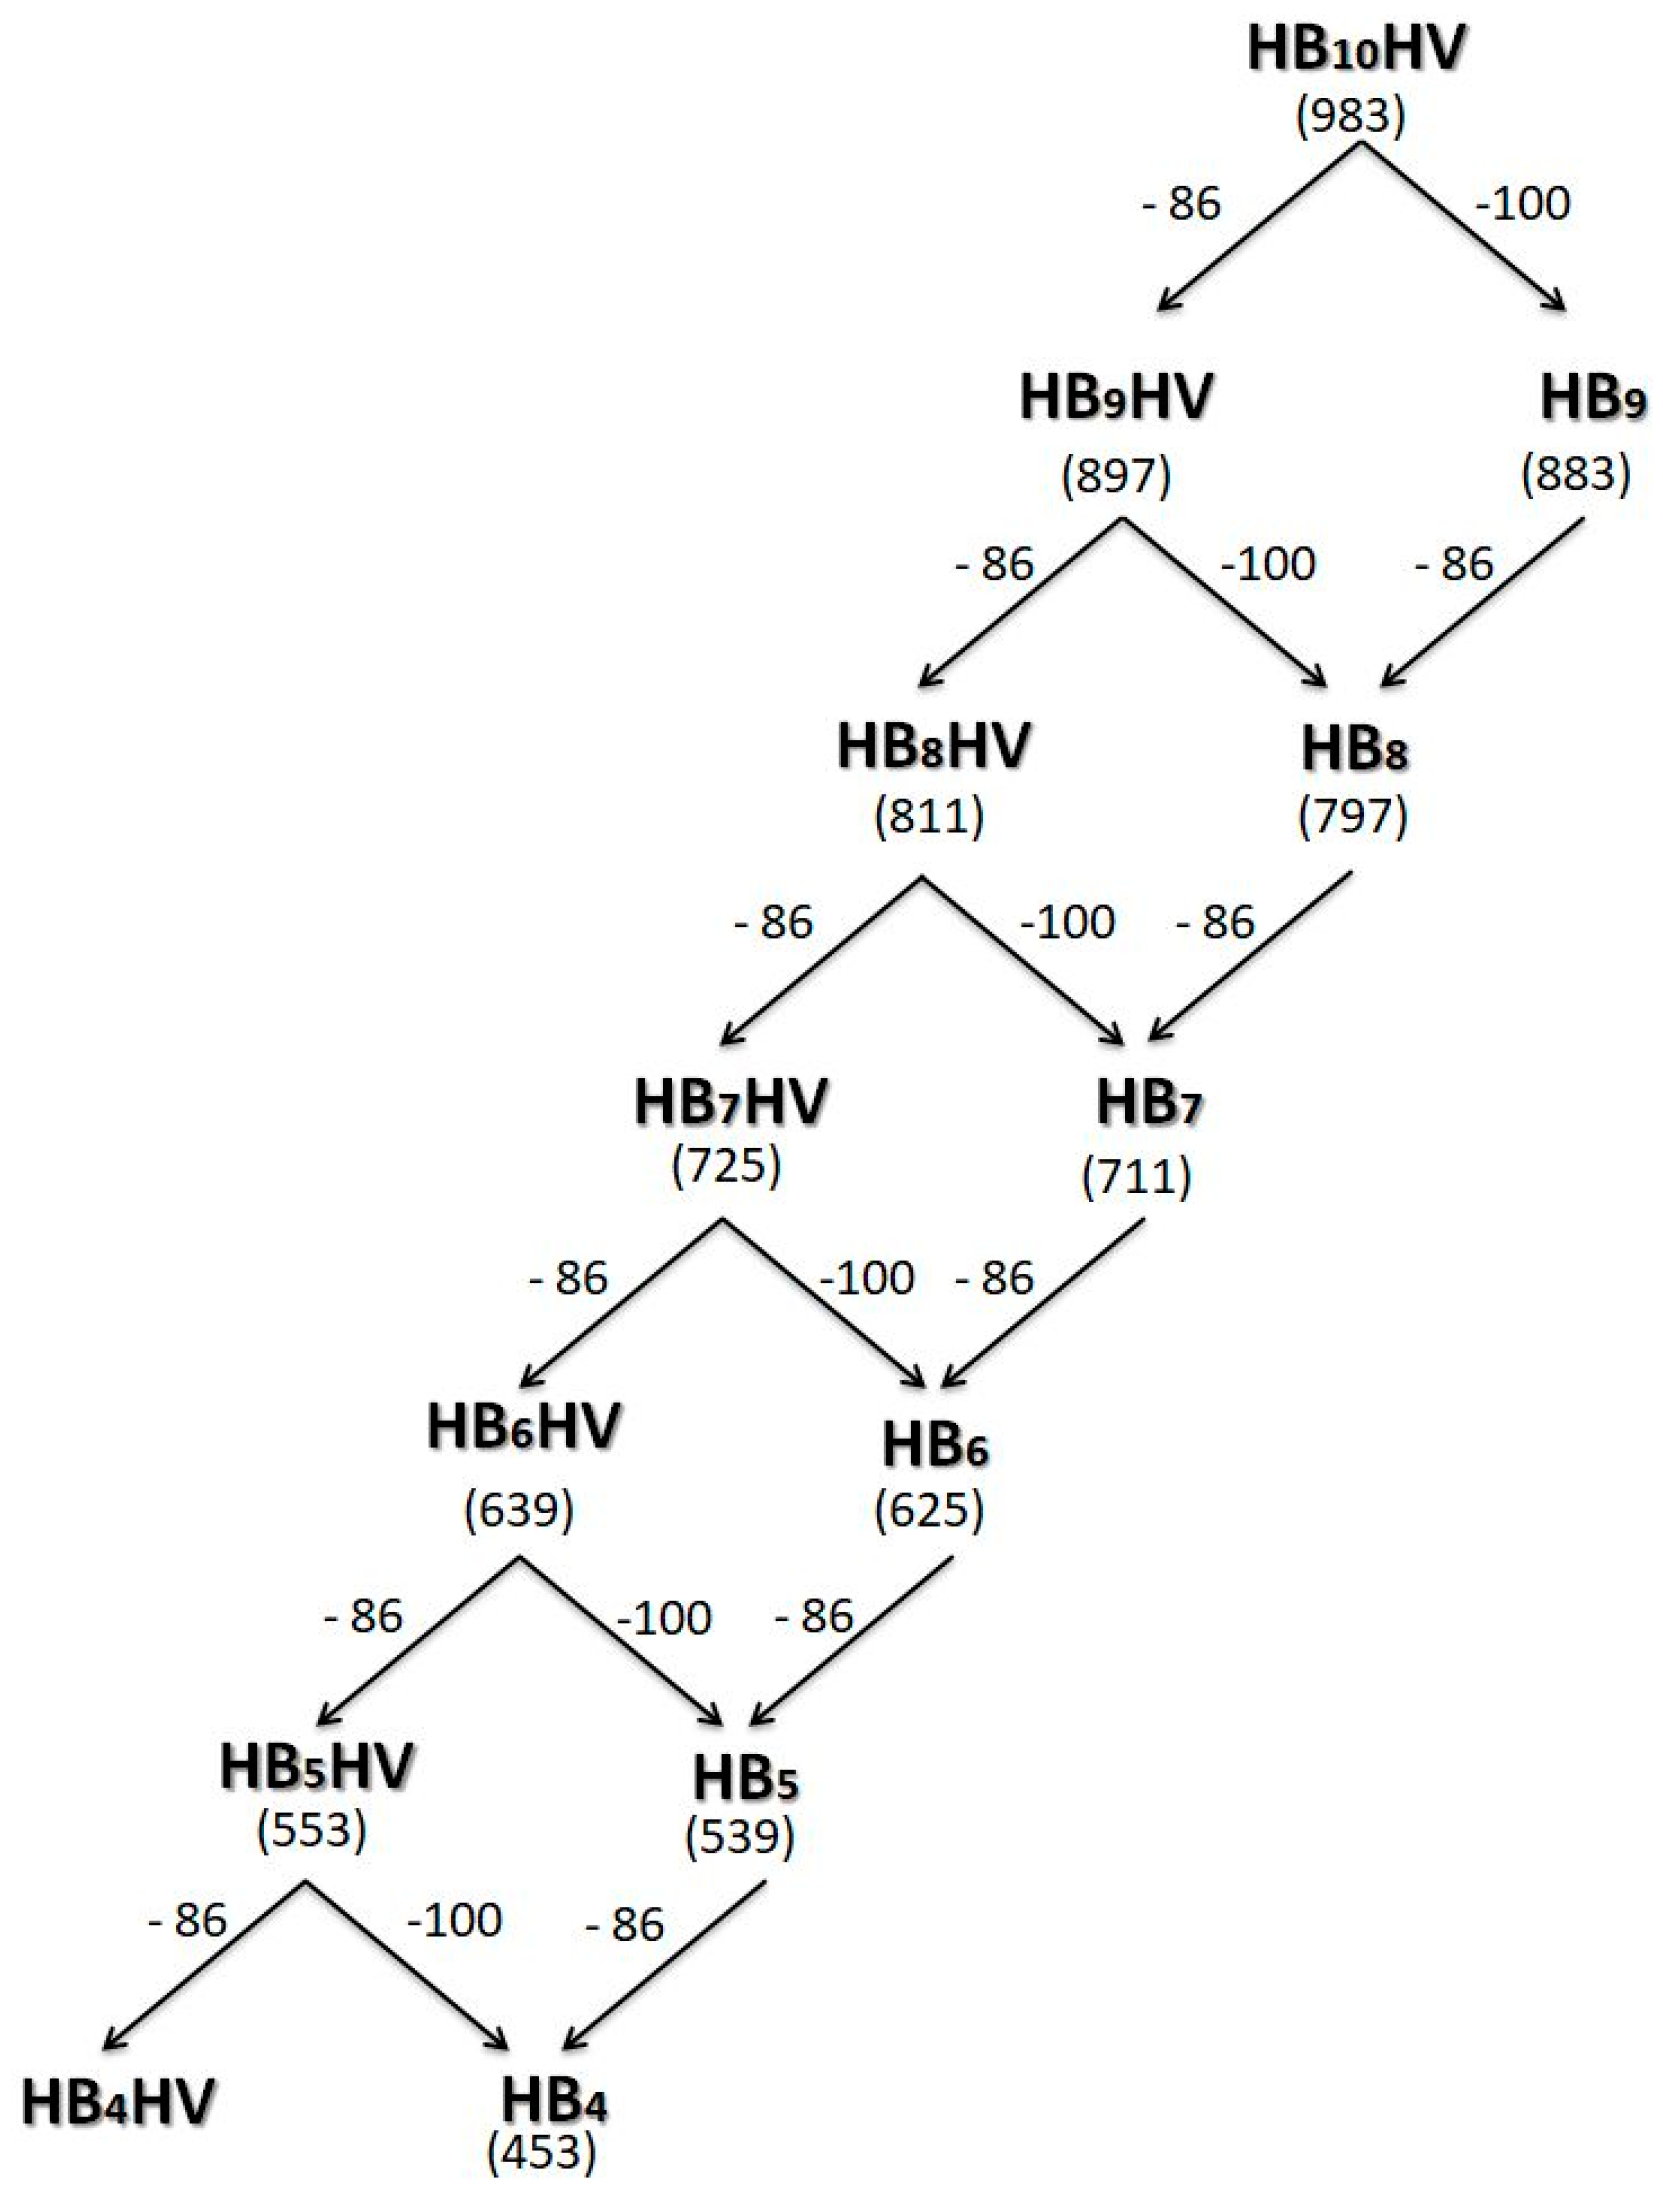
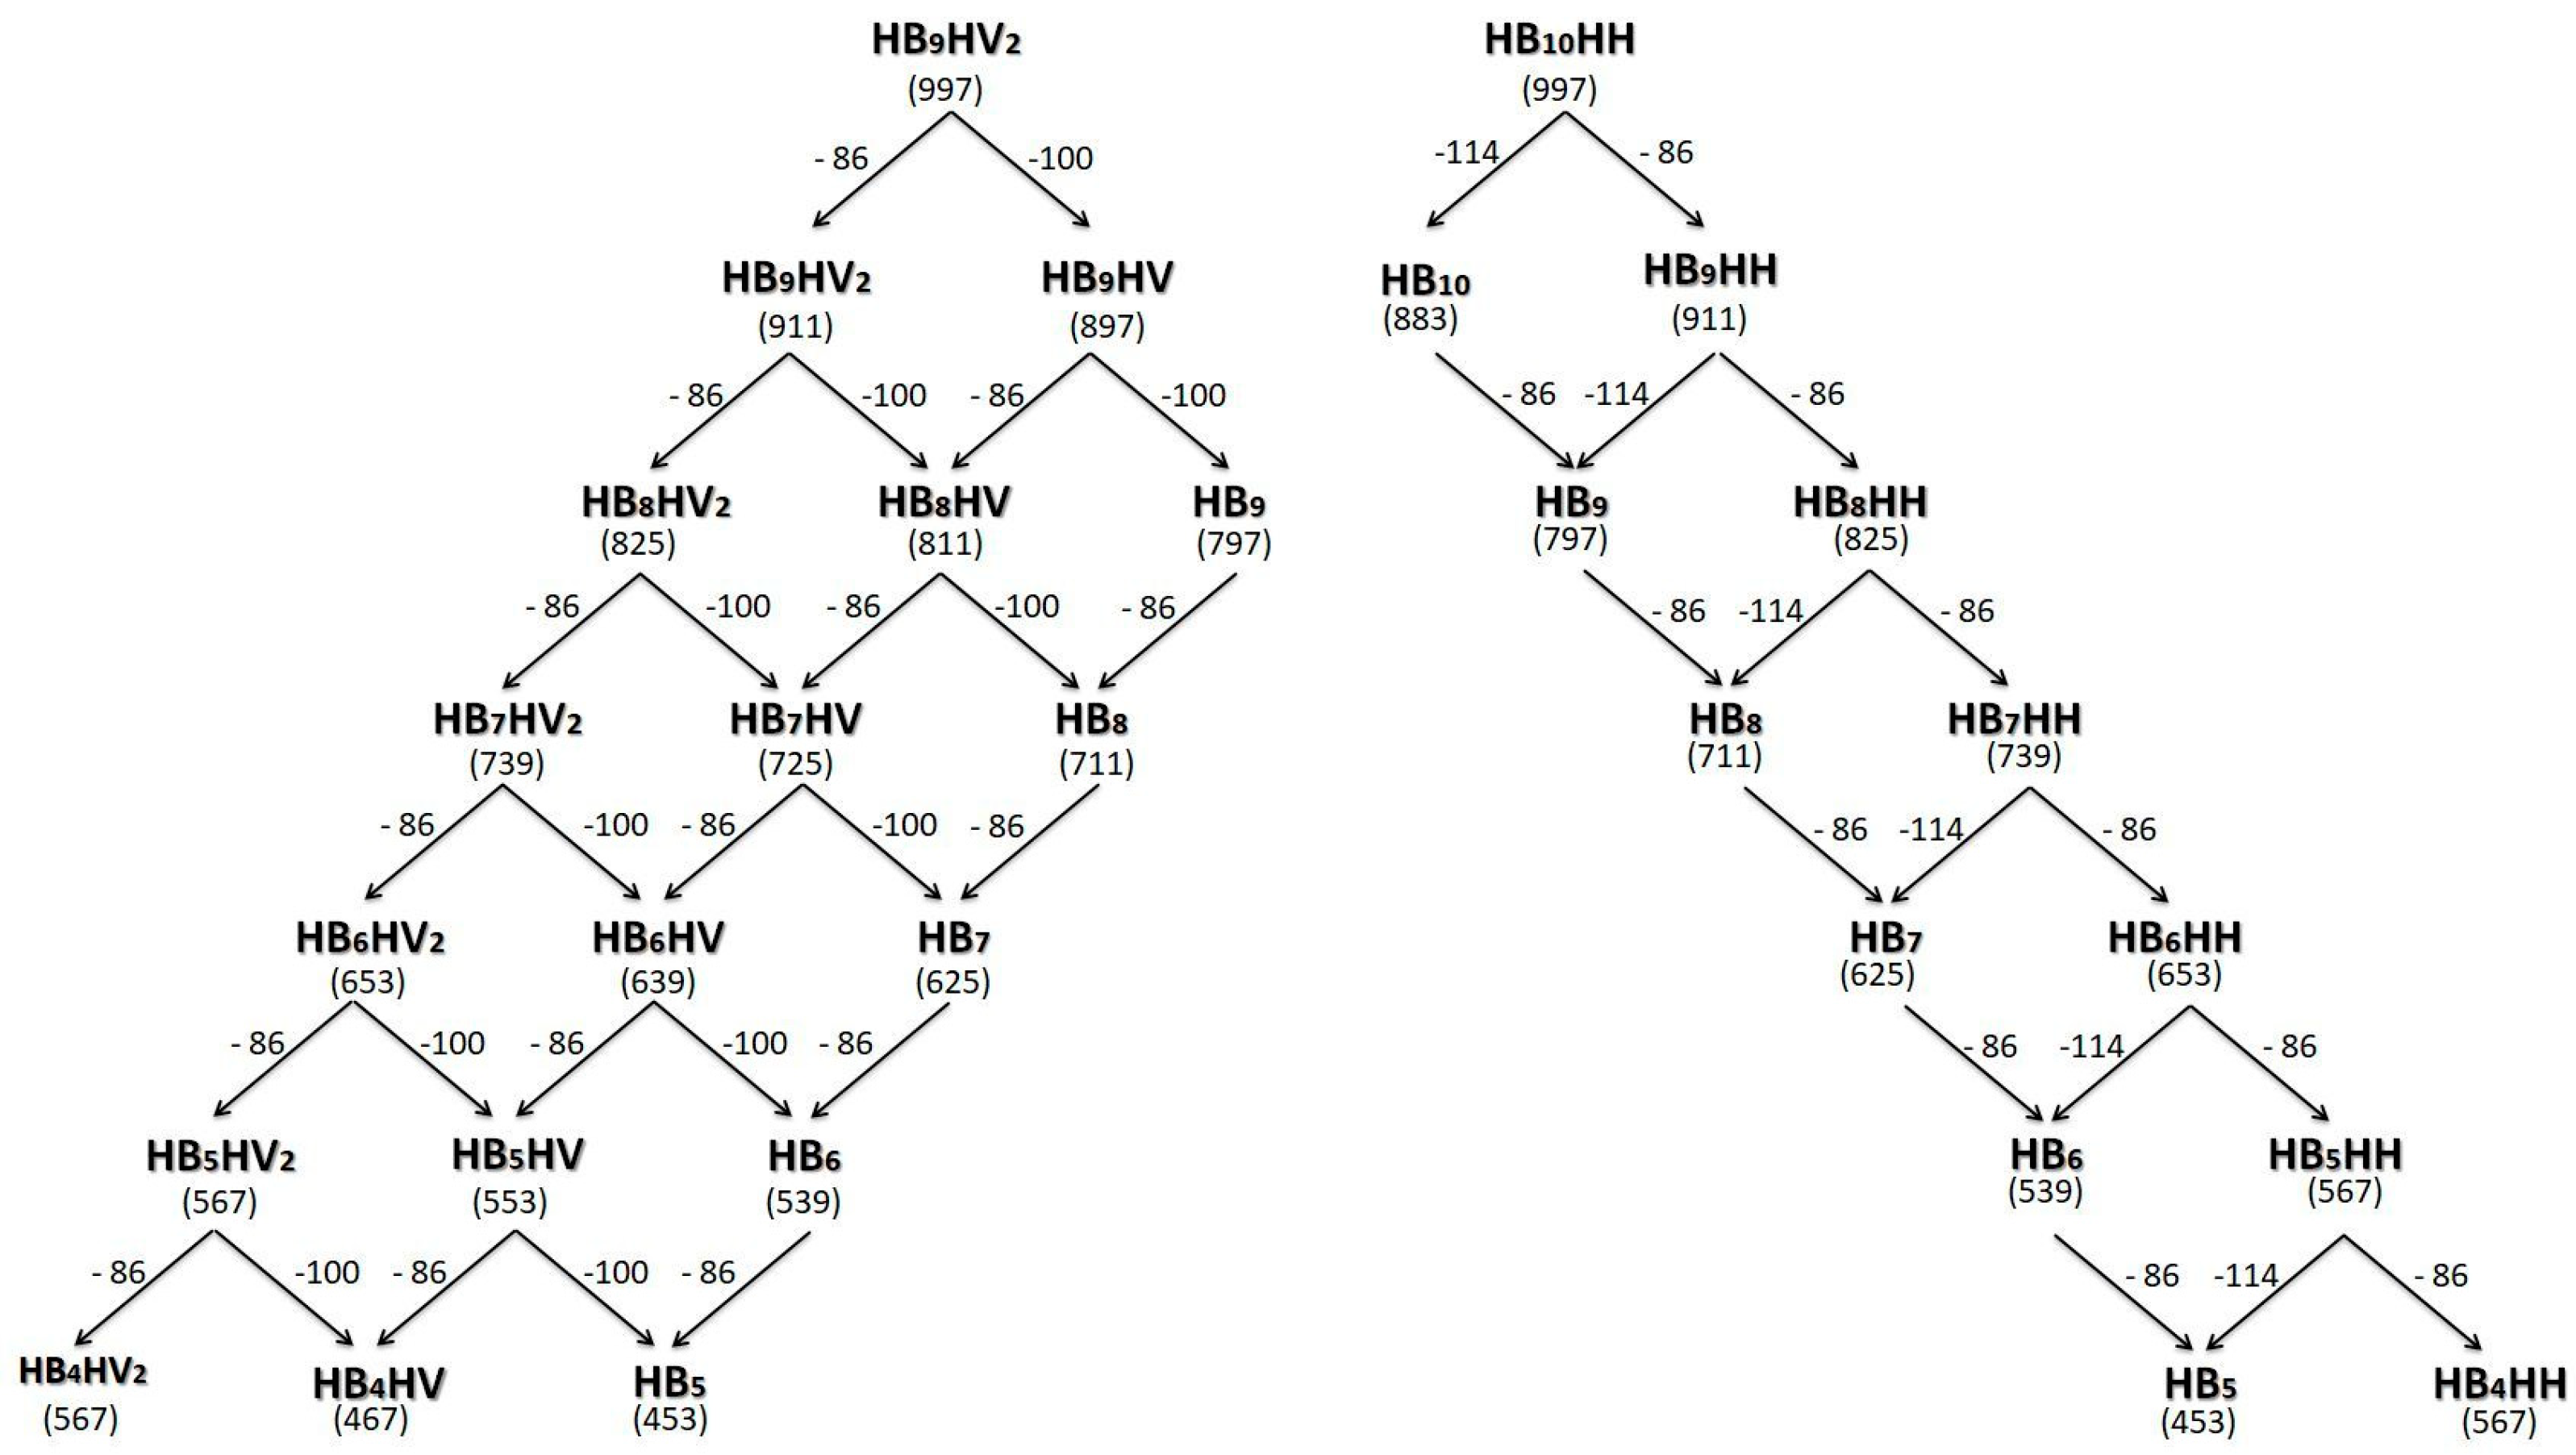
3.5.2. Structural Characterization of PHA with Dual-Stage ESI-MS
4. Discussion
5. Conclusions
6. Patents
Author Contributions
Funding
Acknowledgments
Conflicts of Interest
References
- Yol, A.M.; Janoski, J.; Quirk, R.P.; Wesdemiotis, C. Sequence Analysis of Styrenic Copolymers by Tandem Mass Spectrometry. Anal. Chem. 2014, 86, 9576–9582. [Google Scholar] [CrossRef] [PubMed]
- Barner-Kowollik, C.; Gründling, T.; Falkenhagen, J.; Weidner, S. Mass Spectrometry in Polymer Chemistry; Wiley-VCH: Weinheim, Germany, 2011. [Google Scholar]
- Kowalczuk, M.; Adamus, G. Mass spectrometry for the elucidation of the subtle molecular structure of biodegradable polymers and their degradation products. Mass Spectrom. Rev. 2016, 35, 188–198. [Google Scholar] [CrossRef] [PubMed]
- Adamus, G.; Sikorska, W.; Kowalczuk, M.; Montaudo, M.; Scandola, M. Sequence Distribution and Fragmentation Studies of Bacterial Copolyester Macromolecules: Characterization of PHBV Macroinitiator by Electrospray Ion-Trap Multistage Mass Spectrometry. Macromolecules 2000, 33, 5797–5802. [Google Scholar] [CrossRef]
- Adamus, G.; Sikorska, W.; Kowalczuk, M.; Noda, I.; Satkowski, M.M. Electrospray ion-trap multistage mass spectrometry for characterisation of co-monomer compositional distribution of bacterial poly(3-hydroxybutyrate-co-3-hydroxyhexanoate) at the molecular level. Rapid Commun. Mass Spectrom. 2003, 17, 2260–2266. [Google Scholar] [CrossRef] [PubMed]
- Adamus, G. Molecular Level Structure of (R,S)-3-Hydroxybutyrate/(R,S)-3-Hydroxy-4-ethoxybutyrate Copolyesters with Dissimilar Architecture. Macromolecules 2009, 42, 4547–4557. [Google Scholar] [CrossRef]
- Maddah, H.A. Polypropylene as a promising plastic: A review. Am. J. Polym. Sci. 2016, 6, 1–11. [Google Scholar]
- LeBlanc, R. Polypropylene Recycling—An Introduction. Available online: https://www.thebalancesmb.com/an-overview-of-polypropylene-recycling-2877863 (accessed on 9 August 2019).
- Thompson, R.C.; Swan, S.H.; Moore, C.J.; Vom Saal, F.S. Our plastic age. Philos. Trans. R. Soc. Lond. B Biol. Sci. 2009, 364, 1973–1976. [Google Scholar] [CrossRef] [PubMed] [Green Version]
- United States Environmental Protection Agency. Plastics: Material-Specific Data. Available online: https://www.epa.gov/facts-and-figures-about-materials-waste-and-recycling/plastics-material-specific-data (accessed on 9 August 2019).
- United Nations Environment Programme. Marine Plastic: A New and Growing Threat to Coral Reefs. Available online: http://www.unenvironment.org/news-and-stories/story/marine-plastic-new-and-growing-threat-coral-reefs (accessed on 9 August 2019).
- Lamb, J.B.; Willis, B.L.; Fiorenza, E.A.; Couch, C.S.; Howard, R.; Rader, D.N.; True, J.D.; Kelly, L.A.; Ahmad, A.; Jompa, J.; et al. Plastic waste associated with disease on coral reefs. Science 2018, 359, 460–462. [Google Scholar] [CrossRef]
- Kirstein, I.V.; Kirmizi, S.; Wichels, A.; Garin-Fernandez, A.; Erler, R.; Löder, M.; Gerdts, G. Dangerous hitchhikers? Evidence for potentially pathogenic Vibrio spp. on microplastic particles. Mar. Environ. Res. 2016, 120, 1–8. [Google Scholar] [CrossRef] [PubMed] [Green Version]
- Pollock, F.J.; Wada, N.; Torda, G.; Willis, B.L.; Bourne, D.G. White Syndrome-Affected Corals Have a Distinct Microbiome at Disease Lesion Fronts. Appl. Environ. Microbiol. 2016, 83, e02799-16. [Google Scholar] [CrossRef]
- Burke, L.; Reytar, K.; Spalding, M.; Perry, A. Reefs at Risk Revisted. Available online: http://pdf.wri.org/reefs_at_risk_revisited_coral_triangle (accessed on 27 October 2018).
- Somleva, M.N.; Peoples, O.P.; Snell, K.D. PHA bioplastics, biochemicals, and energy from crops. Plant Biotechnol. J. 2013, 11, 233–252. [Google Scholar] [CrossRef] [PubMed]
- Johnston, B.; Jiang, G.; Hill, D.; Adamus, G.; Kwiecień, I.; Zięba, M.; Sikorska, W.; Green, M.; Kowalczuk, M.; Radecka, I. The Molecular Level Characterization of Biodegradable Polymers Originated from Polyethylene Using Non-Oxygenated Polyethylene Wax as a Carbon Source for Polyhydroxyalkanoate Production. Bioengineering 2017, 4, 73. [Google Scholar] [CrossRef] [PubMed]
- Koller, M. Biodegradable and Biocompatible Polyhydroxy-alkanoates (PHA): Auspicious Microbial Macromolecules for Pharmaceutical and Therapeutic Applications. Molecules 2018, 23, 362. [Google Scholar] [CrossRef] [PubMed]
- Aldas, M.; Paladines, A.; Valle, V.; Pazmiño, M.; Quiroz, F. Effect of the Prodegradant-Additive Plastics Incorporated on the Polyethylene Recycling. Available online: https://www.hindawi.com/journals/ijps/2018/2474176/ (accessed on 9 August 2019).
- Johnston, B.; Radecka, I.; Hill, D.; Chiellini, E.; Ilieva, V.I.; Sikorska, W.; Musioł, M.; Zięba, M.; Marek, A.A.; Keddie, D.; et al. The Microbial Production of Polyhydroxyalkanoates from Waste Polystyrene Fragments Attained Using Oxidative Degradation. Polymers 2018, 10, 957. [Google Scholar] [CrossRef] [PubMed]
- Malykh, N.; Petrov, V.; Mal’tzev, L.I. Ultrasonic and Hydrodynamic Cavitation and Liquid Hydrocarbon Cracking. XX Sess. Russ. Acoust. Soc. 2008, 10, 345–348. [Google Scholar]
- Adamus, G.; Kwiecień, I.; Maksymiak, M.; Bałakier, T.; Jurczak, J.; Kowalczuk, M. Molecular level structure of novel synthetic analogues of aliphatic biopolyesters as revealed by multistage mass spectrometry. Anal. Chim. Acta 2014, 808, 104–114. [Google Scholar] [CrossRef] [PubMed]
- Adamus, G.; Kowalczuk, M. Anionic Ring-Opening Polymerization of β-Alkoxymethyl-Substituted β-Lactones. Biomacromolecules 2008, 9, 696–703. [Google Scholar] [CrossRef] [PubMed]
- Adamus, G. Structural analysis of poly[(R,S)-3-hydroxybutyrate-co-L-lactide] copolyesters by electrospray ionization ion trap mass spectrometry. Rapid Commun. Mass Spectrom. 2007, 21, 2477–2490. [Google Scholar] [CrossRef]
- Kawalec, M.; Janeczek, H.; Adamus, G.; Kurcok, P.; Kowalczuk, M.; Scandola, M. The Study of Kinetics of Poly[(R,S)-3-hydroxybutyrate) Degradation Induced by Carboxylate. Macromol. Symp. 2008, 272, 63–69. [Google Scholar] [CrossRef]
- Wei, L.; Guho, N.M.; Coats, E.R.; McDonald, A.G. Characterization of poly(3-hydroxybutyrate-co-3-hydroxyvalerate) biosynthesized by mixed microbial consortia fed fermented dairy manure. J. Appl. Polym. Sci. 2014, 131. [Google Scholar] [CrossRef]
- Miles, A.A.; Misra, S.S.; Irwin, J.O. The estimation of the bactericidal power of the blood. J. Hyg. 1938, 38, 732–749. [Google Scholar] [CrossRef] [Green Version]
- Kawalec, M.; Sobota, M.; Scandola, M.; Kowalczuk, M.; Kurcok, P. A convenient route to PHB macromonomers via anionically controlled moderate-temperature degradation of PHB. J. Polym. Sci. Part Polym. Chem. 2010, 48, 5490–5497. [Google Scholar] [CrossRef]
- Barbeş, L.; Rădulescu, C.; Stihi, C. ATR-FTIR Spectrometry Characterisation of Polymeric Materials. Romanian Rep. Phys. 2014, 66, 765–777. [Google Scholar]
- Shamala, T.R.; Divyashree, M.S.; Davis, R.; Kumari, K.S.L.; Vijayendra, S.V.N.; Raj, B. Production and characterization of bacterial polyhydroxyalkanoate copolymers and evaluation of their blends by fourier transform infrared spectroscopy and scanning electron microscopy. Indian J. Microbiol. 2009, 49, 251–258. [Google Scholar] [CrossRef] [Green Version]
- Adamus, G. Aliphatic Polyesters for Advanced Technologies—Structural Characterization of Biopolyesters with the Aid of Mass Spectrometry. Macromol. Symp. 2006, 239, 77–83. [Google Scholar] [CrossRef]
- Žagar, E.; Kržan, A.; Adamus, G.; Kowalczuk, M. Sequence Distribution in Microbial Poly(3-hydroxybutyrate-co-3-hydroxyvalerate) Co-polyesters Determined by NMR and MS. Biomacromolecules 2006, 7, 2210–2216. [Google Scholar] [CrossRef]
- Jedliński, Z.; Adamus, G.; Kowalczuk, M.; Schubert, R.; Szewczuk, Z.; Stefanowicz, P. Electrospray tandem mass spectrometry of poly(3-hydroxybutanoic acid) end groups analysis and fragmentation mechanism. Rapid Commun. Mass Spectrom. 1998, 12, 357–360. [Google Scholar] [CrossRef]
- Rametsteiner, G.; Rametsteiner, K.; Kern, W. Polyethylene compounds with antimicrobial surface properties. Eur. Polym. J. 2006, 42, 3383–3389. [Google Scholar]
- Zhang, W.; Luo, Y.; Wang, H.; Jiang, J.; Pu, S.; Chu, P.K. Ag and Ag/N2 plasma modification of polyethylene for the enhancement of antibacterial properties and cell growth/proliferation. Acta Biomater. 2008, 4, 2028–2036. [Google Scholar] [CrossRef]
- McDonald, G.R.; Hudson, A.L.; Dunn, S.M.J.; You, H.; Baker, G.B.; Whittal, R.M.; Martin, J.W.; Jha, A.; Edmondson, D.E.; Holt, A. Bioactive Contaminants Leach from Disposable Laboratory Plasticware. Science 2008, 322, 917. [Google Scholar] [CrossRef]
- Dudek, S.; Coskun, M.C. Biopolymer Compounds for Applications Requiring Marine Degradation. Presented at ANTEC Anaheim 2017, Anaheim, CA, USA, 8–10 May 2017; p. 415. [Google Scholar]


| Sample | AN [mg KOH/g] | Process Conditions |
|---|---|---|
| PP-0 | 14.8 | N/A |
| PP-1 | 84.2 | 80 °C, O3/O2, 20 h |
| PP-2 | 66.3 | 100 °C, O3/O2, 20 h |
| Sample | Mw | Mn | DI (Mw/Mn) |
|---|---|---|---|
| PP-0 | 148,000 | 18,000 | 8.2 |
| PP-1 | 12,000 | 2200 | 5.2 |
| PP-2 | 4000 | 1600 | 2.6 |
| Media | Average CDW (g/L) | Average PHA (g/L) | PHA (%w/w) |
|---|---|---|---|
| BSM only | 0.09 ± 0.10 | ND | ND |
| TSB only | 2.18 ± 0.20 | 0.48 ± 0.06 | 22% |
| PP-0 + BSM | 0.07 ± 0.03 | ND | ND |
| PP-0 + TSB | 2.26 ± 0.06 | 0.58 ± 0.02 | 26% |
| PP-1 + TSB | 3.22 ± 0.10 | 1.36 ± 0.20 | 42% |
| PP-2 + TSB | 2.82 ± 0.10 | 0.78 ± 0.02 | 28% |
| Sample Name | Mw | Mn | DI |
|---|---|---|---|
| PHA-PP-0 | 410,000 | 139,000 | 2.9 |
| PHA-PP-1 | 676,000 | 221,000 | 3.0 |
| PHA-PP-2 | 710,000 | 259,000 | 2.7 |
| Sample name | Step 1 | Step 2 | ||
|---|---|---|---|---|
| Tmax (°C) | Weight loss (%) | Tmax (°C) | Weight loss (%) | |
| PHA-PP-0 | 291.4 | 86.6 | - | 97.3 |
| PHA-PP-1 | 294.7 | 88.3 | - | 98.7 |
| PHA-PP-2 | 294.2 | 71.6 | 444.1 | 97.7 |
© 2019 by the authors. Licensee MDPI, Basel, Switzerland. This article is an open access article distributed under the terms and conditions of the Creative Commons Attribution (CC BY) license (http://creativecommons.org/licenses/by/4.0/).
Share and Cite
Johnston, B.; Radecka, I.; Chiellini, E.; Barsi, D.; Ilieva, V.I.; Sikorska, W.; Musioł, M.; Zięba, M.; Chaber, P.; Marek, A.A.; et al. Mass Spectrometry Reveals Molecular Structure of Polyhydroxyalkanoates Attained by Bioconversion of Oxidized Polypropylene Waste Fragments. Polymers 2019, 11, 1580. https://doi.org/10.3390/polym11101580
Johnston B, Radecka I, Chiellini E, Barsi D, Ilieva VI, Sikorska W, Musioł M, Zięba M, Chaber P, Marek AA, et al. Mass Spectrometry Reveals Molecular Structure of Polyhydroxyalkanoates Attained by Bioconversion of Oxidized Polypropylene Waste Fragments. Polymers. 2019; 11(10):1580. https://doi.org/10.3390/polym11101580
Chicago/Turabian StyleJohnston, Brian, Iza Radecka, Emo Chiellini, David Barsi, Vassilka Ivanova Ilieva, Wanda Sikorska, Marta Musioł, Magdalena Zięba, Paweł Chaber, Adam A. Marek, and et al. 2019. "Mass Spectrometry Reveals Molecular Structure of Polyhydroxyalkanoates Attained by Bioconversion of Oxidized Polypropylene Waste Fragments" Polymers 11, no. 10: 1580. https://doi.org/10.3390/polym11101580