Article

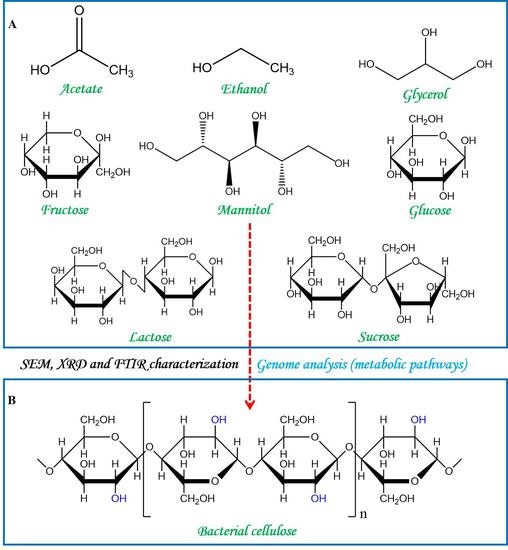
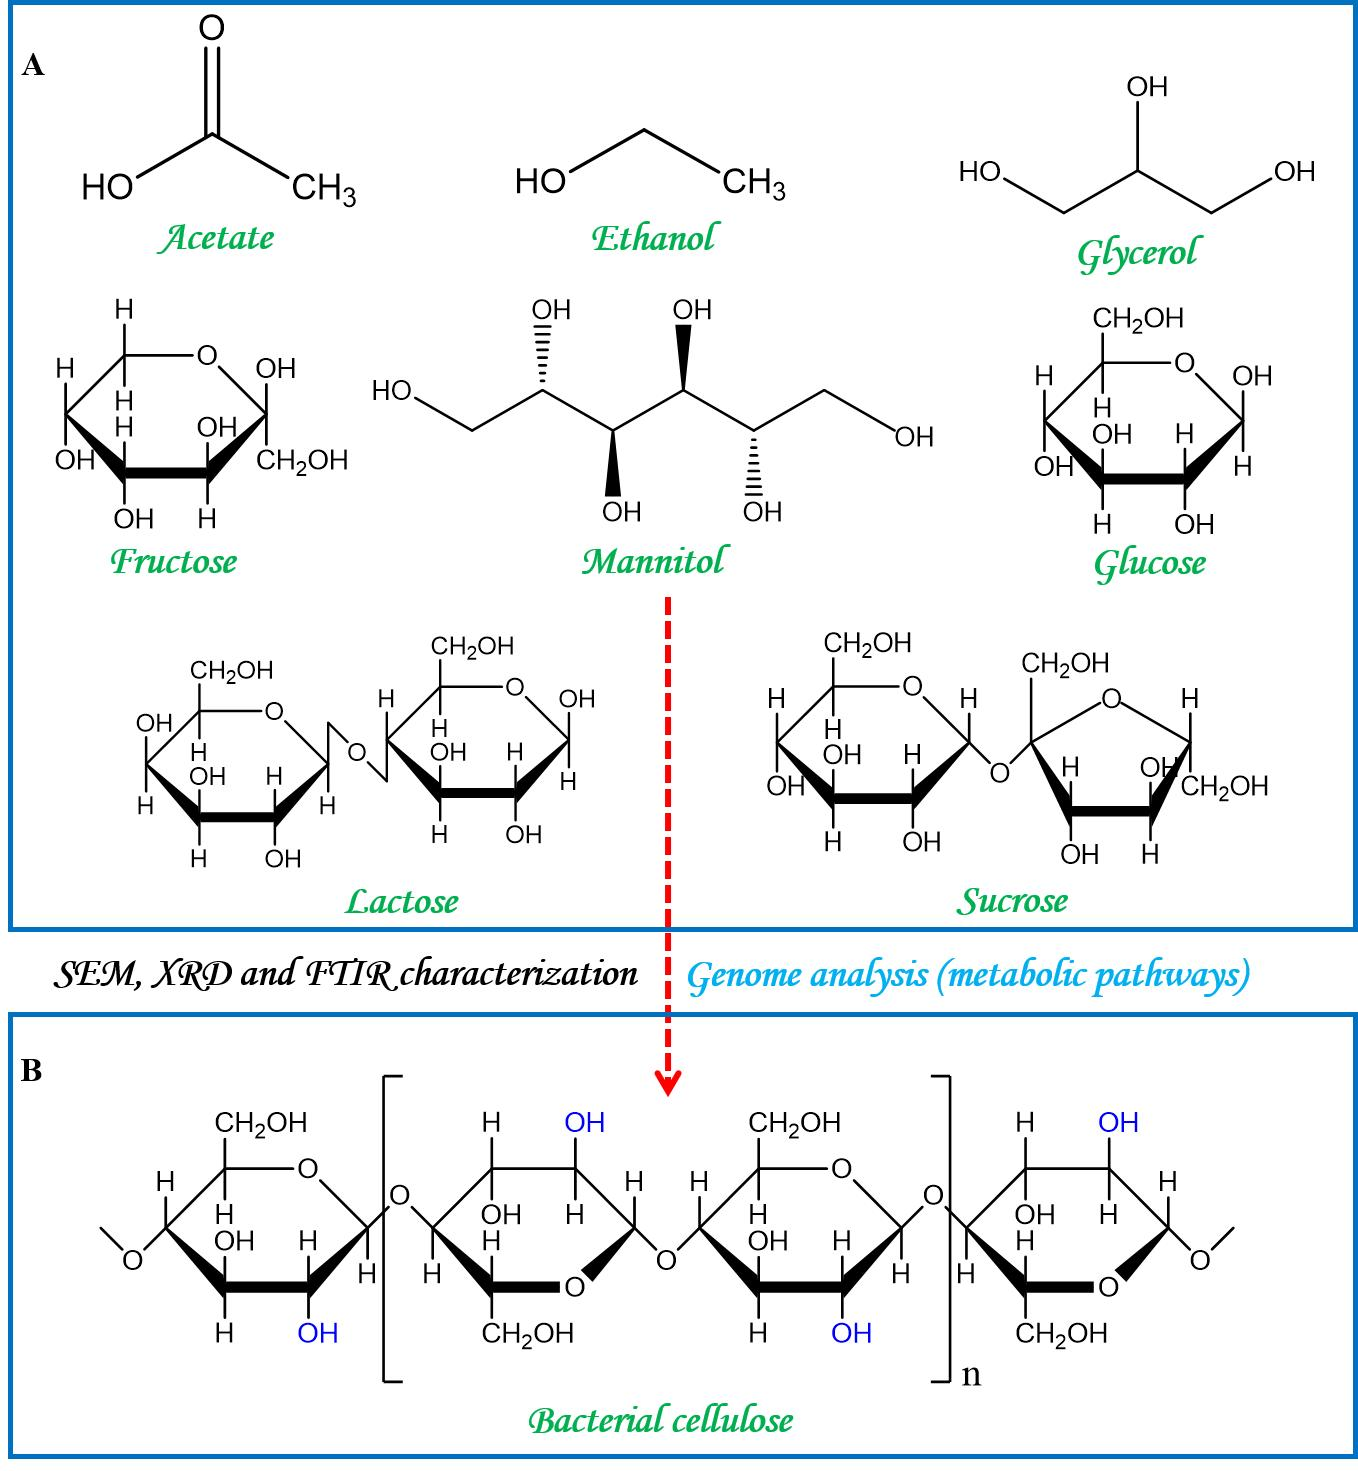
Insights into Bacterial Cellulose Biosynthesis from Different Carbon Sources and the Associated Biochemical Transformation Pathways in Komagataeibacter sp. W1

1
College of Life Science, Fujian Normal University, Fuzhou 350117, China
2
Quangang Petrochemical Research Institute, Fujian Normal University, Quanzhou 362801, China
3
College of Environmental Science and Engineering, Fujian Normal University, Fuzhou 350007, China
4
State Key Laboratory of Pollution Control and Resource Reuse, School of the Environment, Nanjing University, Nanjing 210023, China
5
The Innovative Center for Eco-Friendly Polymeric Materials of Fujian Province, Quanzhou 362801, China
*
Authors to whom correspondence should be addressed.
These authors contributed equally to this work.
Polymers 2018, 10(9), 963; https://doi.org/10.3390/polym10090963
Submission received: 29 July 2018 / Revised: 25 August 2018 / Accepted: 27 August 2018 / Published: 31 August 2018
(This article belongs to the Collection Polysaccharides)

Abstract

:
Cellulose is the most abundant and widely used biopolymer on earth and can be produced by both plants and micro-organisms. Among bacterial cellulose (BC)-producing bacteria, the strains in genus Komagataeibacter have attracted wide attention due to their particular ability in furthering BC production. Our previous study reported a new strain of genus Komagataeibacter from a vinegar factory. To evaluate its capacity for BC production from different carbon sources, the present study subjected the strain to media spiked with 2% acetate, ethanol, fructose, glucose, lactose, mannitol or sucrose. Then the BC productivity, BC characteristics and biochemical transformation pathways of various carbon sources were fully investigated. After 14 days of incubation, strain W1 produced 0.040–1.529 g L−1 BC, the highest yield being observed in fructose. Unlike BC yields, the morphology and microfibrils of BCs from different carbon sources were similar, with an average diameter of 35–50 nm. X-ray diffraction analysis showed that all membranes produced from various carbon sources had 1–3 typical diffraction peaks, and the highest crystallinity (i.e., 90%) was found for BC produced from mannitol. Similarly, several typical spectra bands obtained by Fourier transform infrared spectroscopy were similar for the BCs produced from different carbon sources, as was the Iα fraction. The genome annotation and Kyoto Encyclopedia of Genes and Genomes analysis revealed that the biochemical transformation pathways associated with the utilization of and BC production from fructose, glucose, glycerol, and mannitol were found in strain W1, but this was not the case for other carbon sources. Our data provides suggestions for further investigations of strain W1 to produce BC by using low molecular weight sugars and gives clues to understand how this strain produces BC based on metabolic pathway analysis.

Graphical Abstract

1. Introduction

Cellulose is the most abundant and widely used biopolymer on earth, most of which is produced by plants [1,2]. In addition to plant origin, cellulose is also naturally produced by micro-organisms including bacteria, fungi, and algae [3]. Due to its unique properties such as high purity, high crystallinity, high water-capacity, low production cost, and good biocompatibility, the cellulose produced by bacteria (i.e., bacterial cellulose, BC) has been widely used in the preparation of food hydrocolloids, high-strength recycled paper, cosmetic moisturizer, and medical materials [4,5,6,7]. By an additional modification, BC-based materials can also be used to prepare adsorption or filter membranes for pollutant removal from aqueous solution [8,9] or to prepare electrochemical materials with high-performances [5].
In the presence of glucokinase, phosphoglucomutase and uridine triphosphate (UTP)-glucose-1-phosphate uridylyltransferase, glucose is transformed to glucose-6-phosphate, glucose-1-phosphate, uridine diphosphate (UDP)-glucose, and finally to unbranched β-1,4-d-glucan (i.e., BC) with the aid of cellulose synthases [10,11]. Besides glucose, all substrates which can be transformed to glucose are theoretically available for BC production. For example, four strains of Komagataeibacter xylinus studied by Singhsa et al. [12] showed great ability for BC production on using fructose, lactose, maltitol, sucralose, and xylitol. Other substrates such as glycerol, sucrose, and galactose are also good carbon sources for BC production [13,14,15]. Unlike sugars or their derivatives, using ethanol and acetate as the substrates for BC production has been hardly reported [16]. More often, both ethanol and acetate are spiked in media to enhance BC production by improving adenosine triphosphate (ATP) production, which is responsible for energy supply in the tricarboxylic acid (TCA) cycle and sugar metabolisms. Specifically, these processes are achieved by promoting the activities of glucokinase and fructokinase for BC production and inhibiting the activities of gluconokinase and glucose-6-phosphate dehydrogenase in pentose phosphate metabolism for energy production [17,18,19,20,21,22].
Since the carbon sources have different molecular weights, chemical structure, and bioavailability, it can result in varied BC production rates and structural characteristics [12,23]. Among reported carbon sources, glucose is considered the main source for BC production, while fructose produces low yields of BC [14,16]. However, BC production abilities in different bacteria vary significantly, as do the BC properties [12,14,24,25,26]. Moreover, the existing studies mostly focus on the utilization of carbon sources rather than associated transformation mechanisms. Therefore, having an overview of the utilization efficiency of different carbon sources and the associated biochemical transformation pathways in a given BC-producing bacterium can provide good possibilities for optimization and improvement of BC production.
Our previous study reported a BC producer Komagataeibacter sp. W1, and the BC morphology, fibril distribution, purity, and functional groups were well characterized [3]. To understand how the strain synthesized BC in the presence of glucose, the draft genome sequence of W1 and the associated genes were also analyzed [3]. However, the BC synthesis using other carbon sources except for glucose is still unknown. In this work, the carbon sources, including acetate, ethanol, fructose, glycerol, lactose, mannitol, and sucrose were used to evaluate their potentials in BC production as compared to glucose. The full aims were to (1) compare BC productivity and characteristics by using different carbon sources; (2) reveal the corresponding biochemical pathways for the transformation of the above carbon sources.

2. Materials and Methods

2.1. Micro-Organism, Culture Media and Cultivation

Komagataeibacter sp. W1 used in this study was isolated from a vinegar fermentation tank in Quanzhou, China [3].
Hestrin–Schramm (HS) medium was used as the basic medium, which consisted of 2% glucose (C6H8O7·H2O), 0.5% yeast extract, 0.5% peptone, 0.68% Na2HPO4·12H2O, 0.115% C6H8O7·H2O and 0.051% MgSO4·7H2O [27]. The medium pH was adjusted to 6.0 using 1.0 M NaOH or HCl.
Before testing the effects of carbon sources on BC production in strain W1, the bacteria were pre-cultured in basic medium at 30 °C for 24 h under agitated condition (180 rpm) and at 30 °C for 7 days under static conditions. After that, the Erlenmeyer flask was vibrated rapidly to separate the bacteria from BC membranes. The established suspension was concentrated at 8000 g for 5 min to remove the residual glucose, followed by dilution in sterile Milli-Q to a total volume of 10 mL. Aliquots of re-suspension were transferred to a new 250 mL Erlenmeyer flask, which contained 100 mL HS medium with a final OD600 of 0.01. To evaluate the BC productivities in the media spiked with different carbon sources, glucose in HS medium was replaced with acetate (C2H4O2), ethanol (C2H6O), fructose (C6H12O6), glycerol (C3H8O3), lactose (C12H22O11), mannitol (C6H14O6), and sucrose (C12H22O11), respectively. The structures of various carbon sources used in this study are given in Figure S1. All setups were incubated at 30 °C for 14 days under static conditions.

2.2. BC Purification and Yield Calculation

The BC on the HS medium surface was collected and washed with Milli-Q water to remove medium components. To eliminate bacterial cells inside the BC membranes or on the BC surface, the samples were boiled at 100 °C for 2 h in a 0.1 M NaOH bath and anther 2 h in a Milli-Q water bath [3]. The pre-treated BC was soaked in Milli-Q water overnight at room temperature to remove all chemicals. After 24 h of storage at −80 °C, the BC was freeze-dried (FreeZone 6 plus, Labconco, Kansas City, MI, USA) for 24 h [3] and then, weighed.
BC production was recorded as the dry weight within the volume of medium in liter (g L–1) [28]. The BC yield was calculated by Equation (1):
Yield   ( % ) = m c e m c a × 100
where mce is dry weight of BC (g) and mca is the weight of carbon source spiked in media (g).

2.3. BC Characterization

Scanning electron microscopy (SEM, Quanta™ 250 FEG, FEI, Hillsboro, OR, USA), X-ray diffraction (XRD, Bruker D8 ADVANCE, Karlsruhe, Germany) and Fourier transform infrared (FTIR, Thermo Scientific Nicolet iS5, Waltham, MA, USA) spectroscopy were used to characterize BC.
Before analysis, the dried BC was treated by spray-gold and observed by SEM with the spot of 3.0, high voltage of 15 KeV and magnification of 2000×. Subsequently, 100 nanofibrils of the BC were used for diameter calculation by using a Nano Measurer 1.2 (Fudan University, Shanghai, China). In this study, each 10 nm was set as a group and the data were presented as % of total nanofibrils. To have a full prediction of theoretical diameter distribution, the statistical histograms were plotted by using OriginPro 9.0 (OriginLab Corporation, Northampton, MA, USA).
X-ray diffraction was performed by using nickel filtered copper Ka radiation (λ = 0.15406 nm) at a voltage of 40 kV and a filament emission of 30 mA, with 0.1° step, from 4° to 70° (2θ, angle). A silicon zero background plate was used to avoid any peak resulting from the sample holder. The established sample holder position and both of the holder and silicon zero background plate were used for XRD analysis [23]. The d-spacing between the crystal planes and an apparent crystal size (ACS) approximation were determined using Bragg’s law and Scherrer’s formula by Equations (2) and (3), respectively [2]:
d = λ 2 sin θ
ACS = 0.9 λ FWHM   cos θ
where λ is the wavelength of the X-rays, θ is the angle between the plane and the diffracted or incident beam (i.e., Bragg’s angle), and FWHM is the width of the peak at half the maximum height. FWHM was obtained by Integrated Peaks analysis based on the Peaks and Baseline module in OriginPro 9.0.
Crystallinity index (C.I.) and percentage of crystallinity (% crystalline) of BC were calculated by Equations (4) and (5) [29]:
C . I . = I m a I a m I m a
%   crystalline = I m a I m a + I a m × 100
where Ima is the maximum diffraction intensity of the lattice peak between 2θ of 22° to 23° and Iam is the minimum diffraction intensity of the amorphous peak (i.e., baseline) between 2θ of 18° to 19°.
In addition to SEM and XRD analyses, FTIR was also used to evaluate the BC characteristics based on information of the functional groups and peak annotations. Specifically, attenuated total refection (ATR) mode with 32 scans per measurement and a resolution 0.5 cm−1 in the range of 4000–400 cm−1 was carried out. Baselines for each sample spectrum were normalized and cellulose Iα content was calculated by Equation (6) [30]:
f α IR = A α A α + A β
where Aα and Aβ are the integrated intensities (i.e., the peak heights at 750 and 710 cm−1) of the contributions from celluloses Iα and Iβ, respectively.

2.4. Analysis of Biochemical Transformation Pathways Associated with Carbon Source Metabolisms

To have a full insight into the mechanisms of carbon source transformation and BC biosynthesis, all associated open reading frames (orfs) based on gene prediction and Kyoto Encyclopedia of Genes and Genomes (KEGG, Kyoto, Japan) pathway annotation were summarized. The information of the draft genome sequence and functional genes for this aim were given in the Sequence Read Archive (SRA) database (National Center for Biotechnology Information, NCBI, Bethesda, MD, USA) with the accession numbers PRJNA388252 (BioProject number), SAMN07173612 (BioSample number), and SRP108180 (SRA Study number), and the supplementary data of our previous study [3]. A comprehensive analysis was conducted by incorporating the key metabolic intermediates and associated enzymes responsible for carbon sources transformation and BC biosynthesis in different KEGG pathways. The schematic diagram of carbon metabolisms and BC biosynthesis pathways in Komagataeibacter sp. W1 was plotted by using Microsoft PowerPoint 2016.

2.5. Statistical Analysis

All experiments were conducted in triplicate. The data are presented as the mean value of the triplicate with standard error. Significant differences were determined according to two-way analysis of variance (ANOVA) by Tukey’s multiple comparisons test at p ≤ 0.05 using GraphPad Prism (Release 6.0, La Jolla, CA, USA).

3. Results and Discussions

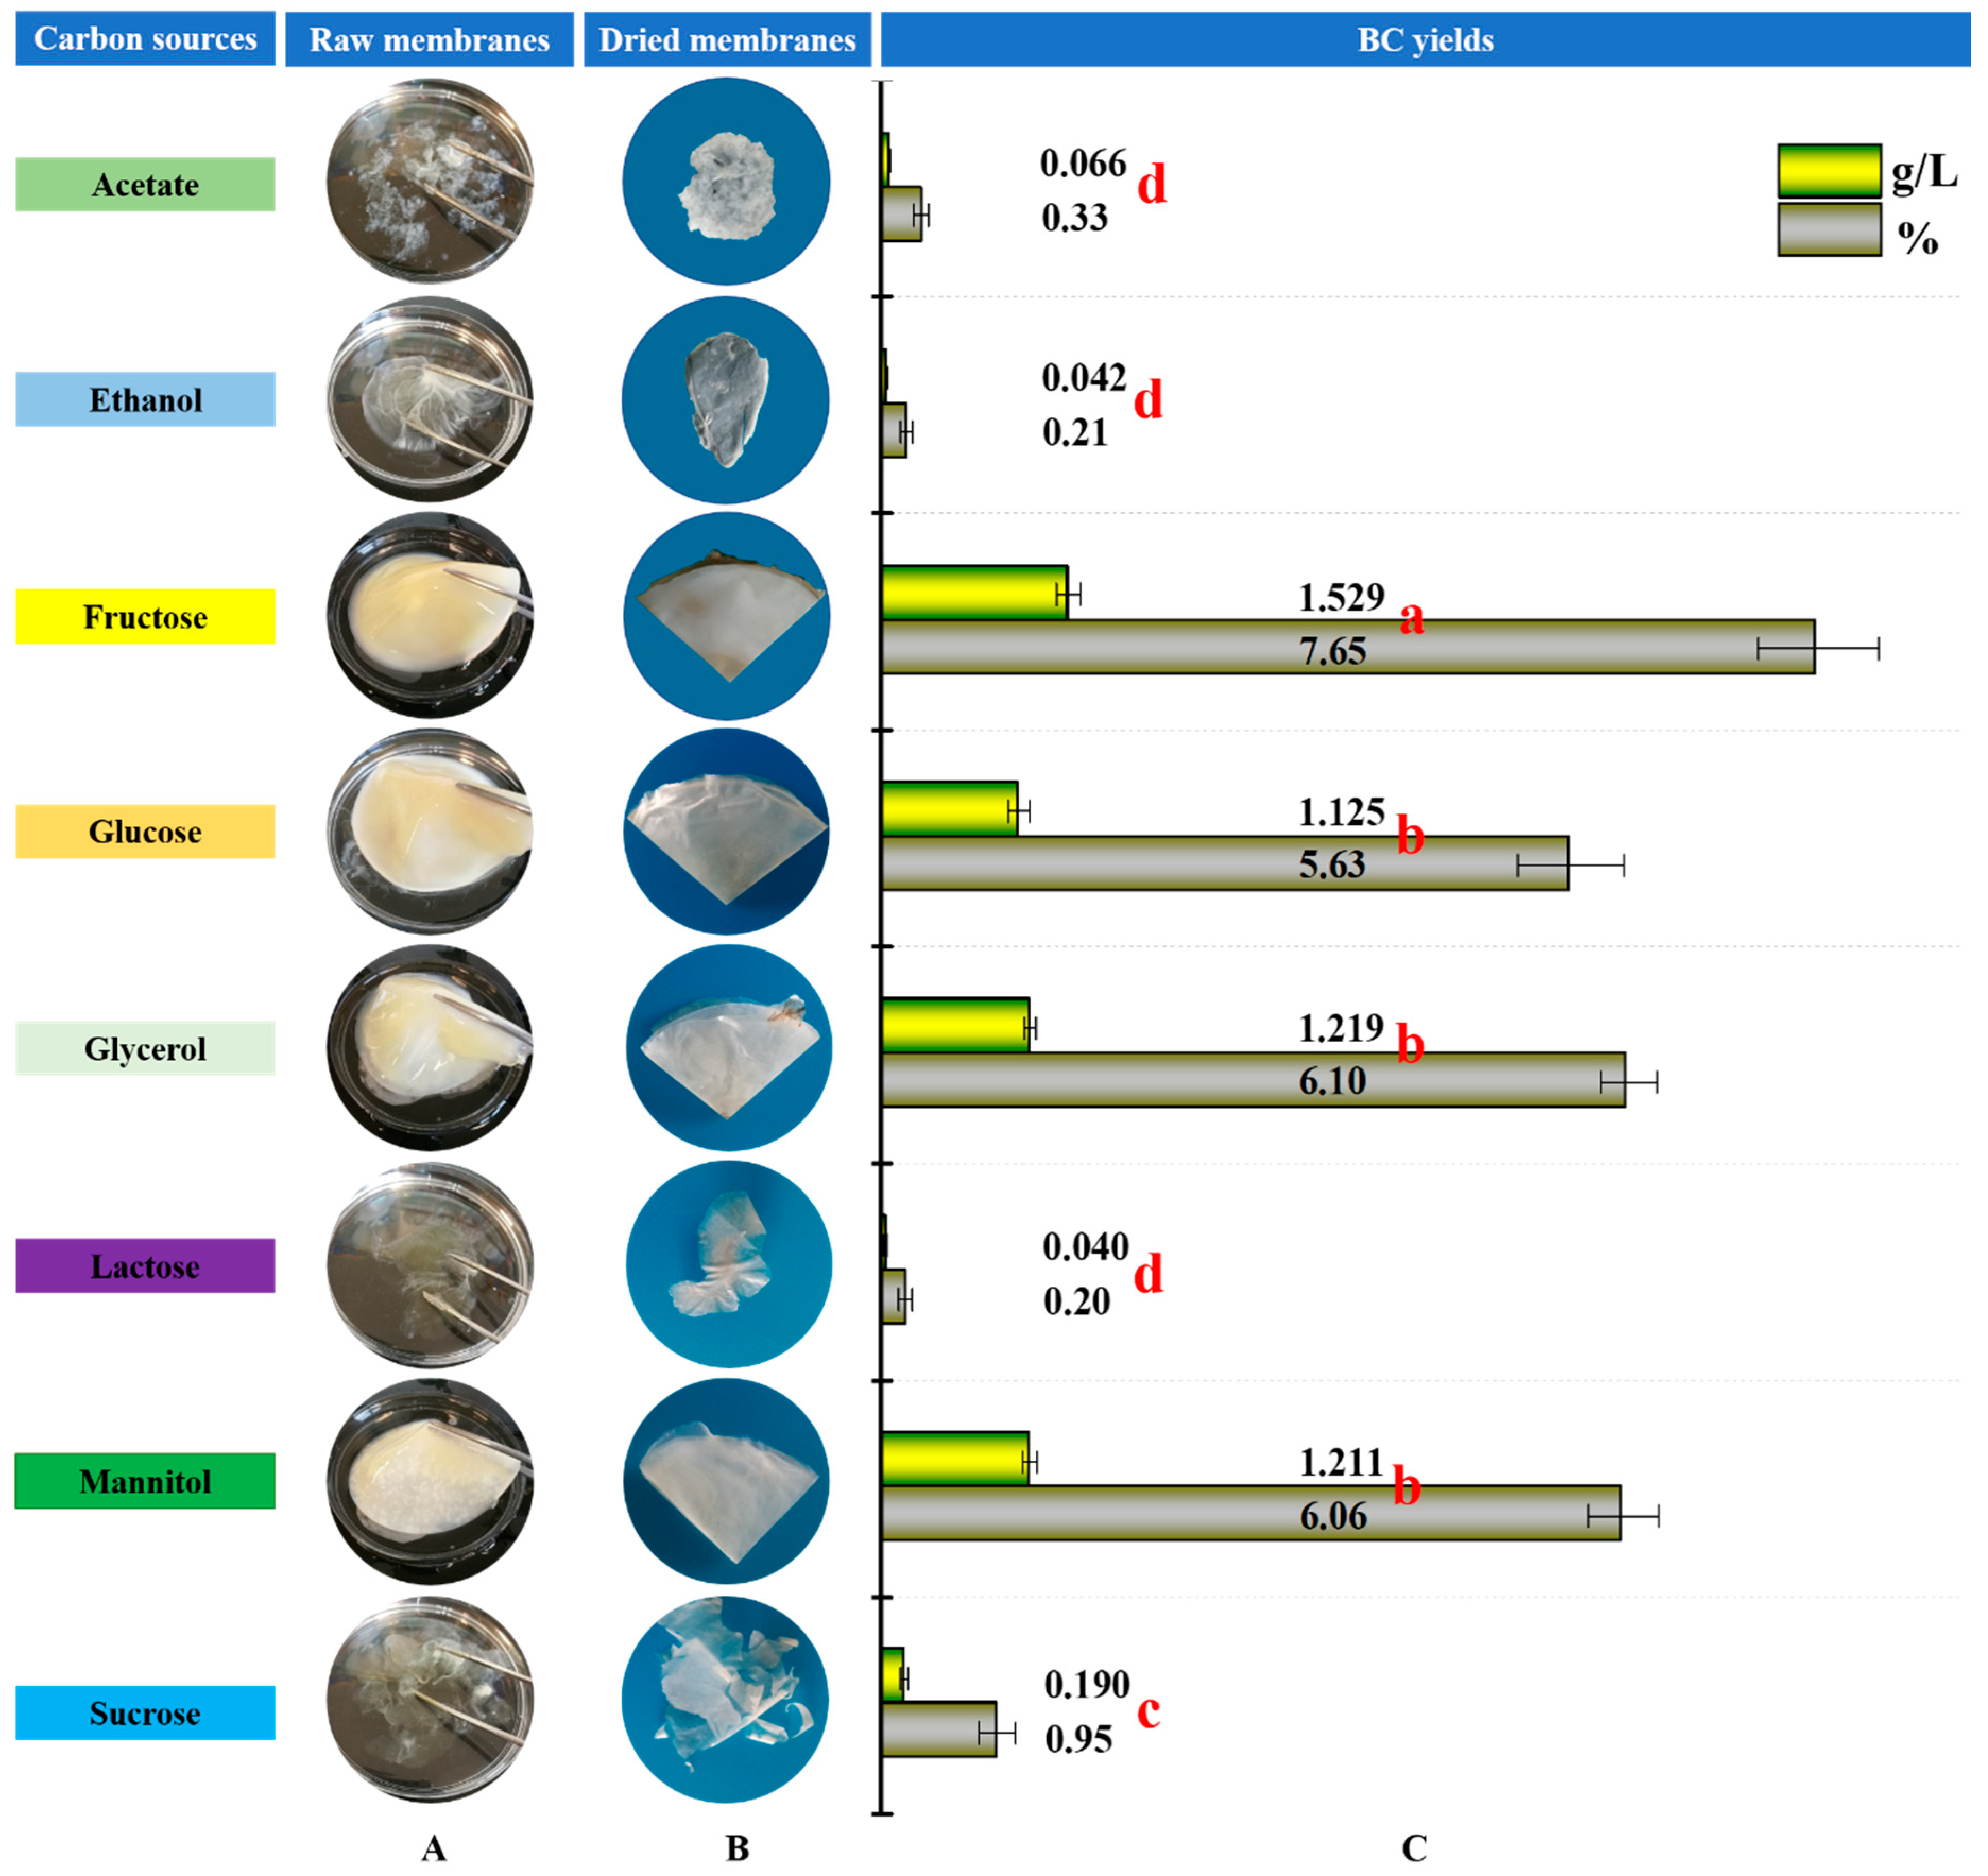
3.1. BC Production from Various Carbon Sources

BC production in micro-organisms is an interesting trait as this process consumes lots of energy to produce biomaterials rather than resulting in cell multiplication [31]. The possible purposes of BC production are to acquire oxygen, prevent ultraviolet damage, enhance antibiotic resistance, hold moisture, and maintain host-bacteria interactions [32,33,34]. Because glucose is the precursor for cellulose synthesis, all compounds that can be transformed to glucose are capable of BC production. Selection of the carbon substrates is one of the main requirements for efficient BC production [34]. Based on our previous study [3], the interest here in this study was to evaluate the potential of strain W1 in utilization of different carbon sources and subsequent BC production.
After 14 days of incubation at 30 °C, the BCs on the surface of media containing acetate, ethanol, fructose, glucose, glycerol, lactose, mannitol and sucrose were collected and pre-treated as previously described (see details in Section 2.2). As shown in Figure 1, all eight carbon sources used in this study produced BC; among which, fructose, glucose, glycerol and mannitol produced thick membranes, but the others produced irregular and thin membranes (Figure 1A). After freeze-drying, the membranes produced from fructose, glucose, glycerol, and mannitol had a smooth surface and good mechanical properties of typical BC, as did that of sucrose although the membrane content in this group was much lower than that in the former ones (Figure 1B). However, the dried BC membranes produced from acetate, ethanol and lactose were fragile and tough (Figure 1B), indicating that the composition and structure of the BCs might be different.
To compare BC productivity, the BCs were weighed and the yields were also calculated. Similar to the findings from Figure 1A,B, the higher BC weights were observed in the groups of fructose, glucose, glycerol, and mannitol, ranging from 1.125 to 1.529 g L−1 (Figure 1C). The values were 5.9–38 fold of those in the media containing acetate, ethanol, lactose or sucrose (≤0.190 g L−1; Figure 1C). Correspondingly, strain W1 transformed 0.20–7.65% of carbon sources to BC (Figure 1C), of which, the content in fructose was significantly higher than that in glucose, glycerol, and mannitol (p ≤ 0.05; Figure 1C). Similarly, apparent differences in other carbon sources were also observed (Figure 1C), suggesting that the ability of strain W1 to use different carbon sources varied significantly.
To make a comparable evaluation of BC productivity in strain W1, the carbon sources used for BC production and BC yields in representative bacterial strains were summarized (Table 1). Among reported carbon sources, glucose, fructose, and mannitol are best for BC production, which is in line with our findings (Table 1; Figure 1). In some cases, however, the BC-producing bacteria prefer to utilize sucrose, lactose or a mixture of xylose and xylulose, while other carbon sources have limited use for BC production (Table 1). One possible reason is that both the structural isomers of glucose (e.g., fructose) and the precursors of glucose (e.g., glycerol and mannitol) are easy to be transformed to glucose and enter the cycles of glucose phosphorylation, glucose-6-phosphate isomerization, UDP-glucose synthesis, and extension to form BC [35]. Unlike structural isomerization or small molecule splicing, enzymatic cleavage of disaccharides is also a good strategy to produce glucose (Figure S1), explaining why some bacteria have great efficiency in sucrose and lactose utilization for BC production [12,36]. Interestingly, strain W1 was the only producer having preference to utilize fructose among the genera Acetobacter, Gluconacetobacter, and Komagataeibacter (Table 1). In fact, this trait is often found in other genera such as Enterobacter [37] and Rhodococcus [38]. Although strain W1 did not have great capacity to utilize carbon sources for BC production (0.015–0.547% day−1; Table 1) as compared to other BC producers, its preference for fructose utilization could provide useful information for further investigations.
It is also worthy to note that the medium spiked with mannitol often produced higher BC than that with glucose [13,39,40], with the highest yield of 9.58% day−1 (Table 1). This is different from the view that glucose is considered to be the main source for BC production [14,16]. Additionally, for a certain strain, the BC yields under different cultivation conditions are greatly different. For example, G. xylinus PTCC 1734 has a relative yield of 0.947% day−1 under agitated conditions, but which rose to 2.5% day−1 under static conditions (Table 1), suggesting the significant effects of cultivation methods on BC production [12]. Between above two conditions, the most suitable carbon sources for BC production were sucrose and mannitol, respectively (Table 1). As regards the BC yields with different strains of K. xylinus (formerly A. xylinus or G. xylinus), the data vary from 0.071% to 5.29% day−1 (Table 1). The above mentioned observations suggest that there is no similar pattern of bacterial behavior to utilize carbon sources for BC production, selecting the most appropriate carbon source for BC production in an individual strain is very important [41].
In our study, all used carbon sources were sugars except for acetate and ethanol, which are well-known substrates responsible for enhancing ATP production and inhibiting the anti-BC production processes [17]. The studies focusing on acetate and (or) ethanol addition and their consequent effects on BC production have been well documented [17,18,19,20]. Although some studies have tried to produce BC using acetate or ethanol as a sole carbon source, the BC yields are much lower than for sugars [16,36]. This was supported by our study (Figure 1C; Table 1), implying that both acetate and ethanol mainly serve as BC-producing enhancers rather than transforming to BC directly.

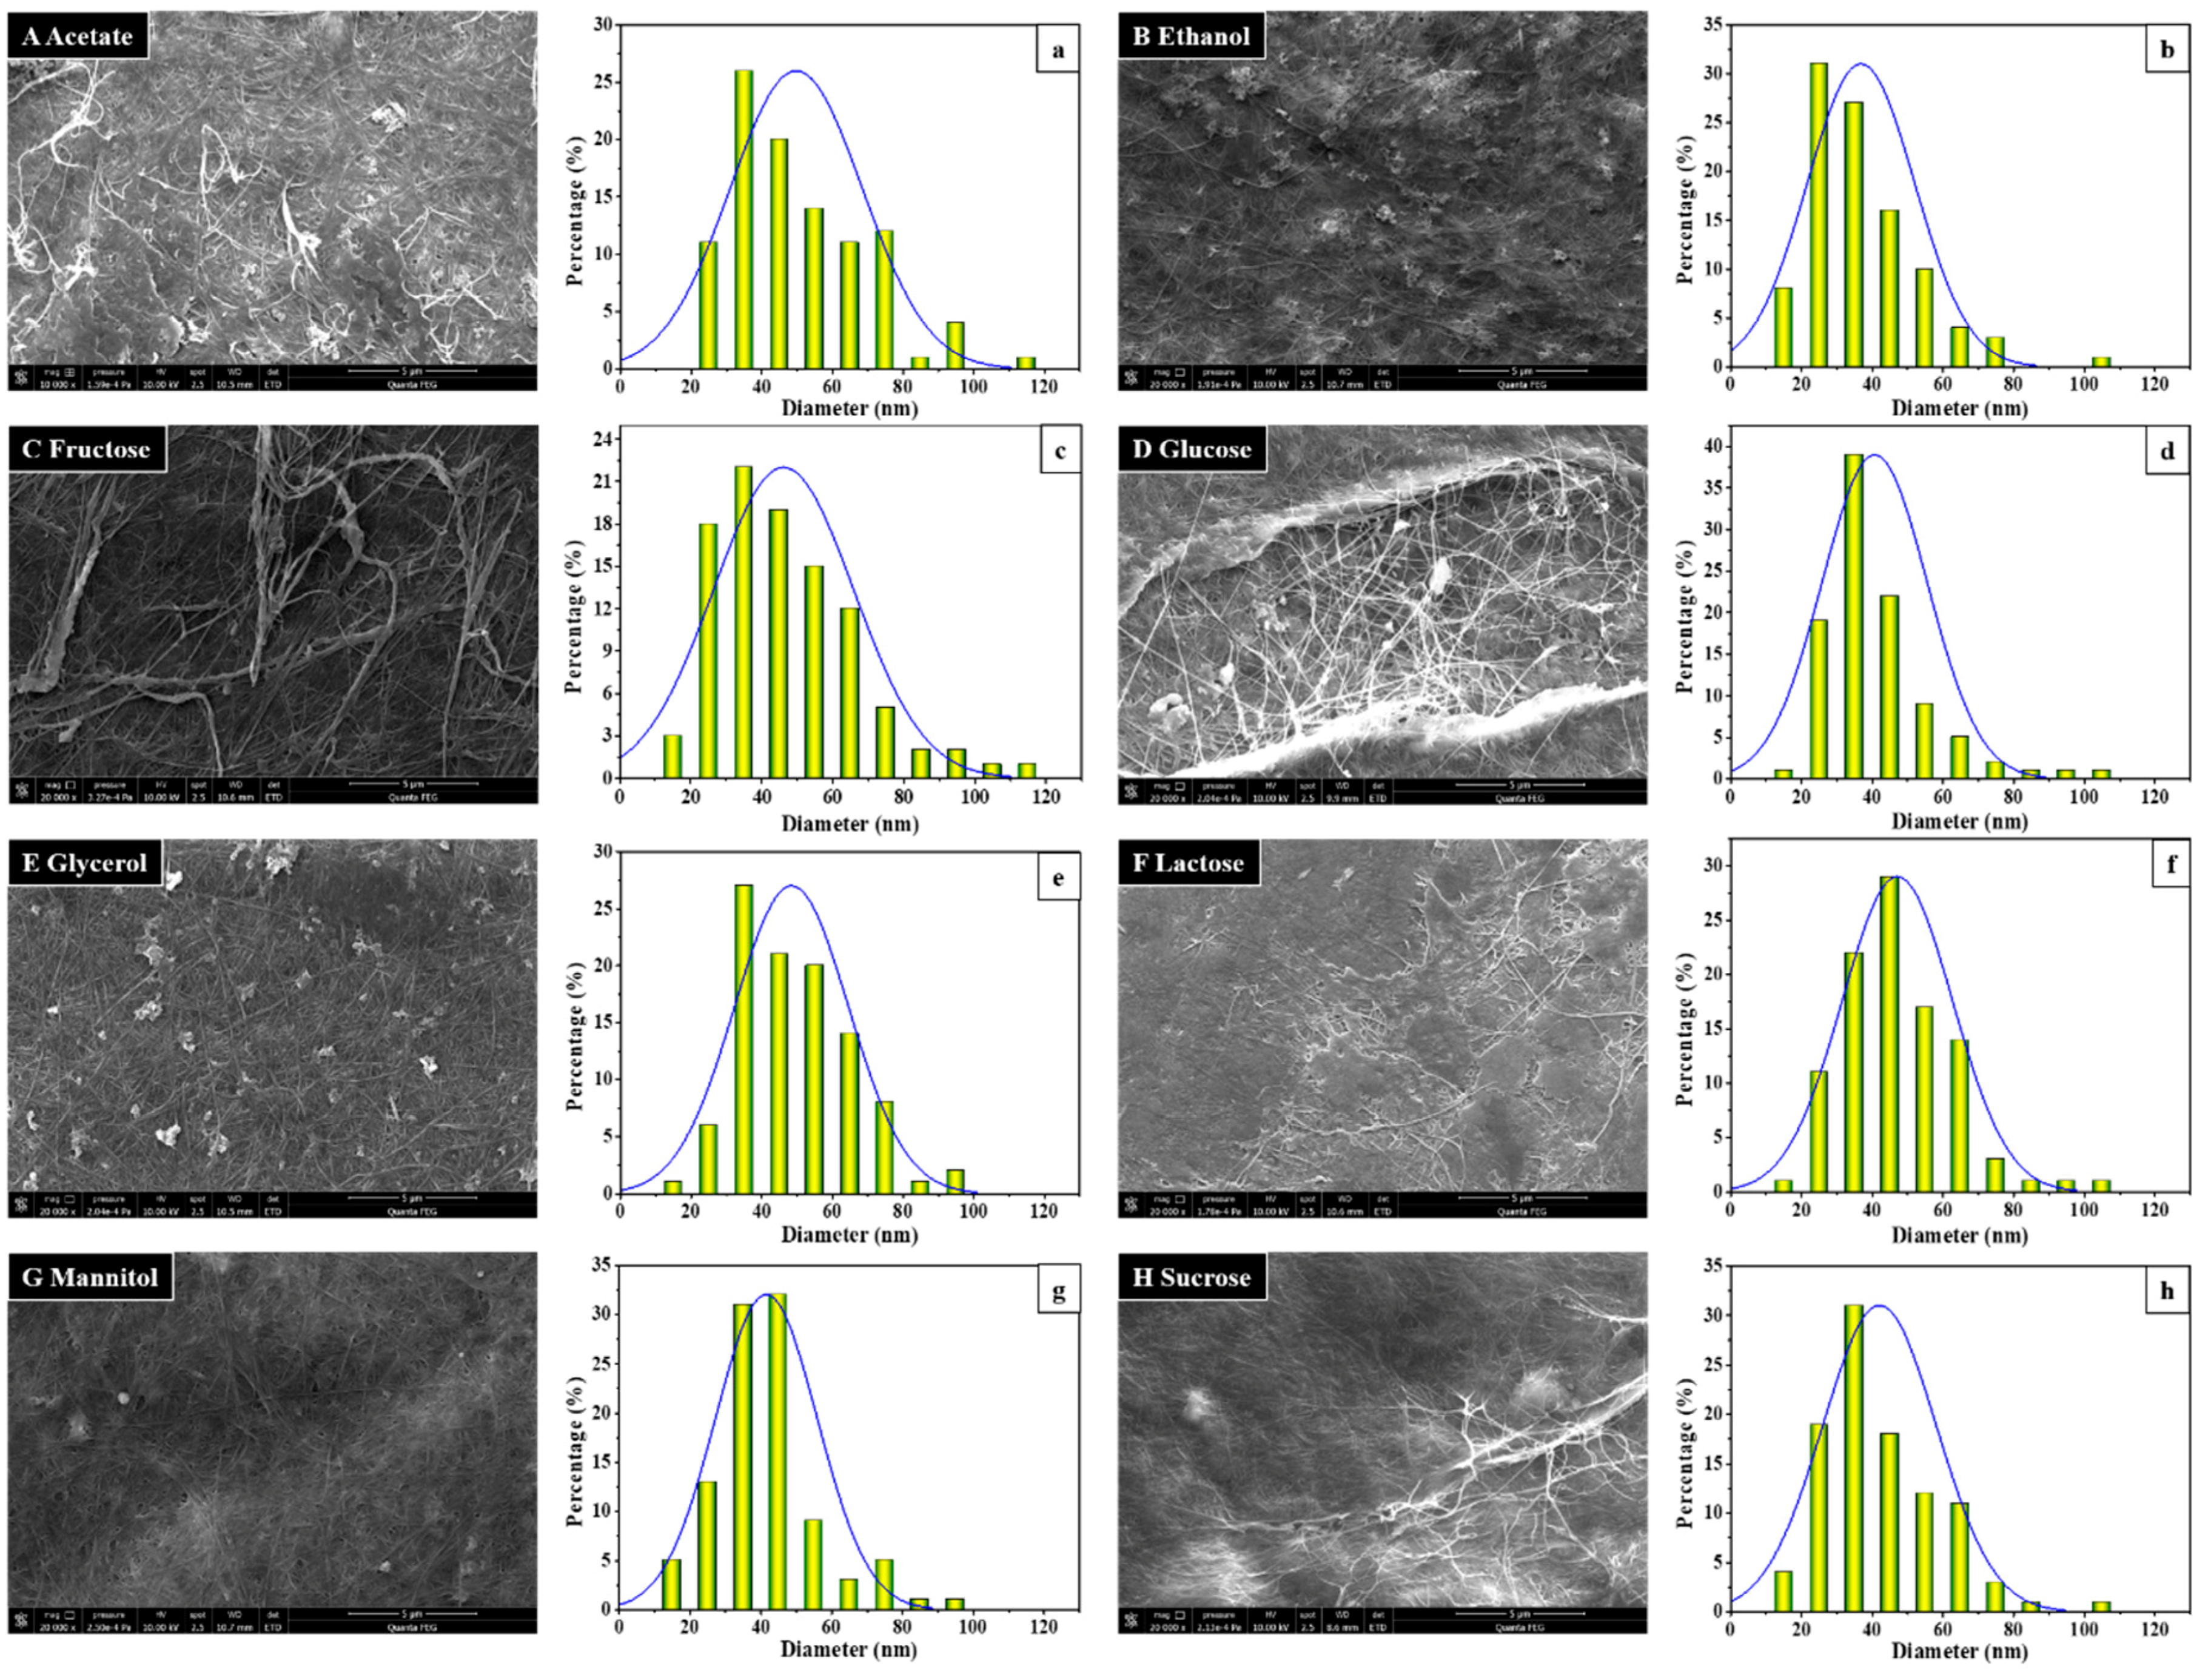
3.2. BC Morphology and Microfibril Analysis by SEM Observation

The morphology and structural characteristics of BC membranes produced by Komagataeibacter sp. W1 from various carbon sources were evaluated by SEM. As can be seen in Figure 2A–H, all carbon sources used in this study produced BC pellicles with a dense morphology. Our findings were similar to K. xylinus strains KX, TISTR 086, 428, 975, 1011, and B-12068 [12,47] but different from K. medellinensis and K. xylinus CH001 [2,19], the latter two produced a less dense network of microfibrils with high porosity of up to 60%. This indicates that different bacteria or bacterial strains may have a different interwoven pattern to produce BC.
Due to the indistinguishable differences in BC morphology, we also calculated the BC diameter distribution by Nano Measurer 1.2 based on SEM images. The results showed that all carbon sources could produce 30 nm or smaller microfibrils, with an average diameter of 40–50 nm except for ethanol (Figure 2a–h). Our data were in line with the study from Volova et al. [47], suggesting that the small microfibrils were also likely to be associated with a lower density of BC as described previously. It was apparent that the visible component of BC in our study was cellulose ribbons (often 40–60 nm) rather than nanofibrils because the diameter of the sub-elementary fibrils is 3–4 nm [49,50]. Although the appearances of BCs produced from acetate, ethanol, lactose, and sucrose were different from other substrates (Figure 1), both SEM imaging and diameter distribution analysis verified that all carbon sources used in this study produced typical BC (Figure 2). However, the reasons influencing BC production efficiency in Komagataeibacter sp. W1 still warrant future investigations.

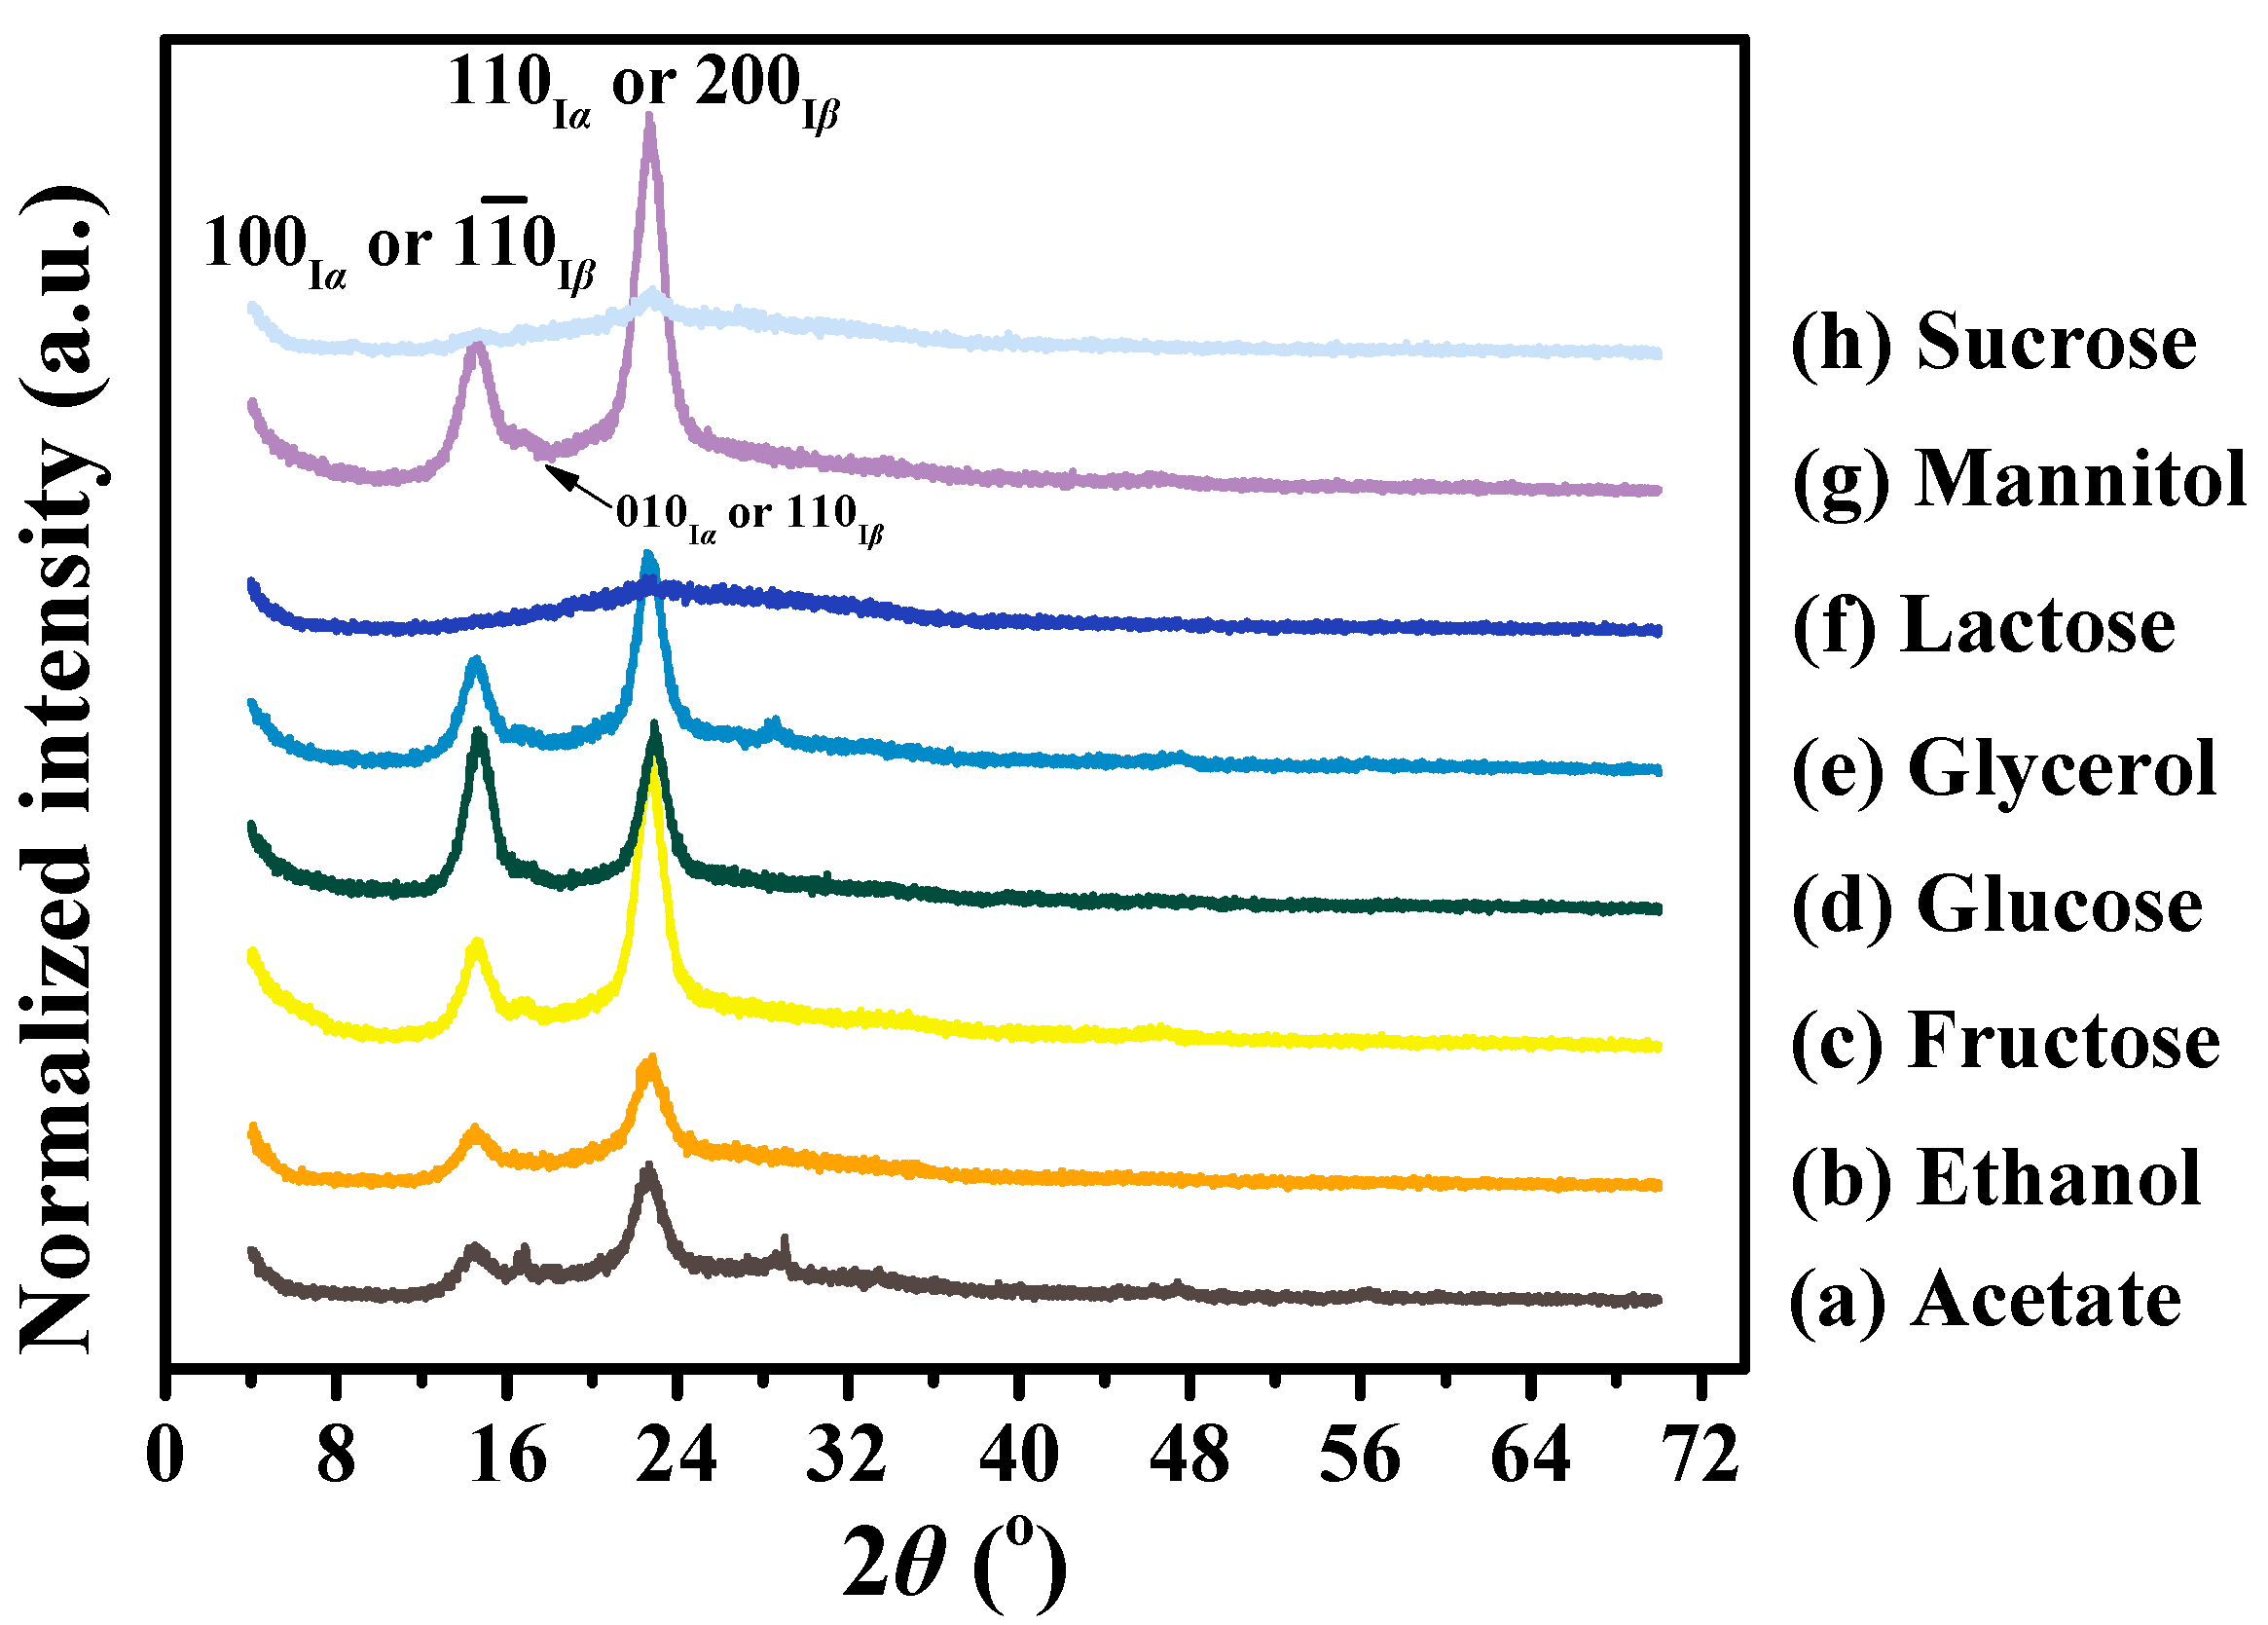
3.3. Crystalline Differences of BC Membranes Produced from Various Carbon Sources

It is well-known that BC is a homogeneous polycrystalline macromolecular compound composed of ordered crystalline and less ordered amorphous regions [51]. To determine the crystal structure and the crystalline contents of BC, all samples were analyzed by XRD. Figure 3 shows that different carbon sources result in different diffraction profiles. Specifically, the BCs produced from fructose, glucose, glycerol, and mannitol displayed two typical peaks at 2θ of 14.5° and 22.7° with strong intensity and a weak peak at 2θ of 16.6° (Figure 3c–e,g). While the two broad peaks were assigned to (100) and (110) planes of cellulose Iα or (1 1 ¯ 0) and (200) planes of cellulose Iβ, respectively, the weak peak indicated the presence of the (010) plane of cellulose Iα or the (110) plane of cellulose Iβ (Figure 3) [52]. The higher intensity of the peak 14.5° than that of the peak 16.6° made it clear that the content of Iα was higher than Iβ [53] and the shape of the cellulose crystallites was rectangular rather than square cross-sectional [51], in agreement with the cases of Singhsa et al. [12] and Keshk and Sameshima [54]. It was interesting to note that although acetate and ethanol produced limited BCs, they showed a similar XRD pattern to the BCs produced from the above-mentioned sugars (Figure 3a,b). However, only one weak peak was observed on BC membranes produced from lactose and sucrose (Figure 3f,h). At around 2θ of 28.6°, a weak peak was found in the acetate and glycerol groups, which has been scarcely reported and needs further investigations (Figure 3a,e). Our data indicated that all carbon sources could produce BC with high crystallinity except for lactose and sucrose.
As shown in Table 2, the interplanar crystal distance (i.e., d-spacing) of each peak of most of the BCs was the same, assuming that peak shifts at 2θ of 14.5o did not occur and different BCs had the same contents of cellulose Iα [23]. Due to the absence of the (100) or (1 1 ¯ 0) peak in the lactose group and the (010) or (110) peak in ethanol, lactose and sucrose groups, all the corresponding d-spacing and ACSs were not available (Table 2). Unlike d-spacing, however, the ACS varied significantly in different groups (Table 2). For instance, the ACSs of peak 1 in fructose, glucose, glycerol, and mannitol were similar, at 7.9–8.8 nm, which reduced to 6.7–6.9 nm in acetate and ethanol and increased to 23.6 nm in sucrose (Table 2). The lower or higher ACSs in acetate, ethanol, lactose, and sucrose might be attributed to the irregular textile structures of BC microfibrils (Figure 1 and Figure 2). Similar to peak 1, most BCs had a typical ACS in peak 3, but the ACSs in lactose and sucrose were much lower than that in the others (Table 2). However, since peak 2 was weak, the corresponding ACSs did not follow similar trends as for peak 1 and peak 3 (Figure 3; Table 2), which again verified the high contents of Iα in all groups as previously described.
Besides d-spacing and ACS, we also determined C.I. and% crystalline of BC samples produced from different carbon sources. In general, the C.I. ranged from 0.64–0.89, the highest and the lowest being in mannitol and lactose, respectively (Table 2). Correspondingly, all BCs had a high crystallinity ranging from 83–90% except for 73% for lactose and 74% for sucrose, respectively (Table 2). This followed similar trends as for d-spacing and ACS (Table 2) but was different from BC yields (Figure 1). Moreover, our data showed a similar crystallinity to that reported by previous studies [2,14,23]. In most cases, a lower ACS corresponded to a higher BC crystallinity (Table 2), which was supported by a recent study from Meza-Contreras et al. [55]. Because the peak corresponding to the (200) lattice plane often shows the highest intensity in the diffraction patterns of native BC (Figure 3) and plays an important role in higher crystallinity and smaller crystallite size [19], mannitol could be an ideal carbon source for BC production in Komagataeibacter sp. W1.

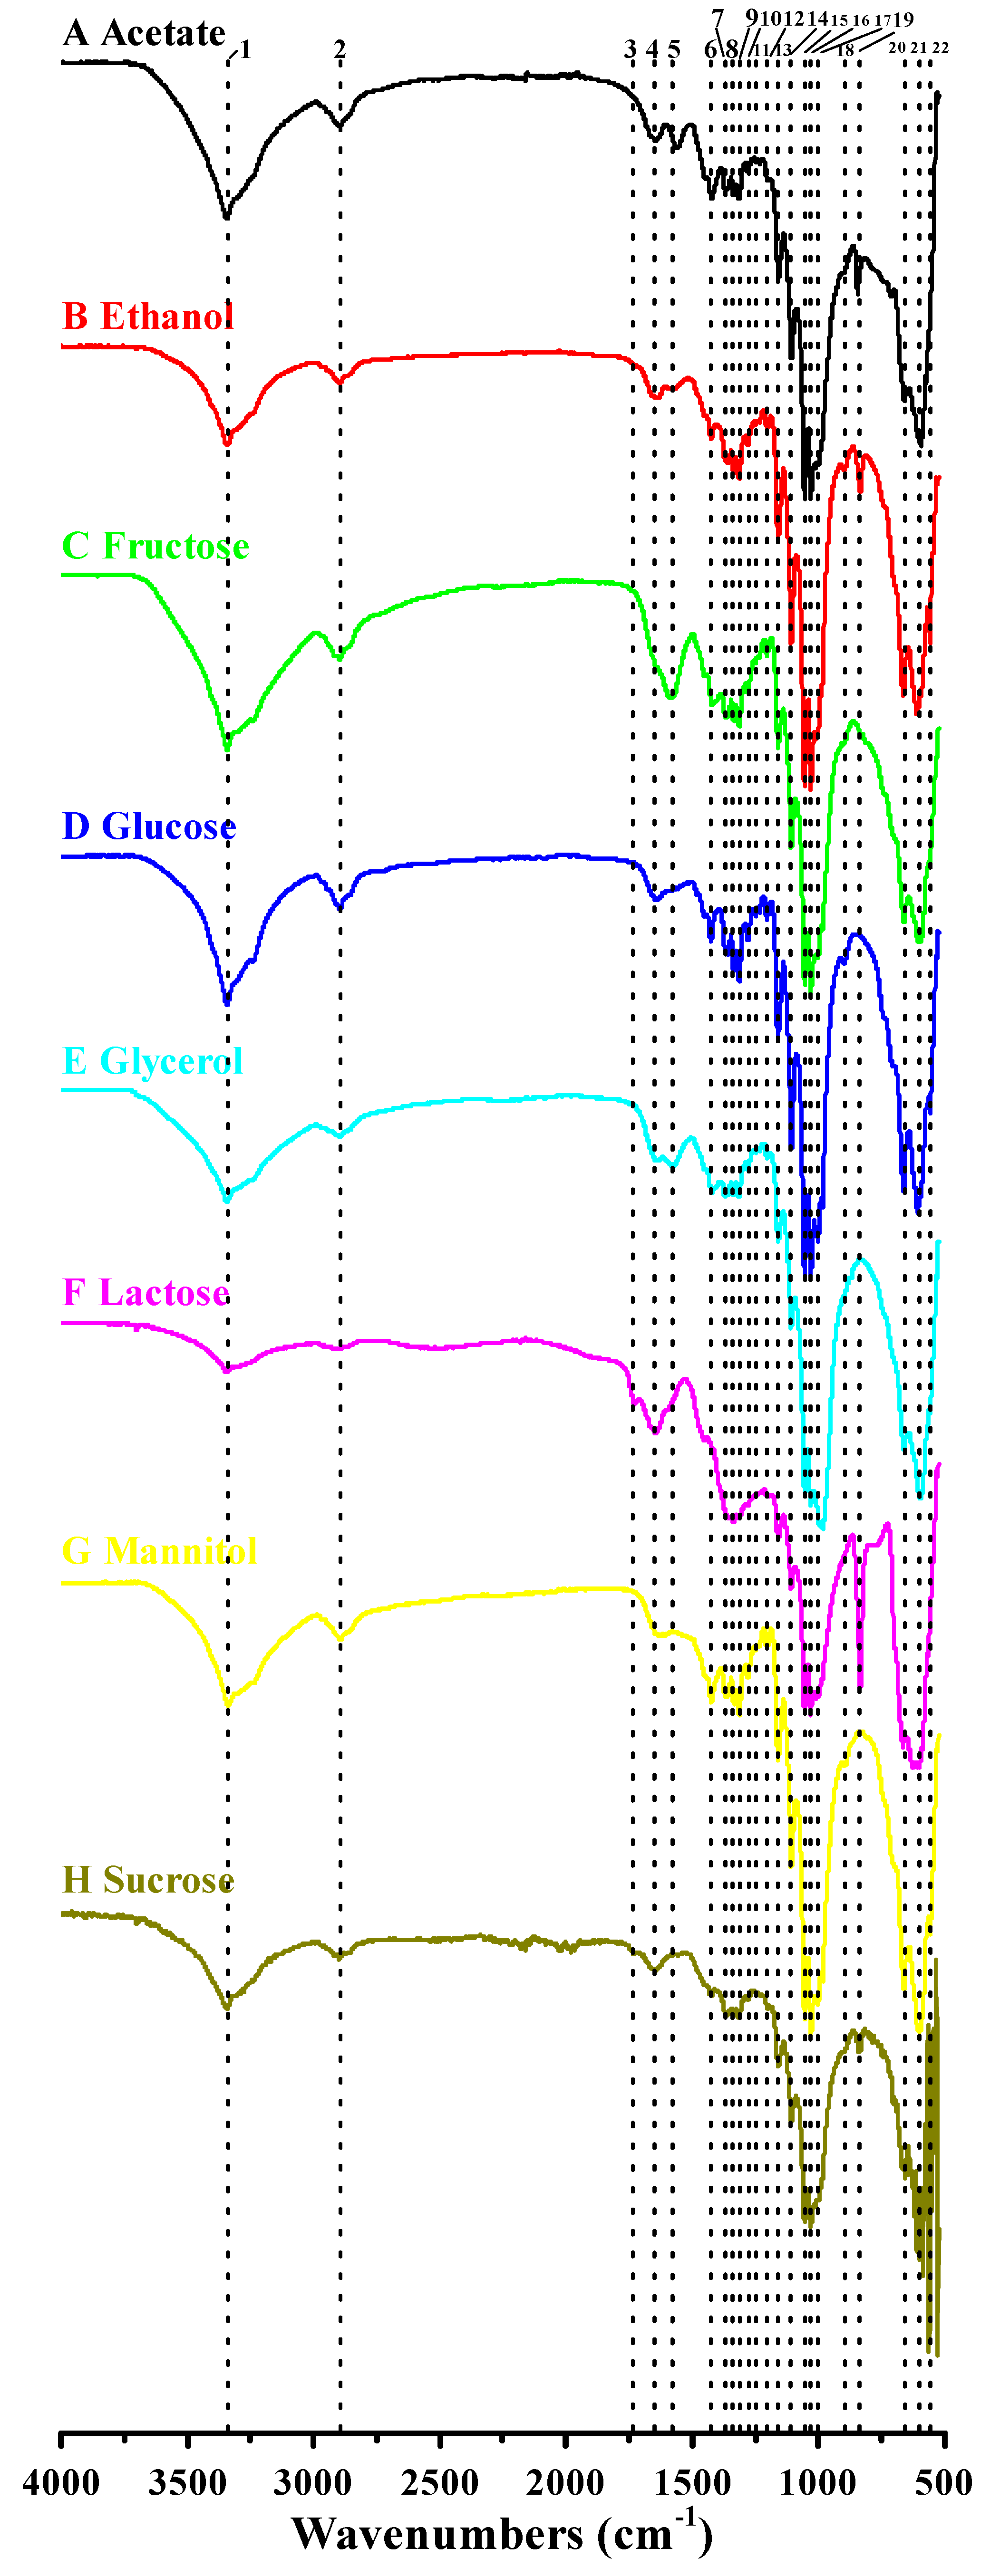
3.4. Functional Groups and Cellulose Types Characterization Based on FTIR Analysis

The FTIR spectra of BCs prepared from different carbon sources are shown in Figure 4. Although different carbon sources resulted in great differences in BC yields (Figure 1C), and XRD patterns of BCs also varied significantly (Figure 3), all FTIR spectra exhibited several typical vibration bands with little difference (Figure 4), implying the same chemical structure for the different BCs prepared from various carbon sources [2]. Of the 22 peaks, most have been assigned to certain functional groups in previous studies. For example, several typical adsorptions associated with O–H stretching at around 3345 cm−1, C–H stretching at around 2900 cm−1, C–O–H antisymmetric bridge stretching of 1,4-β-glucoside at around 1160 cm−1 and antisymmetric out-of-phase ring stretching of β-glucosidic linkages between glucose units at around 900 cm−1 were observed (Figure 4; Table 3). Similarly, we also found other adsorptions due to O–H bending at around 1360, 1280, and 1205 cm−1, O–H in-plane bending at around 1430 and 1335 cm−1, C–O bending at around 1108, 1055, and 1031 cm−1, and O–H out-of-phase bending at the wavenumbers below 660 cm−1 (Figure 4; Table 3). However, the adsorptions at 1430, 1335, 1108, 1055, and 1031 cm−1 might also be assigned to CH2 symmetric bending, C–H deformation, C–C bonds of the monomer units of polysaccharide, and C–O–C pyranose ring skeletal vibration, respectively (Table 3). Our study revealed that the BCs produced by Komagataeibacter sp. W1 were mostly composed of cellulose I (adsorptions at around 3345, 1430, 1160, and 900 cm−1) with few cellulose II (adsorption at around 1335, 1315, and 1280 cm−1 and a blue-shift of wavenumber from 1430 to around 1425 cm−1) (Table 3) [3].
As noted previously, BC characterization is often performed by using XRD and 13C-NMR methods [46,55,56]. However, due to the overlap of cellulose Iα and Iβ reflections, it is difficult to differentiate the two allomorphs by only determining the XRD peak positions [12]. Molina-Ramírez et al. [2] showed that the FTIR could help distinguish Iα allomorph (around 3240 and 750 cm−1) from Iβ allomorph (around 3270 and 710 cm−1). The Iα fractions of BCs produced from fructose, glucose, and sucrose in K. medellinensis were from 0.70 to 0.74 [2], which were higher than A. xylinus 23769 of 0.36–0.43 [23], A. xylinus strains ATCC 10245, IFO 13693, IFO13772, IFO13773, IFO14815, and IFO15237 of 0.38–0.43 [54], and Komagataeibacter sp. W1 of 0.51 for all groups in our study. However, our data were in accordance with the well-known fact that for Iα it is as high as about 64% in BC [57]. We hypothesized that strain W1 possessed the capacity to produce both allomorphs at the same time, and the ability to produce Iα and Iβ was stable irrespective of the spiked carbon sources.

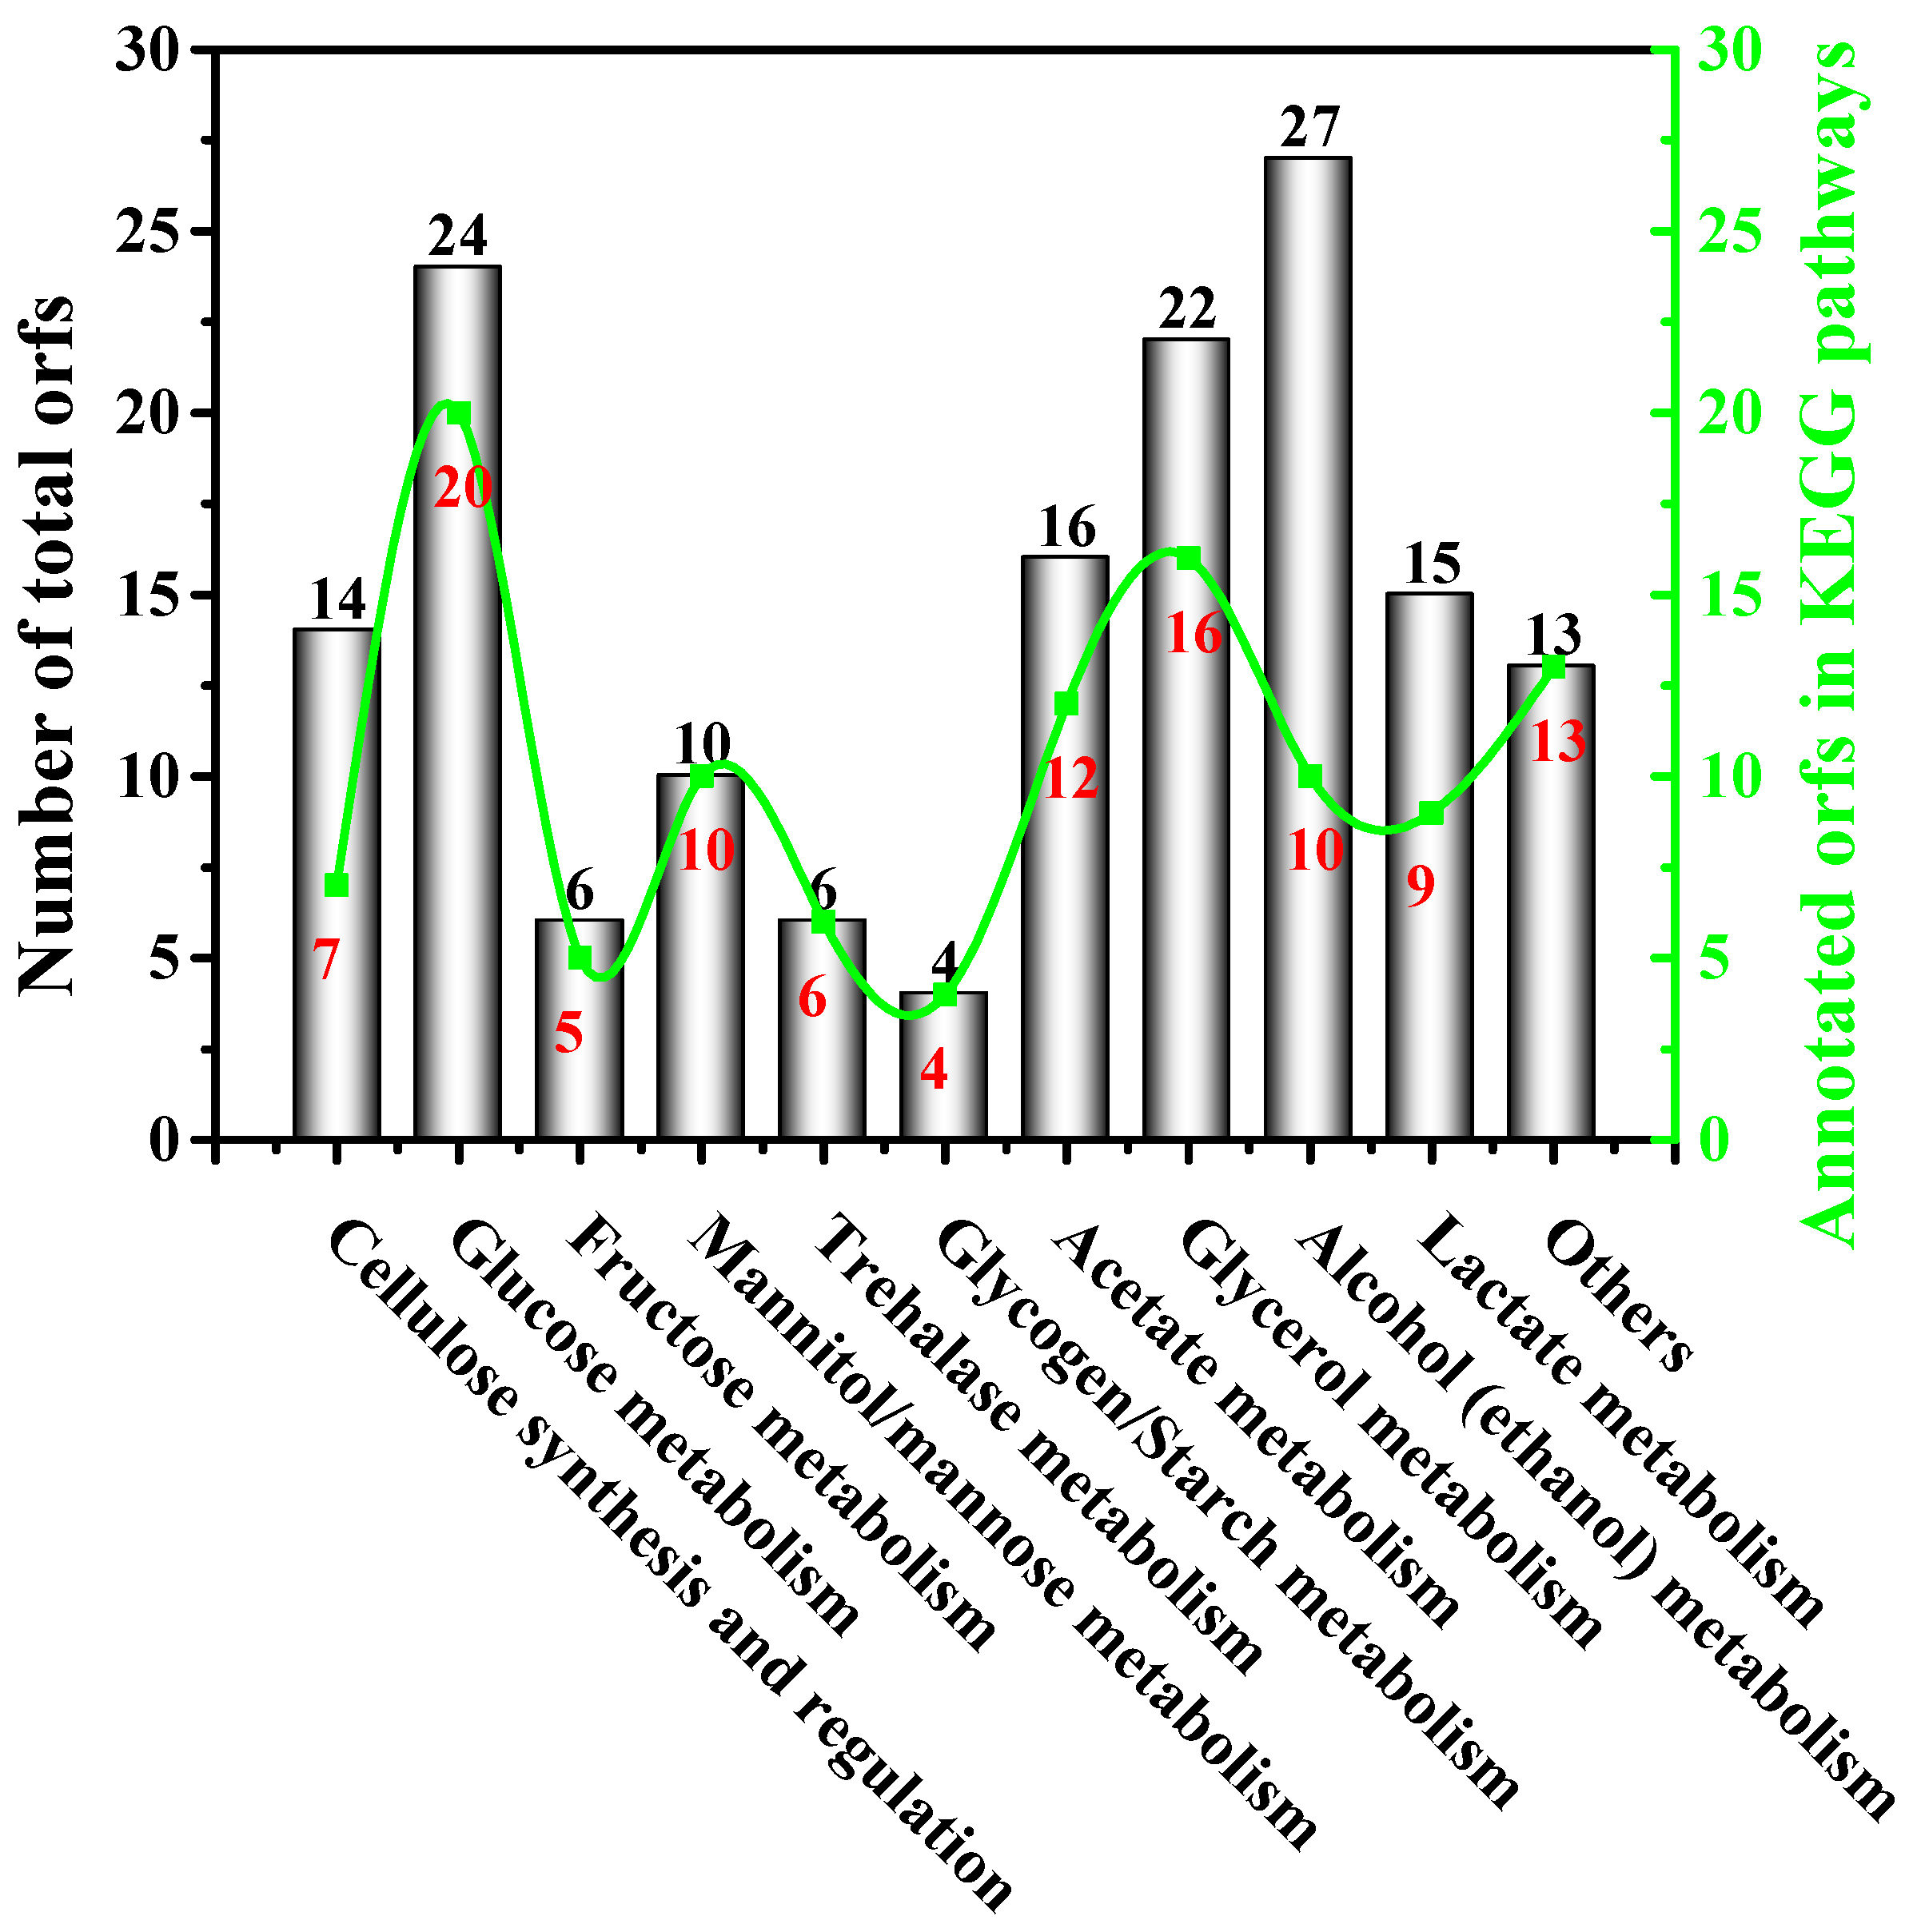
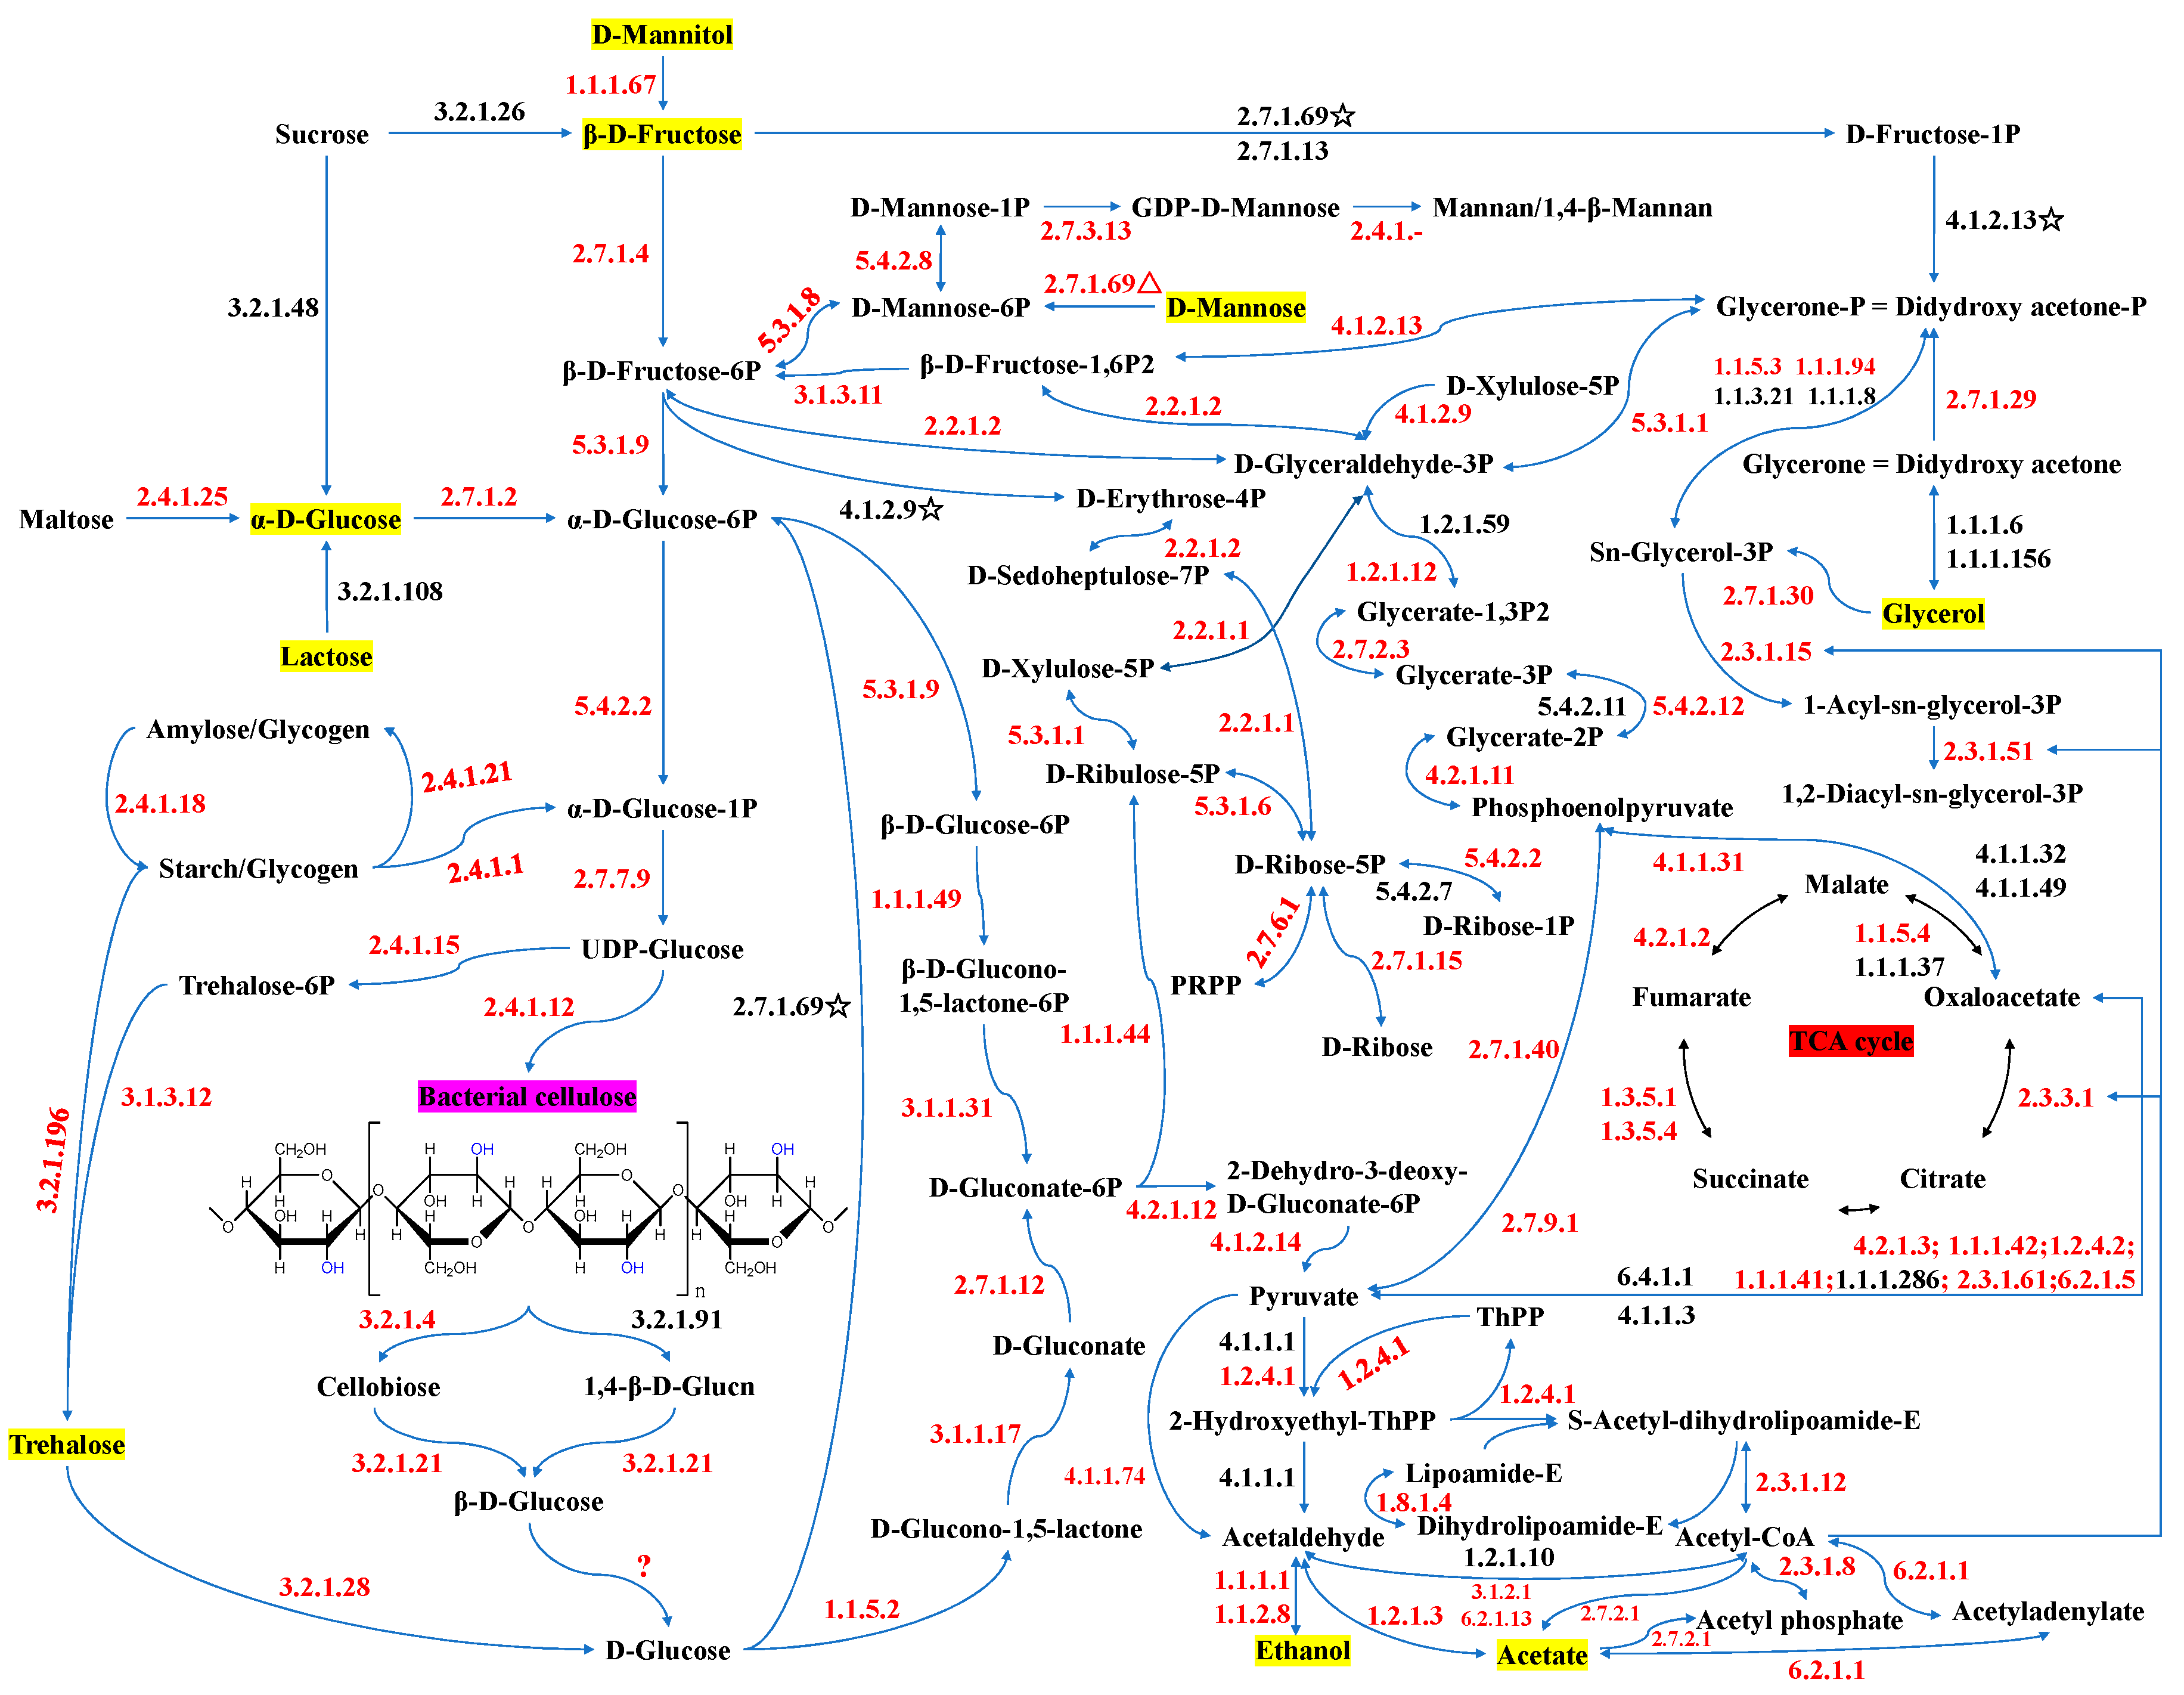
3.5. Insights into the Biochemical Pathways for Carbon Sources Utilization and BC Synthesis

In micro-organisms, several metabolic pools are involved in BC biosynthesis. One direct pathway to produce BC is to pre-generate hexose phosphate by the phosphorylation of exogenous hexoses [35]. To this aim, the isomers fructose and glucose are ideal carbon sources for BC production, which was supported by our findings (Figure 1 and Figure S1). As to other carbon sources, transforming to the above two hexoses is the first and important step to produce BC through the pentose cycle and gluconeogenic pathway [58]. In addition to physio-biochemical observation and evaluation of BC synthesis in micro-organisms, it is also important to understand the metabolic network of carbon sources [41]. However, this is scarcely reported in existing studies.
Our previous study obtained the genome information of strain W1 and annotated some associated enzymes in glucose transformation and BC synthesis [3]. To explore how strain W1 utilized other carbon sources and then produced BC, this study also summarized the orfs responsible for various carbon source metabolisms and BC production. As shown in Figure 5 and Table S1, strain W1 had 157 orfs corresponding to various carbon source metabolisms, most of which had been studied in this work except for mannose, glycogen/starch, and trehalose. In fact, besides those orfs responsible for encoding the enzymes involved in direct glucose transformation and cellulose synthesis and regulation, we also found more indirect orfs aiming for these processes (Table S1). In general, strain W1 had 27 orfs associated with alcohol (ethanol) metabolism, being the highest among 11 groups, followed by glucose metabolism of 24 and glycerol metabolism of 22 (Figure 5). This was understandable because strain W1 was an acetic bacterium used for vinegar production (alcohol metabolism) and a typical BC-producer capable of BC production (glucose metabolism) [3]. Unlike normal carbon substrates, glycerol not only can be transformed to glucose, it is also easily degraded and used as a source of energy to enhance the TCA cycle [23,24,41]. It was interesting to note that both orfs corresponding to fructose and mannitol metabolism were less than for the others except for trehalose and glycogen/starch (Figure 5). Apparently, the number of orfs did not follow the trend of BC productivities as described previously (Figure 1C), suggesting that carbon source metabolism might also be impacted by other factors such as enzymatic activity, substrate preference, and metabolic fluxes [2,59].
To have a full understanding of carbon source metabolism and BC production in strain W1, we further provided an overview of the orfs that could be annotated to certain KEGG pathways (Figure 5; Table S2). Based on the coupling analysis of the orfs-KEGG pathway, the schematic diagram of carbon source metabolism and BC biosynthesis pathways in Komagataeibacter sp. W1 were also provided (Figure 6). As expected, most orfs could be annotated to a certain KEGG pathway (Figure 5), and all corresponding enzymes are given in Table S2 and labeled in Figure 6. Specifically, fructose, mannitol, and glycerol could be enzymatically transformed to glucose, and then produce BC, through the pentose phosphate pathway or gluconeogenesis pathway [59], but lactose and sucrose did not (Figure 6). Although acetate and ethanol were able to generate acetyl coenzyme A (acetyl-CoA) and functioned in the TCA cycle and glycerol transformation, we did not find any possible pathway linking them to glucose or other sugars (Figure 6). Since media glucose was removed before seed solution transfer, it was possible that both acetate and ethanol were not the precursors of glucose and the few BCs observed in our study might be due to the release of cell glucose and subsequent BC production (Figure 1). We also noticed that glycerol, mannitol, and fructose had two pathways (i.e., the pyruvate pathway and glycerate-phosphate pathway) to produce oxaloacetate and enter the TCA cycle [24], thereby enhancing energy generation and carbon sources utilization for BC production (Figure 1 and Figure 6). However, our results were different from Molina-Ramírez et al. [2] in that glucose obtained 86% higher BC than fructose, again showing that different bacterial strains had different traits for carbon source utilization and BC production (Table 1).

4. Conclusions

In this study, Komagataeibacter sp. W1, which is a typical BC-producer, was subjected to media spiked with various carbon sources including acetate, ethanol, fructose, glucose, lactose, mannitol, and sucrose and the BC productivity, BC characteristics and biochemical transformation pathways associated with carbon source transformation and BC production were investigated. This strain preferred to use fructose, glucose, glycerol, and mannitol for BC production, with the highest BC yield being 1.529 g L−1 on fructose. SEM analysis suggested that the membranes produced from all carbon sources were composed of nanofibrils with an average diameter of 35–50 nm, which is a typical characteristic of BC, consistent with the results from XRD and FTIR analyses. Based on genome annotation and KEGG analysis, all biochemical transformation pathways associated with the utilization of and BC production from fructose, glucose, glycerol, and mannitol were found. Our data provided suggestions to further investigations of strain W1 to produce BC by using the above carbon sources and gave clues on understanding how this strain produces BC at the metabolic pathway scale.

Supplementary Materials

The following are available online at https://www.mdpi.com/2073-4360/10/9/963/s1, Figure S1: Structures of various carbon sources (A–H) and bacterial cellulose (I), Table S1: Open reading frames and corresponding proteins information based on NCBI non-redundant protein (Nr) and Swissprot annotations, Table S2: Open reading frames and corresponding proteins information based on KEGG pathway annotation.

Author Contributions

Conceptualization, S.-S.W., Y.-H.H. and D.-C.Z.; Data curation, S.-S.W., Y.-H.H. and D.-C.Z.; Funding acquisition, S.-S.W., Y.-H.H. and D.-L.C.; Investigation, S.-S.W., J.-L.C., Y.-X.Y. and X.-X.S.; Methodology, D.-L.C. and M.L.; Supervision, D.-L.C. and M.L.; Writing—original draft, S.-S.W., Y.-H.H., D.-L.C. and M.L.; Writing—review & editing, S.-S.W., Y.-H.H., J.-L.C., D.-C.Z., Y.-X.Y., X.-X.S., D.-L.C. and M.L. The authors S.-S.W. and Y.-H.H. equally contributed to this work and can be considered co-first authors.

Acknowledgments

This research was funded by the Science and Technology Program of Fujian Province (2017Y0027), the Education Department Fund of Fujian Province (JAT170144), the Key Technology Research and Development Platform of Synthetic Resin Functionalization of Fujian Province (2014H2003) and the Key Research and Development Platform of Advanced Polymer Materials (2016G003), the Special Fund of Quangang Petrochemical Research Institute of Fujian Normal University (2017YJY13) and the Hong-Wu Weng Original Fund of Peking University.

Conflicts of Interest

The authors declare no conflict of interest.

References

  1. Velásquez-Riaño, M.; Bojacá, V. Production of bacterial cellulose from alternative low-cost substrates. Cellulose 2017, 24, 2677–2698. [Google Scholar] [CrossRef]
  2. Molina-Ramírez, C.; Castro, M.; Osorio, M.; Torres-Taborda, M.; Gómez, B.; Zuluaga, R.; Gómez, C.; Gañán, P.; Rojas, O.J.; Castro, C. Effect of different carbon sources on bacterial nanocellulose production and structure using the low pH resistant strain Komagataeibacter medellinensis. Materials 2017, 10, 639. [Google Scholar] [CrossRef] [PubMed]
  3. Wang, S.-S.; Han, Y.-H.; Ye, Y.-X.; Shi, X.-X.; Xiang, P.; Chen, D.-L.; Li, M. Physicochemical characterization of high-quality bacterial cellulose produced by Komagataeibacter sp. strain W1 and identification of the associated genes in bacterial cellulose production. RSC Adv. 2017, 7, 45145–45155. [Google Scholar] [CrossRef]
  4. Gallegos, A.M.A.; Carrera, S.H.; Parra, R.; Keshavarz, T.; Iqbal, H.M.N. Bacterial cellulose: A sustainable source to develop value-added products—A review. BioResources 2016, 11, 5641–5655. [Google Scholar] [CrossRef]
  5. Klemm, D.; Heublein, B.; Fink, H.-P.; Bohn, A. Cellulose: Fascinating biopolymer and sustainable raw material. Angew. Chem. Int. Ed. 2005, 44, 3358–3393. [Google Scholar] [CrossRef] [PubMed]
  6. Ling, S.; Chen, W.; Fan, Y.; Zheng, K.; Jin, K.; Yu, H.; Buehler, M.J.; Kaplan, D.L. Biopolymer nanofibrils: Structure, modeling, preparation, and applications. Prog. Polym. Sci. 2018, 85, 1–56. [Google Scholar] [CrossRef]
  7. Khosravi-Darani, K.; Koller, M.; Akramzadeh, N.; Mortazavian, A.M. Bacterial nanocellulose: Biosynthesis and medical application. Biointerface Res. Appl. Chem. 2016, 6, 1511–1516. [Google Scholar]
  8. Huang, X.; Zhan, X.; Wen, C.; Xu, F.; Luo, L. Amino-functionalized magnetic bacterial cellulose/activated carbon composite for Pb2+ and methyl orange sorption from aqueous solution. J. Mater. Sci. Technol. 2018, 34, 855–863. [Google Scholar] [CrossRef]
  9. Jin, X.; Xiang, Z.; Liu, Q.; Chen, Y.; Lu, F. Polyethyleneimine-bacterial cellulose bioadsorbent for effective removal of copper and lead ions from aqueous solution. Bioresour. Technol. 2017, 244, 844–849. [Google Scholar] [CrossRef] [PubMed]
  10. Reiniati, I.; Hrymak, A.N.; Margaritis, A. Recent developments in the production and applications of bacterial cellulose fibers and nanocrystals. Crit. Rev. Biotechnol. 2017, 37, 510–524. [Google Scholar] [CrossRef] [PubMed]
  11. Krasteva, P.V.; Bernal-Bayard, J.; Travier, L.; Martin, F.A.; Kaminski, P.-A.; Karimova, G.; Fronzes, R.; Ghigo, J.-M. Insights into the structure and assembly of a bacterial cellulose secretion system. Nat. Commun. 2018, 8, 2065. [Google Scholar] [CrossRef] [PubMed]
  12. Singhsa, P.; Narain, R.; Manuspiya, H. Physical structure variations of bacterial cellulose produced by different Komagataeibacter xylinus strains and carbon sources in static and agitated conditions. Cellulose 2018, 25, 1571–1581. [Google Scholar] [CrossRef]
  13. Mikkelsen, D.; Flanagan, B.M.; Dykes, G.A.; Gidley, M.J. Influence of different carbon sources on bacterial cellulose production by Gluconacetobacter xylinus strain ATCC 53524. J. Appl. Microbiol. 2009, 107, 576–583. [Google Scholar] [CrossRef] [PubMed]
  14. Keshk, S.M.A.S.; Sameshima, K. Evaluation of different carbon sources for bacterial cellulose production. Afr. J. Biotechnol. 2005, 4, 478–482. [Google Scholar]
  15. Kose, R.; Sunagawa, N.; Yoshida, M.; Tajima, K. One-step production of nanofibrillated bacterial cellulose (NFBC) from waste glycerol using Gluconacetobacter intermedius NEDO-01. Cellulose 2013, 20, 2971–2979. [Google Scholar] [CrossRef]
  16. Çoban, E.; Biyik, H. Effect of various carbon and nitrogen sources on cellulose synthesis by Acetobacter lovaniensis HBB5. Afr. J. Biotechnol. 2011, 10, 5346–5354. [Google Scholar]
  17. Gatenholm, P.; Höglund, K.; Johannesson, S.; Puchades, M.; Brackmann, C.; Enejder, A.; Olsson, L. Effect of Cultivation Conditions on the Structure and Morphological Properties of BNC Biomaterials with a Focus on Vascular Grafts. In Bacterial NanoCellulose-A Sophisticated Multifunctional Material, 1st ed.; Gama, M., Gatenholm, P., Klemm, D., Eds.; CRC Press: Boca Raton, FL, USA, 2013; pp. 20–42. [Google Scholar]
  18. Yunoki, S.; Osada, Y.; Kono, H.; Takai, M. Role of ethanol in improvement of bacterial cellulose production: Analysis using 13C-labeled carbon sources. Food Sci. Technol. Res. 2004, 10, 307–313. [Google Scholar] [CrossRef]
  19. Yang, X.-Y.; Huang, C.; Guo, H.-J.; Xiong, L.; Luo, J.; Wang, B.; Chen, X.-F.; Lin, X.-Q.; Chen, X.-D. Beneficial effect of acetic acid on the xylose utilization nd bacterial cellulose production by Gluconacetobacter xylinus. Indian J. Microbiol. 2014, 54, 268–273. [Google Scholar] [CrossRef] [PubMed]
  20. Park, J.K.; Jung, J.Y.; Park, Y.H. Cellulose production by Gluconacetobacter hansenii in a medium containing ethanol. Biotechnol. Lett. 2003, 25, 2055–2059. [Google Scholar] [CrossRef] [PubMed]
  21. Lu, Z.; Zhang, Y.; Chi, Y.; Xu, N.; Yao, W.; Sun, B. Effects of alcohols on bacterial cellulose production by Acetobacter xylinum 186. World J. Microb. Biot. 2011, 27, 2281–2285. [Google Scholar] [CrossRef]
  22. Huang, C.; Yang, X.-Y.; Xiong, L.; Guo, H.-J.; Luo, J.; Wang, B.; Zhang, H.-R.; Lin, X.-Q.; Chen, X.-D. Evaluating the possibility of using acetone-butanol-ethanol (ABE) fermentation wastewater for bacterial cellulose production by Gluconacetobacter xylinus. Lett. Appl. Microbiol. 2015, 60, 491–496. [Google Scholar] [CrossRef] [PubMed]
  23. Kiziltas, E.E.; Kiziltas, A.; Gardner, D.J. Synthesis of bacterial cellulose using hot water extracted wood sugars. Carbohydr. Polym. 2015, 124, 131–138. [Google Scholar] [CrossRef] [PubMed]
  24. Jung, H.-I.; Jeong, J.-H.; Lee, O.-M.; Park, G.-T.; Kim, K.-K.; Park, H.-C.; Lee, S.-M.; Kim, Y.-G.; Son, H.-J. Influence of glycerol on production and structural–physical properties of cellulose from Acetobacter sp. V6 cultured in shake flasks. Bioresour. Technol. 2010, 101, 3602–3608. [Google Scholar] [CrossRef] [PubMed]
  25. Chen, S.-Q.; Mikkelsen, D.; Lopez-Sanchez, P.; Wang, D.; Martinez-Sanz, M.; Gilbert, E.P.; Flanagan, B.M.; Gidley, M.J. Characterisation of bacterial cellulose from diverse Komagataeibacter strains and their application to construct plant cell wall analogues. Cellulose 2017, 24, 1211–1226. [Google Scholar] [CrossRef]
  26. Chen, S.-Q.; Lopez-Sanchez, P.; Wang, D.; Mikkelsen, D.; Gidley, M.J. Mechanical properties of bacterial cellulose synthesised by diverse strains of the genus Komagataeibacter. Food Hydrocolloids 2018, 81, 87–95. [Google Scholar] [CrossRef]
  27. Hestrin, S.; Schramm, M. Synthesis of cellulose by Acetobacter xylinum. 2. Preparation of freeze-dried cells capable of polymerizing glucose to cellulose. Biochem. J. 1954, 58, 345–352. [Google Scholar] [CrossRef] [PubMed]
  28. Mohammadkazemi, F.; Azin, M.; Ashori, A. Production of bacterial cellulose using different carbon sources and culture media. Carbohydr. Polym. 2015, 117, 518–523. [Google Scholar] [CrossRef] [PubMed]
  29. Segal, L.; Creely, J.J.; Martin, A.E., Jr.; Conrad, C.M. An empirical method for estimating the degree of crystallinity of native cellulose using the X-ray diffractometer. Text. Res. J. 1959, 29, 786–794. [Google Scholar] [CrossRef]
  30. Yamamoto, H.; Horii, F.; Hirai, A. In situ crystallization of bacterial cellulose II. Influences of different polymeric additives on the formation of celluloses Iα and Iβ at the early stage of incubation. Cellulose 1996, 3, 229–242. [Google Scholar] [CrossRef]
  31. Saxena, I.M.; Malcolm Brown, R.J. Biosynthesis of Bacterial Cellulose. In Bacterial NanoCellulose-A Sophisticated Multifunctional Material, 1st ed.; Gama, M., Gatenholm, P., Klemm, D., Eds.; CRC Press: Boca Raton, FL, USA, 2013; pp. 1–18. [Google Scholar]
  32. Augimeri, R.V.; Varley, A.J.; Strap, J.L. Establishing a role for bacterial cellulose in environmental interactions: Lessons learned from diverse biofilm-producing Proteobacteria. Front. Microbiol. 2015, 6, 1282. [Google Scholar] [CrossRef] [PubMed]
  33. Castro, C.; Zuluaga, R.; Putaux, J.-L.; Caro, G.; Mondragon, I.; Gañán, P. Structural characterization of bacterial cellulose produced by Gluconacetobacter swingsii sp. from Colombian agroindustrial wastes. Carbohydr. Polym. 2011, 84, 96–102. [Google Scholar] [CrossRef]
  34. Gullo, M.; China, S.L.; Falcone, P.M.; Giudici, P. Biotechnological production of cellulose by acetic acid bacteria: Current state and perspectives. Appl. Microbiol. Biotechnol. 2018, 102, 6885–6898. [Google Scholar] [CrossRef] [PubMed]
  35. Ross, P.; Mayer, R.; Benziman, M. Cellulose biosynthesis and function in bacteria. Microbiol. Mol. Biol. Rev. 1991, 55, 35–58. [Google Scholar]
  36. Ramana, K.V.; Tomar, A.; Singh, L. Effect of various carbon and nitrogen sources on cellulose synthesis by Acetobacter xylinum. World J. Microb. Biotechnol. 2000, 16, 245–248. [Google Scholar] [CrossRef]
  37. Ago, M.; Yamane, C.; Hattori, M.; Ono, H.; Okajima, K. Characterization of morphology and physical strength for bacterial cellulose produced by an Enterobacter sp. Sen-i Gakkaishi 2006, 62, 42–46. [Google Scholar] [CrossRef]
  38. Tanskul, S.; Amornthatre, K.; Jaturonlak, N. A new cellulose-producing bacterium, Rhodococcus sp. MI 2: Screening and optimization of culture conditions. Carbohydr. Polym. 2013, 92, 421–428. [Google Scholar] [CrossRef] [PubMed]
  39. Hassan, E.A.; Abdelhady, H.M.; El-Salam, S.S.A.; Abdullah, S.M. The characterization of bacterial cellulose produced by Acetobacter xylinum and Komgataeibacter saccharovorans under optimized fermentation conditions. Brit. Microbiol. Res. J. 2015, 9, 1–13. [Google Scholar] [CrossRef]
  40. Kojima, Y.; Seto, A.; Tonouchi, N.; Tsuchida, T.; Yoshinaga, F. High rate production in static culture of bacterial cellulose from sucrose by a newly isolated Acetobacter strain. Biosci. Biotech. Biochem. 1997, 61, 1585–1586. [Google Scholar] [CrossRef]
  41. Tabaii, M.J.; Emtiazi, G. Comparison of bacterial cellulose production among different strains and fermented media. Appl. Food Biotechnol. 2016, 3, 35–41. [Google Scholar]
  42. Ishihara, M.; Matsunaga, M.; Hayashi, N.; Tišler, V. Utilization of d-xylose as carbon source for production of bacterial cellulose. Enzyme Microb. Technol. 2002, 31, 986–991. [Google Scholar] [CrossRef]
  43. Recouvreux, D.O.S.; Carminatti, C.A.; Pitlovanciv, A.K.; Rambo, C.R.; Porto, L.M.; Antônio, R.V. Cellulose biosynthesis by the beta-proteobacterium, Chromobacterium violaceum. Curr. Microbiol. 2008, 57, 469–476. [Google Scholar] [CrossRef] [PubMed]
  44. Hungund, B.S.; Gupta, S.G. Production of bacterial cellulose from Enterobacter amnigenus GH-1 isolated from rotten apple. World J. Microb. Biotechnol. 2010, 26, 1823–1828. [Google Scholar] [CrossRef]
  45. Trovatti, E.; Serafim, L.S.; Freire, C.S.R.; Silvestre, A.J.D.; Neto, C.P. Gluconacetobacter sacchari: An efficient bacterial cellulose cell-factory. Carbohydr. Polym. 2011, 86, 1417–1420. [Google Scholar] [CrossRef]
  46. Thorat, M.; Dastager, S. High yield production of cellulose by a Komagataeibacter rhaeticus PG2 strain isolated from pomegranate as a new host. RSC Adv. 2018, 8, 29797–29805. [Google Scholar] [CrossRef]
  47. Volova, T.G.; Prudnikova, S.V.; Sukovatyi, A.G.; Shishatskaya, E.I. Production and properties of bacterial cellulose by the strain Komagataeibacter xylinus B-12068. Appl. Microbiol. Biotechnol. 2018, 102, 7417–7428. [Google Scholar] [CrossRef] [PubMed]
  48. Tan, L.; Ren, L.; Cao, Y.; Chen, X.; Tang, X. Bacterial cellulose synthesis in Kombucha by Gluconacetobacter sp and Saccharomyces sp. Adv. Mater. Res. 2012, 554–556, 1000–1003. [Google Scholar] [CrossRef]
  49. Amano, Y.; Ito, F.; Kanda, T. Novel cellulose producing system by microorganisms such as Acetobacter sp. J. Biol. Macromol. 2005, 5, 3–10. [Google Scholar]
  50. Yamanaka, S.; Watanabe, K.; Kitamura, N.; Iguchi, M.; Mitsuhashi, S.; Nishi, Y.; Uryu, M. The structure and mechanical properties of sheets prepared from bacterial cellulose. J. Mater. Sci. 1989, 24, 3141–3145. [Google Scholar] [CrossRef]
  51. Bi, J.C.; Liu, S.X.; Li, C.F.; Li, J.; Liu, L.X.; Deng, J.; Yang, Y.C. Morphology and structure characterization of bacterial celluloses produced by different strains in agitated culture. J. Appl. Microbiol. 2014, 117, 1305–1311. [Google Scholar] [CrossRef] [PubMed]
  52. French, A.D. Idealized powder diffraction patterns for cellulose polymorphs. Cellulose 2014, 21, 885–896. [Google Scholar] [CrossRef]
  53. Tokoh, C.; Takabe, K.; Fujita, M.; Saiki, H. Cellulose synthesized by Acetobacter xylinum in the presence of acetyl glucomannan. Cellulose 1998, 5, 249–261. [Google Scholar] [CrossRef]
  54. Keshk, S.; Sameshima, K. The utilization of sugar cane molasses with/without the presence of lignosulfonate for the production of bacterial cellulose. Appl. Microbiol. Biotechnol. 2006, 72, 291–296. [Google Scholar] [CrossRef] [PubMed]
  55. Meza-Contreras, J.C.; Manriquez-Gonzalez, R.; Gutiérrez-Ortega, J.A.; Gonzalez-Garcia, Y. XRD and solid state 13C-NMR evaluation of the crystallinity enhancement of 13C-labeled bacterial cellulose biosynthesized by Komagataeibacter xylinus under different stimuli: A comparative strategy of analyses. Carbohydr. Res. 2018, 461, 51–59. [Google Scholar] [CrossRef] [PubMed]
  56. Yamamoto, H.; Horn, F. In situ crystallization of bacterial cellulose I. Influences of polymeric additives, stirring and temperature on the formation celluloses Iα and Iβ as revealed by cross polarization/magic angle spinning (CP/MAS)13C NMR spectroscopy. Cellulose 1994, 1, 57–66. [Google Scholar] [CrossRef]
  57. Yamamoto, H.; Horii, F. CP/MAS 13C NMR analysis of the crystal transformation induced for Valonia cellulose by annealing at high temperatures. Macromolecules 1993, 26, 1313–1317. [Google Scholar] [CrossRef]
  58. Colvin, J.R.; Leppard, G.G. The biosynthesis of cellulose by Acetobacter xylinum and Acetobacter acetigenus. Can. J. Microbiol. 1977, 23, 701–709. [Google Scholar] [CrossRef] [PubMed]
  59. Zhong, C.; Zhang, G.-C.; Liu, M.; Zheng, X.-T.; Han, P.-P.; Jia, S.-R. Metabolic flux analysis of Gluconacetobacter xylinus for bacterial cellulose production. Appl. Microbiol. Biotechnol. 2013, 97, 6189–6199. [Google Scholar] [CrossRef] [PubMed]
Figure 1. Bacterial cellulose (BC) production by Komagataeibacter sp. W1 grown in media spiked with different carbon sources. (A) the raw samples, (B) the samples after pre-treatment with 0.1 M NaOH for 2 h and freeze-dried for 24 h and (C) the BC yields. Different letters in red indicate no significant difference between the setups according to Limited Slip Differential (LSD) test (p ≤ 0.05).
Polymers 10 00963 g001
Figure 2. Morphology (AH) and diameter distribution (ah) of the BC produced by Komagataeibacter sp. W1 grown in the media spiked with different carbon sources. While the BC morphology was observed with scanning electron microscopy (SEM) with a spot of 3.0, high voltage of 15 KeV, and magnification of 20,000×, the diameter calculation was performed on Nano Measurer 1.2 by calculating 100 nanofibrils randomly on the SEM images.
Polymers 10 00963 g002
Figure 3. Comparative X-ray diffraction (XRD) analysis of the BC produced by Komagataeibacter sp. W1 grown in the media spiked with various carbon sources. The XRD pattern was obtained using nickel filtered copper Kα radiation, with 0.1° steps, from 4° to 70° (2θ).
Polymers 10 00963 g003
Figure 4. Comparative Fourier transform infrared (FTIR) analysis of the BC produced by Komagataeibacter sp. W1 grown in media spiked with various carbon sources. The analysis was conducted on a Nicolet iS5 in the Attenuated Total Reflectance (ATR) mode with 32 scans per measurement between 400 and 4000 cm−1. The detailed information of peaks 1–22 is given in Table 3.
Polymers 10 00963 g004
Figure 5. The number of orfs associated with carbon source metabolisms and BC biosynthesis and regulation. The orfs shown here were retrieved from the genes and corresponding protein annotation data. While the numbers on the top of the bars indicate the total number of predicted genes involved in carbon source metabolisms and BC biosynthesis and regulation, the ones below the line indicate the number of the genes that can be annotated to certain Kyoto Encyclopedia of Genes and Genomes (KEGG) pathways. It’s worthy to note that the description ‘others’ indicates the key metabolic intermediates during the transformation between glucose and glycerol or fructose and glycerol. More details can be found in Tables S1 and S2.
Polymers 10 00963 g005
Figure 6. Schematic diagram of carbon metabolism and BC biosynthesis pathways in Komagataeibacter sp. W1. The comprehensive analysis was conducted by incorporating the key metabolic intermediates and associated enzymes responsible for carbon source transformation and BC biosynthesis in different KEGG pathways. The numbers in the figure are the Enzyme Commission number, while the red and black ones indicate the associated enzymes present and absent respectively in Komagataeibacter sp. W1. The asterisks indicate the enzymes absent in the labeled pathways but present in other pathways in our study, thus it is unknown whether they work in the labeled pathways. The question mark indicating whether the pathway is present, is unclear based on our data and remains for future investigations. More information of the enzymes and the associated genes and pathways (ko numbers) are listed in Table S2. P, phosphate; GDP, guanosine diphosphate; UDP, uridine diphosphate; PRPP, phosphoribosyl pyrophosphate; ThPP, thiamine diphosphate; TCA, tricarboxylic acid cycle; Acetyl-CoA, acetyl coenzyme A.
Polymers 10 00963 g006
Table 1. The carbon sources used for bacterial cellulose (BC) production and BC productivity in representative bacterial strains.
Bacteria NamesCultivation ConditionsCarbon SourcesConcentration (%, w/v)Relative Yields (% Day−1) aReferences
Acetobacter sp. S-35Static, 28 °C, 3 daysSucrose, lactate, glucose, mannitol b, gluconate, glycerol, dulcitol, maltose, lactose, sorbose, ribose, arabinose, xylose, fructose, galactose4% except for dulcitol and sorbose with 2%up to 9.58Kojima et al. [40]
Acetobacter hansenii ATCC 10821Static, 30 °C, 30 daysd-glucose b, d-xylose, d-xylulose, d-xylose/d-xylulose2%0.037–1.087Ishihara et al. [42]
Acetobacter lovaniensis HBB5Static, 30 °C, 7 daysGlucose b, sucrose, fructose, ethanol2%0.008–0.029Çoban and Biyik [16]
Acetobacter pasteurianus IFO 14814Static, 30 °C, 30 daysd-glucose b, d-xylose, d-xylulose, d-xylose/d-xylulose2%0.130–0.167Ishihara et al. [42]
Acetobacter xylinum ATCC 10245Static, 30 °C, 14 daysGlucose1.5%5.29Hassan et al. [39]
Acetobacter xylinumcNM d, 35 °C, 14 daysSucrose b, glucose, mannitol b, sorbitol, galactose, lactose, acetic acid, maltose5–7%≥0.057 eRamana et al. [36]
Acetobacter xylinus IFO 15606Static, 30 °C, 30 daysd-glucose, d-xylose, d-xylulose, D-xylose/d-xylulose b2%0.147–0.347Ishihara et al. [42]
Chromobacterium violaceum ATCC 12472Static, 32 °C, 3 daysGlucose2%NMRecouvreux et al. [43]
Enterobacter amnigenus GH-1Static, 30 °C, 14 daysd-Glucose, d-fructose b, lactose, mannitol, inositol, sucrose, maltose, glycerol2%1.0Hungund and Gupta [44]
Enterobacter sp.Agitated, 30 °C, 24 daysGlucose2%0.5Ago et al. [37]
Gluconacetobacter intermedius NEDO-01Static, 30 °C, 3 days
Agitated, 30 °C, 4 days
Glycerol2%NM
4.25
Kose et al. [15]
Gluconacetobacter sacchariStatic, 30 °C, 4 daysGlucose2%3.375Trovatti et al. [45]
Gluconacetobacter xylinus ATCC 53524Static, 30 °C, 2 or 4 daysMannitol b, glucose, glycerol, fructose, sucrose b, galactose2%5.10 or 4.79Mikkelsen et al. [13]
Gluconacetobacter xylinus CH001Static, 28 °C, 14 daysXylose1–3%up to 0.482Yang et al. [19]
Gluconacetobacter xylinus PTCC 1734Agitated, 28 °C, 7 daysMannitol, sucrose b, glucose2–5%~0.947Mohammadkazemi et al. [28]
Gluconacetobacter xylinus PTCC 1734Static, 28 °C, 20 daysGlucose, fructose, mannitol b, sucrose, glycerol2%up to 2.5Tabaii and Emtiazi [41]
Komagataeibacter medellinensisStatic, 28 °C, 8 daysFructose, glucose b, sucrose2%0.238–1.75Molina-Ramírez et al. [2]
Komagataeibacter rhaeticus PG2Static, 28 °C, 15 daysFructose, lactose, xylose, sucrose, galactose, mannitol, sorbitol, and glycerol2%up to 2.3Thorat and Dastager [46]
Komagataeibacter saccharivorans PE 5Static, 30 °C, 14 daysMannitol1.5%6.00Hassan et al. [39]
Komagataeibacter xylinus KX, TISTR 086, 428, 975 and 1011Static, 30 °C, 7 days
Agitated, 30 °C, 7 days
Glucose b, fructose, lactose b, maltitol, sucralose, xylitol5%0.326–0.526
up to 1.34
Singhsa et al. [12]
Komagataeibacter xylinus B-12068Static, 30 °C, 7 daysGlucose b, sucrose, galactose, maltose, mannitol2%0.071–1.571Volova et al. [47]
Rhodococcus sp. MI 2Static, 25 °C, 14 daysGlucose, fructose b, sucrose, lactose, sorbitol, and mannitol2%~2.25Tanskul et al. [38]
Saccharomyces cerevisiae CGMCC1670Static, 30 °C, 22 daysGlucose5%~0.118Tan et al. [48]
Komagataeibacter sp. W1Static, 30 °C, 14 daysAcetate, ethanol, fructose, glucose, glycerol, lactose, mannitol b, sucrose2% f0.015–0.547This study
a Since the amount of carbon sources used for BC production was different, the BC productivity was calculated based on the initial and final contents of carbon sources and BC within the incubation time. b Carbon source for the highest BC production. c The bacteria have been re-classified into the genus Komagataeibacter. d Not mentioned. e Both sucrose and mannitol (60–70 g L−1) produced similar amounts of BC with the addition of peptone or casein hydrolysate. f All carbon sources were normalized to glucose based on C element amount.
Table 2. D-spacing, apparent crystal size (ACS), crystallinity index (C.I.). and % crystalline of BC samples produced from different carbon sources.
Carbon SourcesPeak 1
(100 or 1 1 ¯ 0)
Peak 2
(010 or 110)
Peak 3
(110 or 200)
At 2θ ScaleC.I.% Crystalline
d-Spacing (nm)ACS (nm)d-Spacing (nm)ACS (nm)d-Spacing (nm)ACS (nm)IamIma
Acetate0.606.70.5315.50.397.81336360.7983
Ethanol0.606.9a0.397.21266020.7983
Fructose0.608.20.539.40.398.916513230.8889
Glucose0.608.80.536.80.399.21328440.8486
Glycerol0.608.60.5310.70.398.91409780.8687
Lactose0.391.8992730.6473
Mannitol0.607.90.538.00.398.818516740.8990
Sucrose0.6023.60.394.61123220.6574
a Since the peak was weak, both the d-spacing and ACS were not available.
Table 3. Fourier transform infrared (FTIR) analysis of functional groups on BC produced from different carbon sources.
Peak NumberWavenumber (cm−1)Functional Groups
AcetateEthanolFructoseGlucoseGlycerolLactoseMannitolSucrose
133443343334333433344334533413346O–H stretching vibration
228952896289528952895289728942899C–H stretching of CH2 and CH3 groups
3a17301734UK c
41648164516451645164916421647H–O–H bending of absorbed water
51564157315741574UK
61424142714231427142314261423CH2 symmetric bending or O–H in plane bending
713611360136113601361135513611361C–H bending
813361335133513351336133613351335C–H deformation or O–H in-plane bending
913151315131513151315131513151315Out-of-plane wagging of the CH2 groups
10128012811280128012811281 b12801280 bC–H bending
111248124912491249 b1249 bUK
121203 b12051205120512041203 b12051202 bC–H bending
1311601161116111611161116011601161C–O–C antisymmetric bridge stretching of 1, 4-β-d-glucoside
1411081108110811081108110911081108C–C bonds of the monomer units of polysaccharide or C–O bending vibration
1510551055105410541055105610551054The bending of C–O–H bond of carbohydrates or C–O–C pyranose ring skeletal vibration
1610311031103110311031103210301032
171003 b1005 b1003 b10049971002 b10031002 bUK
18899 b899899895Antisymmetric out-of-phase ring stretching of β-glucosidic linkages between the glucose units
19847835836836UK
20660664663664662666663657O–H out-of-phase bending vibration
21600609602609597602601597
22563559557558563564558562
a Not detected. b The peaks were weak. c Unknown.

