Synthesis and Characterization of a Monoclinic Crystalline Phase of Hydroxyapatite by Synchrotron X-ray Powder Diffraction and Piezoresponse Force Microscopy

 , and
, and
Abstract
:1. Introduction
2. Materials and Methods
2.1. Synthesis
2.2. Characterization
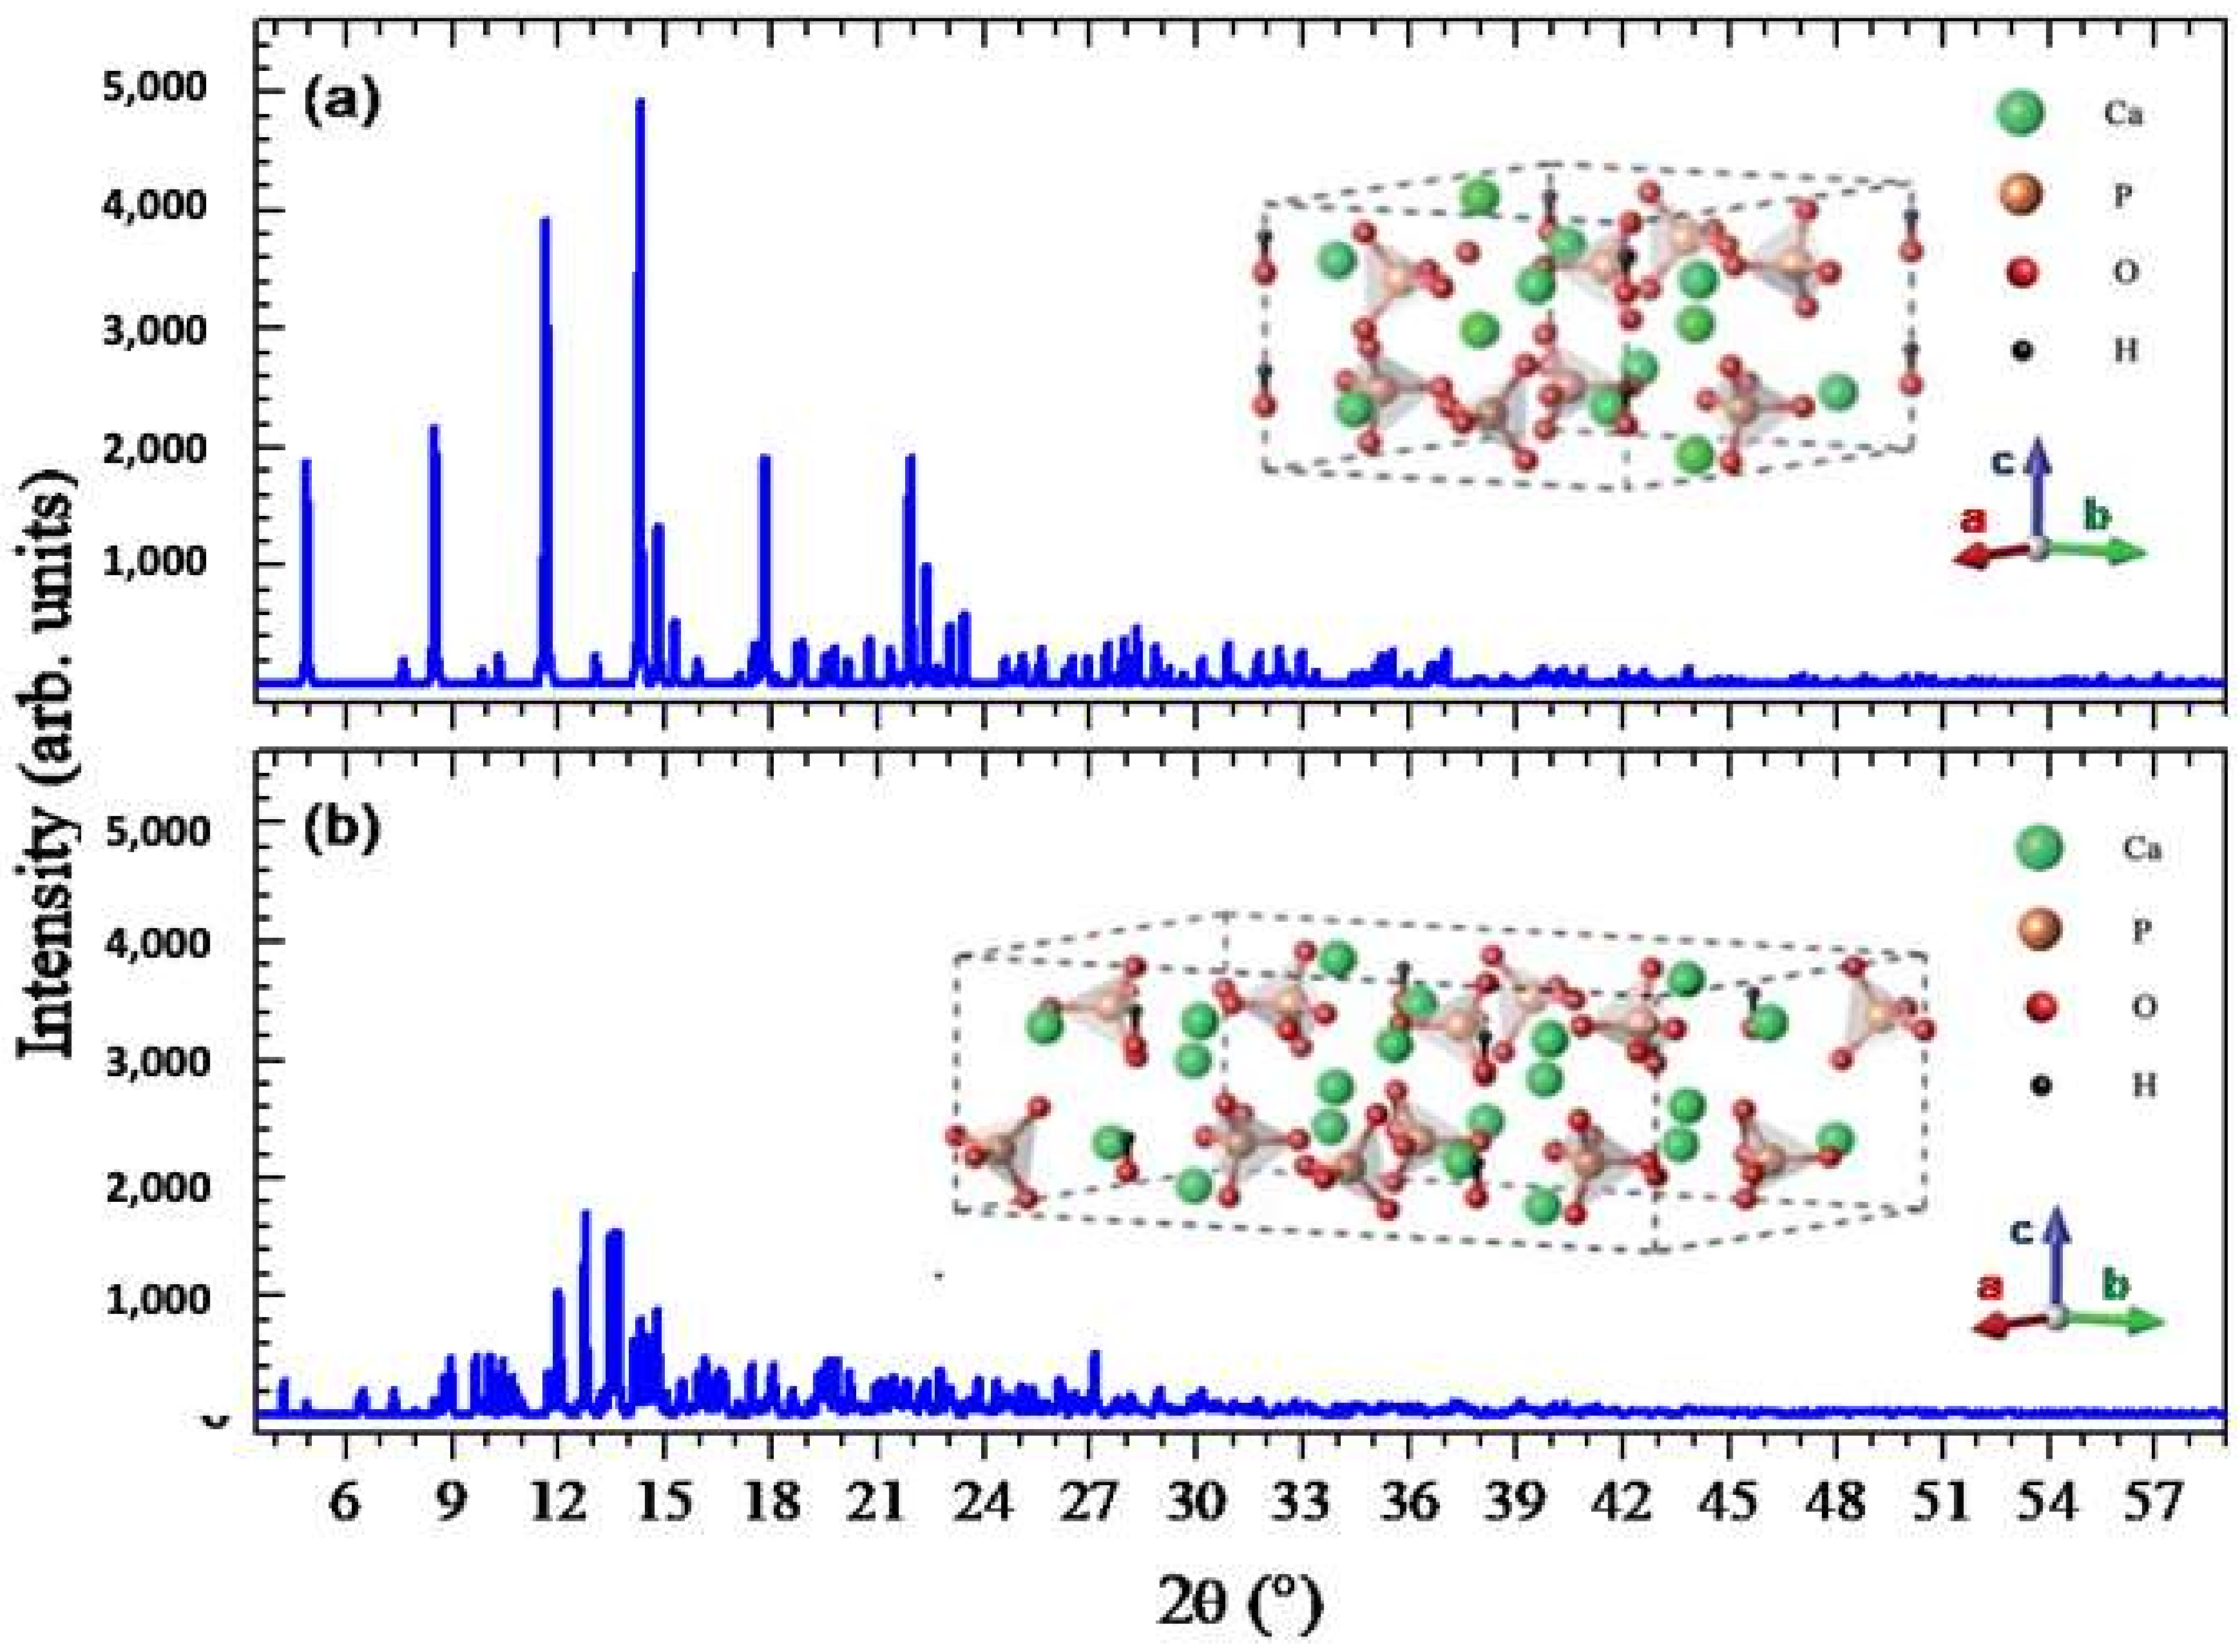
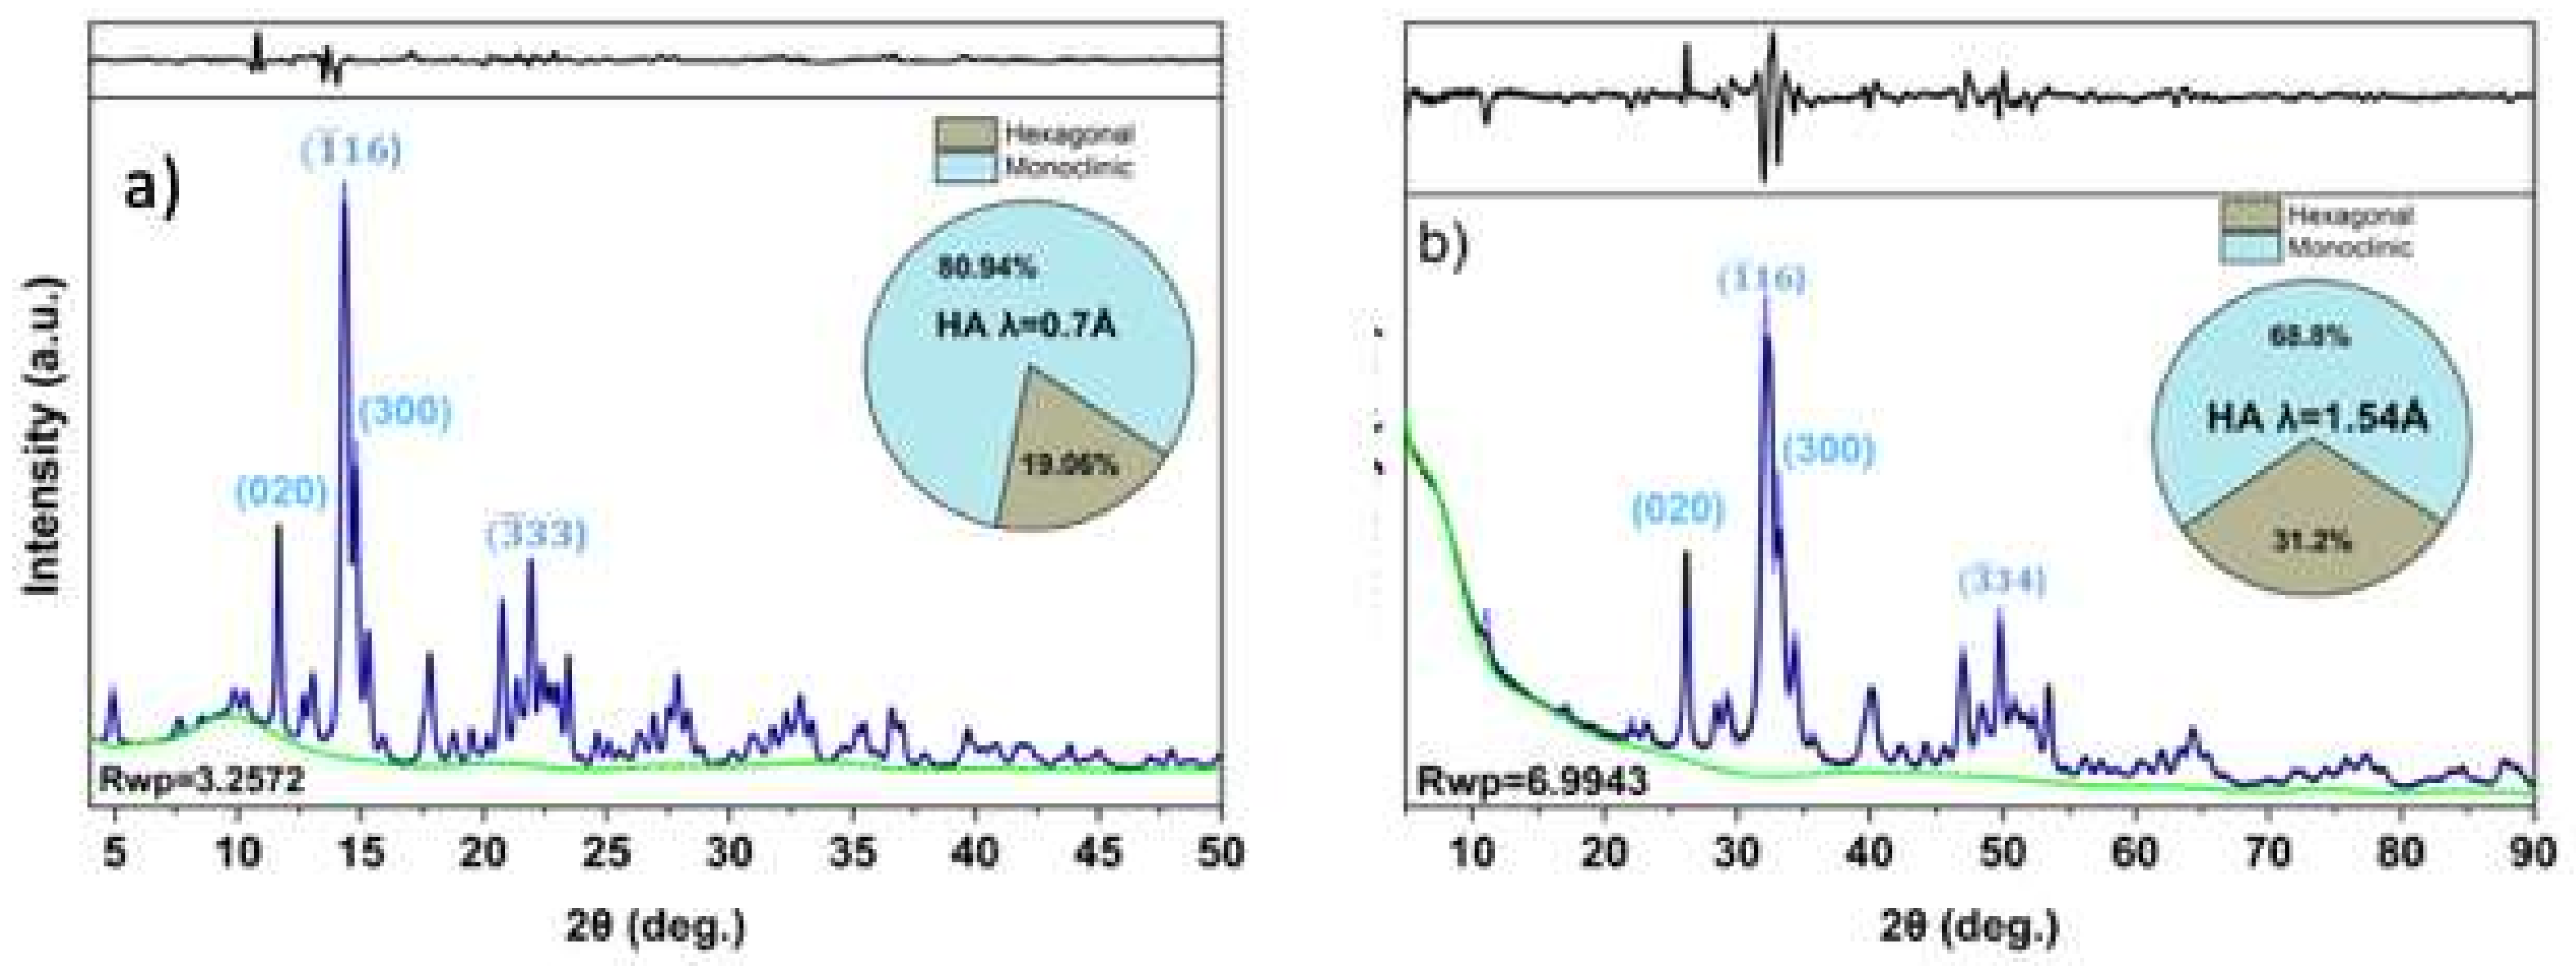
2.2.1. X-ray Powder Diffraction (XRPD)
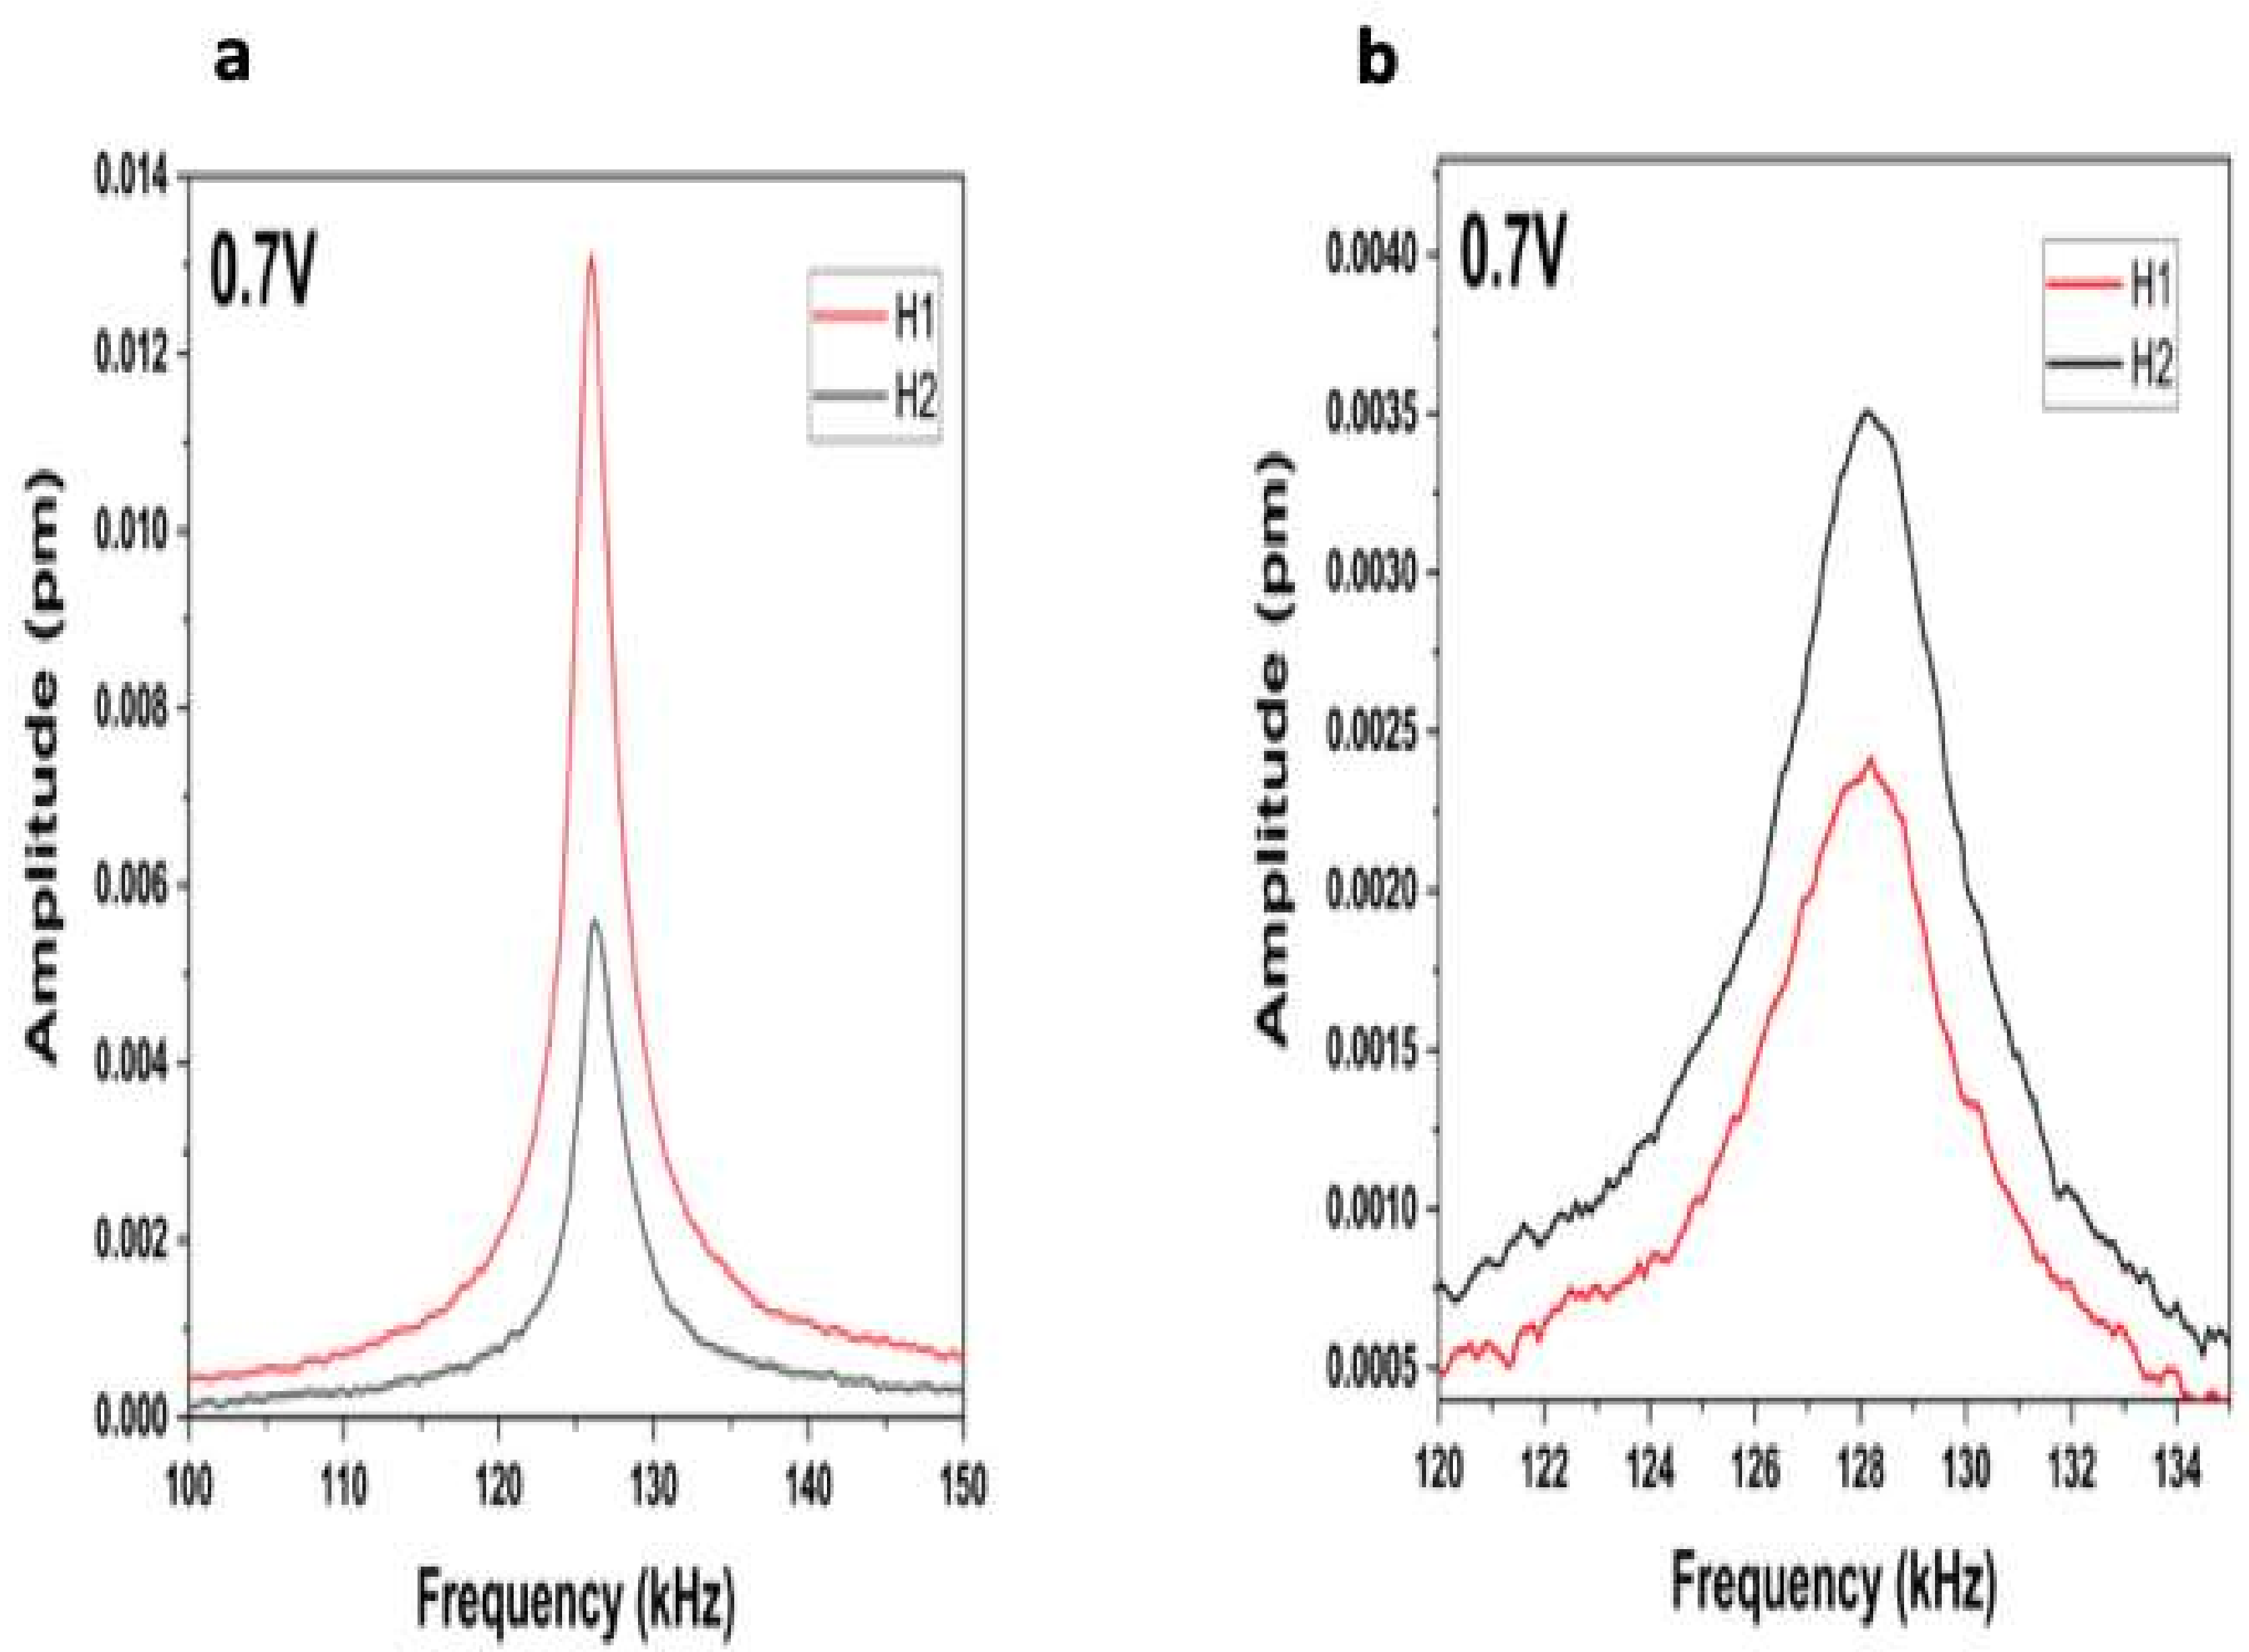
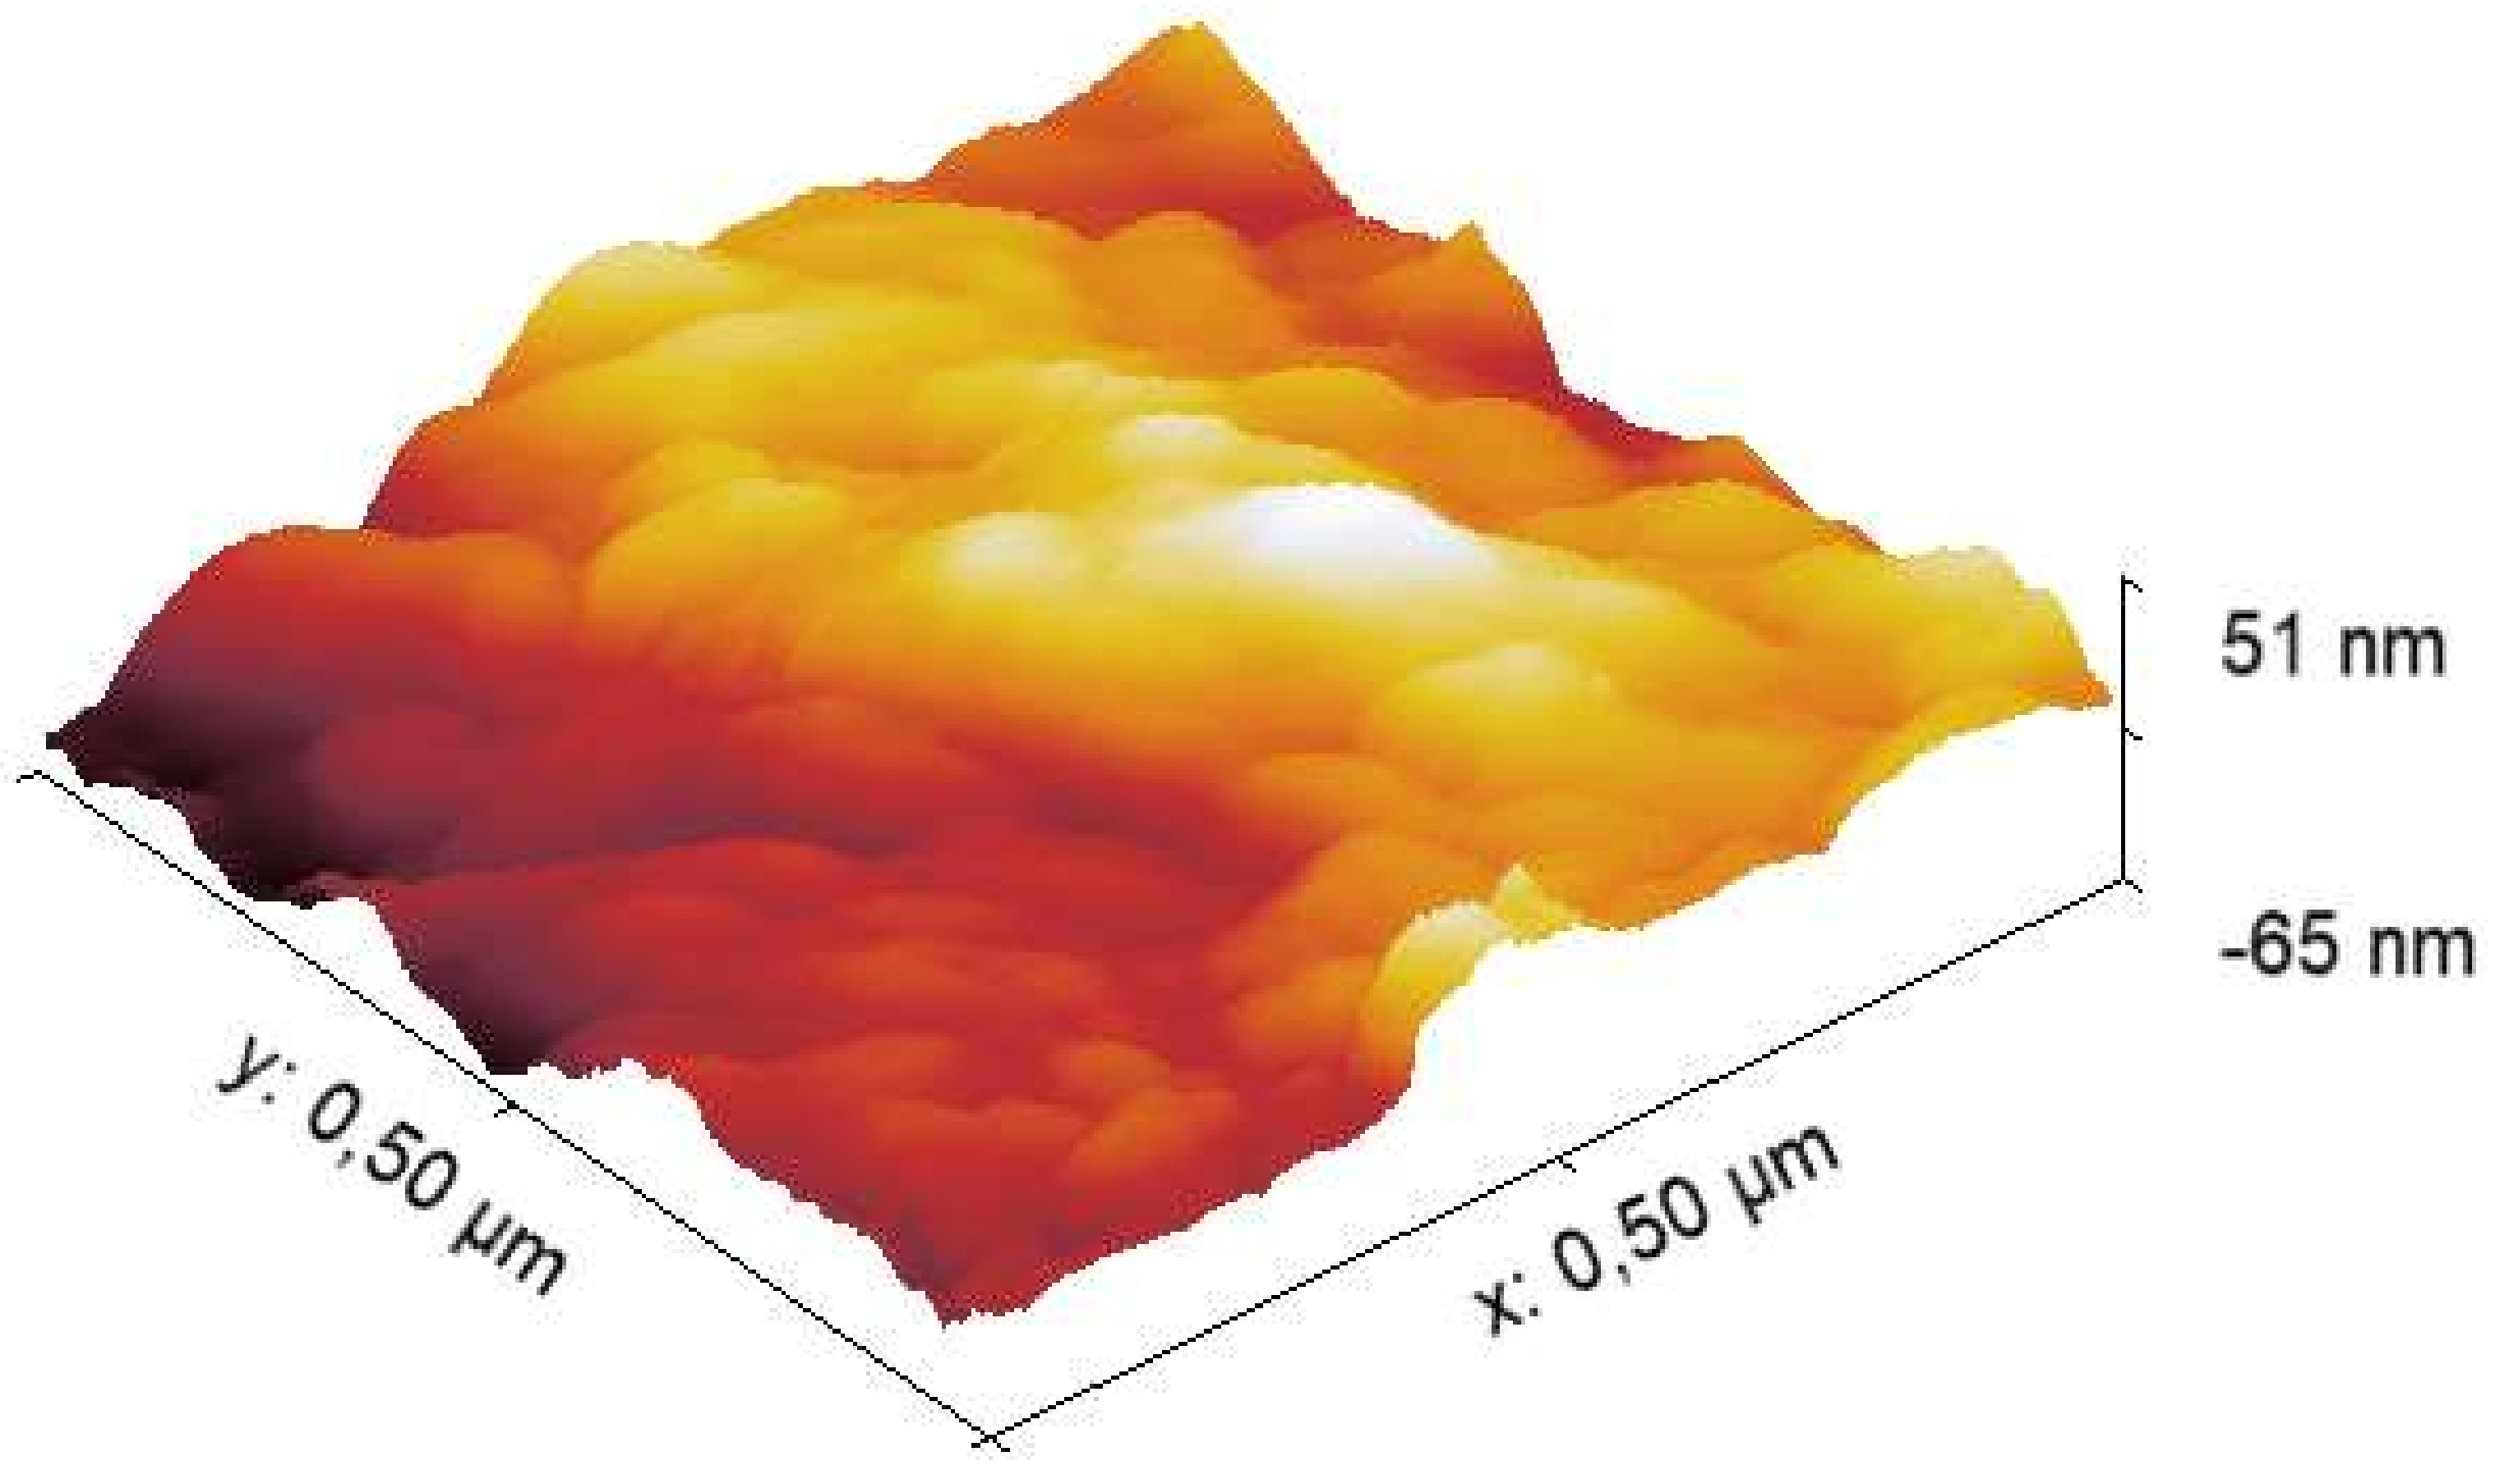
2.2.2. Piezoresponse Force Microscopy (PFM)
3. Results
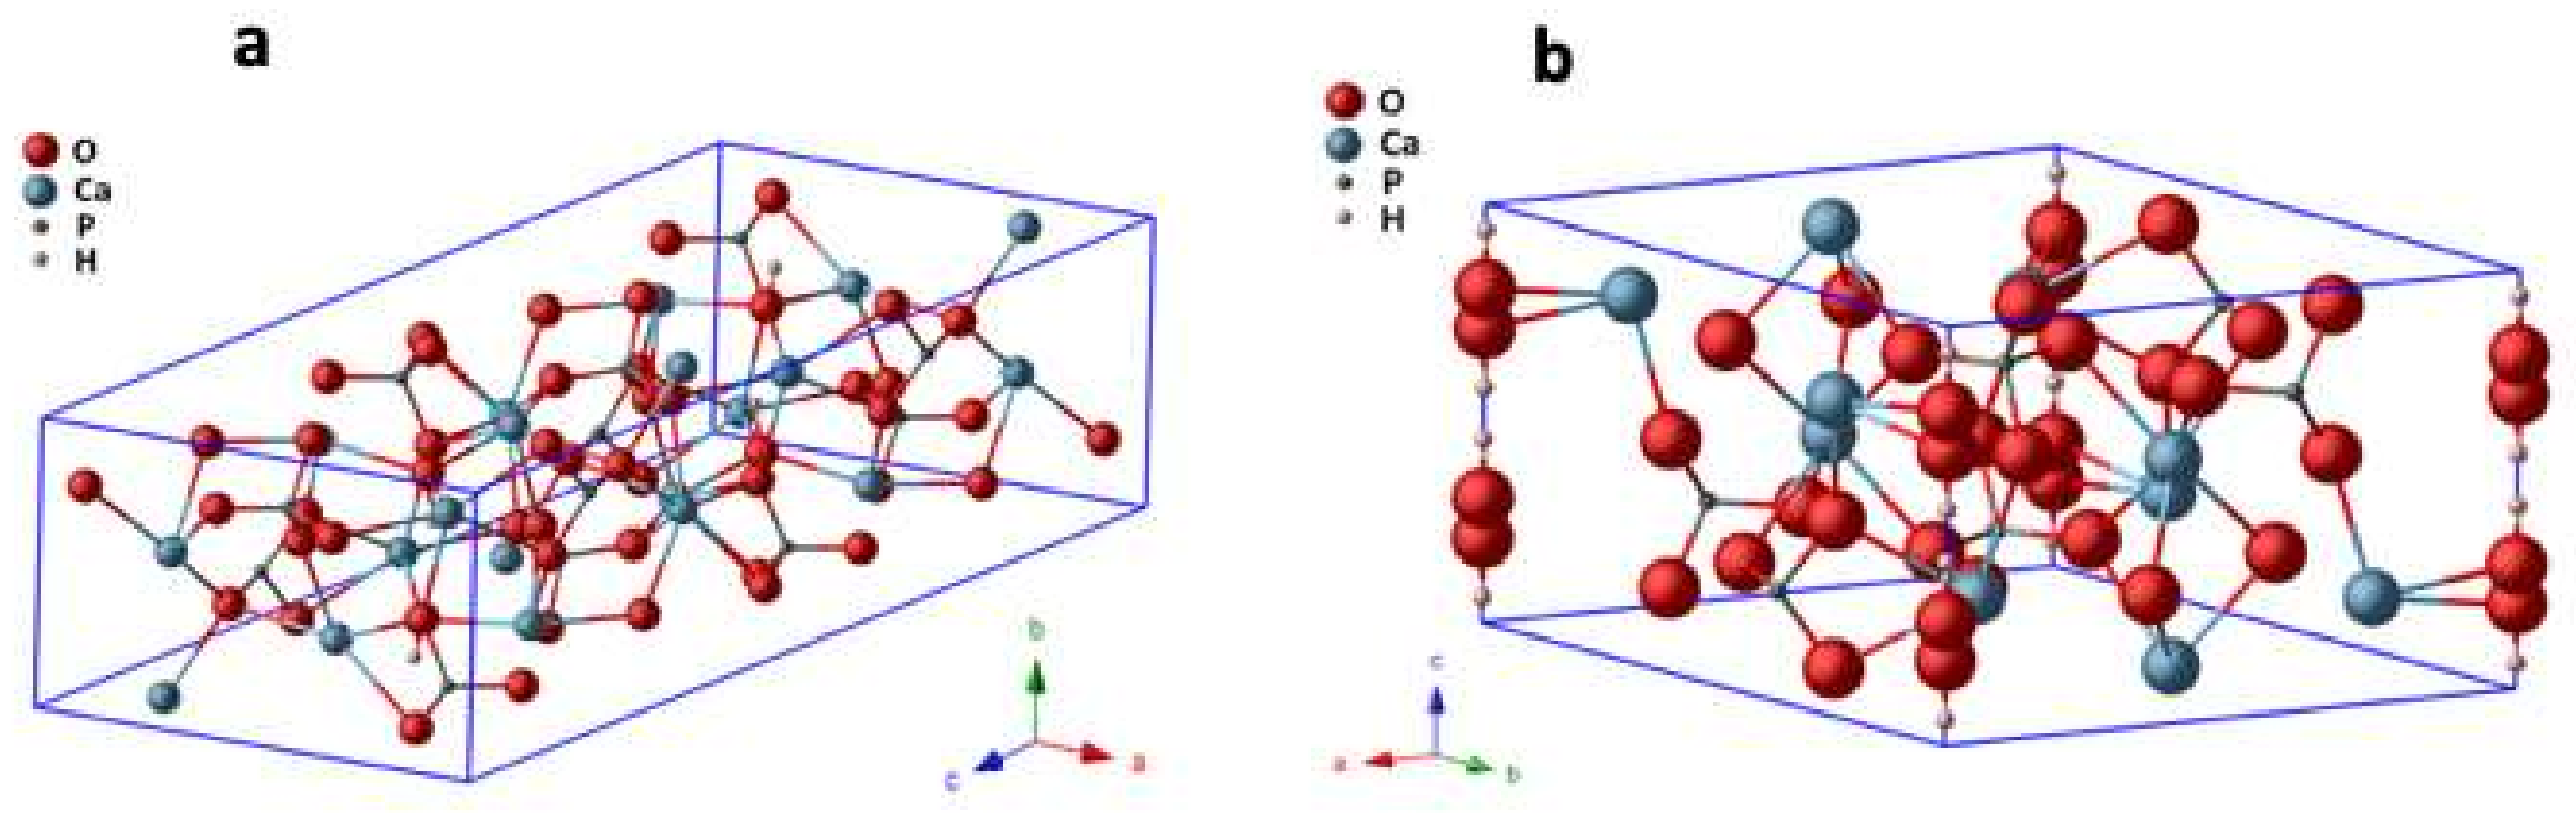
3.1. Structure
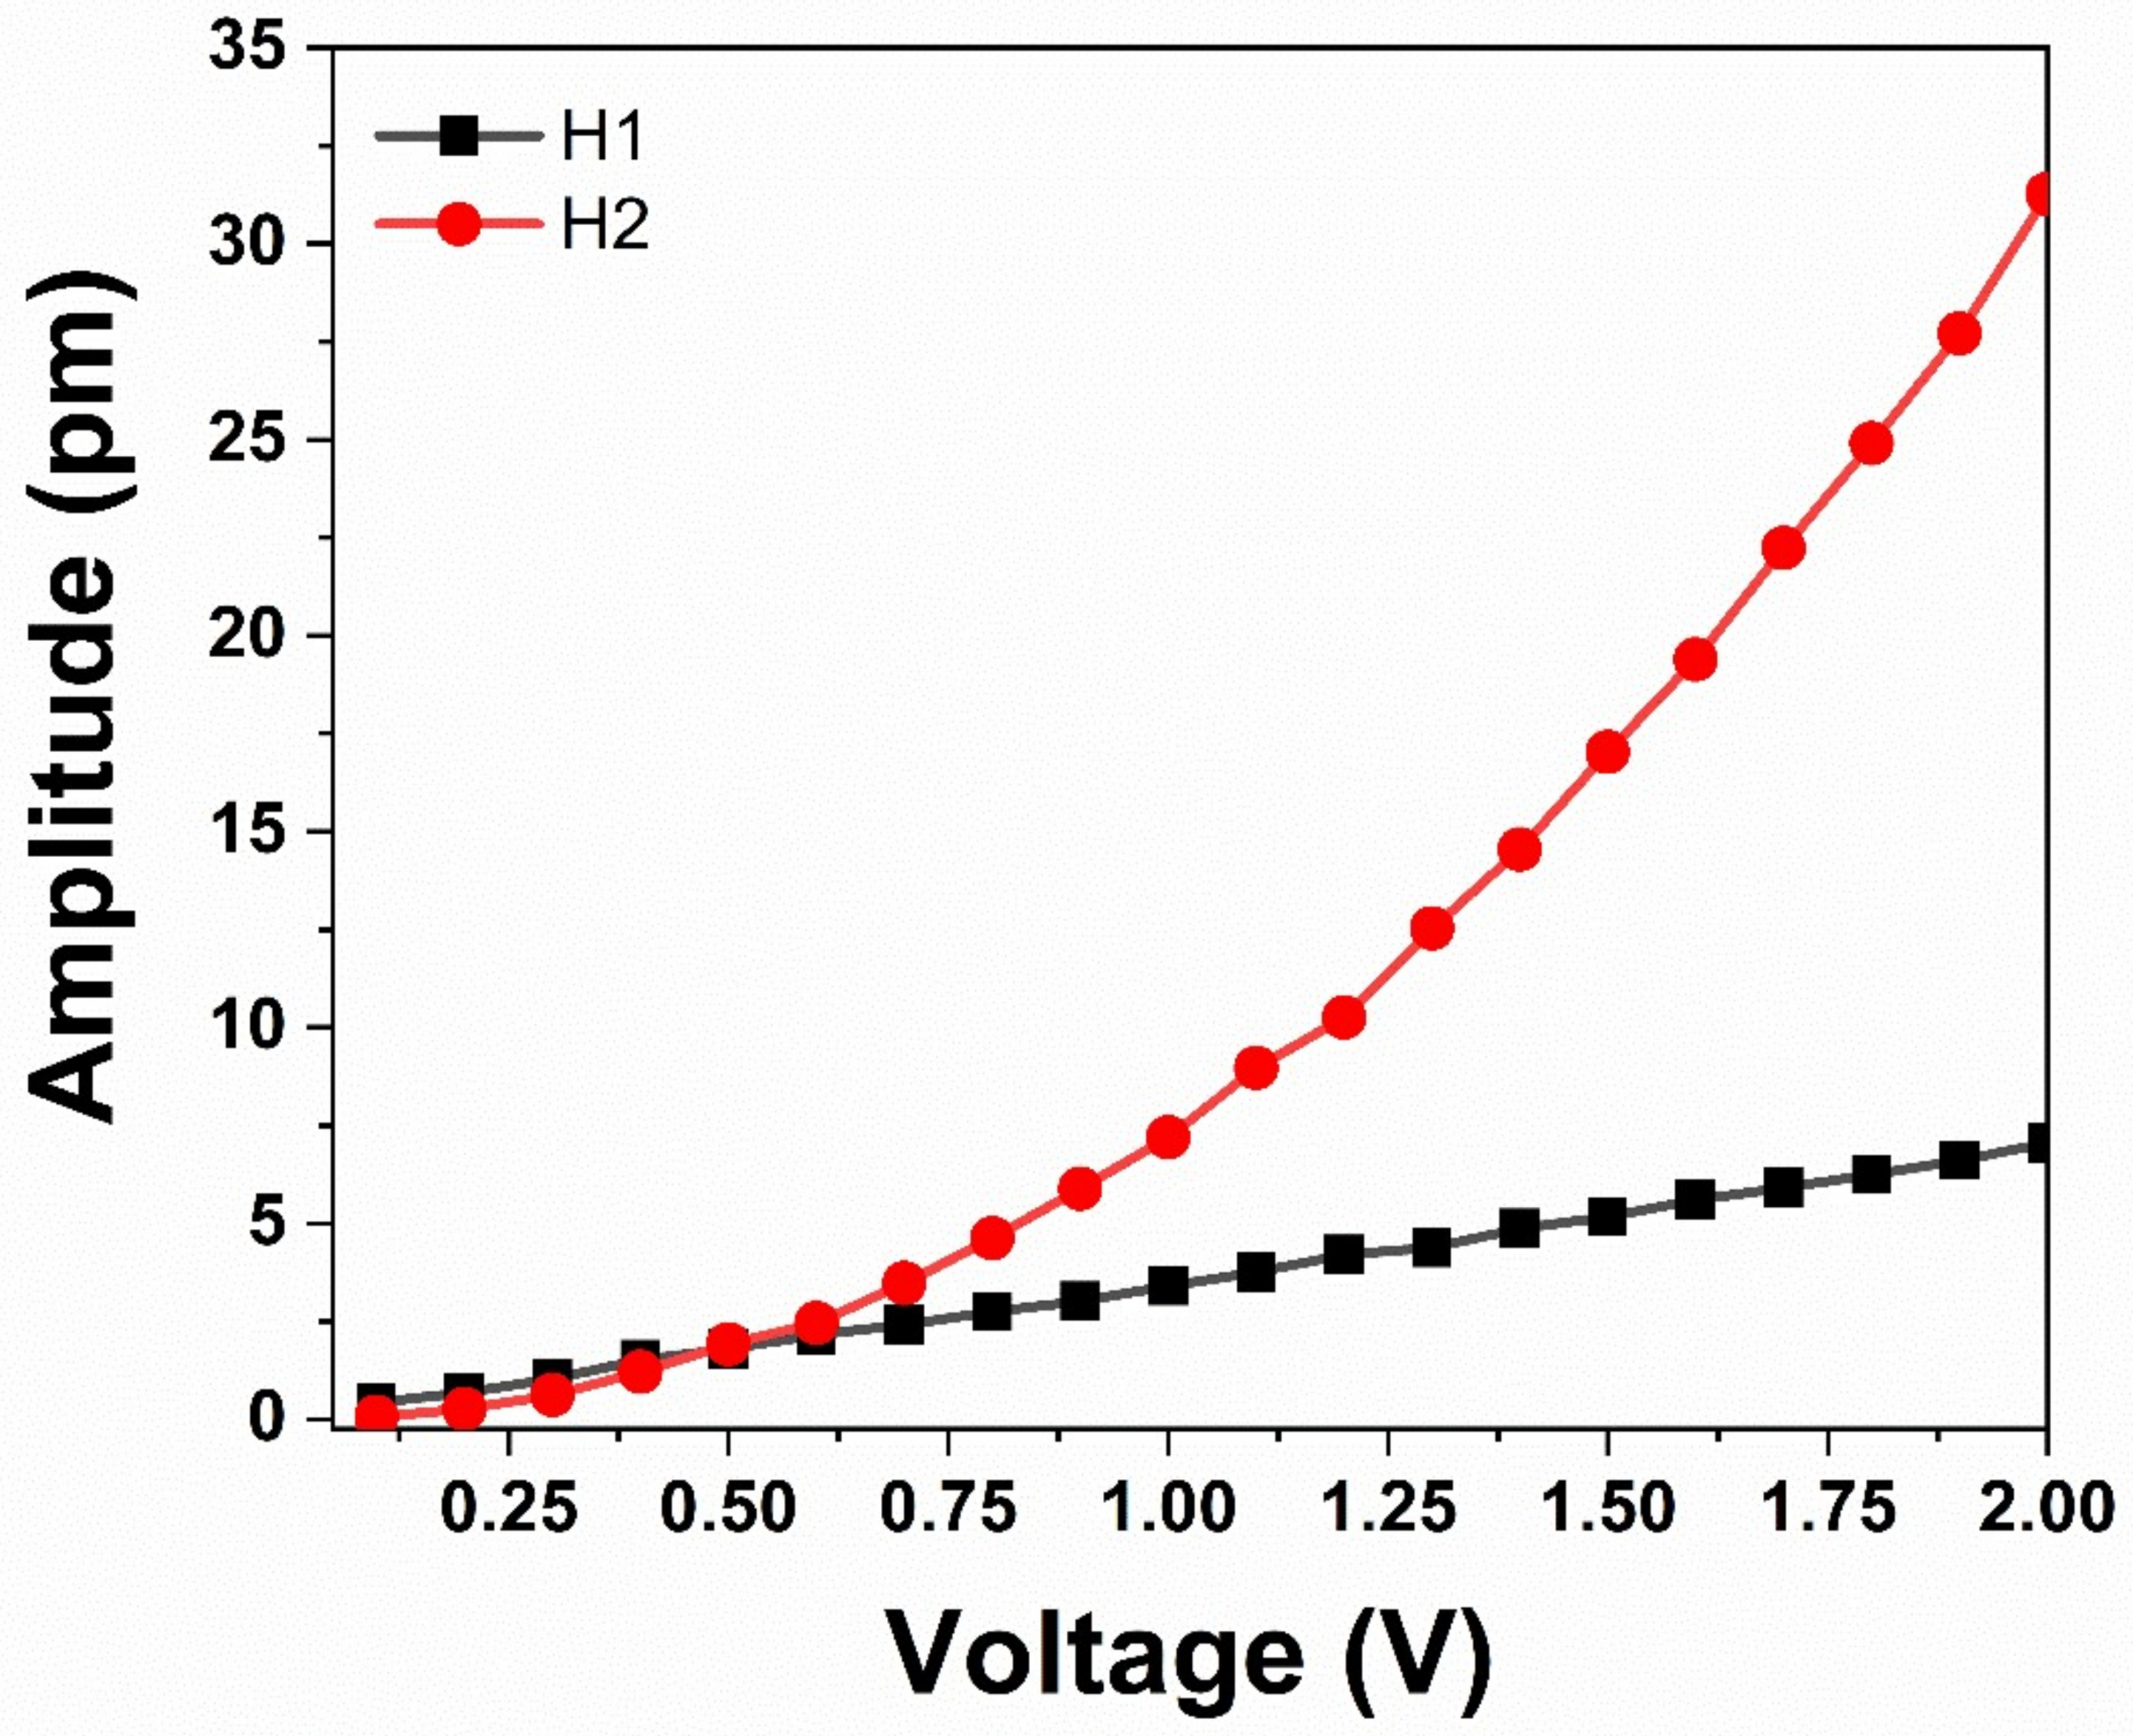
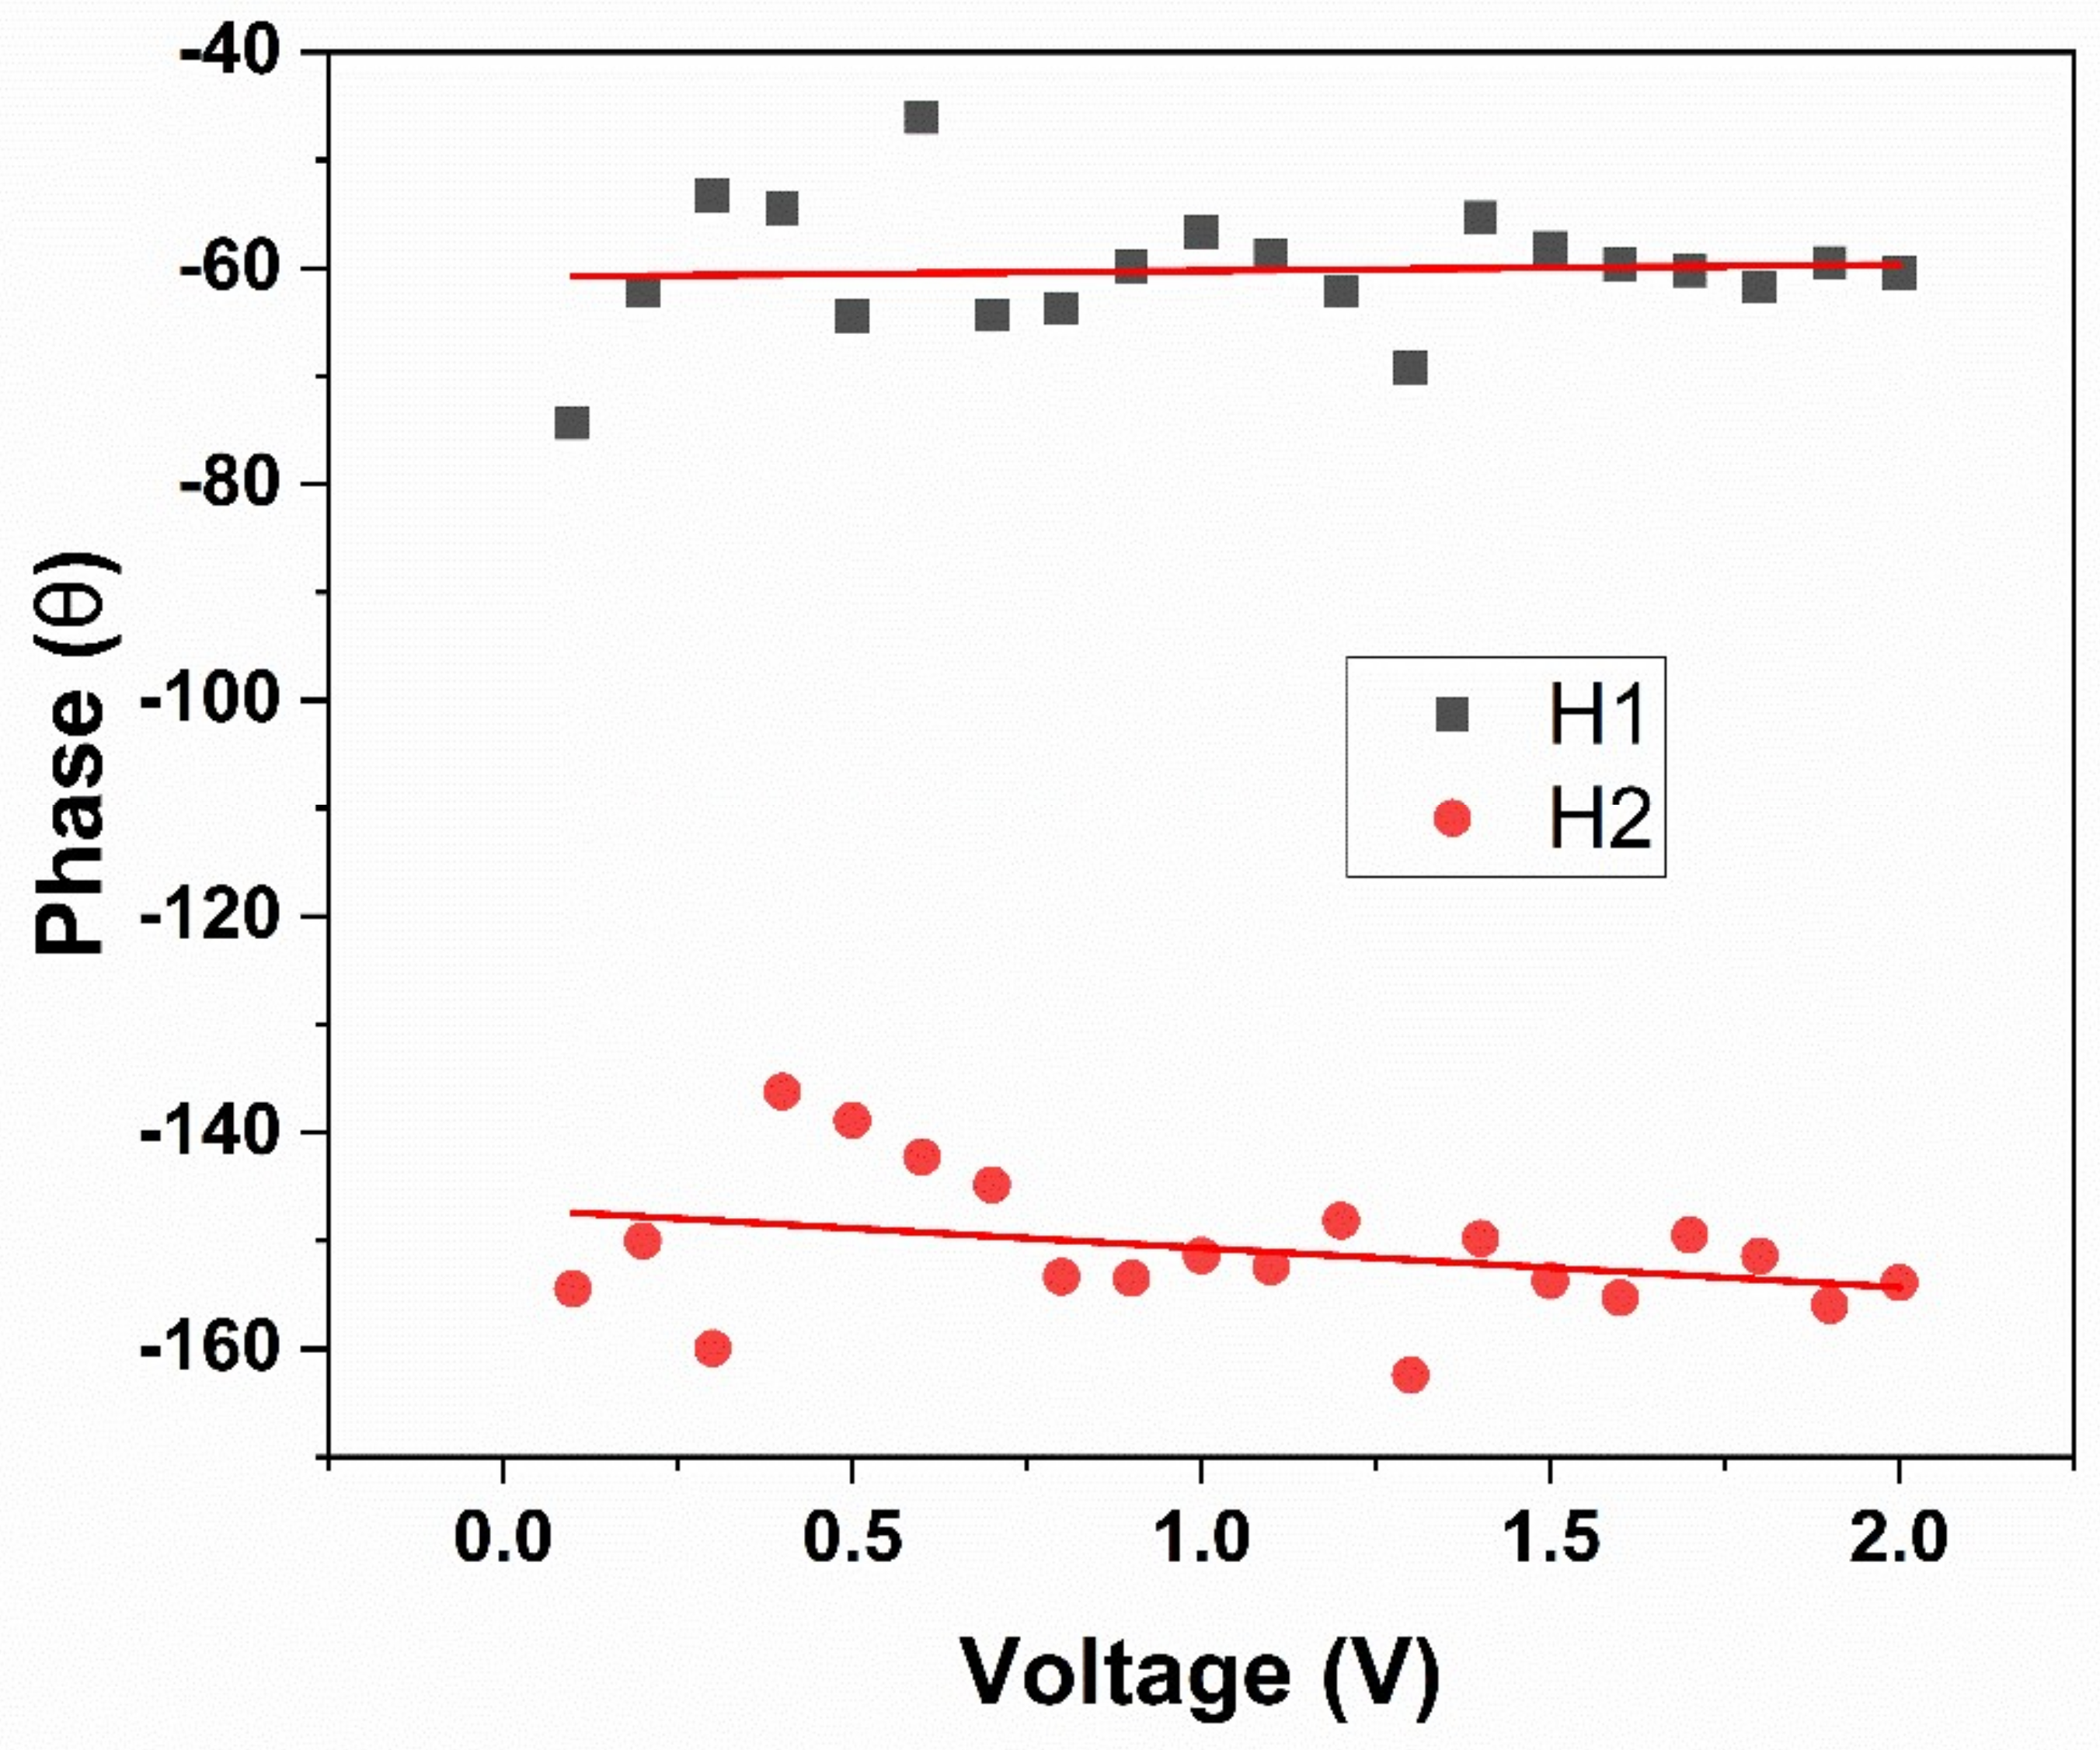
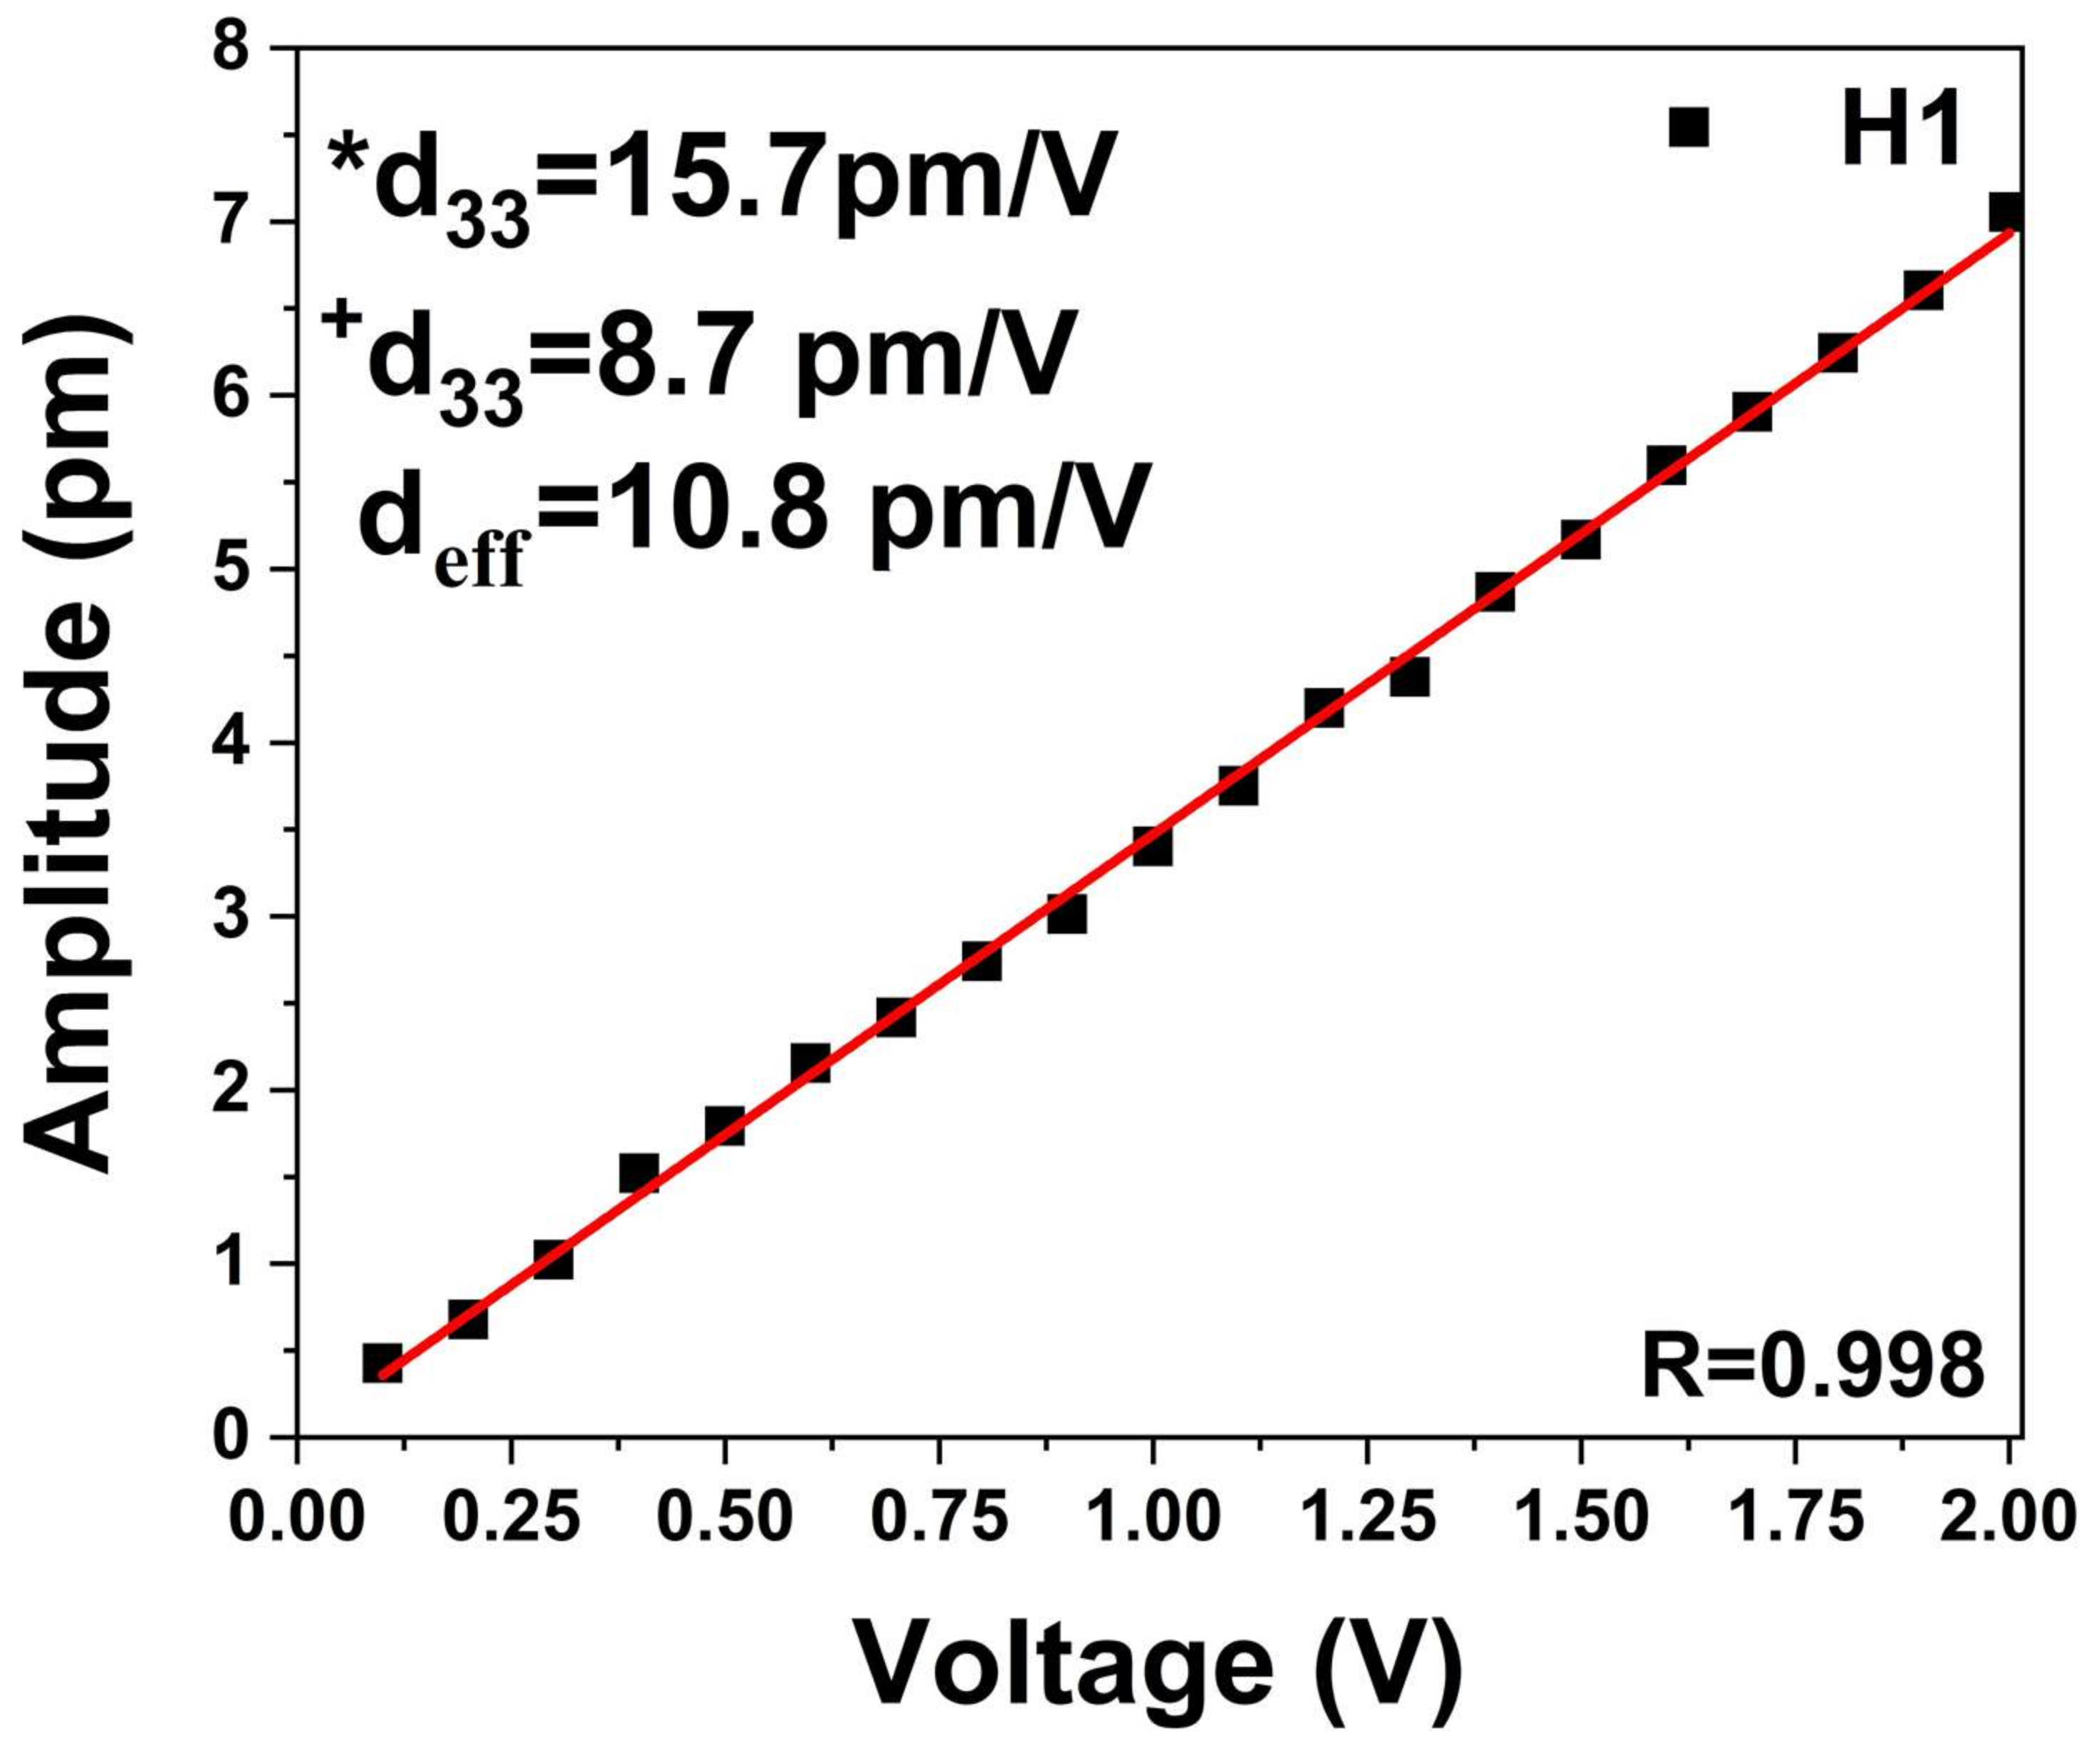
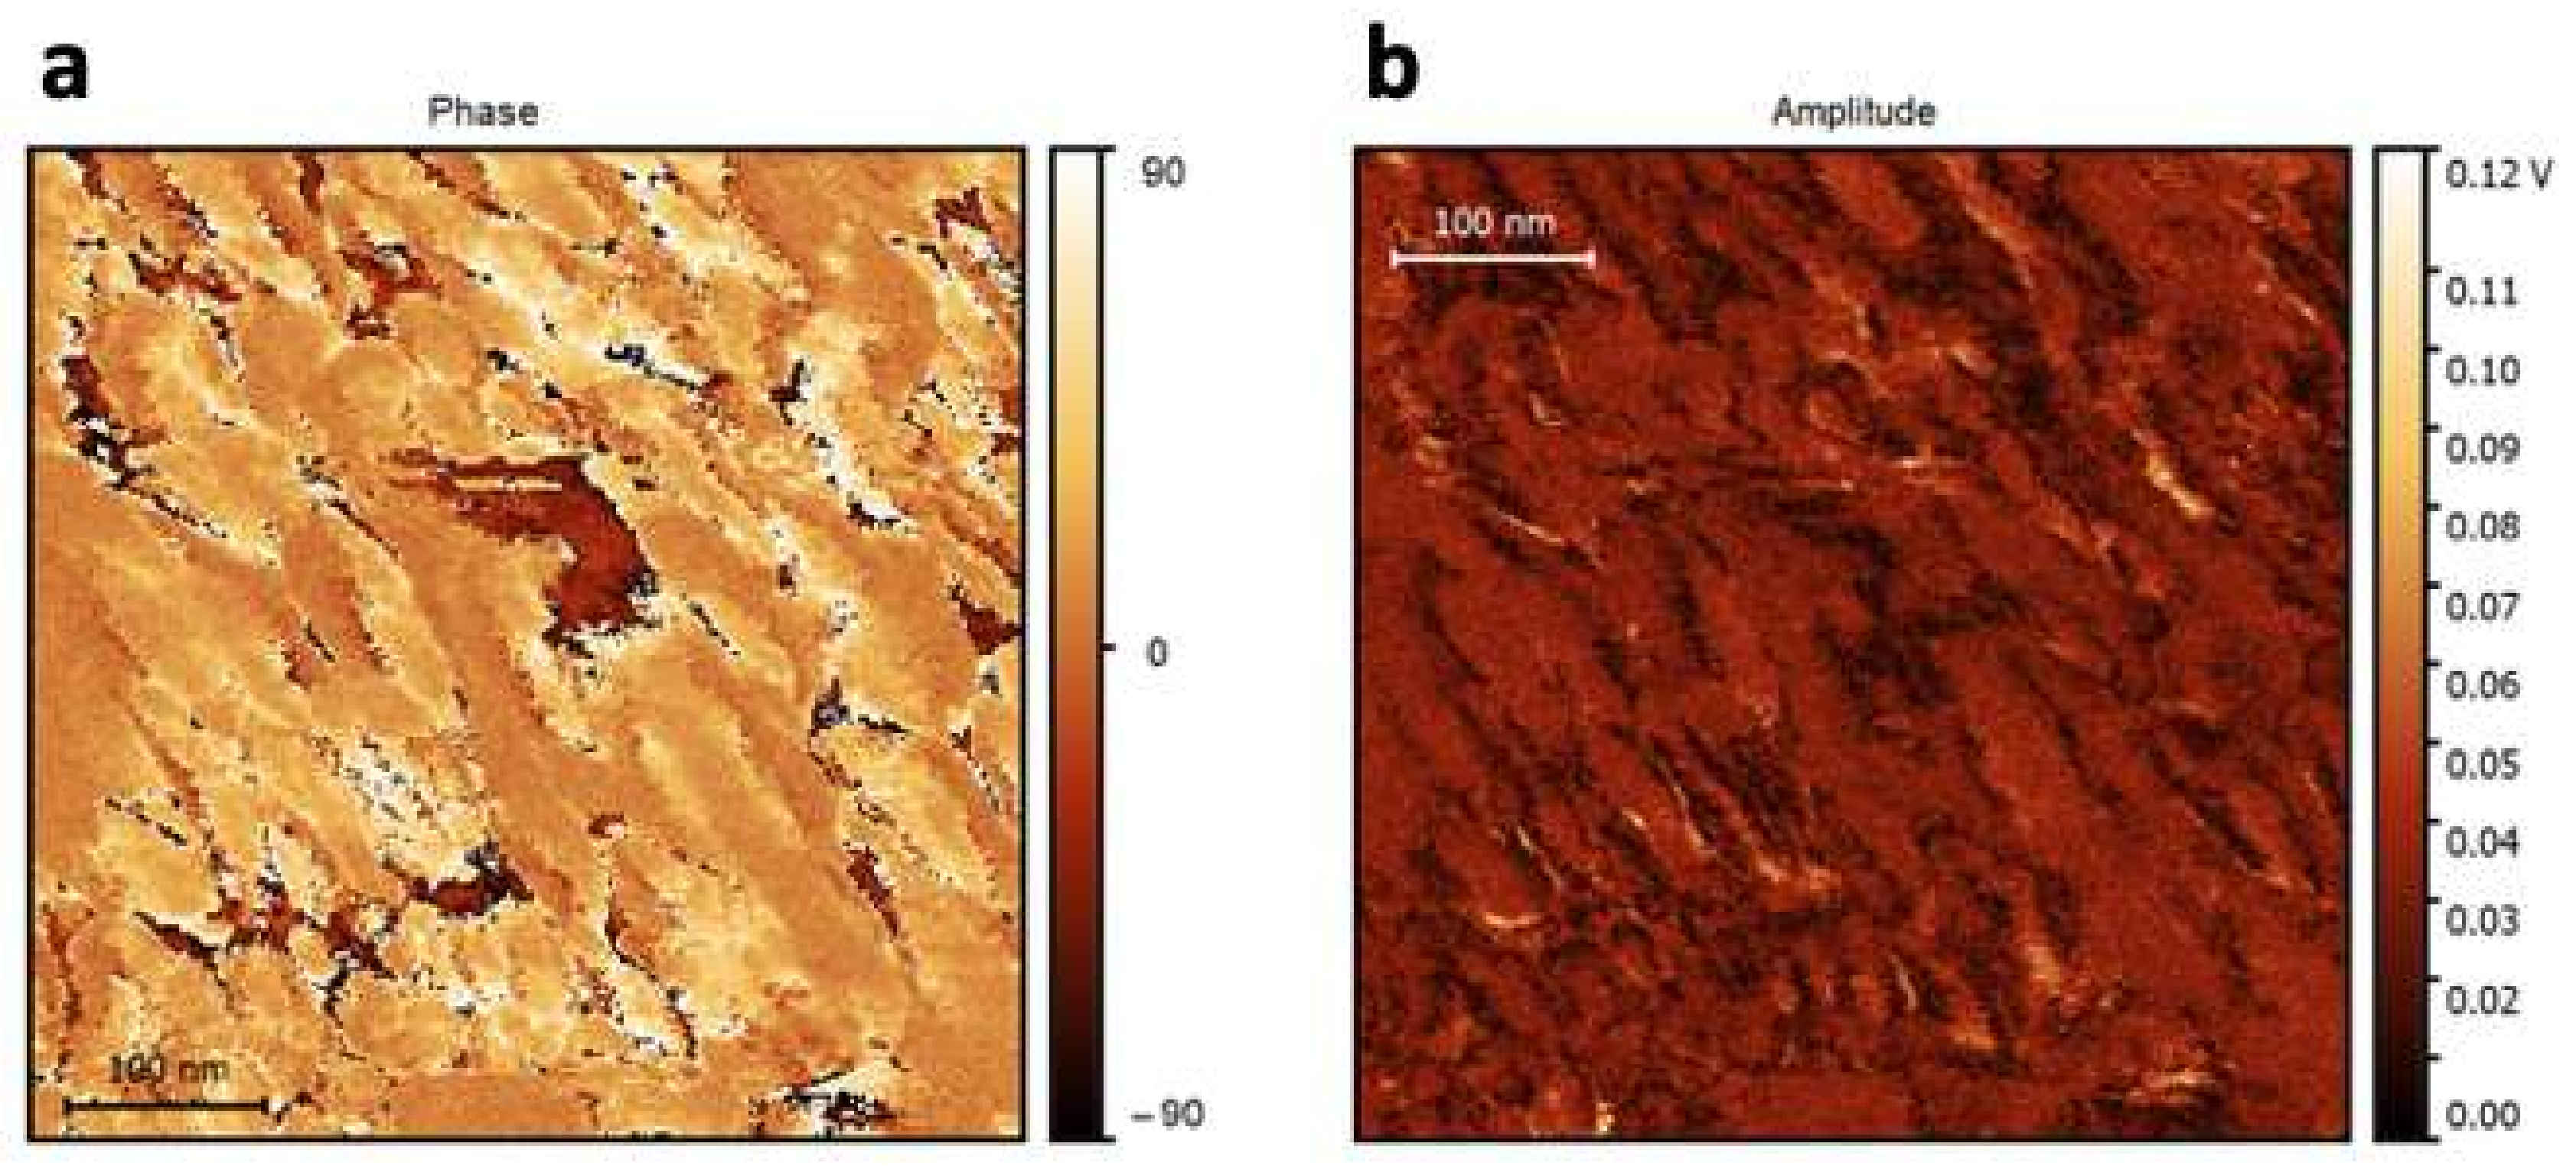
3.2. Local Piezoelectric Properties
4. Conclusions
Author Contributions
Acknowledgments
Conflicts of Interest
References
- Tamai, N.; Myoui, A.; Tomita, T.; Nakase, T.; Tanaka, J.; Ochi, T.; Yoshikawa, H. Novel hydroxyapatite ceramics with an interconnective porous structure exhibit superior osteoconduction in vivo. J. Biomed. Mater. Res. 2002, 59, 110–117. [Google Scholar] [CrossRef] [PubMed]
- Bucholz, R.W.; Carlton, A.; Holmes, R.E. Hydroxyapatite and Tricalcium Phosphate Bone-Graft Substitutes. Orthoped. Clin. N. Am. 1987, 18, 323–334. [Google Scholar]
- Bucholz, R.W.; Carlton, A.; Holmes, R. Interporous Hydroxyapatite as a Bone-Graft Substitute in Tibial Plateau Fractures. Clin. Orthop. Relat. Res. 1989, 240, 53–62. [Google Scholar] [CrossRef]
- Ayers, R.A.; Simske, S.J.; Nunes, C.R.; Wolford, L.M. Long-term bone ingrowth and residual microhardness of porous block hydroxyapatite implants in humans. J. Oral Maxil. Surg. 1998, 56, 1297–1301. [Google Scholar] [CrossRef]
- Ohgushi, H.; Goldberg, V.M.; Caplan, A.I. Repair of Bone Defects with Marrow-Cells and Porous Ceramic–Experiments in Rats. Acta Orthop. Scand. 1989, 60, 334–339. [Google Scholar] [CrossRef] [PubMed]
- Uchida, A.; Araki, N.; Shinto, Y.; Yoshikawa, H.; Kurisaki, E.; Ono, K. The Use of Calcium Hydroxyapatite Ceramic in Bone-Tumor Surgery. J. Bone Joint Surg. Br. 1990, 72, 298–302. [Google Scholar] [CrossRef]
- Heise, U.; Osborn, J.F.; Duwe, F. Hydroxyapatite Ceramic as a Bone Substitute. Int. Orthop. 1990, 14, 329–338. [Google Scholar] [CrossRef]
- Dutta, S.R.; Passi, D.; Singh, P.; Bhuibhar, A. Ceramic and non-ceramic hydroxyapatite as a bone graft material: A brief review. Irish J. Med. Sci. 2015, 184, 101–106. [Google Scholar] [CrossRef]
- Orlovskii, V.P.; Komlev, V.S.; Barinov, S.M. Hydroxyapatite and hydroxyapatite-based ceramics. Inorg. Mater. 2002, 38, 973–984. [Google Scholar] [CrossRef]
- Ma, G.B.; Liu, X.Y. Hydroxyapatite: Hexagonal or Monoclinic? Cryst. Growth Des. 2009, 9, 2991–2994. [Google Scholar] [CrossRef]
- Uskokovic, V. The role of hydroxyl channel in defining selected physicochemical peculiarities exhibited by hydroxyapatite. Rsc Adv. 2015, 5, 36614–36633. [Google Scholar] [CrossRef] [PubMed] [Green Version]
- Yashima, M.; Kubo, N.; Omoto, K.; Fujimori, H.; Fujii, K.; Ohoyama, K. Diffusion Path and Conduction Mechanism of Protons in Hydroxyapatite. J. Phys. Chem. C 2014, 118, 5180–5187. [Google Scholar] [CrossRef]
- Haverty, D.; Tofail, S.A.M.; Stanton, K.T.; McMonagle, J.B. Structure and stability of hydroxyapatite: Density functional calculation and Rietveld analysis. Phys. Rev. B 2005, 71, 094103. [Google Scholar] [CrossRef]
- Nye, J.F. Physical Properties of Crystals; Clarendon Press: Oxford, UK, 1985. [Google Scholar]
- Robles-Aguila, M.J.; Mendoza, M.E.; Davila-Jimenez, M.M.; Bentrup, U.; Elizalde-Gonzalez, M.P. Influence of Ni doping on the structural, optical and textural properties of TiO2 nanocrystals prepared via an ultrasound assisted sol-gel method. J. Sol-Gel Sci. Technol. 2014, 69, 571–579. [Google Scholar] [CrossRef]
- Fang, Y.; Agrawal, D.K.; Roy, D.M.; Roy, R. Fabrication of Porous Hydroxyapatite Ceramics by Microwave Processing. J. Mater. Res. 1992, 7, 490–494. [Google Scholar] [CrossRef]
- Fukada, E.; Yasuda, I. On the Piezoelectric Effect of Bone. J. Phys. Soc. Jpn. 1957, 12, 1158–1162. [Google Scholar] [CrossRef] [Green Version]
- Halperin, C.; Mutchnik, S.; Agronin, A.; Molotskii, M.; Urenski, P.; Salai, M.; Rosenman, G. Piezoelectric effect in human bones studied in nanometer scale. Nano Lett. 2004, 4, 1253–1256. [Google Scholar] [CrossRef]
- Bystrov, V.S. Piezoelectricity in the Ordered Monoclinic Hydroxyapatite. Ferroelectrics 2015, 475, 148–153. [Google Scholar] [CrossRef]
- Gandhi, A.A.; Wojtas, M.; Lang, S.B.; Kholkin, A.L.; Tofail, S.A.M. Piezoelectricity in Poled Hydroxyapatite Ceramics. J. Am. Ceram. Soc. 2014, 97, 2867–2872. [Google Scholar] [CrossRef]
- Robles-Aguila, M.J.; Reyes-Avendano, J.A.; Mendoza, M.E. Structural analysis of metal-doped (Mn, Fe, Co, Ni, Cu, Zn) calcium hydroxyapatite synthetized by a sol-gel microwave-assisted method. Ceram. Int. 2017, 43, 12705–12709. [Google Scholar] [CrossRef]
- Degen, T.; Sadki, M.; Bron, E.; Konig, U.; Nenert, G. The HighScore suite. Powder Diffr. 2014, 29, S13–S18. [Google Scholar] [CrossRef] [Green Version]
- Kalinin, A.S.; Polyakov, V.V.; Bykov, V.A. Hybrid mode piezoresponse force microscopy for compositional electromechanical study of biopiezoelectrics. J. Phys. Conf. Ser. 2017, 917, 042018. [Google Scholar] [CrossRef] [Green Version]
- Wilson, R.M.; Elliot, J.C.; Dowker, S.E.P. Rietveld refinement of the crystallographic structure of human dental enamel apatites. Am. Mineral. 1999, 84, 1406–1414. [Google Scholar] [CrossRef]
- Ikoma, T.; Yamazaki, A.; Nakamura, S.; Akao, M. Preparation and structure refinement of monoclinic hydroxyapatite. J. Solid State Chem. 1999, 144, 272–276. [Google Scholar] [CrossRef]
- Chen, Q.N.; Ou, Y.; Ma, F.Y.; Li, J.Y. Mechanisms of electromechanical coupling in strain based scanning probe microscopy. Appl. Phys. Lett. 2014, 104. [Google Scholar] [CrossRef]
- Proksch, R. Electrochemical strain microscopy of silica glasses. J. Appl. Phys. 2014, 116, 66804. [Google Scholar] [CrossRef] [Green Version]
- Liu, Y.M.; Zhang, Y.H.; Chow, M.J.; Chen, Q.N.; Li, J.Y. Biological Ferroelectricity Uncovered in Aortic Walls by Piezoresponse Force Microscopy. Phys. Rev. Lett. 2012, 108, 078103. [Google Scholar] [CrossRef]
- Gharb, N.B.; Trolier-McKinstry, S.; Damjanovic, D. Piezoelectric nonlinearity in ferroelectric thin films. J. Appl. Phys. 2006, 100, 044107. [Google Scholar] [CrossRef]
- Cockbain, A.G. The crystal chemistry of apatites. Miner. Mag. 1968, 36, 654–660. [Google Scholar] [CrossRef]
- Yang, S.M.; Okatan, M.B.; Paranthaman, M.P.; Jesse, S.; Noh, T.W.; Kalinin, S.V. Second harmonic detection in the electrochemical strain microscopy of Ag-ion conducting glass. Appl. Phys. Lett. 2014, 105, 193106. [Google Scholar] [CrossRef] [Green Version]
- Bouyer, E.; Gitzhofer, F.; Boulos, M.I. Morphological study of hydroxyapatite nanocrystals suspension. J. Mat. Sci. Mater. Med. 2000, 11, 523–531. [Google Scholar] [CrossRef]


| Parameter | XRD Synchrotron |
|---|---|
| Rwp (%) | 3.5272 |
| Monoclinic | 80.94% |
| a (Å) | 9.3822 (2) |
| b (Å) | 6.89224 (8) |
| c (Å) | 18.7962 (6) |
| Hexagonal | 19.06% |
| a (Å) | 9.4758 (7) |
| b (Å) | 9.4758 (7) |
| c (Å) | 6.8919 (4) |
© 2018 by the authors. Licensee MDPI, Basel, Switzerland. This article is an open access article distributed under the terms and conditions of the Creative Commons Attribution (CC BY) license (http://creativecommons.org/licenses/by/4.0/).
Share and Cite
Pérez-Solis, R.; Gervacio-Arciniega, J.J.; Joseph, B.; Mendoza, M.E.; Moreno, A. Synthesis and Characterization of a Monoclinic Crystalline Phase of Hydroxyapatite by Synchrotron X-ray Powder Diffraction and Piezoresponse Force Microscopy. Crystals 2018, 8, 458. https://doi.org/10.3390/cryst8120458
Pérez-Solis R, Gervacio-Arciniega JJ, Joseph B, Mendoza ME, Moreno A. Synthesis and Characterization of a Monoclinic Crystalline Phase of Hydroxyapatite by Synchrotron X-ray Powder Diffraction and Piezoresponse Force Microscopy. Crystals. 2018; 8(12):458. https://doi.org/10.3390/cryst8120458
Chicago/Turabian StylePérez-Solis, Ricardo, José Juan Gervacio-Arciniega, Boby Joseph, María Eugenia Mendoza, and Abel Moreno. 2018. "Synthesis and Characterization of a Monoclinic Crystalline Phase of Hydroxyapatite by Synchrotron X-ray Powder Diffraction and Piezoresponse Force Microscopy" Crystals 8, no. 12: 458. https://doi.org/10.3390/cryst8120458