Article

Results from Exploratory Work in Li-Rich Regions of the AE-Li-Ge Systems (AE = Ca, Sr, Ba)

1
Department of Chemistry & Biochemistry, University of Delaware, Newark, DE 19716, USA
2
School of Materials Science and Engineering, Dalian Jiaotong University, Dalian 116028, China
*
Author to whom correspondence should be addressed.
Crystals 2024, 14(1), 57; https://doi.org/10.3390/cryst14010057
Submission received: 15 December 2023 / Revised: 28 December 2023 / Accepted: 29 December 2023 / Published: 31 December 2023
(This article belongs to the Special Issue Advances in Metal-Ion Batteries)

Abstract

:
The compounds AELi2Ge (AE = Ca, Sr and Ba) were synthesized, and their structures were determined as a part of the exploratory work in the Li-rich regions of the respective ternary systems. The three compounds are isostructural, and their crystal structure is analogous with the orthorhombic structure of BaLi2Si and KLi2As (space group Pmmn). The atomic arrangement can be viewed as an intergrowth of corrugated AEGe layers, alternated with slabs of Li atoms, suggestive of the possible application of these phases as electrode materials for lithium-ion batteries. Both experimental electronic density and calculated electronic structure suggest the existence of Li–Li and Li–Ge interactions with largely covalent character. Despite that, the valence electrons can be partitioned as (AE2+)(Li+)2(Ge4–), i.e., the title compounds can be viewed as valence-precise Zintl phases. The band structure calculations for BaLi2Ge show that a bona fide energy gap in the band structure does not exist and that the expected poor metallic behavior is originated from the AEGe sub-lattice and related to hybridization of Ba5d and Ge3p states in the valence band in proximity of the Fermi level. In addition, electrochemical measurements indicate that Li atoms can be intercalated into CaGe with a maximum capacity of 446 mAh/g, close to the theoretical value of 480 mAh/g of CaLi2Ge, which reveals the possibility of this Li-rich compound to be used as an electrode in Li-ion batteries.

1. Introduction

Despite the huge investment and extensive studies in the technology of lithium-ion batteries (LIB), the development of LIB still lags far behind the requirement of many electric devices. Most popular electrodes are still based on materials proposed many years ago [1,2,3], like LiCoO2 for cathodes and graphite for anodes. Many current investigations are still focused on improving the energy densities (including specific capacity and working voltage) and rate performance (for fast charge/discharge) of these materials [4,5,6]. One of the main reasons for this is the lack of an effective guideline/way for the discovery of new materials as high-performance electrodes, and many breakthroughs are serendipitous. Modern developments for materials discovery call for the use of density functional theory (DFT) calculations, which mainly predict the most stable structure in the systems [7,8]. Such calculations may take a long time, up to months, and usually yield the most stable structure without the acknowledgement of metastable phases at local minima of energy. Another drawback is the fact that the routine calculation does not take into account the required compositions and functions. Another complication is arising from the fact that many Li-containing compounds are sensitive to air and/or moisture, greatly hindering experimental work. As rule, the lower the concentration of Li in a compound, the more stable the compound is with respect to oxidation by air [9,10]. For instance, the formation energy of Li2CuSb is 0.45 eV higher than that of Li1.5CuSb. Thus, it is difficult to explore phase space for Li-rich compounds.
Since the subjects of this paper are germanides, we can make a case in point by recapping some oddities in the Li–Ge system [11]. For example, years ago, there was a reported “Li3Ge” phase that even today is not reconciled with the crystallographically characterized Li5Ge2 (or the nearby Li7Ge2, re-assigned as Li13Ge4 and Li9Ge4, the structures of which are not well established to date [12,13]). The previously reported “Li4Ge” turns out to be compositionally closest to the compound Li4.1Ge [14], and not Li15Ge4 [15,16] or Li17Ge4 [14]. (The latter has also been referred to as Li21Ge5 or Li22Ge5 in the older literature [17].) When considering ternary systems, a multitude of Li germanides are reported, but very few of them are Li-rich [18,19]. This is also the case in ternary systems containing Li and elements of group 15 [20,21]. It has already been realized that many compounds containing group 14 or 15 elements and metallic elements, especially alkali and alkaline-earth metals, are Zintl phases [22,23,24]. In Zintl phases, there exists a well-defined relationship between chemical and electronic structures [25]. Therefore, using the Zintl concept as a guideline, it should be possible to accelerate the discovery of new materials.
With this paper, we report on the compounds AELi2Ge (AE = Ca, Sr and Ba), which were obtained via our exploratory work in the Li-rich regions of the respective ternary systems. While this research was ongoing, another team published the structures of CaLi2Ge and BaLi2Ge [26], leaving SrLi2Ge as the only new compound covered in this report. We still report the refinements of the structures of CaLi2Ge and BaLi2Ge because our crystallographic analysis is not done at ambient temperature, and comparing the metrics of the three structures can be instructive.

2. Materials and Methods

2.1. Synthesis

Handling of the starting materials [pure elements from Alfa or Aldrich (>99.9 wt%)] was performed inside an argon-filled glovebox or under vacuum. Ba and Ge were used as received. The surface of the Li metal had to be carefully cleaned with a blade every time the metal rod was cut. In a typical experiment, an approx. 1 g mixture of the constituent elements with the desired stoichiometric ratios was loaded into a Nb tube, which was then sealed by arc-welding under an Ar atmosphere. The welded tube was transferred into a high-frequency induction melter, and the containing materials were melted at ca. 1273 K for 3 min. Subsequently, the Nb tube with the melt inside was cooled, taken out and placed inside a fused silica tube, which was then sealed under vacuum. The assembly was heated in a muffle furnace to a temperature of 1073 K (rate of 1 K/min) and equilibrated for 7 days, followed by air cooling to room temperature. The synthesized samples are air sensitive, and the color changes from silver to light brown in hours upon exposure to ambient atmosphere.

2.2. Crystallographic Analysis

Powder X-ray diffraction data were collected at room temperature using a Rigaku MiniFlex powder diffractometer (Cu Kα radiation), which was enclosed and operated inside a nitrogen-filled glovebox to measure air-sensitive samples. The main reflections cannot be matched with known compounds involved in the systems and their oxides, indicating the formation of a new phase. Indexing on the main reflections yield a primitive orthorhombic unit cell.
Single crystals of AELi2Ge were selected from the reaction products after breaking the annealed ingots and mounted on the top of glass fibers using Paratone N oil. Intensity data sets were collected at 200 K on a Bruker SMART CCD-diffractometer quipped with monochromated Mo Kα radiation (λ = 0.71073 Å). The data collection routine in SMART [27] with scans at different angles allowed for full coverage of the reciprocal space up to 2θ ≈ 57–58°. The collected frames were integrated using the SAINT package [28]. Semiempirical absorption correction was applied using SADABS [29]. The structures were solved by direct methods and refined on F2 with the aid of the SHELXTL package [30]. The final difference Fourier maps were flat with highest maxima and minima not larger than 0.5–0.7 e/Å3. This, together with the excellent crystallographic parameters (Table 1 and Table 2), is suggestive of the fact that all structures are devoid of disorder. The experimental electron density was reconstructed by the maximum-entropy method (MEM) using a Dysnomia program [31] and visualized with the VESTA 3 program [32].

2.3. Elemental Analysis

Picked single crystals were mounted onto carbon tape and placed in a JEOL 7400 F electron microscope equipped with an INCA-Oxford energy-dispersive spectrometer. The microscope was operated at 10 μA bean current at 15 kV accelerating potential. Data were acquired for several spots on the same crystal and averaged. The obtained results are in good agreement with the refined compositions (e.g., Ca:Ge ≈ 1:1), and the elemental mapping confirms the homogeneity of the samples. The Li contents were measured using a Spectro Ciros ICP_OES radia view instrument. Generally, 5 mg of product powders were dissolved using a dilute nitric acid (5 mL). All results gave Li contents close to 50%.

2.4. Electronic Structure Calculations

To optimize the geometry of the tetrahedral chains carved out from the BaLi2Ge structure (see the structure description in Section 3), a triclinic unit cell containing only one such unit was constructed first. One direction of the unit cell was chosen to be along the propagation of the chains with a lattice constant equivalent to the Ba—Ba distance in one cluster, while in other directions, the initial lattice constants were 1 nm to ensure the isolation of the individual chains. Structural optimizations were performed with the first-principles pseudopotential-based density functional theory as implemented in SIESTA [33,34], which employs a localized orbital basis in the representation of wave functions. We use soft norm-conserving pseudopotential and the Perdew–Berke-Emzerhof exchange correlation energy within the generalized gradient approximation [35,36]. The optimizations are deemed to have sufficiently converged when the residual forces on any atoms are smaller than 0.001 eV/Å.
Electronic structure calculations were carried out on the optimized and experimentally determined structures using the projector augmented wave method (APW) with spin orbit coupling (SOC) [37,38]. The kinetic energy cut-off for the plane waves was 500 eV. Exchange and correlations were treated in the local density approximation (LDA) [39]. For these calculations, an 8 × 12 × 12 k-point Monkhorst-Pack grid was used.

2.5. Electrochemical Measurements

The fine powders of AELi2Ge compounds are very air sensitive and can be used directly for electrodes. Instead, CaGe fine powders (see the Appendix A for details on the preparation) were used for electrochemical measurements, because CaLi2Ge was expected to be the product from lithiation of CaGe. The CaGe electrodes were prepared by coating slurries containing the active materials (70 wt%), super P carbon conductive agents (20 wt%) and a binder (polyvinylidenedifluoride, 10 wt%), dissolved in N-Mehyl-2-pyrrolidone (99.5%, Aldrich). The resulting slurries were cast onto a copper foil current collector and then dried in a vacuum oven at 120 °C for 5 h. After drying, the electrodes were punched into a coin shape of 12 mm diameter. The electrochemical performance was evaluated using CR2032 coin-type cells assembled in an Ar-filled glovebox. Li metal foil was used as a counter electrode, and a 1 M LiPF6 solution in EC/DEC (1:1, v/v) (battery grade, Aldrich) was employed as an electrolyte. Electrochemical measurements were performed within 0.01−3 V at a current density of 50 mA/g using Neware battery testers at room temperature (298 K). The charge/discharge cells were open inside the Ar-filled glovebox, and then the electrodes were cleaned using dimethyl carbonate (99%, Aldrich) to remove any electrolytes before the ex situ XRD measurements.

3. Results and Discussion

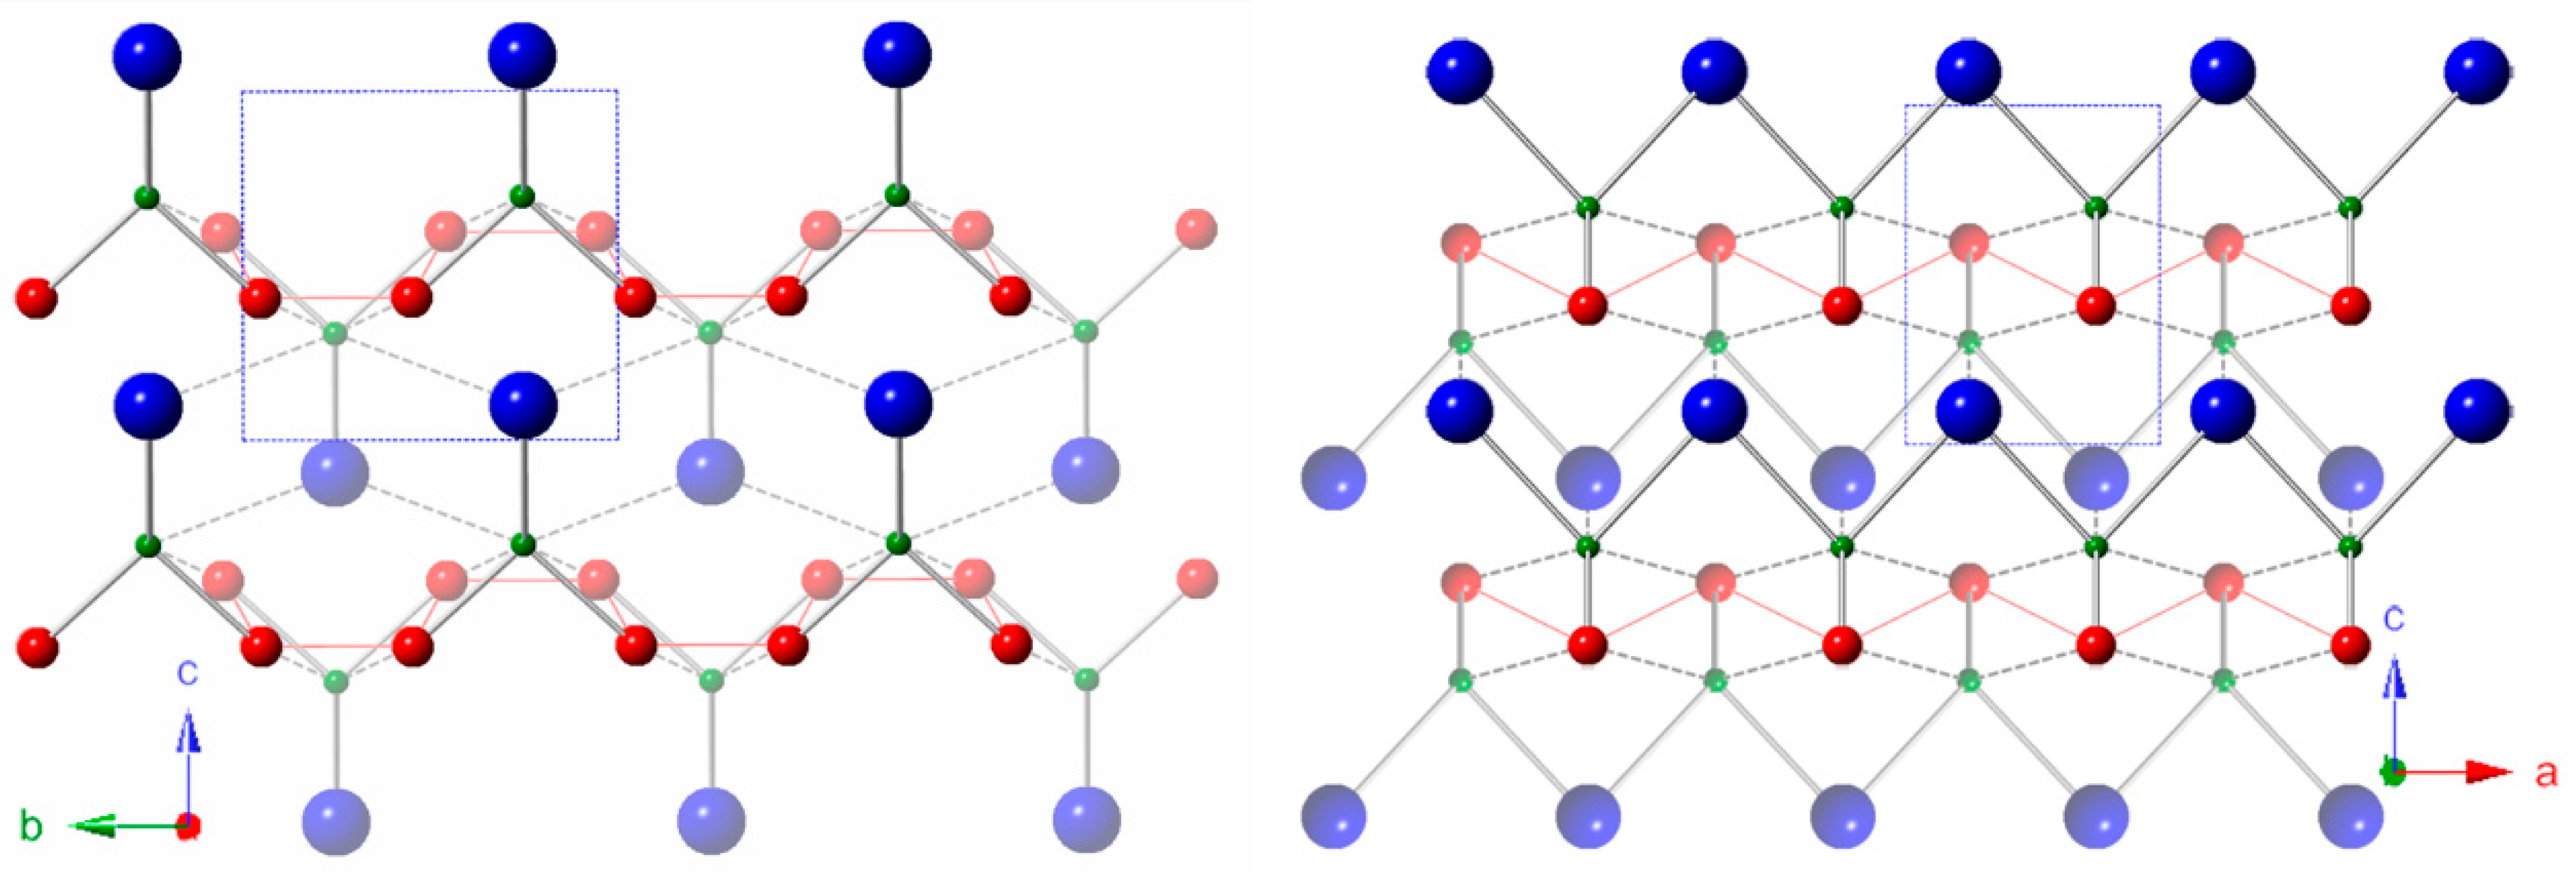
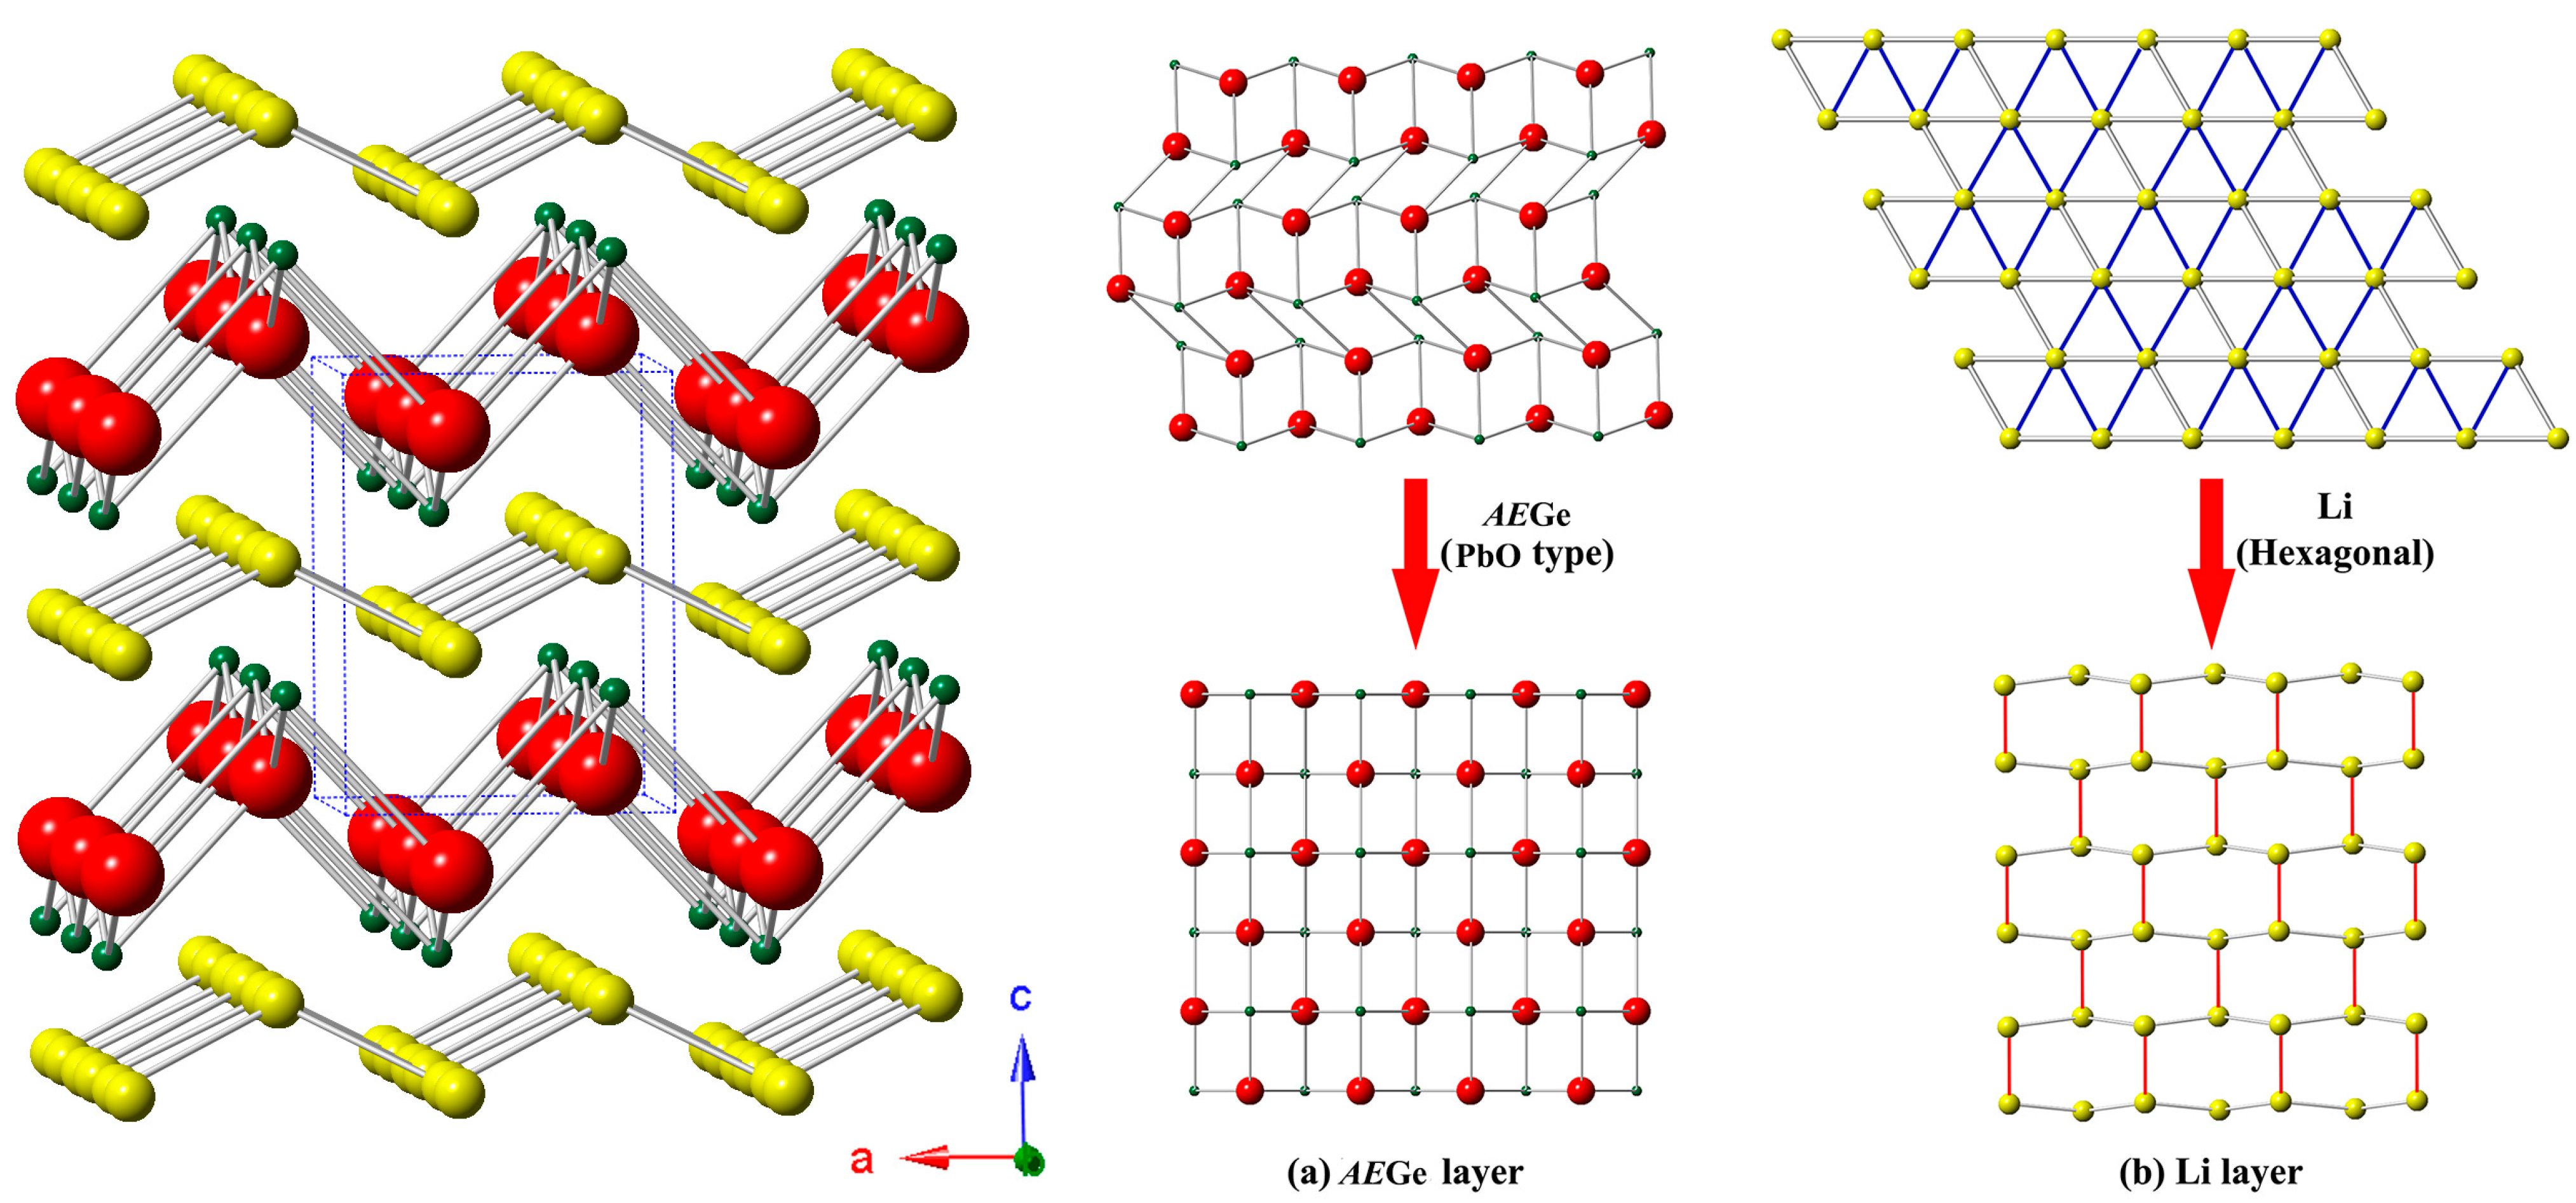
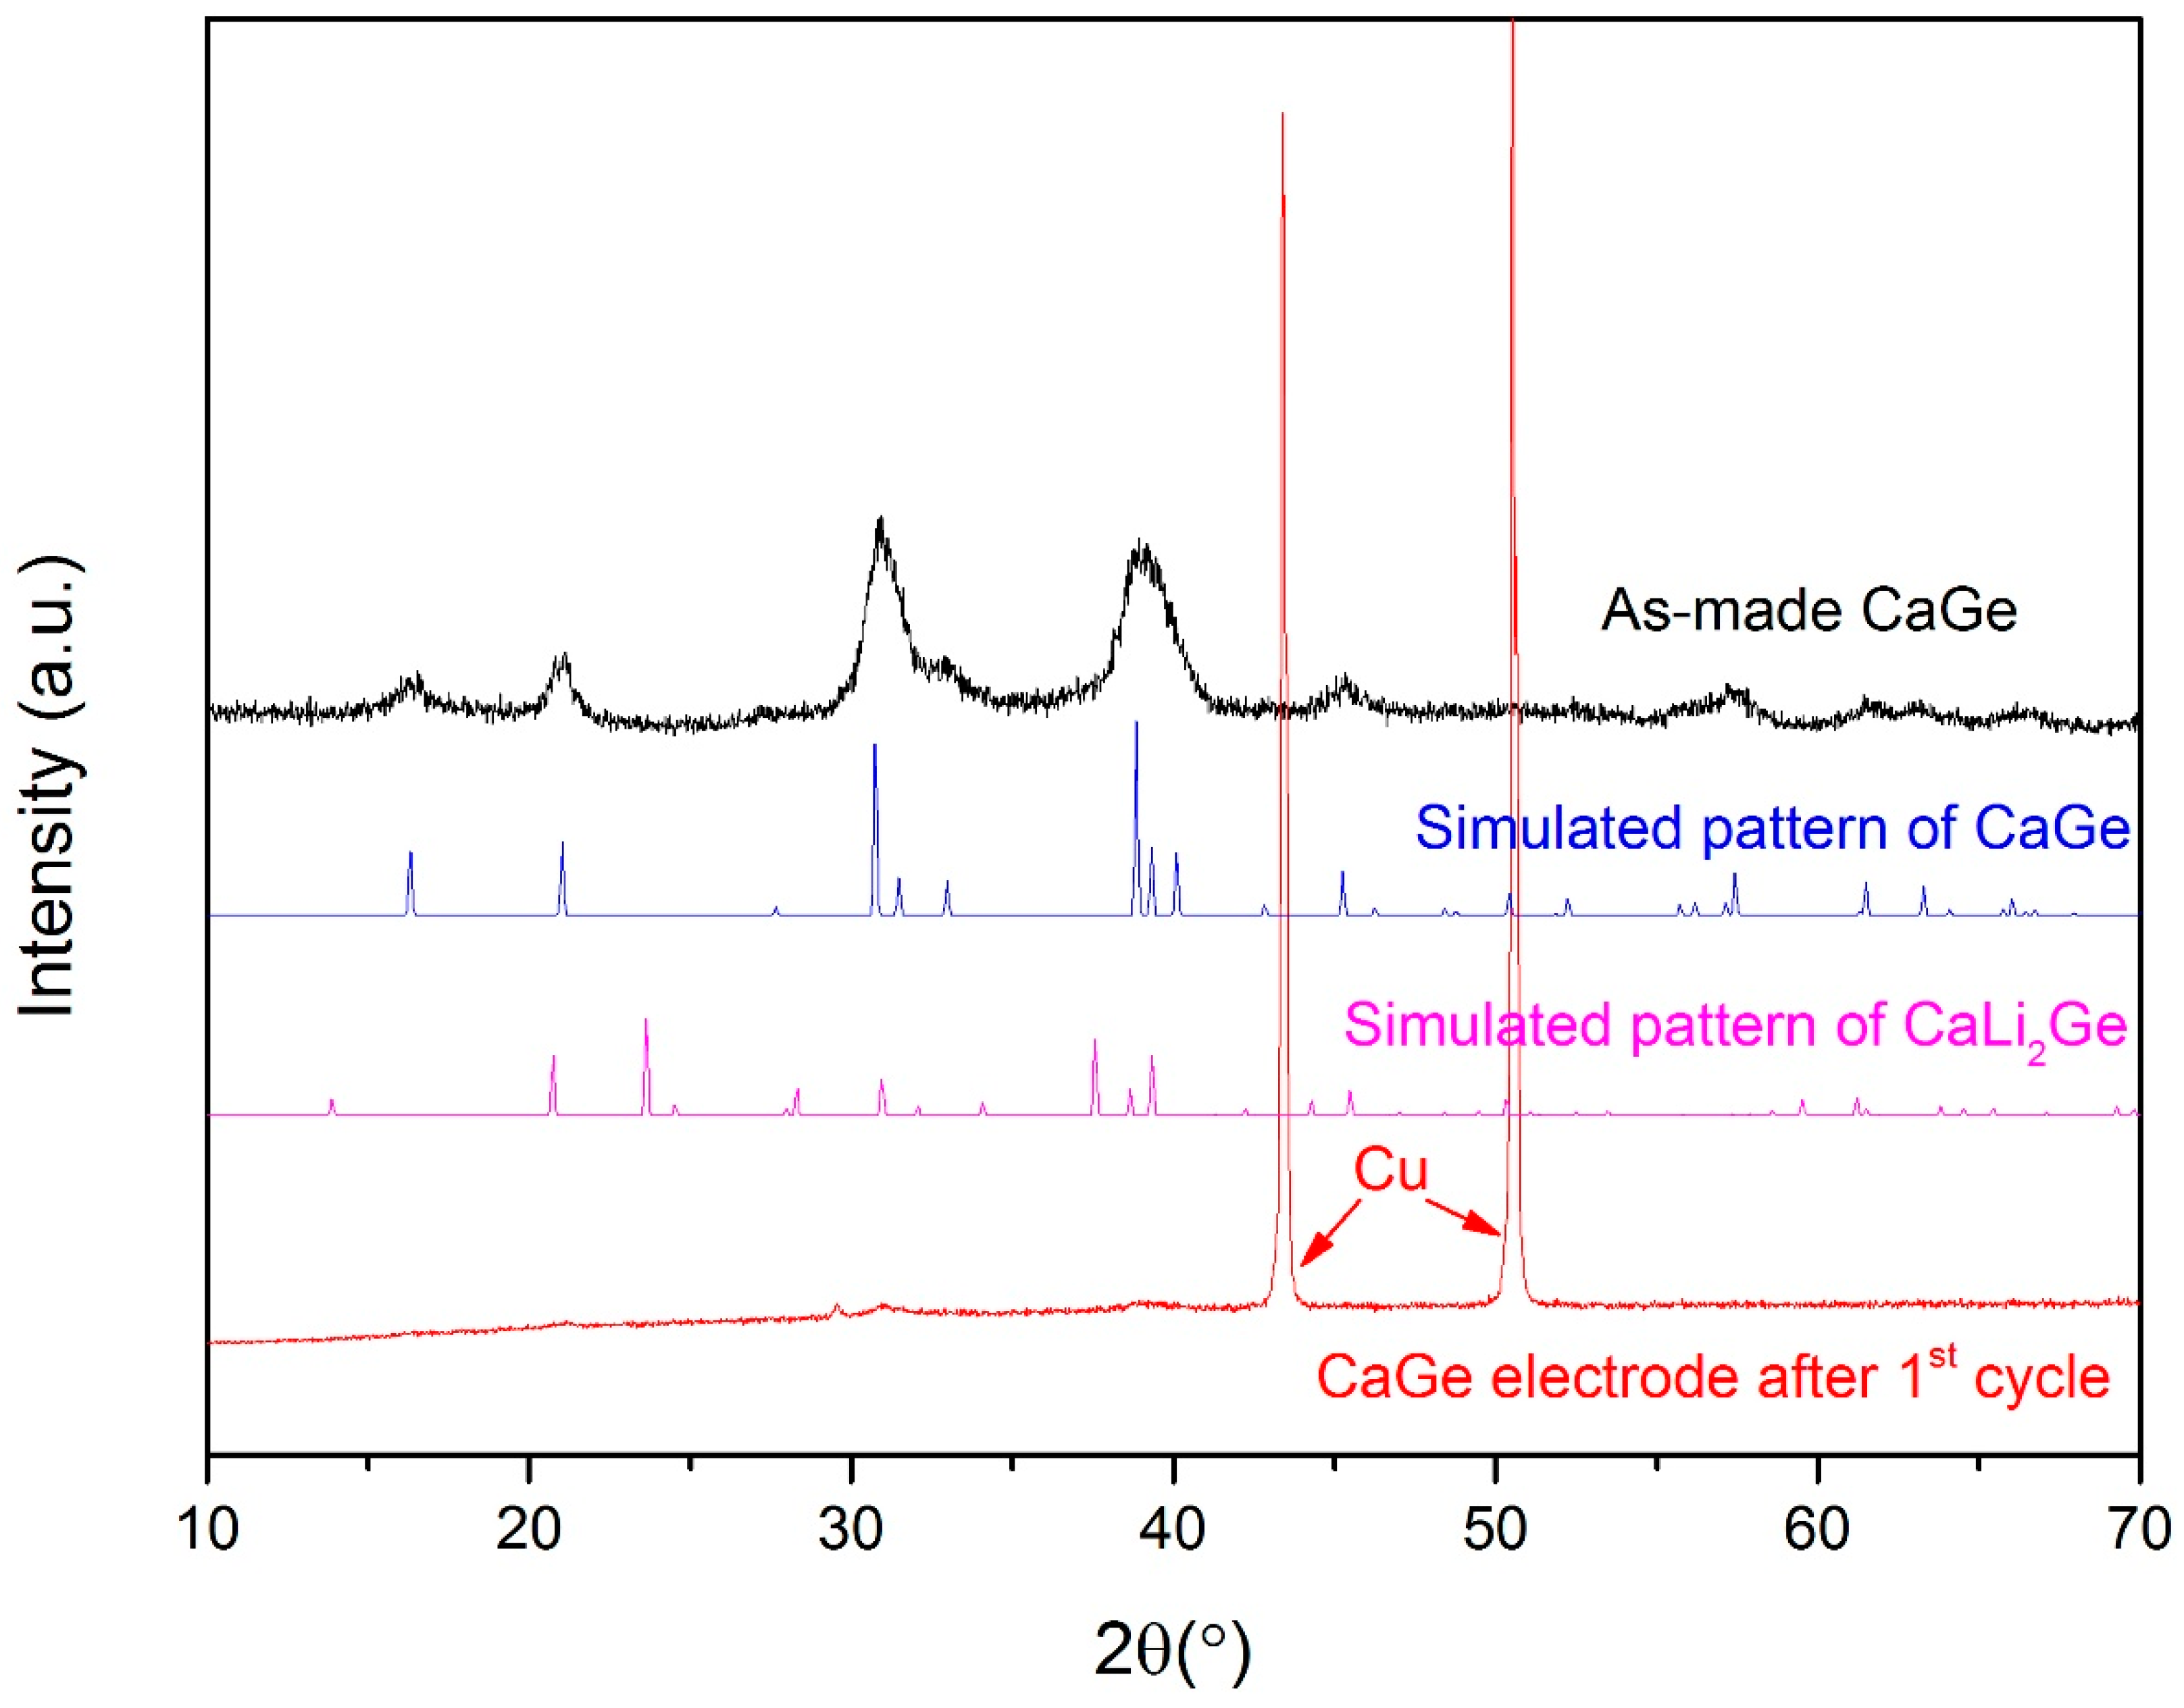
3.1. Crystal Structure

During the process of electrochemical tests and manuscript preparation, CaLi2Ge and BaLi2Ge were synthesized from Li flux, and their structures were reported by another research team [26]. The structure refinements at 200 K that we provide here (Table 1) are in excellent agreement with the reported ones [26]. Comparing structural parameters reported at ambient temperature with the present results shows that the CaLi2Ge crystal exhibits a very small thermal expansion: a and c are almost constant from 200 K to room temperature (4.650(2) Å vs. 4.6498(3) Å and 6.364(3) Å vs. 6.3683(4) Å), while in BaLi2Ge, the thermal expansion is relatively larger along the a axis (4.7092(9) Å vs. 4.7141(2) Å) and smaller or nonexistent along the b and c axes, respectively (6.7593(9) Å vs. 6.7655(3) Å and 6.2923(7) Å vs. 6.3042(3) Å).
The crystal structure of AELi2Ge (AE = Ca, Sr, Ba) is schematically illustrated in Figure 1. The structure is formally assigned as belonging to the BaLi2Si type (Pearson symbol oP8) with space group Pmmn (no. 59). One way to look at the structure of AELi2Ge is to consider tetrahedral chains forming along the a axis; the construction of these chains requires drawing bonds between Li and AE to the nearest Ge atoms. Such chains are also coupled with two neighboring chains along the b axis through Li—Li and Ge—Li interactions, which as judged by the interatomic distances must have appreciable covalent character. Taking into account only these linked chains yields a layered structure, while including the various AE—Ge or AE—Li interactions between neighboring layers results in a 3D-like formation, depending on the nature of AE. According to the refined distances listed in Table 3, the Ca—Ge distance (3.1162(17) Å) is shorter than the Ca—Li distance (3.2367(9) Å), and the Ba—Ge distance (3.4503(4) Å) between nearest neighbors is longer than the contact Ba—Li (3.4023(3) Å).
The structure under consideration can also be characterized as the intergrowth of two slabs: (1) “AEGe” (PbO-like motif) and (2) “Li” slabs, as shown in Figure 2. The slab “Li” is just a cutout from the hexagonally close-packed structure of Li metal. This allows the present structure to be regarded as a “Li-intercalated” AEGe phase, although, in reality, the structures of the alkaline-earth monogermanides are different. Nonetheless, this analogy can useful if AEGes are to be treated as electrodes in LIB.
In the BaLi2Ge structure, the shortest Ba—Ge distance is 3.4505(6) Å, close to the values seen in other Ba-Ge and Ba-Li-Ge compounds—BaGe2 (3.42 Å) [40], BaLiGe2 (3.37 Å) [41], Ba2LiGe3 (3.42 Å) [42,43], Ba8Li5Ge41 (3.42 Å) [44]—while the second shortest Ba—Ge distance 3.62 Å is larger than these typical values, indicative of the weaker interactions between layers. In contrast, the shortest Li—Ge distance (2.72 Å) is close to the second shortest Li—Ge distance (2.80 Å). Both Li—Ge distances are longer than those in many ternary compounds: BaLiGe2 (2.70 Å) [41], Ba2LiGe3 (2.58 Å) [42,43], RE3Li4Ge4 (2.62–2.69 Å) [44] and RE2Li2Ge3 (2.56–2.62) Å) [45] but close to the values reported for some ternary compounds such as LiZnGe (2.78 Å) [46]. Such longer Li—Ge distances suggest enhanced metallic characters compared with the reported alkaline-earth metal lithium germanides and rare-earth metal lithium germanides. The implied lesser covalency allows the valence electrons to be shared in multi-center interactions to stabilize the structure.
To better understand the nature of the Li—Ge bonding in BaLi2Ge, the electronic density ρ(r) maps were obtained by maximum entropy method (MEM) analysis using the refined structure factors. As shown in Figure 3a, there are still electrons between Ge and the nearest Li, and both atoms are elongated towards each other, indicating the strong covalent character and electron transfer. However, the shared or transferred electrons are not distributed exactly along the Li—Ge bond path but curved toward the second nearest Li atom to the Ge atom, suggestive of the existence of appreciable Li—Li bonds/interactions.
Compared with the ρ(r) map, its Laplacian function L(r) = −∇ρ(r) is more sensitive to the bond formation. When a chemical bond is formed, the L(r) distribution is no longer spherical, and its properties are widely used for characterizing atomic interactions, since the Laplacian enhances the features of charge distribution and of electron pair localization. The Li—Li bonding character is more evident in the Laplacian of the electron density, as shown by the distortion towards each other in Figure 3b.

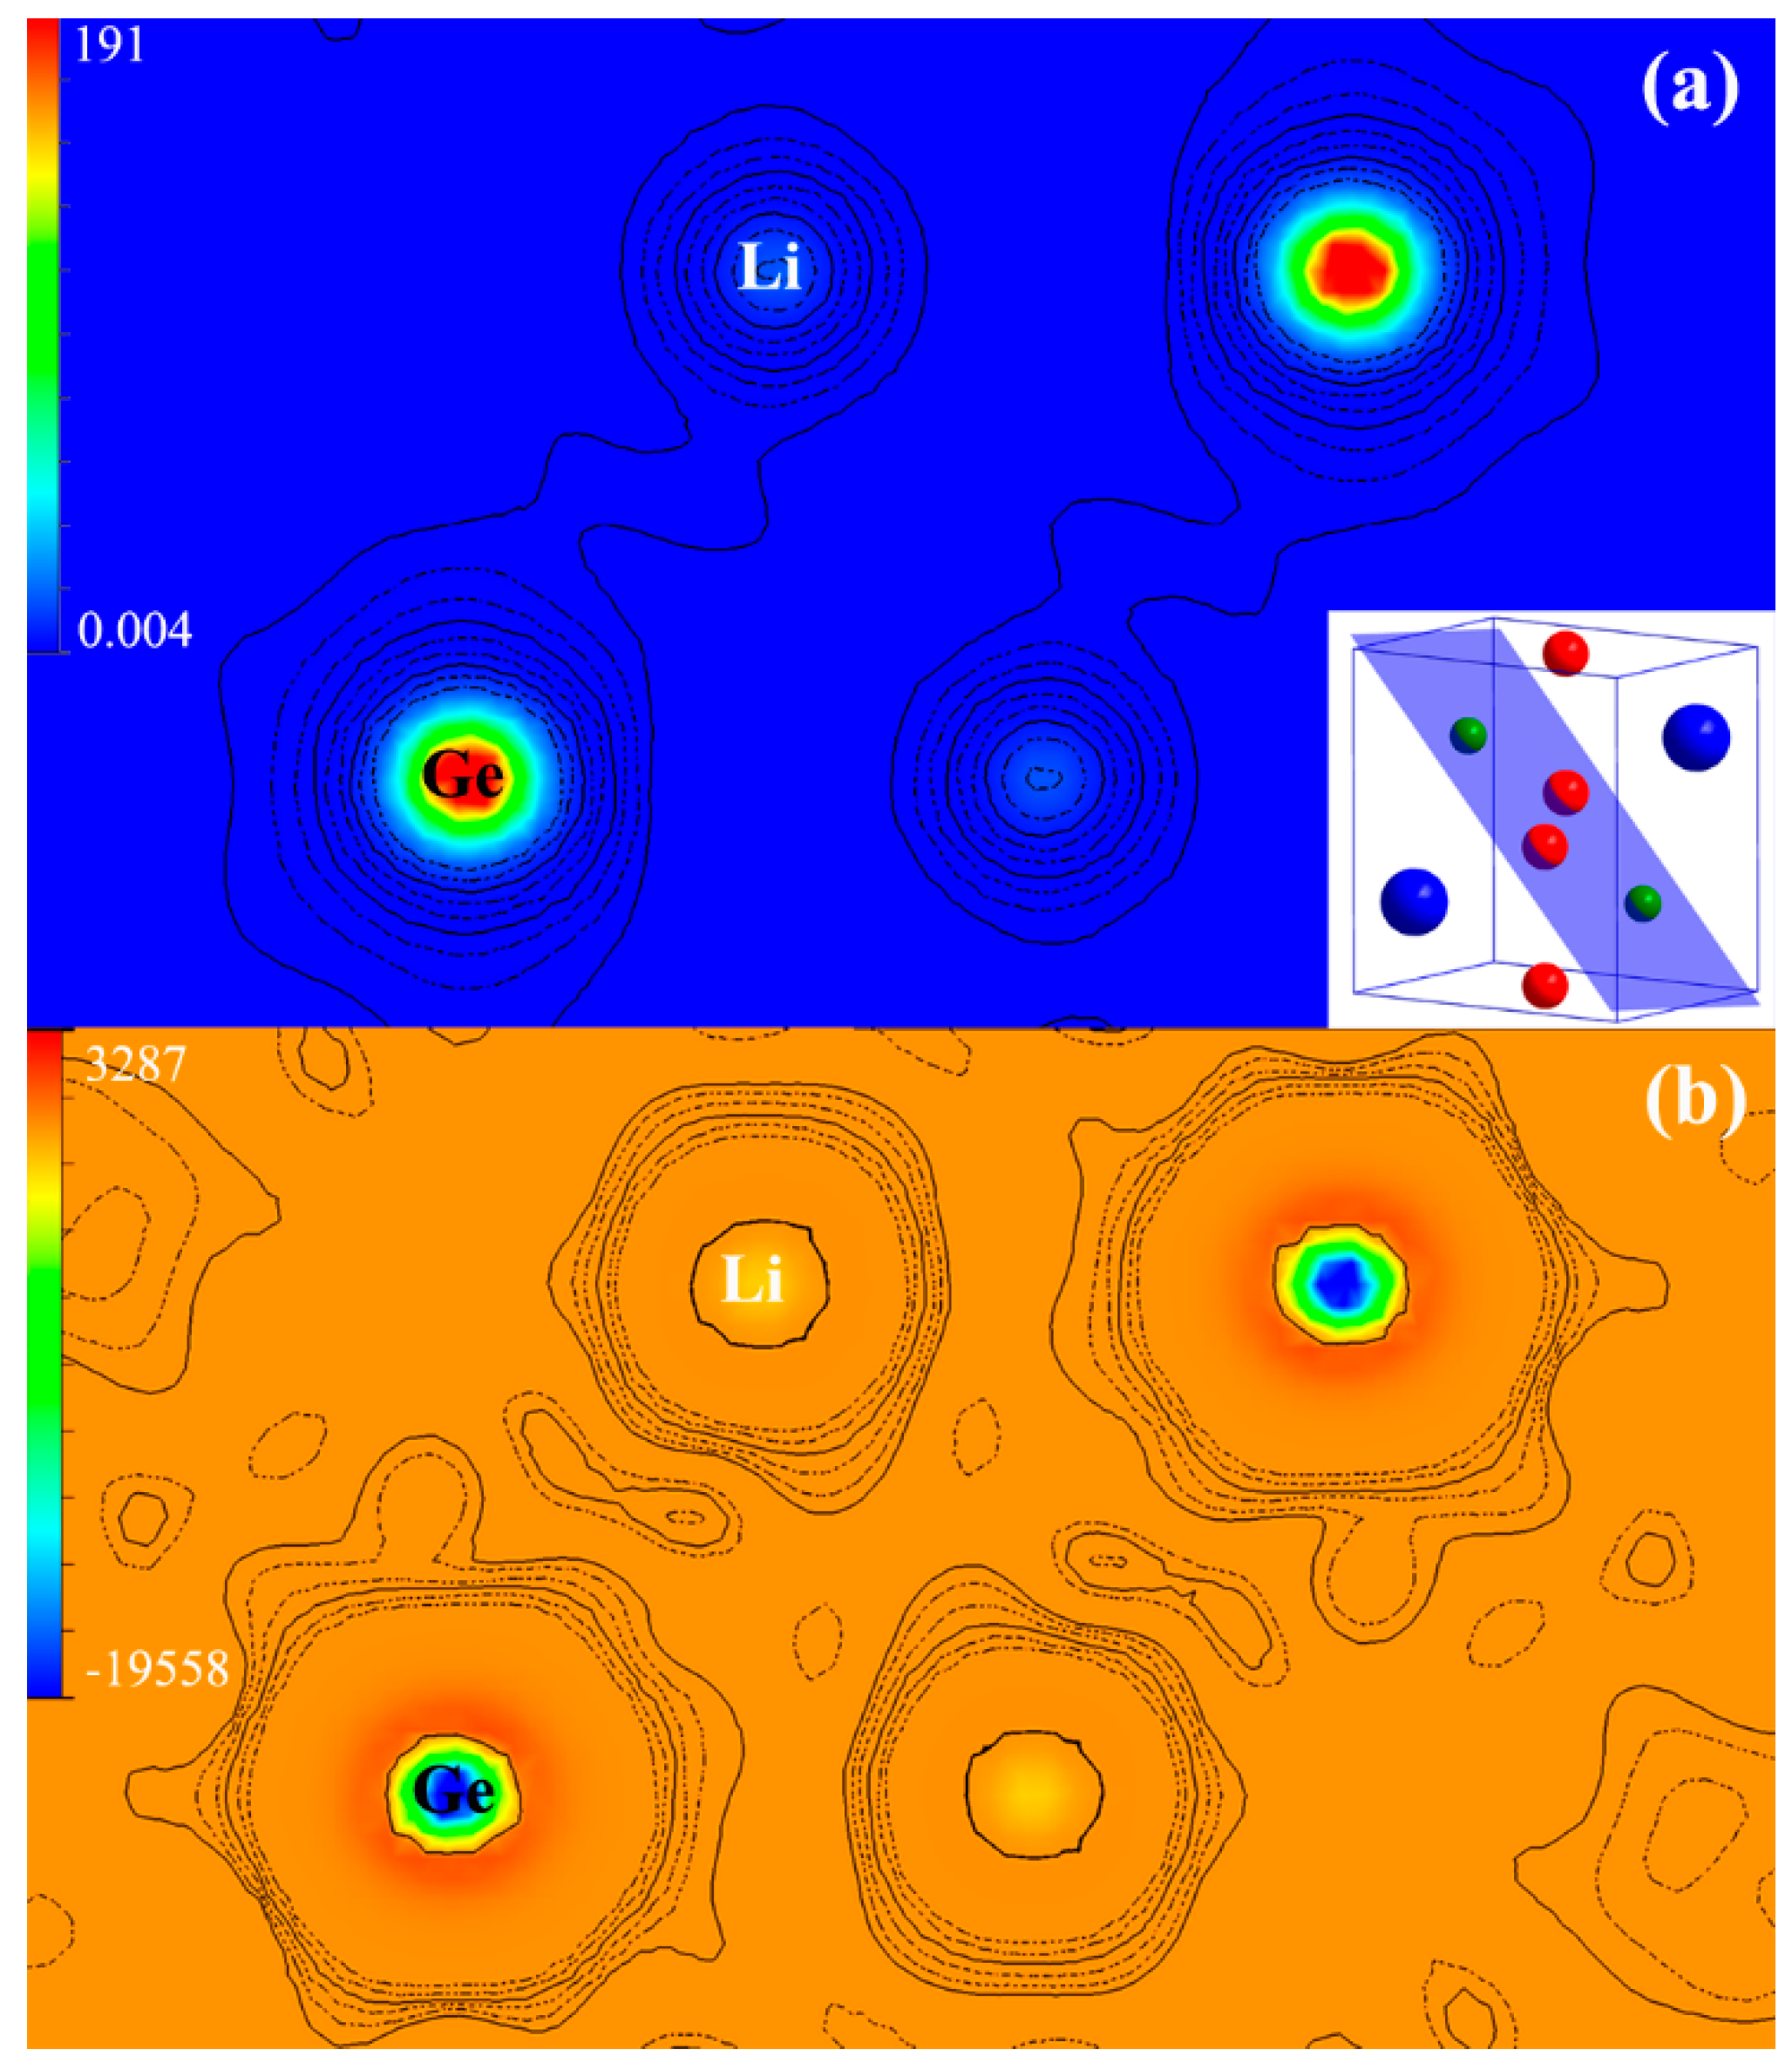
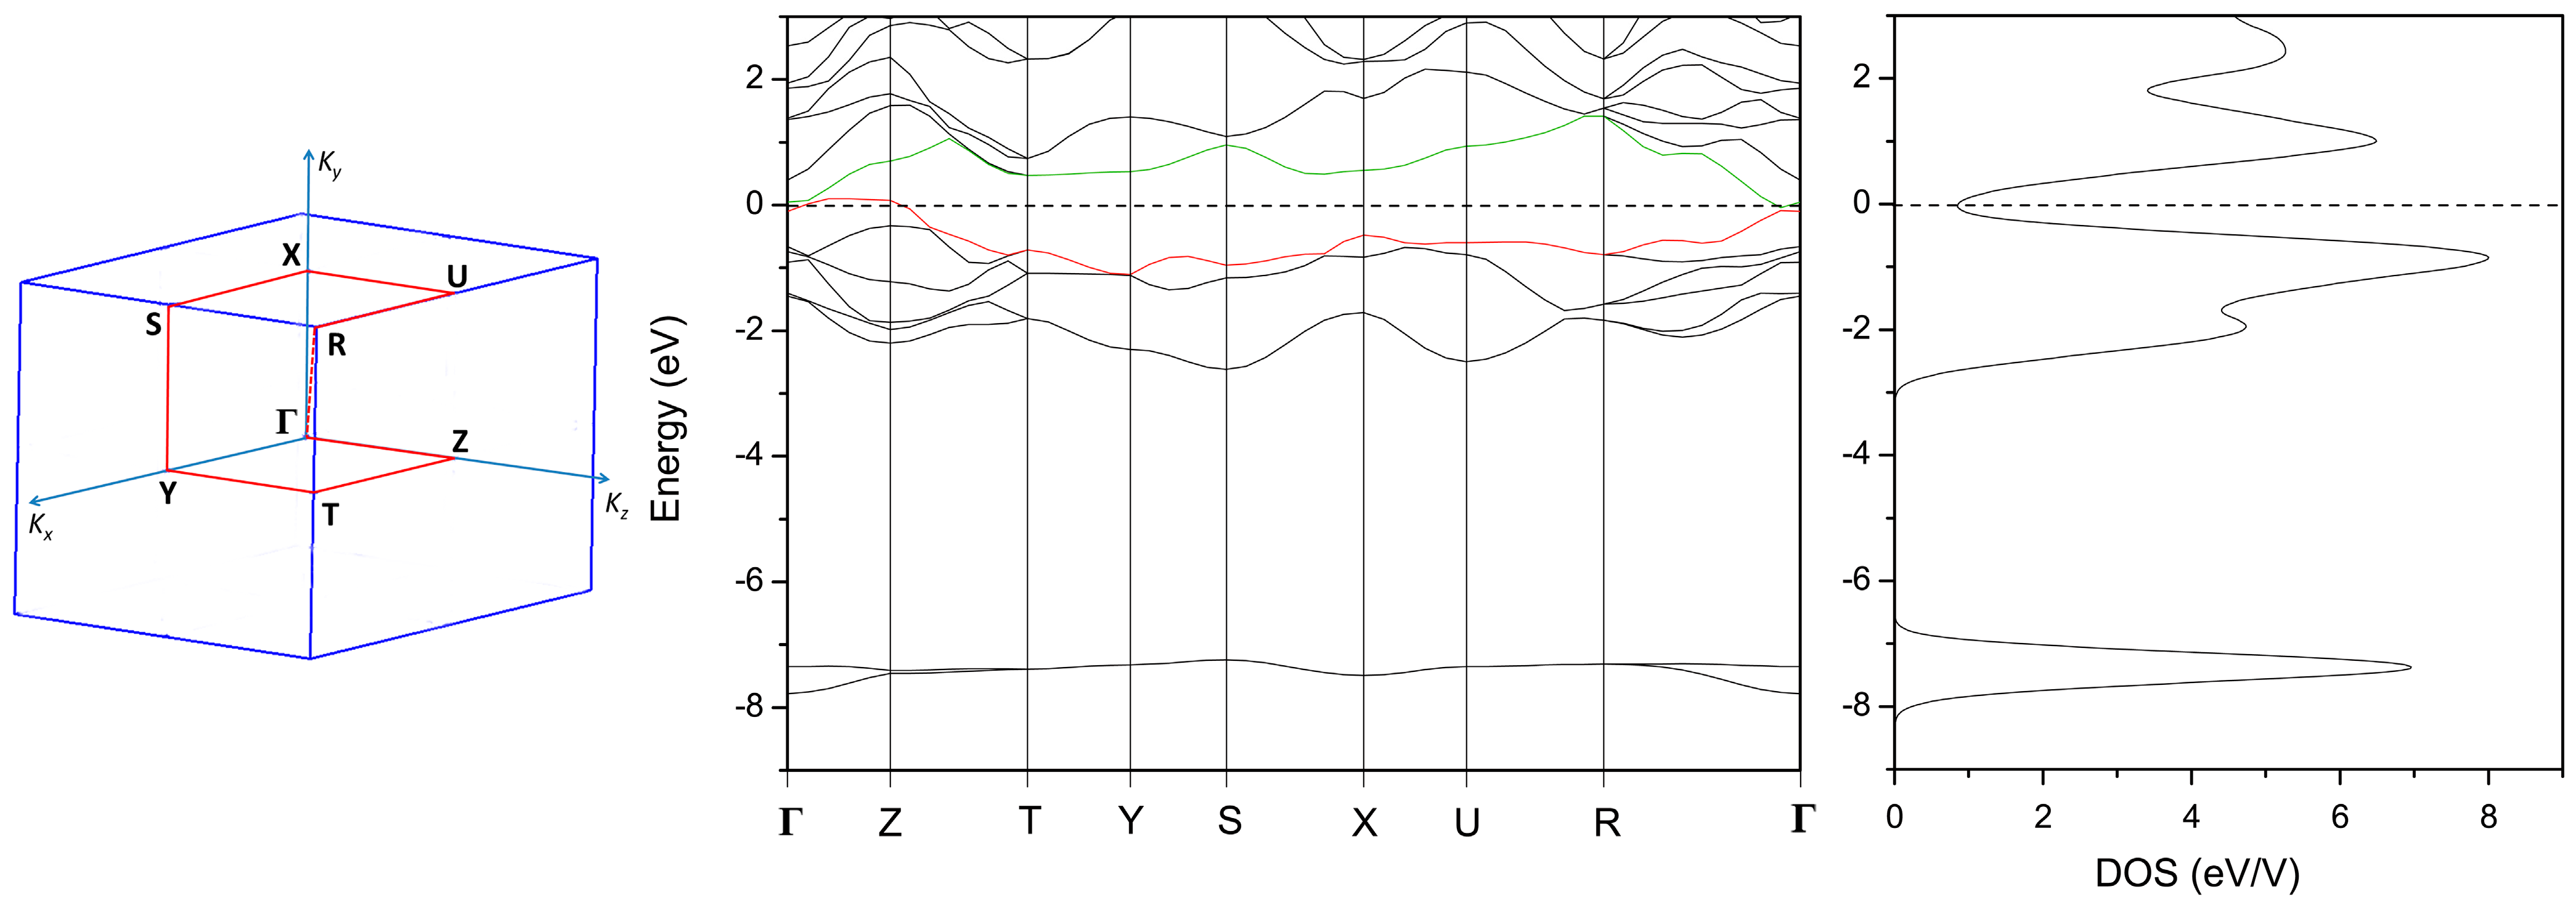
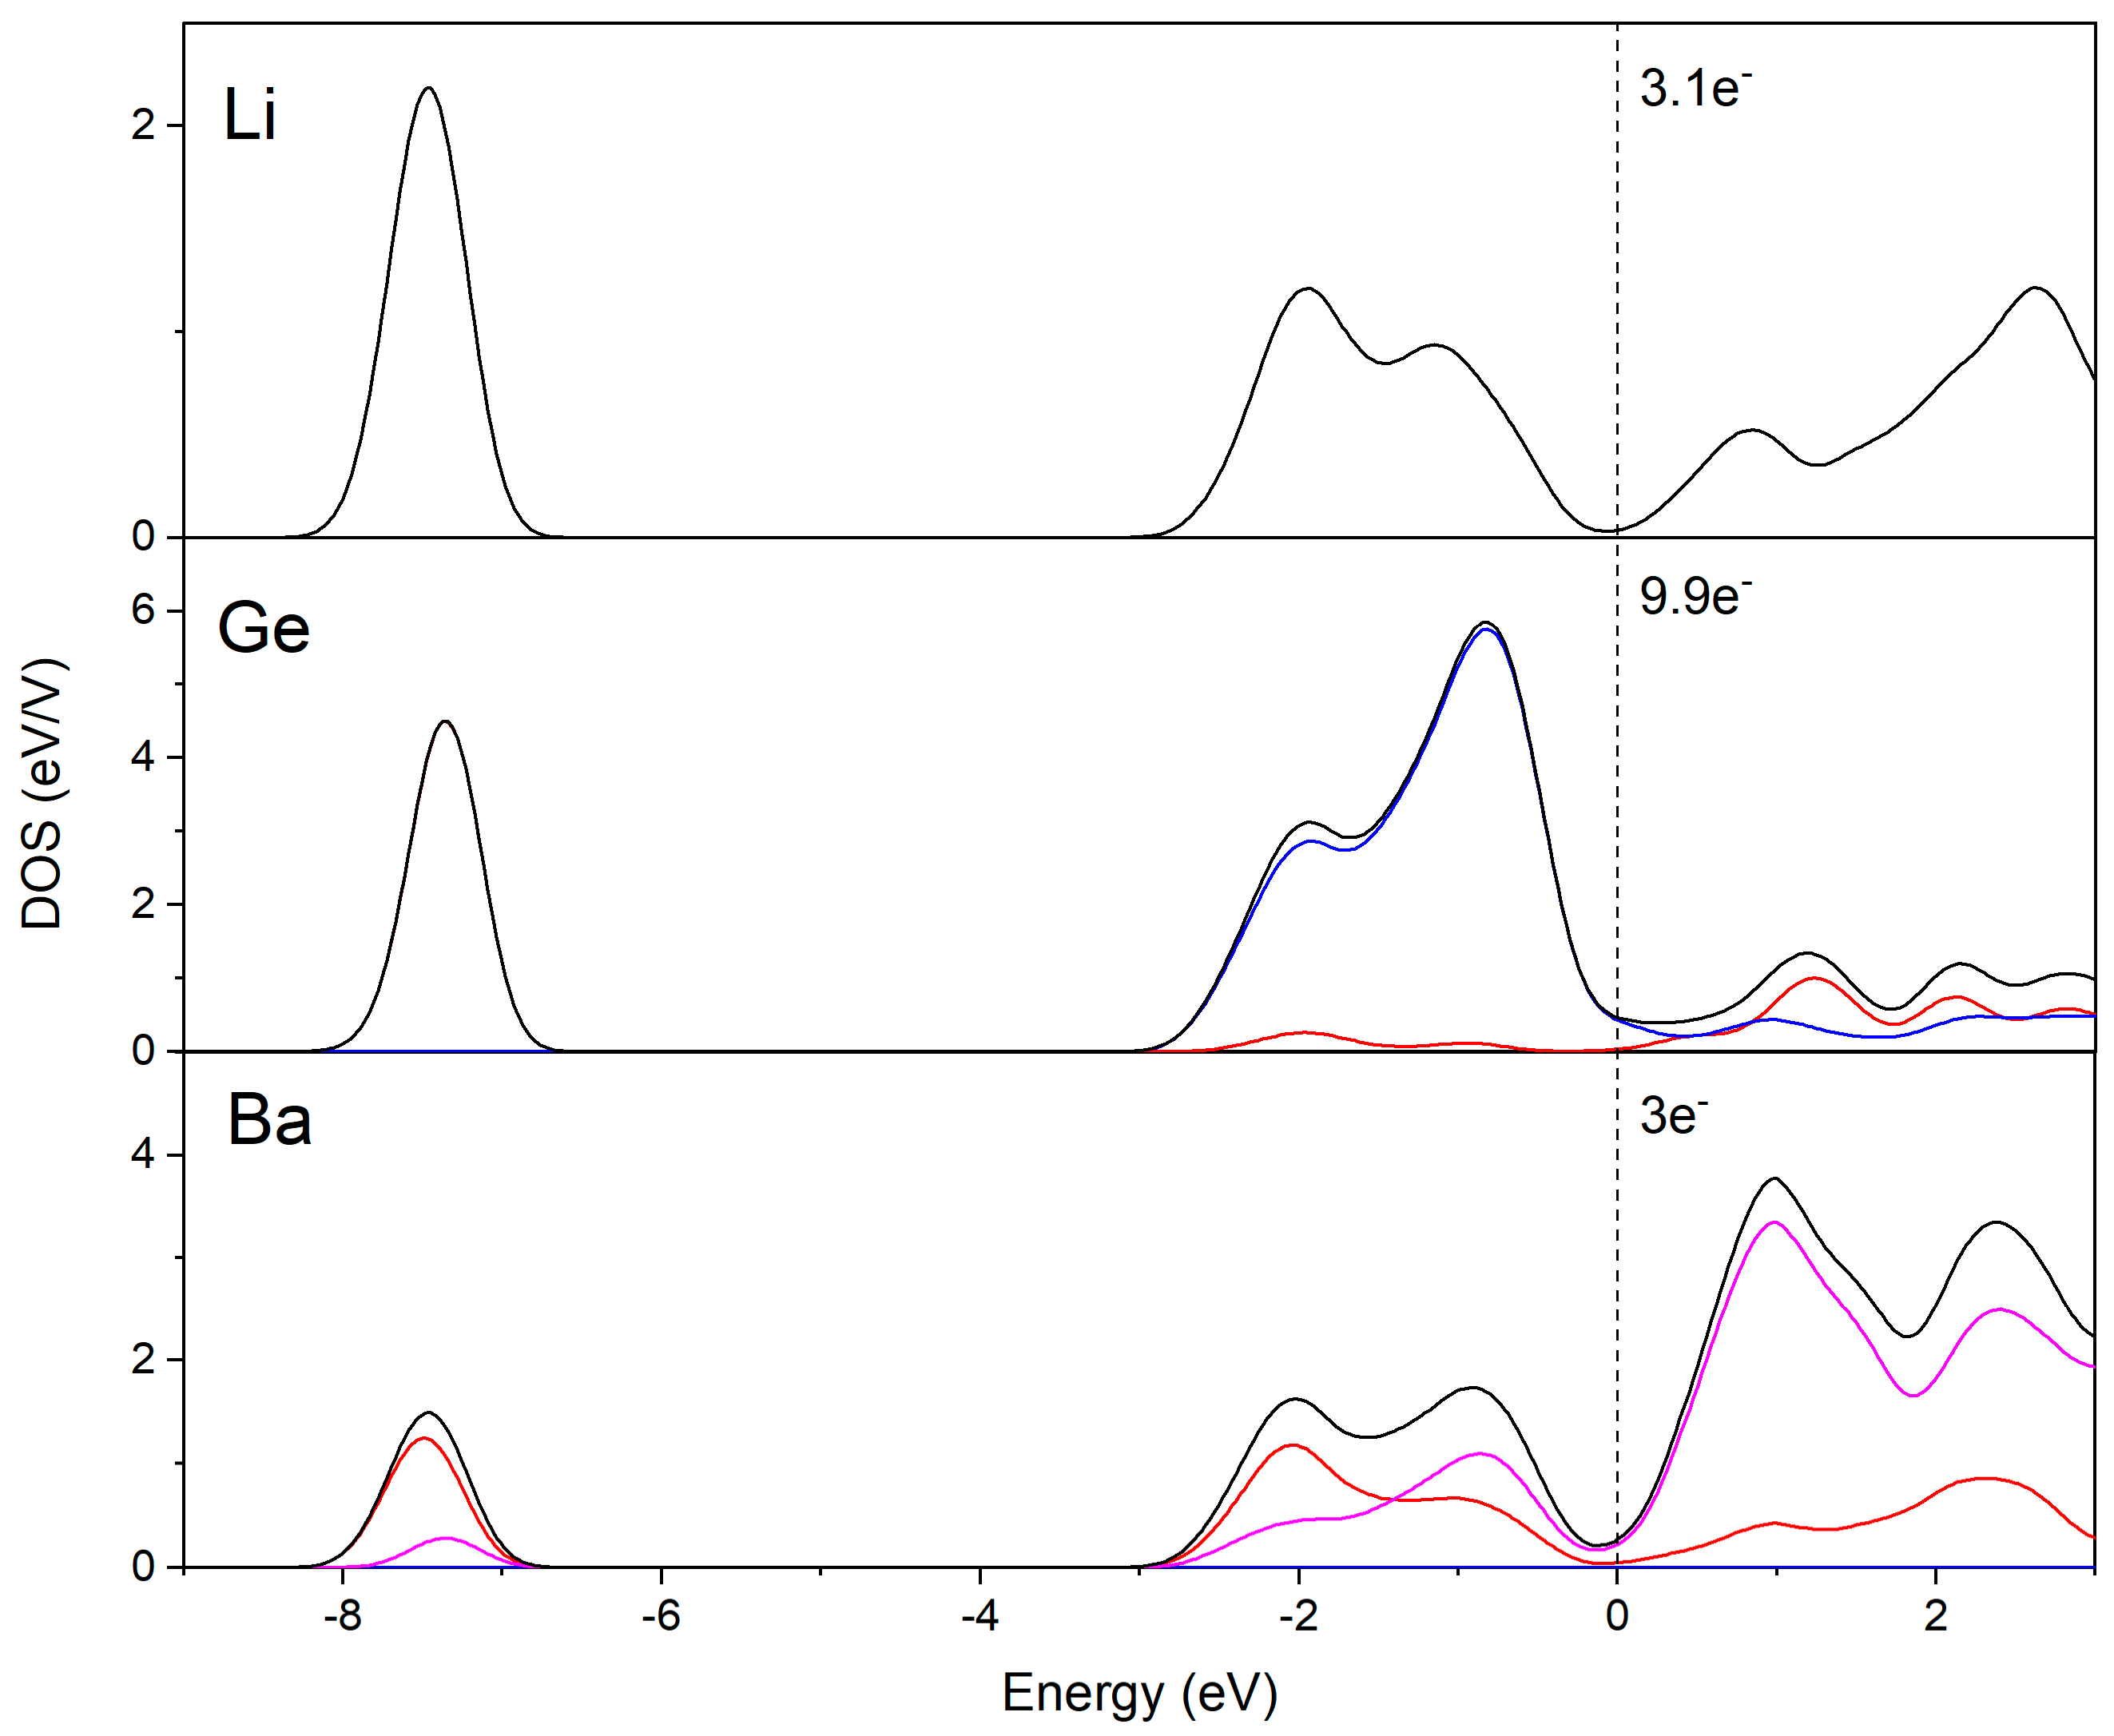
3.2. Electronic Structure

Computations based on the density functional theory were carried out for BaLi2Ge with experimentally determined structural data. The Brillouin zone (BZ) is schematically illustrated in Figure 4 (the left side) with high symmetric K points to generate the band structure. The band structure and corresponding electronic density of states (DOS) are given in the middle and right of Figure 4. There are eight energy bands in the range –10 eV to the Fermi level (EF) for valence electrons. Except for two flat bands between –8 eV and –7 eV, six curved bands are in an energy range from –5 eV to the EF, and these bands are degenerated into three energy levels in most zones of the BZ zone. These characters indicate the strong hybridization in the structure. The charge balance suggests the compound as a Zintl phase, but the hybridization in the Γ–Z zone elevates the energy of the filled band just below the Fermi level and reduces the energy of the empty band just above the Fermi level. As a result, the overlap of the two bands leads to the DOS at the Fermi level. The Fermi level located at the bottom of the valley in the total DOS is suggestive of an overall electronic structure stability (and likely poor metallic behavior). It is evident from the band structure that the DOS at the Fermi level is mainly from the Γ–Z zone around Z (0, 0, kz/2) point. It corresponds to the crystal planes parallel to (001) in the real space and suggests metallic behaviors from delocalized electrons inside the layers.
According to the partial DOS in Figure 5, strong hybridization of Ba-5d and Ge-3p states dominate the conduction band in the vicinity of the Fermi level EF; this is inferred by their high DOS and similar distributions. Together with the band structure and total DOS in Figure 4, it can be inferred that the metallic behavior is associated with the hybridization in BaGe layers. The DOS integration on the conduction band indicates the electron transfer of ca. 0.9 e from Li to Ge per unit cell. Together with the intergrowth conceptual description we gave earlier, the dominant bonding interactions can be summarized as follows: strong Ba—Ge interactions (5d–3p hybridization) favor the formation of the Ba—Ge layer, while the interaction between Li and the layer show more ionic characters, like Li intercalated graphite in a rechargeable lithium ion battery [1,2].

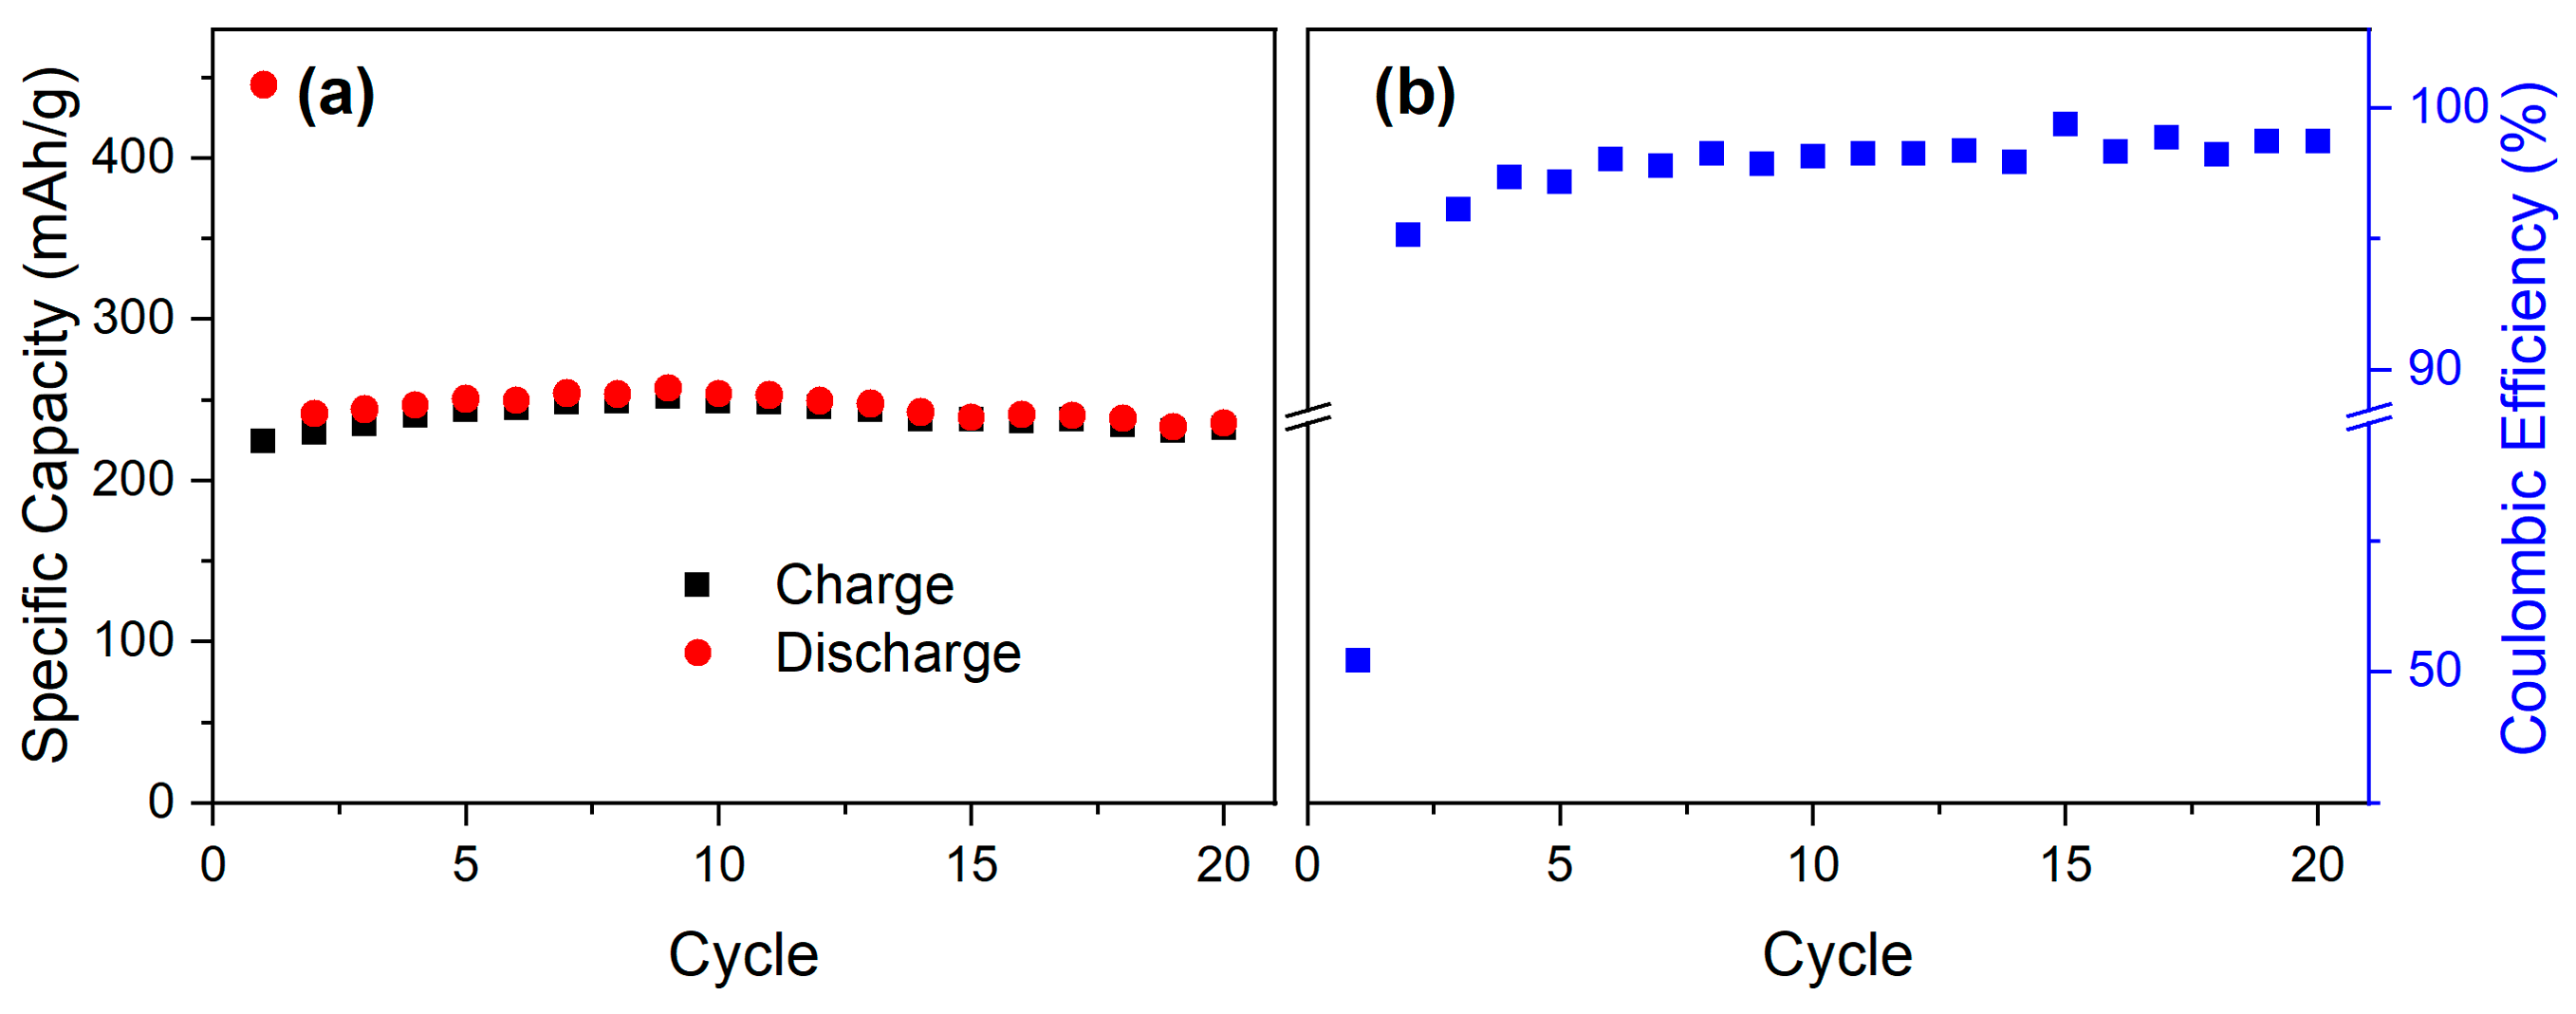
3.3. Electrochemical Properties

According to the above discussion, the presented AELi2Ge (AE = Ca, Sr, Ba) compounds can be suggested as potential electrodes for rechargeable LIB, following the delithiation/lithiation mechanism:
AELi2Ge → 2 × Li + 2 × e + AEGe
The theoretical capacity (Ctheor) can be estimated using the following equation [47]:
Ctheor = nF/3.6 × M
where n is the maximum number of charges the compound can accept (or give up), F is Faraday’s constant of 96,485.3329 sA/mol and M is the formula weight of the compound in g/mol. The constant 3.6 represents the unit conversion factor of the capacity from C to Ah. From the Equation (1), CaGe has a Ctheor of ca. 480 mAh/g.
Because of the air sensitivity of the finely ground powders of CaLi2Ge, the electrochemical measurements were performed on CaGe electrodes, and the CaLi2Ge is the expected product of full lithiation. The cycling properties were measured in a current density of 50 mA/g and are shown in Figure 6. The initial discharge capacity (lithiation) is 446 mAh/g, close to the theoretical value, and the charge capacity in the first cycle is 225 mAh/g, which increases up to ca. 245 mAh/g in the following cycles. No visible capacity fading and high Coulombic efficiency up to 99% in the following 20 cycles suggest the intercalation nature of the electrochemical reaction.
The discharge capacity close to the theoretical value in the first cycle indicates the formation of CaLi2Ge via electrochemical intercalation. The charge capacity has only half of the theoretical values, suggesting only one Li delithiated out from CaLi2Ge. Thus, the electrochemical reaction after the first cycle is likely CaLi2Ge → Li + e + CaLiGe. To confirm this, the ex situ PXRD was collected on the electrodes after the first discharge-charge cycle. As shown in Figure A1, after the first cycle, the main phase in the electrode is not CaGe but an unknown phase, except for the Cu collector. Due to poor crystallinity, it is impossible to index the PXRD pattern. However, based on the electrochemical behaviors, it can be inferred that the phase has a formula CaLiGe or close to it, but the structure and existence of this phase remain to be confirmed in future works.

4. Conclusions

The series of AELi2Ge (AE = Ca, Sr and Ba) were synthesized, and their structures were determined using low-temperature single crystal XRD. The structure consists of corrugated AEGe layers alternated with slabs of Li atoms. Both the experimental electron density and electronic structure calculation reveal that the hybridization of Ba5d and Ge3p states extends the valence band into the Fermi level and thus leads to the metallic behavior. The metallic behavior and the intercalated Li layers enable these compounds as potential electrode materials for Li-ion batteries, which is demonstrated by the electrochemical measurement on CaGe, regarded as the complete delithiation of CaLi2Ge. For the practical application as electrode materials, light and cheap elements are more proper in the view of specific capacity and cost. Thus, the silicate analogue of the family may be more suitable for that purpose.

Author Contributions

Conceptualization, S.B.; methodology, J.Z. and S.B.; data curation, J.Z. and S.B.; validation, J.Z. and S.B.; formal analysis, J.Z. and S.B.; investigation, J.Z.; resources, S.B.; writing—original draft preparation, J.Z.; writing—conceptualization, J.Z. and S.B.; writing—review and editing, S.B.; visualization, S.B.; supervision, S.B.; project administration, S.B.; funding acquisition, S.B. All authors have read and agreed to the published version of the manuscript.

Funding

This work was supported by the US National Science Foundation (NSF) through grant DMR-2004579.

Data Availability Statement

The corresponding crystallographic information files (CIF) have been deposited with the Cambridge Crystallographic Database Centre (CCDC) and can be obtained free of charge via http://www.ccdc.cam.ac.uk/conts/retrieving.html (or from the CCDC, 12 Union Road, Cambridge CB2 1EZ, UK; Fax: +44-1223-336033; E-mail: deposit@ccdc.cam.ac.uk) with the following depository numbers: 2314734–2314736.

Conflicts of Interest

The authors declare no conflicts of interest.

Appendix A

Figure A1. Powder X-ray diffraction patterns of as-made CaGe [CaGe powders were prepared via high-energy ball milling using Ca (Aldrich, >99.9%) and Ge powders (Aldrich, >99.9%). The molar ratio of Ca and Ge was 1:1 with a total weight of 2 g. Stainless steel balls of 40 g were used, and the ball milling was carried out under an Ar atmosphere for 3 h and with CaGe electrodes after the first discharge-charge cycle, together with simulated patterns of CaGe and CaLi2Ge. A small sharp peak appears at ca. 30° in the pattern of the CaGe electrode after the first cycle, and it does not match a known phase.
Crystals 14 00057 g0a1

References

  1. Whittingham, M.S. Lithium Batteries and Cathode Materials. Chem. Rev. 2004, 104, 4271–4301. [Google Scholar] [CrossRef] [PubMed]
  2. Goodenough, J.B.; Park, K.S. The Li-Ion Rechargeable Battery: A Perspective. J. Am. Chem. Soc. 2013, 135, 1167–1176. [Google Scholar] [CrossRef] [PubMed]
  3. Goodenough, J.B.; Kim, Y. Challenges for Rechargeable Li Batteries. Chem. Mater. 2010, 22, 587–603. [Google Scholar] [CrossRef]
  4. Sathiya, M.; Rousse, G.; Ramesha, K.; Laisa, C.P.; Vezin, H.; Sougrati, M.T.; Doublet, M.L.; Foix, D.; Gonbeau, D.; Walker, W.; et al. Reversible Anionic Redox Chemistry in High-Capacity Layered-Oxide Electrodes. Nat. Mater. 2013, 12, 827–835. [Google Scholar] [CrossRef]
  5. Goodenough, J.B. Evolution of Strategies for Modern Rechargeable Batteries. Acc. Chem. Res. 2013, 46, 1053–1061. [Google Scholar] [CrossRef] [PubMed]
  6. Lee, J.; Urban, A.; Li, X.; Su, D.; Hautier, G.; Ceder, G. Unlocking the potential of cation-disordered oxides for rechargeable lithium batteries. Science 2014, 343, 519. [Google Scholar] [CrossRef]
  7. Collins, C.; Dyer, M.S.; Pitcher, M.J.; Whitehead, G.F.S.; Zanella, M.; Mandal, P.; Claridge, J.B.; Darling, G.R.; Rosseinsky, M.J. Accelerated Discovery of Two Crystal Structure Types in a Complex Inorganic Phase Field. Nature 2017, 546, 280. [Google Scholar] [CrossRef]
  8. Dyer, M.S.; Collins, C.; Hodgeman, D.; Chater, P.A.; Demont, A.; Romani, S.; Sayer, R.; Thomas, M.F.; Claridge, J.B.; Darling, G.R.; et al. Computationally Assisted Identification of Functional Inorganic Materials. Science 2013, 340, 847–852. [Google Scholar] [CrossRef]
  9. Longo, R.C.; Kong, F.T.; Santosh, K.C.; Park, M.S.; Yoon, J.; Yeon, D.H.; Park, J.H.; Doo, S.G.; Cho, K. Phase Stability of Li-Mn-O Oxides as Cathode Materials for Li-ion Batteries: Insights from Ab Initio Calculation. Phys. Chem. Chem. Phys. 2014, 16, 11218. [Google Scholar] [CrossRef]
  10. Matsuno, S.; Noji, M.; Kashiwagi, T.; Nakayama, M.; Wakihara, M. Construction of the Ternary Phase Diagram for the Li-Cu-Sb System as the Anode Materials for a Lithium Ion Battery. J. Phys. Chem. C 2007, 111, 7548–7553. [Google Scholar] [CrossRef]
  11. Massalski, T.B. (Ed.) Binary Alloys Phase Diagrams; ASM International: Materials Park, OH, USA, 1990. [Google Scholar]
  12. St John, M.R.; Furgala, A.J.; Sammells, A.F. Thermodynamic Studies of Li-Ge Alloys: Application to Negative Electrodes for Molten Salt Batteries. J. Electrochem. Soc. 1982, 129, 246–250. [Google Scholar] [CrossRef]
  13. Vhof, V.; Muller, W.; Schafer, H. The Structure of Li7Ge2. Z. Naturforsch. B 1972, 27B, 1157–1160. [Google Scholar]
  14. Fässler, T.F.; Zeilinger, M. Structural and Thermodynamic Similarities of Phases in the Li-Tt (Tt = Si, Ge) Systems: Redetermination of the Lithium-rich Side of the Li-Ge Phase Diagram and Crystal Structure of Li17Si4−xGex for x = 2.3, 3.1, 3.5 and 4 As Well As Li4.1Ge. Dalton Trans. 2014, 43, 14959–14970. [Google Scholar]
  15. Johnson, Q.; Smith, G.S.; Wood, D. The Crystal Structure of Li15Ge4. Acta Crystallogr. 1965, 18, 131–132. [Google Scholar] [CrossRef]
  16. Osman, H.H.; Bobev, S. Experimental and Theoretical Study on the Substitution Patterns in Lithium Germanides: The Case of Li15Ge4 vs. Li14ZnGe4. Eur. J. Inorg. Chem. 2022, 2022, e202100901. [Google Scholar] [CrossRef]
  17. Goward, G.R.; Taylor, N.J.; Souza, D.C.S.; Nazar, L. The True Crystal Structure of Li17M4 (M = Ge, Sn, Pb)—Revised from Li22M5. J. Alloys Compd. 2001, 329, 82–91. [Google Scholar] [CrossRef]
  18. Tillard, M.; Belin, C.; Spina, L.; Jia, Y.Z. Two Cubic Polymorphs of AlGeLi. Acta Crystallogr. Sect. C 2012, 68, i60–i64. [Google Scholar]
  19. Henze, A.; Hlukhyy, V.; Fässler, T.F. Fully and Partially Li-Stuffed Diamond Polytypes with Ag-Ge Structures: Li2AgGe and Li2.53AgGe2. Inorg. Chem. 2015, 54, 1152–1158. [Google Scholar] [CrossRef]
  20. Todorov, I.; Sevov, S.C. Heavy-Metal Aromatic and Conjugated Species: Rings, Oligomers, and Chains of Tin in Li9−xEuSn6+x, Li9−xCaSn6+x, Li5Ca7Sn11, Li6Eu5Sn9, LiMgEu2Sn3, and LiMgSr2Sn3. Inorg. Chem. 2005, 44, 5361–5369. [Google Scholar] [CrossRef]
  21. Ganguli, A.K.; Gupta, S.; Corbett, J.D. New Tetragonal Structure Type for A2Ca10Sb9 (A = Li, Mg). Electronic Variability Around a Zintl Phase. Inorg. Chem. 2006, 45, 196–200. [Google Scholar] [CrossRef]
  22. Stegmaier, S.; Waibel, M.; Henze, A.; Jantke, L.A.; Karttunen, A.J.; Fässler, T.F. Soluble Zintl phase A14ZnGe16 (A = K, Rb) Featuring [(η3-Ge4)Zn(η3-Ge4)]6− and [Ge4]4− Clusters and the Isolation of [(MesCu)23-Ge4)Zn(η33-Ge4)]4−: The Missing Link in the Solution Chemistry of Tetrahedral Group 14 Element Zintl Clusters. J. Am. Chem. Soc. 2012, 134, 14450–14460. [Google Scholar] [PubMed]
  23. Luo, X.H.; Krizan, J.W.; Haldolaarachchige, N.; Klimczuk, T.; Xiw, W.W.; Fuccillo, M.K.; Felser, C.; Cava, R.J. A Large Family of Filled Skutterudites Stabilized by Electron Count. Nat. Commun. 2015, 6, 6489. [Google Scholar] [PubMed]
  24. Schäfer, M.C.; Bobev, S. Tin Clathrates with the Type II Structure. J. Am. Chem. Soc. 2013, 135, 1696. [Google Scholar] [CrossRef] [PubMed]
  25. Fässler, T.F. (Ed.) Zintl Ions: Principles and Recent Developments; Springer: Berlin/Heidelberg, Germany, 2011. [Google Scholar]
  26. Stoiber, D.; Bobnar, M.; Höhn, P.; Niewa, R. Lithium Alkaline Earth Tetrelides of the type Li2AeTt (Ae = Ca, Ba, Tt = Si, Ge, Sn, Pb): Synthesis, Crystal Structures and Physical Properties. Z. Naturforsch. B 2017, 72, 220–222. [Google Scholar] [CrossRef]
  27. SMART NT, Version 5.63; Bruker Analytical X-ray Systems: Madison, WI, USA, 2003.
  28. SAINT NT, Version 6.45; Bruker Analytical X-ray Systems: Madison, WI, USA, 2003.
  29. SADABS NT, Version 2.10; Bruker Analytical X-ray Systems: Madison, WI, USA, 2001.
  30. SHELXTL, Version 6.12; Bruker Analytical X-ray Systems: Madison, WI, USA, 2001.
  31. Momma, K.; Ikeda, T.; Belik, A.A.; Izumi, F. Dysnomia, A Computer Program for Maximum-Entropy Method (MEM) Analysis and its Performance in the MEM-Based Pattern Fitting. Powder Diffr. 2013, 28, 184–193. [Google Scholar] [CrossRef]
  32. Momma, K.; Izumi, F. VESTA 3 for Three-Dimensional Visualization of Crystal, Volumetric and Morphology Data. J. Appl. Cryst. 2011, 44, 1272–1276. [Google Scholar] [CrossRef]
  33. Ordejόn, P.; Artacho, E.; Soler, J.M. Self-consistent Order-N Density-Functional Calculations for Very Large Systems. Phys. Rev. B 1996, 53, R10441. [Google Scholar] [CrossRef]
  34. Soler, J.M.; Artacho, E.; Gale, J.D.; García, A.; Junquera, J.; Ordejόn, P.; Sánchez-Portal, D. The SIESTA Method for Ab Initio Order-N Materials Simulation. J. Phys. Condens. Matter 2002, 14, 2745. [Google Scholar] [CrossRef]
  35. Troullier, N.; Martins, J.L. Efficient Pseudopotentials for Plane-Wave Calculations. Phys. Rev. B 1991, 43, 1993. [Google Scholar] [CrossRef]
  36. Perdew, J.P.; Burke, K.; Emzerhof, M. Generalized Gradient Approximation Made Simple. Phys. Rev. Lett. 1996, 77, 3865. [Google Scholar] [CrossRef]
  37. Kresse, G.; Hafner, J. Ab Initio Molecular Dynamics for Liquid Metals. Phy. Rev. B 1993, 47, 558. [Google Scholar] [CrossRef] [PubMed]
  38. Kresse, G.; Joubert, D. From Ultrasoft Pseudopotential to the Projector Augmented-Wave Method. Phys. Rev. B 1999, 59, 1758. [Google Scholar] [CrossRef]
  39. Von Narth, U.; Hedin, L.A. A Local Exchange-Correlation Potential for the Spin Polarized Case. I. J. Phys. C 1972, 5, 1629. [Google Scholar]
  40. Betz, A.; Schafer, H.; Weiss, A.; Wulf, R. Digermanide SrGe2 and BaGe2. Z. Naturforsch. B 1968, 23, 878. [Google Scholar] [CrossRef]
  41. Park, D.G.; Dong, Y.; DiSalvo, F.J. LiSrGe2 and LiBaGe2: One-Dimensional Chains of [Ge2]3− in an Unusual Conformation. J. Alloys Compd. 2009, 470, 90–95. [Google Scholar] [CrossRef]
  42. von Schnering, H.G.; Bolle, U.; Curde, J.; Peter, K.; Carillo-Cabrera, W.; Mehmet, S.; Schultheiss, M.; Wedig, U. Hucker Arenes with Ten π Electrons: Cyclic Zintl Anions [Si6]10− and [Ge6]10−, Isosteric with [P6]4−. Angew. Chem. 1996, 35, 984–986. [Google Scholar] [CrossRef]
  43. Ghosh, K.; Bobev, S. Yet Another Case of Lithium Metal Atoms and Germanium Atoms Sharing Chemistry in the Solid State: Synthesis and Structural Characterization of Ba2LiGe3. Chem. Eur. J. 2023, 29, e202302385. [Google Scholar] [CrossRef]
  44. Ghosh, K.; Ovchinnikov, A.; Baitinger, M.; Krnel, M.; Burkhardt, U.; Grin, Y.; Bobev, S. Lithium Metal Atoms Fill Vacancies in the Germanium Network of a Type-I Clathrate: Synthesis and Structural Characterization of Ba8Li5Ge41. Dalton Trans. 2023, 52, 10310. [Google Scholar] [CrossRef]
  45. Guo, S.P.; You, T.S.; Bobev, S. Closely Related Rare-Earth Metal Germanides RE2Li2Ge3 and RE3Li4Ge4 (RE = La-Nd, Sm): Synthesis, Crystal Chemistry, and Magnetic Properties. Inorg. Chem. 2012, 51, 3119–3129. [Google Scholar] [CrossRef]
  46. Lacroix-Orio, L.; Tillard, M.; Belin, C. Synthesis, Crystal and Electronic Structure of Li8Zn2Ge3, a Compound Displaying an Open Layered Anionic Network. Solid State Sci. 2006, 8, 208–215. [Google Scholar] [CrossRef]
  47. Howard, W.F.; Spotnitz, R.M. Theoretical Evaluation of High-Energy Lithium Metal Phosphate Cathode Materials in Li-ion Batteries. J. Power Source 2007, 165, 887. [Google Scholar] [CrossRef]
Figure 1. Schematic representation of the orthorhombic AELi2Ge structure, viewed along the crystallographic a-axis (left) and b-axis (right). AE atoms are represented as blue spheres, Ge atoms are drawn as green spheres, and Li atoms are shown with the red spheres. The “Ba2Li2Ge tetrahedral chains” are shown with atoms connected by sticks; the inter-chain interactions are illustrated by the dashed lines, and the Li—Li interactions are depicted with the thin red lines. The unit cell is outlined by the blue frame in both projections.
Crystals 14 00057 g001
Figure 2. Schematic representation of AELi2Ge, viewed approximately along the crystallographic b-axis and the projection of the crystal structure of AELi2Ge on the (001) planes: (a) AEGe layer and (b) Li layer. AE atoms are represented as blue spheres, Ge atoms are drawn as green spheres and Li atoms are shown with the red spheres. Both layers can be considered as the distortion of the corresponding simple compounds: (a) PbO-type AEGe and (b) hexagonal Li.
Crystals 14 00057 g002
Figure 3. Electron density distributions obtained by MEM (a) and its Laplacian transformation (b). The inset crystallographic structure in (a) shows the crystal planes containing only Ge (green spheres) and Li (red spheres) atoms, corresponding to the electron density distributions. The unit for the electronic density is e/Å3. The logarithmic contour lines show eight levels, from minimum to maximum.
Crystals 14 00057 g003
Figure 4. Band structure (middle) and DOS (right) of BaLi2Ge, together with the schematically depicted Brillouin zone (left). The Fermi level is shown as the dash line. The red line in the band structure represents the main conductive band.
Crystals 14 00057 g004
Figure 5. Partial DOS (black lines) for Ba, Li and Ge in BaLi2Ge. Contributions from s-, p-, d-bands are shown by the blue, red and pink lines, respectively. The dotted lines indicate the Fermi level. Around 0.9 electrons are transferred from Li to Ge (in one unit cell with two formula units).
Crystals 14 00057 g005
Figure 6. The electrochemical performance of polycrystalline CaGe. Panel (a) shows the specific capacity, and panel (b) depicts the Coulombic efficiency.
Crystals 14 00057 g006
Table 1. Selected Crystallographic Data for AELi2Ge (AE = Ca, Sr, Ba).
CCDC number231473423147352314736
Empirical formulaCaLi2GeSrLi2GeBaLi2Ge
Formula weight126.55174.09223.81
Temperature200(2) K
Radiation, λMo Kα, 0.71073 Å
Space groupPmmn (no. 59), Z = 2
Lattice constants
a/Å4.650 (2)4.6818 (7)4.7092 (9)
b/Å5.766 (3)6.2829 (6)6.7593 (9)
c/Å6.364 (3)6.2800 (7)6.2923 (7)
V/Å 3170.65 (13)184.81 (4)200.3 (1)
ρ/g·cm−32.463.133.60
μ/cm−1101.7222.8170.1
R1 (I > 2σ(I)) 10.02660.0090.0104
wR2 (I > 2σ(I)) 10.05440.02090.0201
R1 (all data) 10.03320.00940.0114
wR2 (all data) 10.05660.0210.0268
Largest diff. peak/hole0.55/–0.670.38/–0.320.41/–0.51
1 R1 = ∑||Fo| − |Fc||/∑|Fo|; wR2 = [∑[w(Fo2Fc2)2]/∑[w(Fo2)2]]1/2, where w = 1/[σ2Fo2 + (A·P)2 + (B·P)], and P = (Fo2 + 2Fc2)/3; A and B are the respective weight coefficients.
Table 2. Atomic Coordinates and Equivalent Isotropic Displacement Parameters (Ueq) 1 of AELi2Ge (AE = Ca, Sr, Ba).
AtomSitexyzUeq (Å)
CaLi2Ge
Ca2b1/41/40.0678(3)0.0135(4)
Ge2b1/43/40.2582(2)0.0123(3)
Li4e00.0251(15)0.6018(15)0.023(2)
SrLi2Ge
Sr2b1/41/40.0885(1)0.0108(2)
Ge2b1/43/40.2793(1)0.0102(2)
Li4e00.0369(7)0.5991(6)0.0169(8)
BaLi2Ge
Ba2b1/41/40.0981(1)0.0126(2)
Ge2b1/43/40.3027(2)0.0110(2)
Li4e00.0483(8)0.5935(8)0.016(1)
1 Ueq is defined as one third of the trace of the orthogonalized Uij tensor.
Table 3. Selected Interatomic Distances in AELi2Ge (AE = Ca, Sr, Ba).
Atomic Pair Distance (Å)Atomic Pair Distance (Å)Atomic Pair Distance (Å)
CaLi2GeSrLi2GeBaLi2Ge
Ge—Ca (×2)3.117(2)Ge—Sr (×2)3.2891(4)Ge—Ba (×2)3.4503(4)
Ge—Ca (×2)3.127(2)Ge—Sr (×2)3.3623(3)Ge—Ba (×2)3.6166(4)
Ge—Li (×2)2.701(9)Ge—Li (×2)2.700(4)Ge—Li (×2)2.7228(2)
Ge—Li (×4)2.808(2)Ge—Li (×4)2.803(2)Ge—Li (×2)2.7981(2)
Li—Li (×1)2.59(1)Li—Li (×1)2.677(8)Li—Li (×2)2.7120(2)
Li—Li (×2)2.678(9)Li—Li (×2)2.692(3)Li—Li (×1)3.7267(4)
Ca—Li (×2)3.237(9)Sr—Li (×2)3.353(4)Ba—Li (×2)3.4023(3)
Disclaimer/Publisher’s Note: The statements, opinions and data contained in all publications are solely those of the individual author(s) and contributor(s) and not of MDPI and/or the editor(s). MDPI and/or the editor(s) disclaim responsibility for any injury to people or property resulting from any ideas, methods, instructions or products referred to in the content.

