Article

Mechanical Loading Effect on Stress States and Failure Behavior in Thermal Barrier Coatings

1
Advanced Gas Turbine Laboratory, Institute of Engineering Thermophysics, Chinese Academy of Sciences, Beijing 100190, China
2
University of Chinese Academy of Sciences, Beijing 100049, China
3
National Key Laboratory of Science and Technology on Advanced Light-Duty Gas-Turbine, Beijing 100190, China
4
Key Laboratory of Advanced Energy and Power, Institute of Engineering Thermophysics, Chinese Academy of Sciences, Beijing 100190, China
*
Author to whom correspondence should be addressed.
Crystals 2024, 14(1), 2; https://doi.org/10.3390/cryst14010002
Submission received: 26 November 2023 / Revised: 10 December 2023 / Accepted: 15 December 2023 / Published: 19 December 2023

Abstract

:
Under service conditions, apart from the harsh temperature environment, mechanical loading also seriously affects the life of thermal barrier coatings (TBCs). A comprehensive understanding of the combined effects of thermo-mechanical loads can help to further reveal the failure mechanism of TBCs. In this work, a portion of a thin-walled circular pipe is intercepted for numerical analysis, and the interface is simplified as a sinusoidal curve. The dynamic growth of thermally grown oxide (TGO) is included into the model. A cohesive model is used for interfacial cracking analysis. The results show that the effects of tensile and compressive loads on the normal stress of the coating are not significant, while the effect on the shear stress of the coating is more obvious. In addition, the in-phase load will delay the occurrence of interfacial failure behavior, while an out-of-phase load can promote the failure. These results will help to better understand the effects of the coupling of mechanical and temperature loads and to provide support and guidance for the design of new TBCs structures in the future.

1. Introduction

As the temperature in front of the turbine continues to rise, the blade material alone can no longer meet the requirements. Currently, the use of efficient internal blade cooling structures with air film cooling technology has become the main means, but this can greatly increase the manufacturing cost of the blade. The use of advanced thermal barrier coatings (TBCs) has become the most effective way to reduce the temperature of the blade substrate [1]. According to the relevant literature, applying thermal barrier coatings with a thickness of 250 µm can reduce the substrate temperature by 110–170 °C [2]. When spalling occurs, it will cause greater damage and harm to the blade substrate [3,4]. TBCs are generally considered to have a two-layer structure: ceramic top layer (TC) and bond layer (BC). The TC layer isolates the metal substrate from the heat flow and reduces the heat transfer capability. The BC layer can reduce the thermal mismatch between ceramic layer and substrate, and enhances the oxidation resistance. The thermally grown oxide (TGO) layer forms between TC and BC, which increases interfacial stresses and accelerates the occurrence of failure [5,6,7,8,9]. TBCs on turbine blades undergo the cyclic process of heating, holding, and cooling, resulting in cyclic thermal stresses and then fatigue failure phenomenon [10,11,12].
As gas turbine blades rotate at high speeds, TBCs are subjected to not only mechanical loads due to centrifugal forces, but also thermal and low peripheral fatigue due to frequent operation and standstill (Figure 1) [13,14,15]. In these complex environments, TBCs applied to gas turbines are exposed to a combination of temperature loads and mechanical loads. The failure mechanism becomes more complex compared to a single temperature load because mechanical loads can change the stress distribution and failure behavior of TBCs. It becomes a joint coupling of thermal mismatch stress, TGO growth stress, and centrifugal force. Under these conditions, cracks develop and expand within the TBCs, eventually damaging the TBCs [16,17,18,19]. Based on this practical working condition, TMF and TGMF tests are derived. A coated thin-walled round tube with a high-temperature fatigue machine is used for the test. However, the high temperature tests are difficult to measure, and it is hard to capture the internal stresses as well as the cracking behavior of the coating. Finite element simulations are needed to analyze the coupled effects of temperature loads and mechanical loads to best simulate the operating environment of the coating in the gas turbine [20].
In recent years, many scholars have used numerical simulation methods to model and analyze the failure of TBCs [21,22,23]. Studies have been carried out on TC layer thickness [24,25], plasticity [26,27], creep [28,29,30], sintering [31,32,33], TGO growth [34,35], and interface roughness [8,36,37,38]. Wei et al. [31] explored the effect of material parameters on residual stresses by combining various material properties based on the univariate principle. Yu et al. [38] analyzed the TBCs stresses based on the factors of interfacial roughness and TGO thickness. Song et al. [39] analyzed the stress distribution as well as the cracking behavior of coatings under thermal cycling conditions considering the increase in TGO thickness and found that the stress rises dramatically with the increase in TGO thickness. Ahrens et al. [40] investigated the stress distribution at the TBCs interface by a combination of experiments and finite elements. Yang et al. [20] analyzed the stress distribution and evolution under thermal cycling and thermal gradient mechanical fatigue loading. However, the coupled effects of temperature and mechanical loads have not been deeply investigated. Mercedes T et al. [41] quantified the thermo-mechanical response of the BC and TGO and found that creep greatly influences the stress distribution in the TBCs. However, the effect of mechanical loading was not further explored.
In this paper, finite element calculations will be carried out based on a user subroutine program. The material parameters such as plasticity, creep, TGO growth, and pressure loads are included in the model. The stress distributions in TBCs under constant tension, constant pressure, in-phase loading, and out-of-phase loading under thermal cycling conditions are compared. Then, the damage evolutions under in-phase/out-of-phase loading are analyzed. Based on this study, a more comprehensive and in-depth understanding of the effects of mechanical and temperature load coupling can be made, and a more accurate prediction and analysis of the actual working conditions can be carried out. It also provides a basis for the structural modification of TBCs.

2. Finite Element Model

2.1. Geometry and Mesh

Considering that the specimens used are generally hollow cylinders coated with the thermal barrier coatings on the surface, the circumferential unit is taken as the object of study and a two-dimensional finite element geometric model is established as shown in Figure 2 below. The structural features of a typical TBCs include a ceramic layer (Top Coat, TC), thermally grown oxide layer (TGO), bonding layer (Bond Coat, BC), and base metal material (substrate, SUB). TBCs are modeled with a thicknesses of 0.25 mm (TC), 0.001 mm (TGO), 0.15 mm (BC), and 3 mm (SUB), respectively. In the simulation, it is assumed that the TGO is uniformly dense α-Al2O3 [42,43], and the effect of the spinel oxides in the TGO on the failure of the TBCs is ignored [44].
The interface of the TC/BC is extremely complex and exhibits rough characteristics due to the spraying technology and TGO growth. So an ideal sinusoidal curve is used for approximate fitting of the interface, and the function is denoted by  y ( x ) = A 0 · sin ( 2 π x / λ ) , where  A 0 / λ = 0.5  and  λ  = 0.06 mm, and this model has been widely used by scholars. In addition, due to the symmetry and periodicity, the model contains only half a cycle.
Local encryption is performed for the TGO by setting the grid size to 0.0004 mm and all grid types are set to quadrilateral. Except for the cohesive element type COH2D4, all cells are set as temperature-displacement coupling, i.e., CPE4T. Transient temperature-displacement analysis is performed.

2.2. Material Property

For all the layers involved in the simulations, the materials are assumed to be homogeneous and isotropic. The thermophysical properties such as thermal expansion coefficient, modulus of elasticity, Poisson’s ratio, etc. of the TBCs materials vary with temperature. The properties of the materials involved are shown in Table 1 below [45].
Due to the brittleness of ceramic materials and the extremely low high-temperature creep rate, it is believed that the TC only exhibits elastic behavior and does not consider its plastic behavior. The yield strength of each layer of TBCs is shown in Table 2 [46,47].
When the TBCs temperature is greater than 600 °C, the creep behavior of the BC is particularly evident, while the creep behavior of the TC and the TGO only occurs at high temperatures. The creep behavior over time is represented by the following creep Norton formula:
ε ˙ cr = B σ n
where  ε ˙ cr  and  σ  are the strain rate and stress, respectively.  B  and  n  are temperature-dependent parameters fitted experimentally, as shown in Table 3 [48]. It is realized by the user subroutine “CREEP” in Abaqus/standard.

2.3. Boundary Conditions

As shown in Figure 3a, a symmetric constraint along the horizontal direction is applied for the left side of the model due to the periodicity of the selected model. The right side is constrained using multipoint constraints (MPC) and mechanical loads are applied. The multipoint constraint (MPC) allows the nodes on the right side to move with the same displacement in the horizontal direction while allowing free movement along the vertical direction. The initial unstressed temperature is set to 1000 °C and the thermal history experienced by the whole model is shown in Figure 3b below. For a single cycle, it rises from 25 °C to 1050 °C after 55 s, then undergoes a 300 s holding phase, and then cools down to 25 °C after 5 s, for a total of 20 cycles. Since this paper is a parametric modeling analysis based on finite element simulation, it focuses more on the effect of mechanical loads on the thermal barrier coating. The simulation will not be strictly based on experimental or engineering specifications. The selection of 20 thermal cycles is a comprehensive measure of the results presented as well as the results obtained from computational resources. A uniform temperature field is applied for the whole model, and no heat transfer occurs during the temperature change. Creep at high temperatures allows the release of tensile stresses in the TBCs, resulting in stress reduction. The mechanical loading cycles experienced by the model are shown in Figure 3c below. The solid line indicates in-phase loading (i.e., maximum temperature corresponds to maximum mechanical load), while the dashed line indicates out-of-phase loading (i.e., maximum temperature corresponds to minimum mechanical load).

2.4. TGO Growth Design

Due to the porous structure of the TC, oxygen diffusion is not prevented. Oxygen passes through the TC with elements such as Al, Cr, etc. from the BC to form the internal oxidation by a chemical reaction at high-temperature conditions (>900 °C). Internal oxidation mainly involves two typical oxides: TGO and internal oxides. When internal oxides are formed, the stress distribution as well as the failure mode of the coating can influence the impact. The growth rate is generally higher than that of TGO, so the interface in contact with the internal oxide is more prone to cracking, and cracks tend to propagate along the interface. The amount, location and distance of the internal oxide from the coating interface all have an effect. In this paper, only the growth of TGO is considered, which is shown to be feasible [45,46,47,48,49]. It grows uniformly normal to the TC/TGO interface, introducing greater growth stresses to the interface. In ABAQUS for TGO growth simulation, generally the CREEP user subroutine was used to define the SWELLING option in this simulation due to the predefined TGO thickness of 0.001 mm, and its growth mode for the qualitative analysis of the stress does not have much impact, thus the definition of a constant strain rate.
h ˙ cr = 1.0 × 10 4
To achieve a normal uniform growth along the TC/TGO interface, the following deformation parameters are defined as follows:
h ˙ oxidation = r i i 1 3 h ˙ cr
where the subscripts i = 1, 2, 3 are determined by the coordinates and direction 2 is the interface normal direction. Considering that the thermal growth strain grows only along the direction normal to the TGO layer, in this finite element simulation,  r 22  = 3,  r 11  =  r 33  = 0. Therefore, all thermal growth strains are applied in the direction of the thickness of the TGO layer with  h ˙ oxidation  =  h ˙ cr  [49].

2.5. Crack Growth Modeling Tool

The failure of TBCs is characterized by TC spalling by way of crack sprouting and expansion. In this simulation, the cohesive element is placed between the TC/TGO to simulate crack initiation and expansion. The separation law used is shown in the following equation [50].
{ σ n σ n 0 } 2 + { σ s σ s 0 } 2 + { σ t σ t 0 } 2 = D
σ n = { σ n , σ n 0 0 , σ n 0
where  σ n σ s  and  σ t  denote the nominal stresses when the deformation is completely perpendicular to the interface and completely along the first and second shear directions, respectively.  σ n 0 σ s 0  and  σ t 0  denote the tensile and shear strengths in the corresponding directions, respectively. The BK criterion is used to determine the damage evolution [50,51].
G n c + ( G s c G n c ) { G S G T } η = G c
G s c = G t c
G S = G s + G t
G T = G n + G S
where  G n c G s c G t c  denote the normal as well as the first and second critical fracture energies at the onset of fracture, respectively. η is a material parameter. In this model, the interfacial properties are described according to previous literature [49,50,51]: critical interfacial strength  σ n 0  =  σ s 0  = 100 MPa, critical fracture energy  G n c  =  G s c  = 0.02 mJ/mm2, and  η  = 1.45. The interfacial modulus is calculated to be  K n n  =  K s s  = 0.50 × 10⁷ N/mm3.
K n n = 10 σ n 2 / G n c
K s s = 10 σ s 2 / G s c

3. Result and Discussion

3.1. Stress Distribution in TBCs

3.1.1. Without Mechanical Loading

The stress distribution in the TC, taking into account the material plasticity, creep, and TGO growth, is shown in Figure 4 below. The stress distributions of the TC after different thermal cycles are all for the cooling to room temperature stage. Positive values of normal stress S22 represent tensile stress and negative values represent compressive stress, so only positive values are analyzed. The shear stress S12 causes interface damage both positive and negative. Along with the increase in the number of thermal cycles, the value of normal stress S22 in the off-peak area gradually increases. Especially at the interface, it becomes the maximum stress area, while localized high compressive stress areas appear at the peak and the valley areas. The overall normal stress of the TC is weakly compressive except in the off-peak area. For the shear stress S12, the absolute values are analyzed. It is found that with the increase in the number of thermal cycles, a high-stress region appears at the interface of the off-peak area. This region shows an ellipsoid-like attenuation distribution, and the overall shear stress shows a weak shear stress.
The stress evolution in different areas is shown in the following Figure 5. The normal stress S22 is significantly affected by the thermal mismatch stress, and the stresses in all areas show cyclic variations with thermal cycling. The maximum stresses all appear in the room temperature stage, which is consistent with the damage observed in the cooling stage of the test. The normal stress S22 at the off-peak area shows an increasing trend due to the effect of TGO growth, and the thermal mismatch stress from cooling is further enhanced. The normal stress in the off-valley area, on the other hand, is less affected by the TGO growth stress, and only the thermal mismatch stress from cooling to room temperature exists. The compressive stresses in the peak and valley areas keep increasing with the number of thermal cycles.
The shear stress S12 at the off-peak area is gradually reduced by the thermal mismatch and shows an increasing trend. The shear stress S12 in the off-valley area exhibits similar characteristics to the normal stress S22 in the off-peak area. There is almost no shear stress in the valley area, while the shear stress S12 in the peak area tends to converge with the number of thermal cycles. It is noteworthy that the shear stresses S12 in all the areas are deteriorated due to the thermal mismatch stress, except for the shear stress S12 in the off-peak area, which is released due to the thermal mismatch stress.

3.1.2. Considering Tensile Loading

A constant tensile stress of 60 MPa is applied to the right boundary of the TBCs and the stress distribution in the TC is shown in Figure 6 below. It is found that the tensile stress does not affect the distribution of normal stress S22 and shear stress S12, but only the stress values. The normal stress S22 is released to a certain extent, the positive value of the shear stress is reduced and the negative value is increased.
For the maximum value of normal stress S22, none of the values changed significantly in the 1st cycle. The maximum stress value decreased from 254 MPa without tensile loading to 222 MPa after 10 cycles. After 20 cycles it only decreases from 409 MPa to 401 MPa due to the relaxation effect of creep and plasticity. For the maximum value of shear stress S12, it has a decreasing effect after 10 cycles, and it is somewhat increased after 20 cycles, from 789 MPa to 799 MPa. It can be analyzed that the tensile stress somewhat reduces the normal stress S12 and increases the shear stress S12.
The stress evolution in different areas is shown in the following Figure 7. The normal (compressive) stress S22 in the peak and off-valley areas is released to some extent, while the stresses in the other areas do not undergo significant changes. The shear stress S12 in the off-valley area is reduced and the shear stress S12 in the off-peak area is increased. The stresses in the other areas did not change greatly.

3.1.3. Considering Compression Loading

A constant compressive stress of 60 MPa is applied to the right boundary of the coating system, and the stress distribution in the TC is shown in Figure 8 below. The compressive stress affects the normal stress S22 distribution, which puts most of the region in a lower tensile stress state. When no compressive load is applied, most areas of the TC are in a stress-free state. The effect of compressive stress on the positive value of normal stress S22 is not significant and is more reflected in the negative value, which is not analyzed in depth in this paper. The compressive stress has a certain effect on the distribution of shear stress S12, which leads to the expansion of the stress attenuation region of the off-peak area. At the same time, the absolute value of shear stress S12 is increased, and the interface damage is further aggravated.
The stress evolution in different areas is shown in Figure 9 below. For the normal stress S22, the compressive load releases the compressive stress in the off-valley area and increases the compressive stress in the peak area considerably. There is no effect on the other parts. For the shear stress S12, it increases the shear stress in the off-valley part and decreases the shear stress in the off-peak area. It makes the shear stress in the off-valley and peak areas converge to a constant value.

3.1.4. Considering in-Phase Loading

For in-phase loading, the temperature maximum corresponds to the mechanical load maximum, i.e., 1050 °C corresponds to 60 MPa and 25 °C corresponds to 0 MPa. The stress distribution in the TC is shown below in Figure 10. Since the mechanical loads (stresses) are applied at high temperatures, the influence of the mechanical loads is more in harmony with the plasticity and creep properties of the material. It can be found that the in-phase loading has some influence on the normal stress S22 distribution. The stress attenuation region in the off-peak area is narrowed, and the maximum value of tensile stress is reduced to some extent. In-phase loading has little effect on the shear stress S12 distribution and somewhat increases the maximum shear stresses. The stress evolution in different areas is shown in Figure 11 below. The in-phase loading has a greater effect on S22 in the peak area, which reduces the compressive stress. The shear stress S12 in the off-peak areas is further increased and has less effect on the other areas.

3.1.5. Considering Out-of-Phase Loading

For the out-of-phase loading, the temperature maximum corresponds to the mechanical loading minimum, i.e., 1050 °C corresponds to −60 MPa and 25 °C corresponds to 0 MPa. The stress distribution in the TC is shown in Figure 12 below. The out-of-phase loading leads to a stress distribution similar to the previous compression loading. The distribution of the normal stress S22 is strongly affected, and the maximum value is reduced to some extent. The distribution and the value of the shear stress S12 are not significantly affected. The stress evolution in different areas is shown in Figure 13 below. The out-of-phase loading has a greater effect on the normal stress S22 in the peak area, increasing the compressive stress. For the shear stress, S12 in the off-peak area is released to some extent.

3.2. The Failure Behavior of TBCs

Figure 14a shows the evolution of damage in different regions in the absence of mechanical loading. The damage in the near-peak region occurs at the beginning of the cycle, which is due to the cooling process from 1000 °C to 25 °C experienced at the beginning of the thermal cycle. The damage accumulation has started to occur in this area under the effect of the great thermal mismatch stress. Afterwards, the stress evolution shows that the normal stress in the near-peak area is subjected to TGO growth and then shows an increasing trend, and the thermal stress realizes an amplification effect. The shear stress is also reversed by TGO growth and then increases. The thermal stresses are reduced. As a result of the shear stress at the crest area, damage accumulation also started to occur at the crest area after seven thermal cycles. No damage occurred in the off-valley area or in the valley area. The damage evolution in different areas with applied in-phase and out-of-phase loads is shown in Figure 14b,c below. In the case of in-phase loading, damage in the off-peak area still occurs in the initial cycle, but damage accumulation is mitigated. The damage at the peak area is delayed until after 9 thermal cycles, and the accumulated damage after 20 thermal cycles is lower than that without mechanical loading. For out-of-phase loading, damage to the off-peak area is the same as without mechanical loading, and it occurs from the beginning. However, the damage in the peak area starts after six thermal cycles and the damage accumulation is more significant. The remaining two areas show no damage after 20 thermal cycles. Although it was found from the previous stress analysis that in-phase loading is worse than out-of-phase loading, the damage is affected by the stress coupling. It is generally accepted that stress analysis can be performed to predict damage-prone areas, which will be affected by damage parameters once damage begins or cracks start to develop. This is the reason why damage does not fully correspond to stress analysis. The analysis shows that the in-phase load has a certain damage mitigation effect on the interface, slowing down the accumulation of damage in the off-peak area and delaying the damage onset in the peak area. The out-of-phase load has a certain damage promotion effect on the interface, accelerating the damage accumulation in the off-peak area and advancing the damage in the peak area. The occurrence of such damage characteristics is the result of mechanical loads in opposite directions super-imposed on the sinusoidal interface, harmonized with the plastic and creep properties of the material. Also, according to the analysis of the damage with different load combinations, the mechanical loads did not change the damage pattern. It still maintains the characteristic of preferential damage in the off-peak area and subsequent damage in the peak area. It only promotes or delays the damage evolution of these two areas. The valley and off-valley areas are not affected by mechanical loading and no damage occurred.

4. Conclusions

In this paper, the coupled effects of mechanical and temperature loads on coating failure are investigated based on finite element simulation. By applying different combinations of mechanical and temperature loads, the stress distribution of the coating and the stress evolution in different areas are investigated. The evolution of interfacial damage under different combinations of conditions is also analyzed. The conclusions drawn are as follows:
(1)
Mechanical loads have different effects in different areas of the coating due to the undulation of the interface. The main effect is on the stress values and the evolution of the stresses in the coating, while the distribution of the stresses is not yet obvious. It is hypothesized that the mechanical load may be small.
(2)
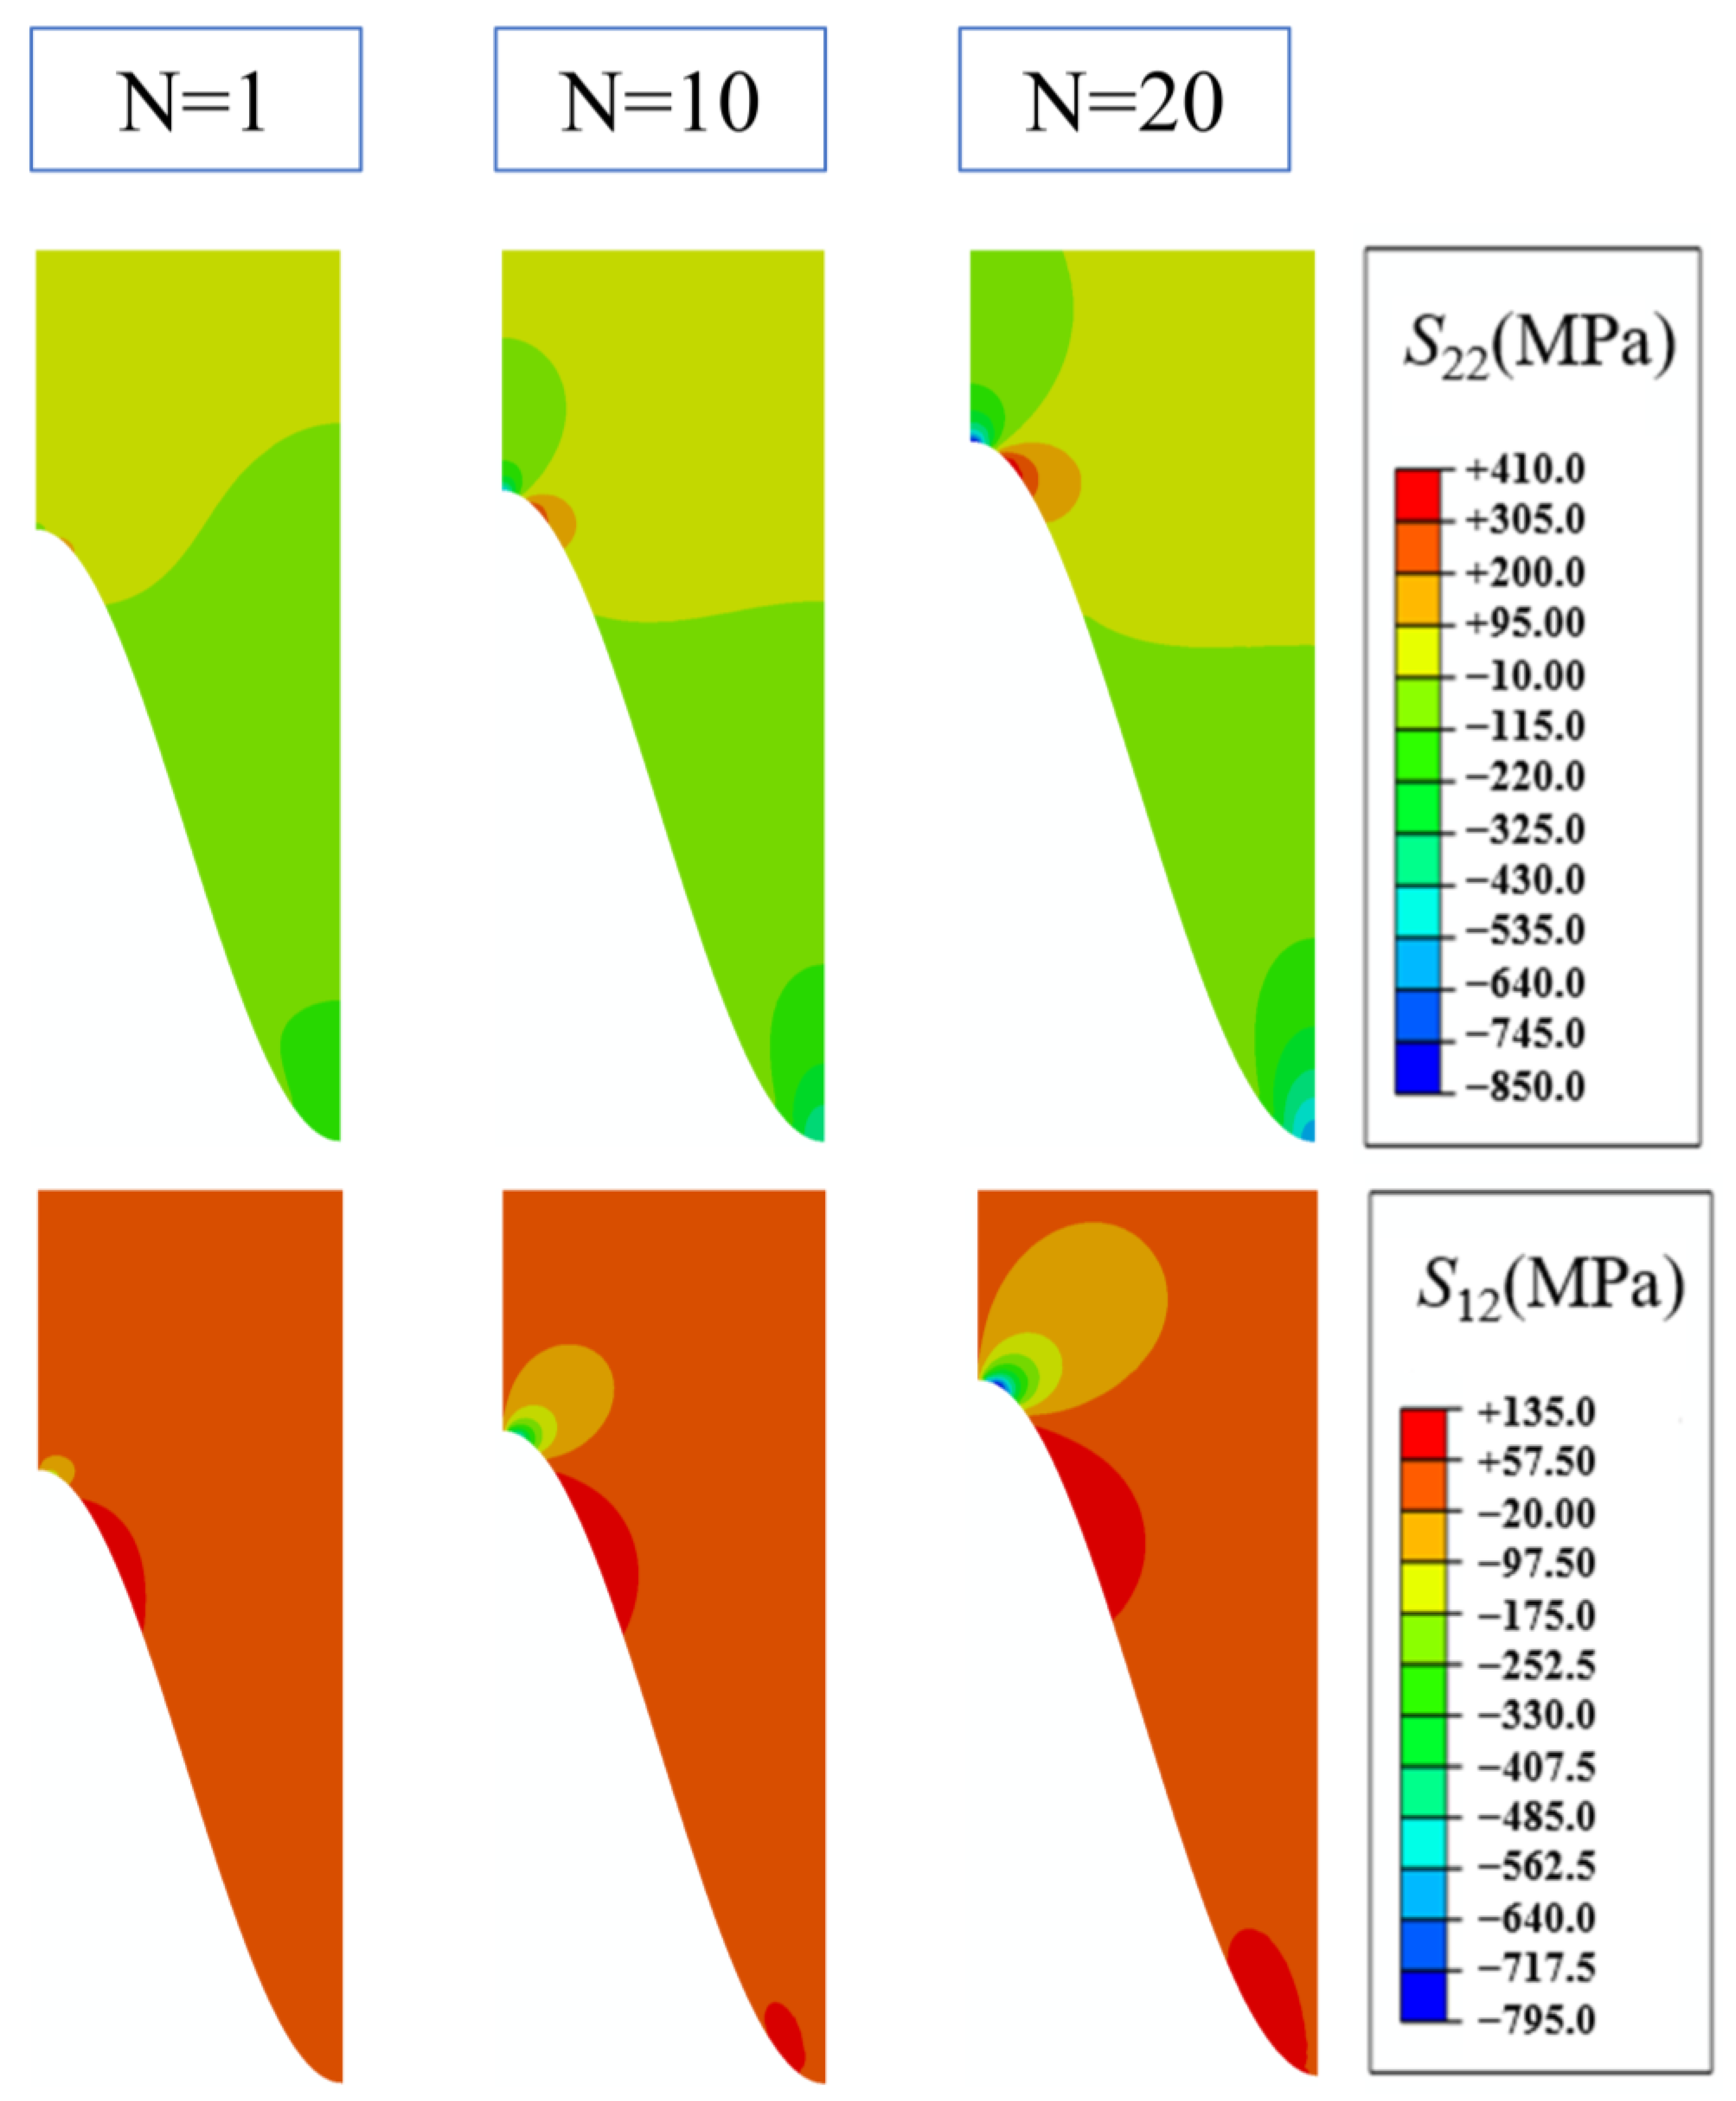
The effect of tensile and compressive loads on the normal stress of the coating is not significant, while the effect on the shear stress of the coating is more obvious. The peak and off-peak areas are more susceptible to mechanical loads, and the effects of different mechanical loads are opposite.
(3)
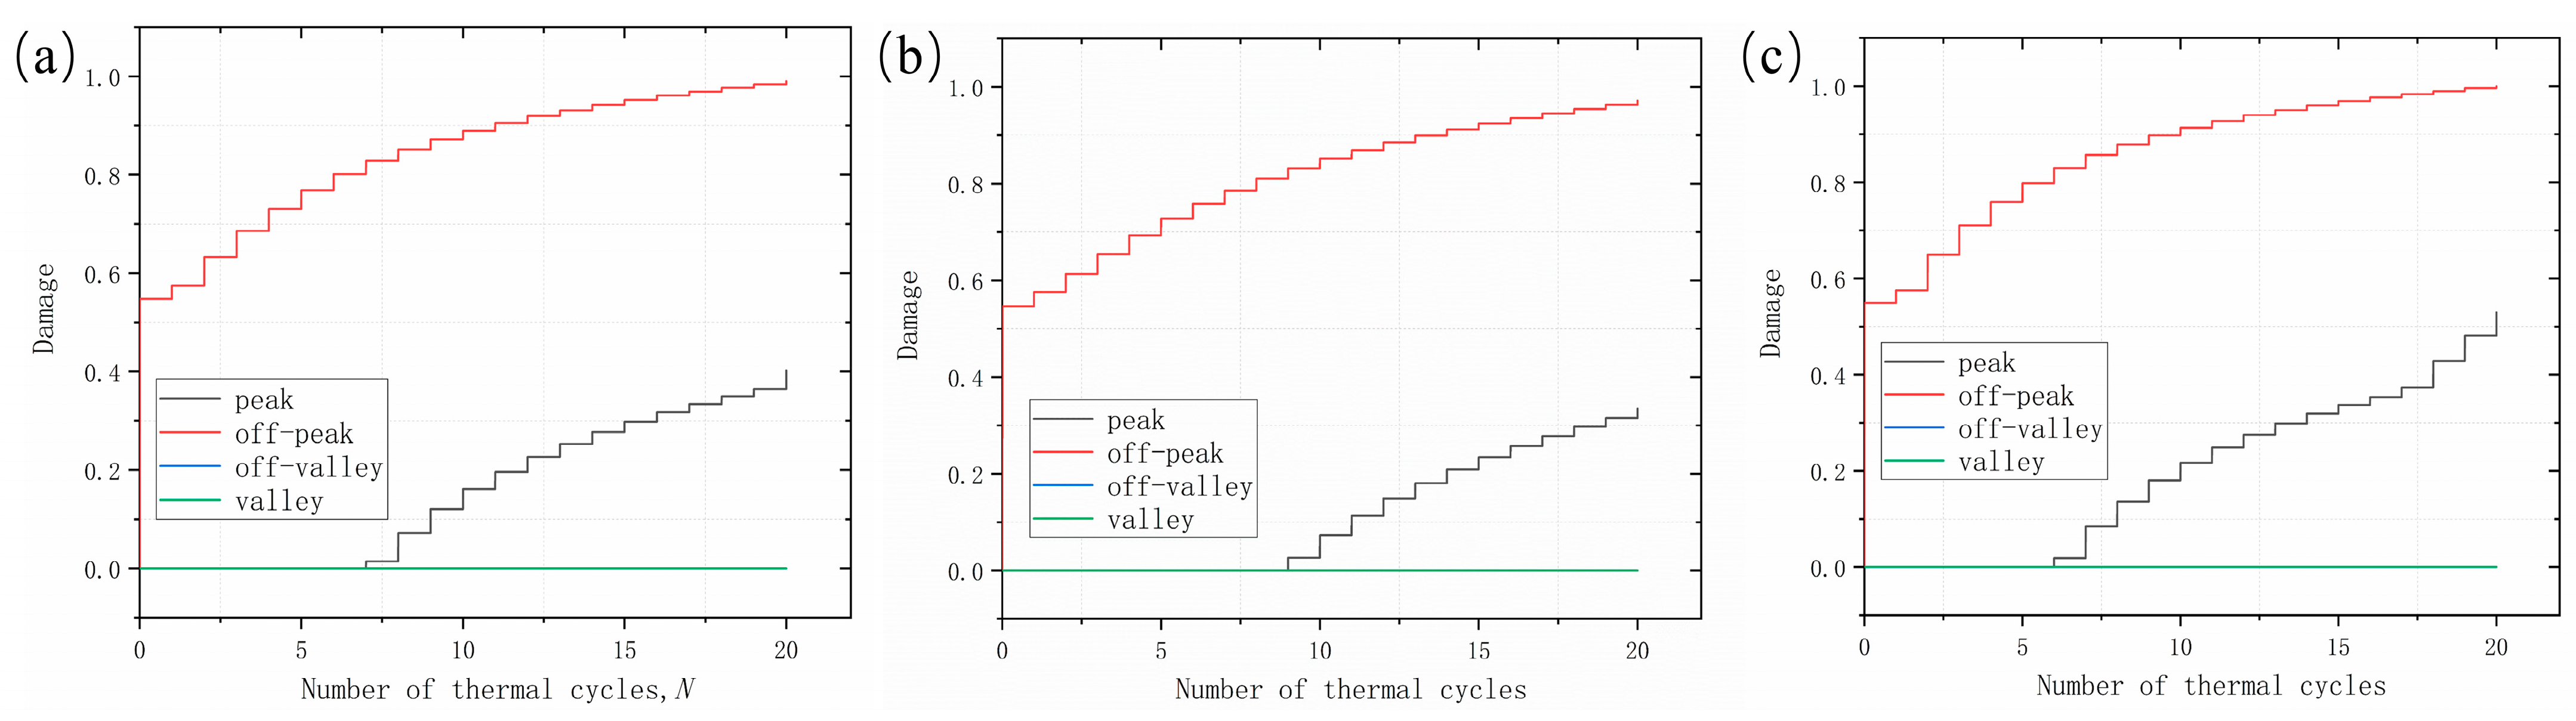
Mechanical loading did not change the original failure mode and preferentially occurred in the off-peak area. In-phase loading delayed the initiation and accumulation of damage, while the opposite is true for out-of-phase loading.
(4)
Damage is affected by the coupling of stresses, which can predict preferential damage sites but cannot correspond exactly to damage. Damage initiation or crack initiation will be influenced by damage parameters.

Author Contributions

Conceptualization, D.Q. and W.Z.; methodology, D.Q.; software, D.Q.; validation, W.Z.; formal analysis, J.M. and W.Y.; investigation, X.B. and B.X.; writing—original draft preparation, D.Q.; writing—review and editing, D.Q. and W.Z.; visualization, D.Q. and J.M.; supervision, W.Z.; project administration, D.Q. and W.Z.; resources, W.Z. All authors have read and agreed to the published version of the manuscript.

Funding

This research was supported by the National Science and Technology Major Project (Grant Number J2019-IV-0006-0074).

Data Availability Statement

The data are not publicly available because they also form part of an ongoing study.

Conflicts of Interest

The authors declare no conflict of interest.

References

  1. Padture, N.P. Advanced structural ceramics in aerospace propulsion. Nat. Mater. 2016, 15, 804–809. [Google Scholar] [CrossRef] [PubMed]
  2. Padture, N.P.; Gell, M.; Jordan, E.H. Thermal Barrier Coatings for Gas-Turbine Engine Applications. Science 2002, 296, 280–284. [Google Scholar] [CrossRef] [PubMed]
  3. Wellman, R.G.; Nicholls, J.R. Erosion, corrosion and erosion–corrosion of EB PVD thermal barrier coatings. Tribol. Int. 2008, 41, 657–662. [Google Scholar] [CrossRef]
  4. Hass, D.D.; Parrish, P.A.; Wadley, H.N.G. Electron beam directed vapor deposition of thermal barrier coatings. J. Vac. Sci. Technol. A Vac. Surf. Film. 1998, 16, 3396–3401. [Google Scholar] [CrossRef]
  5. Goswami, B.; Ray, A.K.; Sahay, S.K. Thermal Barrier Coating System for Gas Turbine Application—A Review. High Temp. Mater. Process. 2004, 23, 73–92. [Google Scholar] [CrossRef]
  6. Chen, L.; Yueming, L. Interface stress evolution considering the combined creep–plastic behavior in thermal barrier coatings. Mater. Des. 2016, 89, 245–254. [Google Scholar] [CrossRef]
  7. Ang, A.S.M.; Berndt, C.C. A review of testing methods for thermal spray coatings. Int. Mater. Rev. 2014, 59, 179–223. [Google Scholar] [CrossRef]
  8. Wei, Z.Y.; Liu, Y.; Cheng, B.; Tahir, A. Influence of non-uniform feature of thermally grown oxide thickness on the local stress state and cracking behavior in TBC. Surf. Coat. Technol. 2022, 443, 128607. [Google Scholar] [CrossRef]
  9. Lima, C.R.C.; Gyilemany, J.M. Adhesion improvements of Thermal Barrier Coatings with HVOF thermally sprayed bond coats. Surf. Coat. Technol. 2007, 201, 4694–4701. [Google Scholar] [CrossRef]
  10. Barwinska, I.; Kopec, M.; Kukla, D.; Senderowski, C.; Kowalewski, Z.L. Thermal Barrier Coatings for High-Temperature Performance of Nickel-Based Superalloys: A Synthetic Review. Coatings 2023, 13, 769. [Google Scholar] [CrossRef]
  11. Thakare, J.G.; Pandey, C.; Mahapatra, M.M.; Mulik, R.S. Thermal barrier coatings—A state of the art review. Met. Mater. Int. 2021, 27, 1947–1968. [Google Scholar] [CrossRef]
  12. Mehboob, G.; Liu, M.J.; Xu, T.; Hussain, S.; Mehboob, G.; Tahir, A. A review on failure mechanism of thermal barrier coatings and strategies to extend their lifetime. Ceram. Int. 2020, 46, 8497–8521. [Google Scholar] [CrossRef]
  13. Choi, J.G.; Seok, C.S.; Wee, S.U.; Chung, E.S.; Yun, B.G.; Kwon, S.H. Low cycle fatigue characteristics of a Ni-based single crystal superalloy CMSX-4 at elevated temperature. J. Korean Soc. Precis. Eng. 2019, 36, 271–279. [Google Scholar] [CrossRef]
  14. Lee, J.M.; Seok, C.S.; Lee, D.; Kim, Y.; Yun, J.; Koo, J.M. Prediction of thermo-mechanical fatigue life of IN738 LC using the finite element analysis. Int. J. Precis. Eng. Manuf. 2014, 15, 1733–1737. [Google Scholar] [CrossRef]
  15. Choi, J.; Wee, S.; Koo, J.M.; Chung, E.S.; Kwon, S.H.; Seok, C.S. Thermo-mechanical fatigue characteristics of CMSX-4 applied to the high-pressure turbine first-stage single-crystal rotor blade. J. Mech. Sci. Technol. 2020, 34, 1855–1862. [Google Scholar] [CrossRef]
  16. Jing, P.L.; Zhang, C.X.; Wang, X.Y.; Jia, Z.; Tang, S.B.; Liu, J.L.; Wu, C.B.; Huang, J.D.; Pan, B.; Fu, T.R. Non-Contact Synchronous Testing Technology for Turbine Blade Strain/Temperature. Aerosp. Power 2020, 6, 38. [Google Scholar]
  17. Okazaki, M.; Sakaguchi, M. Thermo-mechanical fatigue failure of a single crystal Ni-based superalloy. Int. J. Fatigue 2008, 30, 318–323. [Google Scholar] [CrossRef]
  18. Lee, J.M.; Song, H.; Kim, Y.; Koo, J.M.; Seok, C.S. Evaluation of thermal gradient mechanical fatigue characteristics of thermal barrier coating, considering the effects of thermally grown oxide. Int. J. Precis. Eng. Manuf. 2015, 16, 1675–1679. [Google Scholar] [CrossRef]
  19. Shin, I.H.; Lee, D.K.; Kim, Y.S.; Koo, J.M.; Seok, C.S.; Lee, T.W. Assessment of the characteristic of thermal barrier coating applied to gas turbine blade by thermo-gradient mechanical fatigue test. Procedia Eng. 2013, 55, 210–213. [Google Scholar] [CrossRef]
  20. Yang, Z.; Chen, G.F.; Li, C.P.; Luo, J.B. Analysis on Stress Distribution of Thermal Barrier Coating System with Thermal Gradient Mechanical Fatigue. China Surf. Eng. 2007, 201, 4694–4701. [Google Scholar]
  21. Wang, Y.; Wang, C.; You, Y.; Cheng, W.; Dong, M.; Zhu, Z.; Wang, Y. Analysis on thermal stress of optimized functionally graded coatings during thermal shock based on finite element simulation. Mater. Today Commun. 2023, 35, 105699. [Google Scholar] [CrossRef]
  22. Tao, Q.; Wang, Y.; Yang, S.; Liu, Y. Simulations of Effects of Geometric and Material Parameters on the Interfacial Stress of the Thermal Barrier Coatings with Free Edges. Coatings 2023, 13, 1378. [Google Scholar] [CrossRef]
  23. Chen, Z.; Jia, W.; Zhao, K.; Fang, L. Comparison of stress evolution under TGO growth simulated by two different methods in thermal barrier coatings. Ceram. Int. 2020, 46, 2915–2922. [Google Scholar] [CrossRef]
  24. Rösler, J.; Bäker, M.; Aufzug, K. A parametric study of the stress state of thermal barrier coatings Part I: Creep relaxation. Acta Mater. 2004, 52, 4809–4817. [Google Scholar]
  25. Cao, X.Q.; Meng, J.; Zhong, X.H.; Dai, H.L.; Li, H.Y.; Zhang, Y.F. Thermal stability of double-ceramic-layer thermal barrier coatings with various coating thickness. Mater. Sci. Eng. A 2006, 433, 1–7. [Google Scholar]
  26. Wei, Z.Y.; Cai, H.N.; Feng, R.X.; Su, J.Y. Dynamic crack growth mechanism and lifetime assessment in plasma sprayed thermal barrier system upon temperature cycling. Ceram. Int. 2019, 45, 14896–14907. [Google Scholar] [CrossRef]
  27. He, M.Y.; Hutchinson, J.W.; Evans, A.G. Simulation of stresses and delamination in a plasma-sprayed thermal barrier system upon thermal cycling. Mater. Sci. Eng. A 2003, 345, 172–178. [Google Scholar] [CrossRef]
  28. Chai, Y.; Lin, C.; Li, Y. Effects of creep-plastic behavior on stress development in TBCs during cooling. Ceram. Int. 2017, 43, 11627–11634. [Google Scholar] [CrossRef]
  29. Chen, Z.; Huang, H.; Zhao, K.; Jia, W.; Fang, L. Influence of inhomogeneous thermally grown oxide thickness on residual stress distribution in thermal barrier coating system. Ceram. Int. 2018, 44, 16937–16946. [Google Scholar] [CrossRef]
  30. Su, L.; Zhang, W.; Sun, Y.; Wang, T.J. Effect of TGO creep on top-coat cracking induced by cyclic displacement instability in a thermal barrier coating system. Surf. Coat. Technol. 2014, 254, 410–417. [Google Scholar] [CrossRef]
  31. Dong, H.; Yao, J.T.; Li, X.; Zhou, Y.; Li, Y.B. The sintering behavior of plasma-sprayed YSZ coating over the delamination crack in low temperature environment. Ceram. Int. 2018, 44, 3326–3332. [Google Scholar] [CrossRef]
  32. Li, G.R.; Wang, L.S.; Yang, G.J.; Li, C.X.; Li, C.J. Combined effect of internal and external factors on sintering kinetics of plasma-sprayed thermal barrier coatings. J. Eur. Ceram. Soc. 2019, 39, 1860–1868. [Google Scholar] [CrossRef]
  33. Wei, Z.Y.; Cai, H.N. Comprehensive effects of TGO growth on the stress characteristic and delamination mechanism in lamellar structured thermal barrier coatings. Ceram. Int. 2020, 46, 2220–2237. [Google Scholar] [CrossRef]
  34. Xu, B.Q.; Jiang, J.S.; Zou, Z.H.; Wang, W.Z.; Zhao, X.F.; Liu, Y.Z. Time-dependent spalling behavior of thermally grown oxide induced by room temperature interfacial deformation. Surf. Coat. Technol. 2018, 334, 164–172. [Google Scholar] [CrossRef]
  35. Shen, Q.; Yang, L.; Zhou, Y.C.; Wei, Y.G.; Zhu, W. Effects of growth stress in finite-deformation thermally grown oxide on failure mechanism of thermal barrier coatings. Mech. Mater. 2017, 114, 228–242. [Google Scholar] [CrossRef]
  36. Ferguen, N.; Leclerc, W.; Lamini, E.S. Numerical investigation of thermal stresses induced interface delamination in plasma-sprayed thermal barrier coatings. Surf. Coat. Technol. 2023, 461, 129449. [Google Scholar] [CrossRef]
  37. Wei, Z.Y.; Cai, H.N.; Feng, R.X.; Zhang, H. The combined effect of creep and TGO growth on the cracking driving force in a plasma-sprayed thermal barrier system. J. Therm. Spray Technol. 2019, 28, 1000–1016. [Google Scholar] [CrossRef]
  38. Yu, Q.M.; Zhou, H.L.; Wang, L.B. Influences of interface morphology and thermally grown oxide thickness on residual stress distribution in thermal barrier coating system. Ceram. Int. 2016, 42, 8338–8350. [Google Scholar] [CrossRef]
  39. Song, J.; Li, S.; Yang, X.; Qi, H.; Shi, D. Numerical investigation on the cracking behaviors of thermal barrier coating system under different thermal cycle loading waveforms. Surf. Coat. Technol. 2018, 349, 166–176. [Google Scholar] [CrossRef]
  40. Ahrens, M.; Vassen, R.; Stgover, D. Stress distributions in plasma-sprayed thermal barrier coatings as a function of interface roughness and oxide scale thickness. Surf. Coat. Technol. 2002, 161, 26–35. [Google Scholar] [CrossRef]
  41. Hernandez, M.T.; Karlsson, A.M.; Bartsch, M. On TGO creep and the initiation of a class of fatigue cracks in thermal barrier coatings. Surf. Coat. Technol. 2009, 203, 3549–3558. [Google Scholar] [CrossRef]
  42. Cen, L.; Qin, W.Y.; Yu, Q.M. Analysis of interface delamination in thermal barrier coating system with axisymmetric structure based on corresponding normal and tangential stresses. Surf. Coat. Technol. 2019, 358, 785–795. [Google Scholar] [CrossRef]
  43. Białas, M. Finite element analysis of stress distribution in thermal barrier coatings. Surf. Coat. Technol. 2008, 202, 6002–6010. [Google Scholar] [CrossRef]
  44. Lv, B.; Xie, H.; Xu, R.; Fan, X.; Zhang, W.; Wang, T.J. Effects of sintering and mixed oxide growth on the interface cracking of air-plasma-sprayed thermal barrier coating system at high temperature. Appl. Surf. Sci. 2016, 360, 461–469. [Google Scholar] [CrossRef]
  45. Ranjbar-Far, M.; Absi, J.; Shahidi, S.; Mariaux, G. Impact of the non-homogenous temperature distribution and the coatings process modeling on the thermal barrier coatings system. Mater. Des. 2011, 32, 728–735. [Google Scholar] [CrossRef]
  46. Xu, T.; He, M.Y.; Evans, A.G. A numerical assessment of the durability of thermal barrier systems that fail by ratcheting of the thermally grown oxide. Acta Mater. 2003, 51, 3807–3820. [Google Scholar] [CrossRef]
  47. Cen, L.; Qin, W.Y.; Yu, Q.M. Finite Element Analysis of Interface Undulation and Interface Delamination in the MCrAlY Coating System Under Thermal Cycling: Considering Oxide Thickness and Top-Coat Effects. J. Therm. Spray Technol. 2020, 29, 597–610. [Google Scholar] [CrossRef]
  48. Jiang, J.; Wang, W.; Zhao, X.; Liu, Y.; Cao, Z.; Xiao, P. Numerical analyses of the residual stress and top coat cracking behavior in thermal barrier coatings under cyclic thermal loading. Eng. Fract. Mech. 2018, 196, 191–205. [Google Scholar] [CrossRef]
  49. Huang, Y.P.; Wei, Z.Y.; Cai, H.N.; Liu, Y.; Han, X.C. The effects of tgo growth stress and creep rate on tc/tgo interface cracking in aps thermal barrier coatings. Ceram. Int. 2021, 47, 24760–24769. [Google Scholar] [CrossRef]
  50. Deng, H.X.; Shi, H.J.; Yu, H.C.; Zhong, B. Effect of heat treatment at 900 °C on microstructural and mechanical properties of thermal barrier coatings. Surf. Coat. Technol. 2011, 205, 3621–3630. [Google Scholar] [CrossRef]
  51. Song, J.; Qi, H.; Shi, D.; Yang, X.; Li, S. Effect of non-uniform growth of TGO layer on cracking behaviors in thermal barrier coatings: A numerical study. Surf. Coat. Technol. 2019, 370, 113–124. [Google Scholar] [CrossRef]
Figure 1. Schematic illustration of thermo-mechanical coupled loads on a turbine blade [16].
Crystals 14 00002 g001
Figure 2. Geometric model of TBCs.
Crystals 14 00002 g002
Figure 3. TBC analysis model: (a) boundary conditions, (b) temperature history, and (c) mechanical load history.
Crystals 14 00002 g003
Figure 4. Stress distribution after different numbers of cycles without considering mechanical loading.
Crystals 14 00002 g004
Figure 5. Stress evolution in different areas without considering mechanical loading: (a) normal stress and (b) shear stress.
Crystals 14 00002 g005
Figure 6. Stress distribution after different numbers of cycles considering tensile loading.
Crystals 14 00002 g006
Figure 7. Stress evolution in different areas considering tensile loading: (a) normal stress, and (b) shear stress.
Crystals 14 00002 g007
Figure 8. Stress distribution after different numbers of cycles considering compression loading.
Crystals 14 00002 g008
Figure 9. Stress evolution in different areas considering compression loading: (a) normal stress and (b) shear stress.
Crystals 14 00002 g009
Figure 10. Stress distribution after different numbers of cycles considering in-phase loading.
Crystals 14 00002 g010
Figure 11. Stress evolution in different areas considering in-phase loading: (a) normal stress and (b) shear stress.
Crystals 14 00002 g011
Figure 12. Stress distribution after different numbers of cycles considering out-of-phase loading.
Crystals 14 00002 g012
Figure 13. Stress evolution in different areas considering out-of-phase loading: (a) normal stress and (b) shear stress.
Crystals 14 00002 g013
Figure 14. Damage evolution in different areas, (a) without considering mechanical loading, (b) considering in-phase loading, and (c) considering out-of-phase loading. The lines of label “off-valley” and “valley” are overlapping.
Crystals 14 00002 g014
Table 1. Material parameters of TBCs. Data from [45].
MaterialTemperature/Elastic Modulus/μDensity/CTE/Thermal Conductivity/Specific Heat/
(°C)(GPa)(kg·m−3)(ppm·°C−1)(W·m−1·K−1)(J·kg−1·K−1)
TC2517.50.2056509.681.05483
400-0.2056509.701.05483
800-0.2056509.881.05483
100012.40.20565010.341.05483
TGO253800.2739785.1025.2857
400-0.273978-25.2857
8003380.273978-25.2857
10003120.2739789.8025.2857
BC251830.307320-4.6501
4001520.30732012.506.4593
8001090.30732014.3010.2781
1000-0.30732016.0016.1764
DZ41125129.90.308344-8.6469
4001180.30834412.9015.5501
8001010.30834414.5021.1547
1000860.30834415.6023.1575
Table 2. Yield strength of materials in TBCs. Data from [46,47].
LayersTemperature/°CPlastic Strainσy/MPa
TGO20010,000
900010,000
100001000
BC2001000
30001000
7500100
10000100
DZ4112001280
65001255
70001185
8000955
9000655
9800595
10000356
Table 3. Creep parameters of each material [48].
LayersB (s−1MPa−n)nT (°C)
TC1.8 × 10−911000
TGO7.3 × 10−911000
BC6.54 × 10−194.57≤600
2.20 × 10−122.99700
1.84 × 10−71.55800
2.15 × 10−82.45≥850
Disclaimer/Publisher’s Note: The statements, opinions and data contained in all publications are solely those of the individual author(s) and contributor(s) and not of MDPI and/or the editor(s). MDPI and/or the editor(s) disclaim responsibility for any injury to people or property resulting from any ideas, methods, instructions or products referred to in the content.

