1. Introduction
The mechanical characteristics of Inconel 718 alloy are exceptional in both short-term and extended durations when exposed to cyclic atmospheres of elevated temperature with oxidation and carburization, rendering it especially fitting for applications demanding high-temperature endurance. Therefore, it is widely used in high-temperature structural components such as turbine blades and vanes [
1,
2]. However, because of the harsh conditions involving both high-temperature corrosion and wear, the part’s performance might deteriorate. Predominantly, surface wear of materials happens, and the utilization of laser cladding techniques can notably enhance the surface characteristics of the Inconel 718 alloy [
3].
Laser cladding is a direct metal deposition technology in which a layer or multiple layers of cladding material are melted and deposited onto the substrate using a laser electron beam to repair and rebuild worn parts [
4]. By melting and swiftly cooling the surface coating of the base material, a metallurgically bonded cladding layer is produced, which adheres to the substrate [
5,
6]. This method greatly enhances the surface characteristics of metals and finds extensive application in sophisticated sectors like the aerospace, chemical, and pharmaceutical industries [
7,
8,
9,
10]. However, in the process of laser cladding, factors such as the size of the laser spot, scanning method, and powder layer thickness need to be considered, as these factors can significantly impact the quality of the final cladding layer [
11,
12]. Moreover, variables like the shape and dimensions of the powder particles, nozzle configuration, and the rate of powder feed throughout the cladding procedure can impact the dispersion of particle concentration between the nozzle and the substrate [
13,
14]. It is worth noting that variations in process parameters such as laser power and scanning speed [
15,
16] and adjustments to the scanning path directly affect the distribution of melt pool temperature and workpiece surface temperature. The increased concentration of transient heat input caused by these factors may lead to thermal stresses and deformations during and after cladding. These issues directly affect samples’ quality and performance in practical applications.
Observing real-time alterations in the molten pool during conventional laser cladding experiments presents a formidable task [
17]. Therefore, it is essential to accurately understand the temperature field and gradient distribution during the cladding process [
18,
19]. Numerical simulations are employed to construct 3D models that replicate the laser cladding procedure under various processing conditions [
20]. Following this, the simulation outcomes are examined to ascertain appropriate processing variables, culminating in the execution of experiments. This approach proves advantageous in minimizing time and cost expenditures.
Currently, research on the simulation of temperature fields in electron beam cladding still needs to be completed. Yang et al. [
21] analyzed the surface temperature distribution in the Inconel 718 single-clad model on 45 steel using the finite element method, investigating the influence of different laser powers and scanning speeds on the center temperature of the melt pool. On the other hand, Gan et al. [
22] introduced a numerical model for laser cladding that simulates heat exchange, fluid movement, solidification, and multi-component mass transfer during the direct laser deposition of cobalt-based alloy onto steel. The analysis of transient heat dispersion facilitated the extraction of the solidified microstructure’s morphology. He et al. [
23] combined simulation and experimental methods to investigate the laser cladding of F102 nickel-based alloy powder on the surface of 40CrNi
2Si
2MoVA steel. Hoffman et al. [
24] simulated the configuration and blending aspects of laser cladding, offering an in-process technique for managing dilution. This method has been adopted to enhance the overall workpiece quality. However, there still needs to be more research on controlling the temperature of the NiCrBSi cladding layer on the surface of the Inconel 718 alloy and selecting reasonable process parameters.
Electron beam cladding (EBC) and laser cladding (LC) are both directed energy deposition (DED) techniques that can be used to deposit NiCrBSi on the surface of Inconel 718. Both processes involve melting a powder or wire feedstock with a high-energy beam and creating a metallurgical bond with the substrate. However, there are some differences between EBC and LC that affect the quality and performance of the cladding layer. One of the main differences is the energy source and the working environment. EBC uses a focused electron beam that operates in a vacuum chamber, while LC uses a focused laser beam that operates in an inert gas atmosphere. The vacuum environment of EBC reduces the oxidation and contamination of the molten pool, resulting in a higher purity and lower porosity of the cladding layer [
25]. The vacuum also enables a higher energy density and deeper penetration of the electron beam, which can improve the bonding strength and reduce the dilution of the substrate [
26]. However, the vacuum also increases the cooling rate and thermal gradient of the cladding layer, which can induce higher residual stresses and distortions [
27]. Another difference is the beam shape and distribution. EBC typically uses a circular or elliptical beam with a Gaussian intensity profile, while LC can use various beam shapes and profiles depending on the type of laser source. For example, solid-state lasers can produce rectangular or square beams with uniform or top-hat intensity profiles. The beam shape and profile can affect the geometry and uniformity of the cladding layer, as well as the heat input and melt pool dynamics. A rectangular or square beam can produce a wider and flatter cladding layer than a circular or elliptical beam, which can improve the surface quality and reduce the number of passes required. A uniform or top-hat intensity profile can also produce a more stable and symmetrical melt pool than a Gaussian profile, which can reduce the spatter and porosity of the cladding layer. Therefore, EBC and LC have different advantages and disadvantages for depositing NiCrBSi on Inconel 718. EBC can produce a higher quality cladding layer in terms of purity, porosity, bonding strength, and dilution, but it also requires a vacuum chamber and may cause higher residual stresses and distortions. LC can produce a better surface quality and geometry of the cladding layer, but it may also cause more oxidation, contamination, spatter, and porosity.
The objective of this research is to develop a 3D model for exploring how temperature is distributed within cladding layers using diverse process parameters. A sophisticated double-ellipsoid heat source for welding was devised for this purpose. A temperature-field numerical simulation of electron beam cladding of NiCrBSi powder on the surface of Inconel 718 was performed using ABAQUS. The simulation obtained reasonable processing parameters for laser cladding of NiCrBSi coating. The established 3D model was used to analyze the temperature distribution of the melt pool during single-track cladding under different process parameters. The temperature field distribution patterns of the model were analyzed using a temperature selection judging mechanism under foreign laser powers and scanning speeds.
2. Methods
Currently, commonly used electron beam heat source models include the Gaussian heat source model, the dual ellipsoid heat source model, and the conical heat source model. The outstanding feature of the conical heat source model is that its diameter decreases linearly in the longitudinal direction of the model. Any cross-section of the heat source has the distribution characteristics of a Gaussian heat source, and it can be approximately considered a rotating body heat source model with a diameter that attenuates in a specific regular pattern with the depth of heat flow [
28]. This heat source model has a sizeable depth-to-width ratio and intense penetration and is generally used for the welding simulation of deep holes or medium-thick plates.
Figure 1 shows a schematic diagram of the conical heat source model. Its shape is conical, with a larger radius on the upper surface and a smaller radius on the lower surface. The cross-sections of the model at various positions on the Z-axis are all circles, and the heat flux density values at different places on the Z-axis are the same. The expression for the conical heat source model is as follows:
In the formula:
Here, is the volumetric heat flux, is the net heat flow, is the energy of the electron beam, is the efficiency value, is the radius function with respect to and , is the thermal distribution coefficient with respect to depth , and are the maximum and minimum radii, while and are the maximum and minimum values in the axial direction.
The choice of heat source model depends on various factors, such as the shape of the molten pool, the heat transfer zone, and the electron beam simulation process. Since this study focuses on vacuum electron beam welding, its penetrability is extremely strong. In this state, the finite element analysis of the molten pool often uses either a conical heat source model or a dual ellipsoid model. The conical heat source model can better simulate the energy distribution of the electron beam inside the powder layer, reflecting the scattering and absorption effects of the electron beam and thus more accurately calculating the depth distribution of the temperature field. This is significant for studying phase transformation, stress, cracks, and other phenomena in the electron beam cladding process. The accuracy of the conical heat source model is also relatively high, and it can be validated and compared with experimental data or other theoretical models. Compared with the dual ellipsoid heat source model and the Gaussian heat source model, the conical heat source model exhibits higher consistency and stability in calculating the temperature field of electron beam cladding. Therefore, this study adopts the conical heat source model.
4. Results and Discussion
The quality of electron beam surface cladding modification mainly depends on the degree of bonding between the cladding layer and the substrate. Given the selected coating powder and substrate, the parameter settings of the electron beam have the most significant impact during the cladding process. Through repeated practice, we have found that the parameters with the most considerable influence are the scan speed of the electron gun and the beam current. These two factors have a substantial impact on the temperature field’s variation. At the same time, the degree of bonding between the cladding layer and the substrate largely depends on the interpretation of the molten pool temperature field [
31]. Therefore, it is necessary to explore the effects of different scan speeds and beam currents on the molten pool temperature field to find the optimal parameters.
4.1. The Influence of Different Beam Distributions on the Temperature Field Distribution
When investigating the impact of various beam currents on the temperature distribution, the parameter scope was refined based on insights from the existing literature. Considering the equipment situation and experience, four different beam currents of 15 mA, 18 mA, 21 mA, and 24 mA were selected to investigate beam variation’s effect on the cladding’s quality. To ensure the accuracy of the experimental results, this simulation used the method of controlling variables to keep the other parameters outside the beam unchanged. The simulation parameters are shown in
Table 2.
By using ABAQUS finite element simulation software and linking the Dflux.for subroutine, the conical heat source model is loaded onto the surface of the fusion layer finite element mesh segmentation. Taking the coordinate point (0, 12, 10) as the starting point of the electron beam, the electron beam was scanned along the positive x-axis for cladding. A distinct cladding trace, called the clad track, was formed where the electron beam was scanned. The analysis focused on temperature distribution maps of the molten pool under varying beam currents at t = 6.25 s, as depicted in
Figure 6.
From
Figure 6, it can be seen that as the beam current increases, the peak temperature of the workpiece surface also increases, indicating a positive correlation between the beam current and the temperature of the molten pool. At 15 mA, the temperature field diagram (depicted in
Figure 6a) illustrates a maximum temperature of 4274 K within the molten pool, forming a molten pool on the surface of the overlay layer. The lowest temperature of the isotherm in the heat-affected zone is 1287 K. The temperature distribution map of the melted pool at 18 mA is displayed in
Figure 6b, indicating a maximum temperature of 5087 K, forming a molten pool on the surface of the overlay layer. The lowest temperature of the isotherm in the heat-affected zone is 1409 K. In
Figure 6c, the temperature mapping within the molten pool at 21 mA reveals a maximum temperature reaching 5667 K, forming a molten pool on the surface of the overlay layer. The lowest temperature of the isotherm in the heat-affected zone is 1635 K. The temperature distribution within the molten pool when the beam current is set at 24 mA is depicted in
Figure 6d, highlighting a peak temperature of 6522 K, forming a molten pool on the surface of the overlay layer. The lowest temperature of the isotherm in the heat-affected zone is 1848 K. When the beam current is increased by three mA, the peak temperature increases by 813 K, and the lowest temperature in the heat-affected zone increases by 122 K. When the beam current is increased by six mA, the peak temperature increases by 1393 K, and the lowest temperature in the heat-affected zone rises by 348 K. When the beam current is increased by nine mA, the peak temperature increases by 2248 K, and the lowest temperature in the heat-affected zone increases by 561 K. The reason for this is that when the electron beam’s beam current increases, the electron beam’s power also increases, leading to an increase in heat flux density. This directly increases the temperature of the molten pool. With the rise of the beam current, the high temperature causes more intense reactions between the elements in the overlay layer, and the conversion rate from the solid phase to the liquid phase also increases, resulting in a denser microstructure. However, if the beam current of the electron beam is too large, the temperature in the molten pool region becomes too high. The dilution rate of NiCrBSi powder will be increased, causing the electron beam to load directly onto the substrate, leading to a decrease in the thickness of the bond layer and severe deformation of the entire overlayed sample. If the beam current of the electron beam is too small, the temperature in the molten pool is too low. The surface material of the substrate cannot fully dissolve in the NiCrBSi powder, failing to form a metallurgical bond between the powder and the substrate. The powder will melt into spherical material and fall directly off.
Since the conduction and variation of the junction temperature are directly related to the bonding quality between powder and substrate, a node set is established between the matrix and powder coating in ABAQUS, with the coordinates of the nodes as (8, 12, 9). The temperature of the junction area is then extracted for analysis, as shown in
Figure 7.
Figure 8 shows the temperature variation curve of the surface layer for different beam currents with the node coordinates of (8, 12, 10). When the beam current is 15 mA, the surface temperature reaches 3300 K, which is above the melting point of the powder NiCrBSi (1323 K). The temperature between the substrate and the overlay is approximately 1300 K, whereas the melting point of the substrate is around 1500 K. The optimal process parameters for electron beam cladding are the powder melting while the substrate is partially melted. When the beam current is 15 mA, excluding the influence of errors, the junction area is closer to the melting point of the substrate. This indicates that only a thin layer of overlay is formed on the surface of the substrate, with a good surface roughness but low bonding strength, making it not the best process parameter. When the beam current is 18 mA, the peak temperature of the surface layer is around 4200 K, and the NiCrBSi powder is completely melted into a liquid phase. The temperature of the junction area between the substrate and powder is around 1500 K, reaching the melting point temperature of the Inconel 718 substrate. The substrate surface undergoes a solid-to-liquid phase transition. This represents the best process condition, where the powder is melted while the substrate is partially melted. At this point, the metallurgical bonding layer formed by the powder and substrate is denser, and the temperature gradient distribution is reasonable. When the beam current is 21 mA, the surface temperature reaches 4700 K, but the temperature of the junction area is around 1690 K. Although the NiCrBSi powder is completely melted, the junction temperature exceeds the melting point of the Inconel 718 substrate. This will cause overheating of the substrate and excessive dilution of the powder, resulting in poor comprehensive mechanical properties of the cladding layer. It will also cause a deeper surface melt pool, which is considered to be overheating and not an ideal parameter. When the beam current is 24 mA, the temperature of the junction area reaches 1800 K, far higher than the melting point of the substrate. At this point, the workpiece is severely overheated. In summary, the temperature gradient distribution is more reasonable for the electron beam current of 18 mA.
When the beam current is 21 mA, the surface temperature reaches 4700 K, but the temperature in the binding zone only reaches around 1690 K. Although the NiCrBSi powder is completely melted, the high temperature in the critical area exceeds the melting point of the Inconel 718 substrate. This will lead to overheating of the substrate and excessive dilution of the powder, resulting in poor overall mechanical properties of the cladding layer. It will also cause deep surface melting, which is considered overheating and not an ideal parameter. When the beam current is 24 mA, the temperature in the binding zone reaches 1800 K, far exceeding the melting point of the substrate. At this point, the workpiece is severely overheated. In summary, the temperature gradient distribution is reasonable when the beam current of the electron beam is 18 mA.
4.2. The Influence of Different Scanning Speeds on the Temperature Field
When an electron beam is used for energy scanning, the scanning speed directly affects the aggregation of thermal energy, the absorption rate of thermal energy, and the rate of thermal energy loss. These factors directly impact the degree of the powder and substrate bonding. Therefore, the scanning speed is essential for the quality of fusion in the temperature field. In this simulation, other variables will be controlled while maintaining a beam current of 18 mA to explore and optimize the scanning speed. The simulation parameters are shown in
Table 3.
Figure 9 shows the temperature field cloud map of the molten pool at the moment when the electron beam is scanned at different scanning speeds for t = 6.25 s. It can be observed from the figure that as the scanning speed increases, the peak temperature in the molten pool decreases continuously. This indicates that a faster scanning speed results in a shorter time for the energy to stay on the surface of the cladding, thus reducing the heat absorbed by the workpiece. When the scanning speed is 180 mm/min and the beam current is 18 mA, the peak temperature in the molten pool is 6677 K, and the lowest temperature in the heat-affected zone is 1887 K. As the scanning speed escalates to 240 mm/min, the peak temperature decreases by 1145 K, reaching 5532 K.
Further increasing the scanning speed to 300 mm/min, the peak temperature in the molten pool drops to 5144 K. When the scanning speed is 360 mm/min, the peak temperature in the molten pool decreases to 4014 K. The reason for this is that as the scanning speed of the electron beam increases, the heating time of each microelement in the finite element decreases, resulting in a decrease in the peak temperature in the molten pool. Excessive temperatures can cause the grains in the cladding area to grow too large, which is undesirable.
On the other hand, an appropriate scanning speed can accelerate the cooling rate of the area irradiated by the electron beam, resulting in a delicate and uniform microstructure in the cladding region. In terms of the quality of the cladding surface produced by the electron beam, further research is needed on the node temperature in the joint area to achieve powder melting and microfusion of the substrate. This can ensure parameter optimization and improve the comprehensive performance of the cladding while preserving the excellent properties of the original material.
Extracting the nodal coordinates (8, 12, 9) between the matrix and the powder from ABAQUS, the changing curve of the pool temperature at different time points is analyzed, as shown in
Figure 10.
Figure 11 shows the temperature variation curve of the material surface at coordinate points (8, 12, 10) at different time points. From the figure, it can be observed that when the scanning speed is 180 mm/min, the peak temperature of the pool reaches 5700 K, and the powder is completely melted into the liquid phase. The temperature in the joining zone reaches as high as 2300 K. This value significantly surpasses the matrix’s melting point of 1533 K. This indicates that while the powder is melting, the matrix is also rapidly melting. This is considered overeating, leading to powder dilution and decreased bonding performance. At the same time, extensive melting of the matrix will result in a decrease in its own performance and severe surface deformation. When the scanning speed reaches 240 mm/min, the joining zone temperature reaches 1700 K, which is still above the melting point of the matrix, indicating over-melting. When the scanning speed is 300 mm/min, the joining zone temperature is around 1500 K, and the peak temperature on the surface is 4200 K. At this point, the matrix undergoes partial melting while the powder is fully melted. The liquid phase of the fully melted powder and the surface of the matrix form a closely bonded metallurgical layer, achieving a good overlay process. When the scanning speed is 360 mm/min, the joining zone temperature is only 1300 K. At this time, the overlay layer is shallow, the joining zone is not compact, and there is only a thin layer, indicating under-melting.
4.3. Temperature Field Cloud Maps at Different Moments in the Process of Fusion Coating
Figure 12 shows the temperature field overlay map of the molten pool scanned at different time points under the optimal process parameters of 18 mA and 300 mm/min with different beam currents and velocities. From
Figure 12, it can be observed that at t = 0.384 s, the electron beam heat source just started to bombard the surface of the cladding layer, and the peak temperature at the center reached 2836 K. As the heat source moves forward, at t = 1.460 s, the highest temperature of the beam spot in the molten pool reaches 4845 K. This is because the preceding heat source had a preheating effect on the surface of the cladding layer, and the center of the workpiece has slower heat dissipation, resulting in temperature concentration. At t = 3.190 s and t = 4.921 s, the peak temperature of the beam spot in the molten pool hovers around 5100 K, and the temperature change in the molten pool tends to be relatively stable, indicating the best welding quality at this time. While the electron beam heat source moves, the workpiece undergoes rapid heating and rapid cooling. The surface temperature drops rapidly as the heat source moves away, and the trajectory of the cladding resembles a comet with a long tail. Heat is conducted in different directions within the substrate, and the powder and substrate undergo fusion and solidification. Ultimately, the surface of the substrate undergoes the formation of a compact cladding layer, successfully attaining the intended enhancement outcome.
4.4. Experimental Verification
Figure 13 depicts the macroscopic surface morphology of Inconel 718, which has been electron beam surface-clad with NiCrBSi powder. The process parameters used are outlined in
Table 2. The illustration indicates that at lower electron beam currents, the energy is insufficient to achieve immediate coating melting. Consequently, due to the brittle nature of the layer and uneven heating, the coating easily detaches from the substrate’s surface. Increasing the scanning beam current leads to a gradual widening of the melting zone and a decrease in the roughness of the cladding sample surface. This is because higher electron beam currents result in increased energy and temperature, leading to a broader range of heat conduction.
Figure 13 reveals the presence of numerous fine particles at the edge of the sample’s melting zone. This is due to the high temperature, which leads to the decomposition of CO
2 in the molten pool: CO
2 → CO + O. The expansion of CO under high temperatures results in a rapid increase in pressure. The molten pool inhibits its escape, leading to a local explosion and the splattering of metal particles.
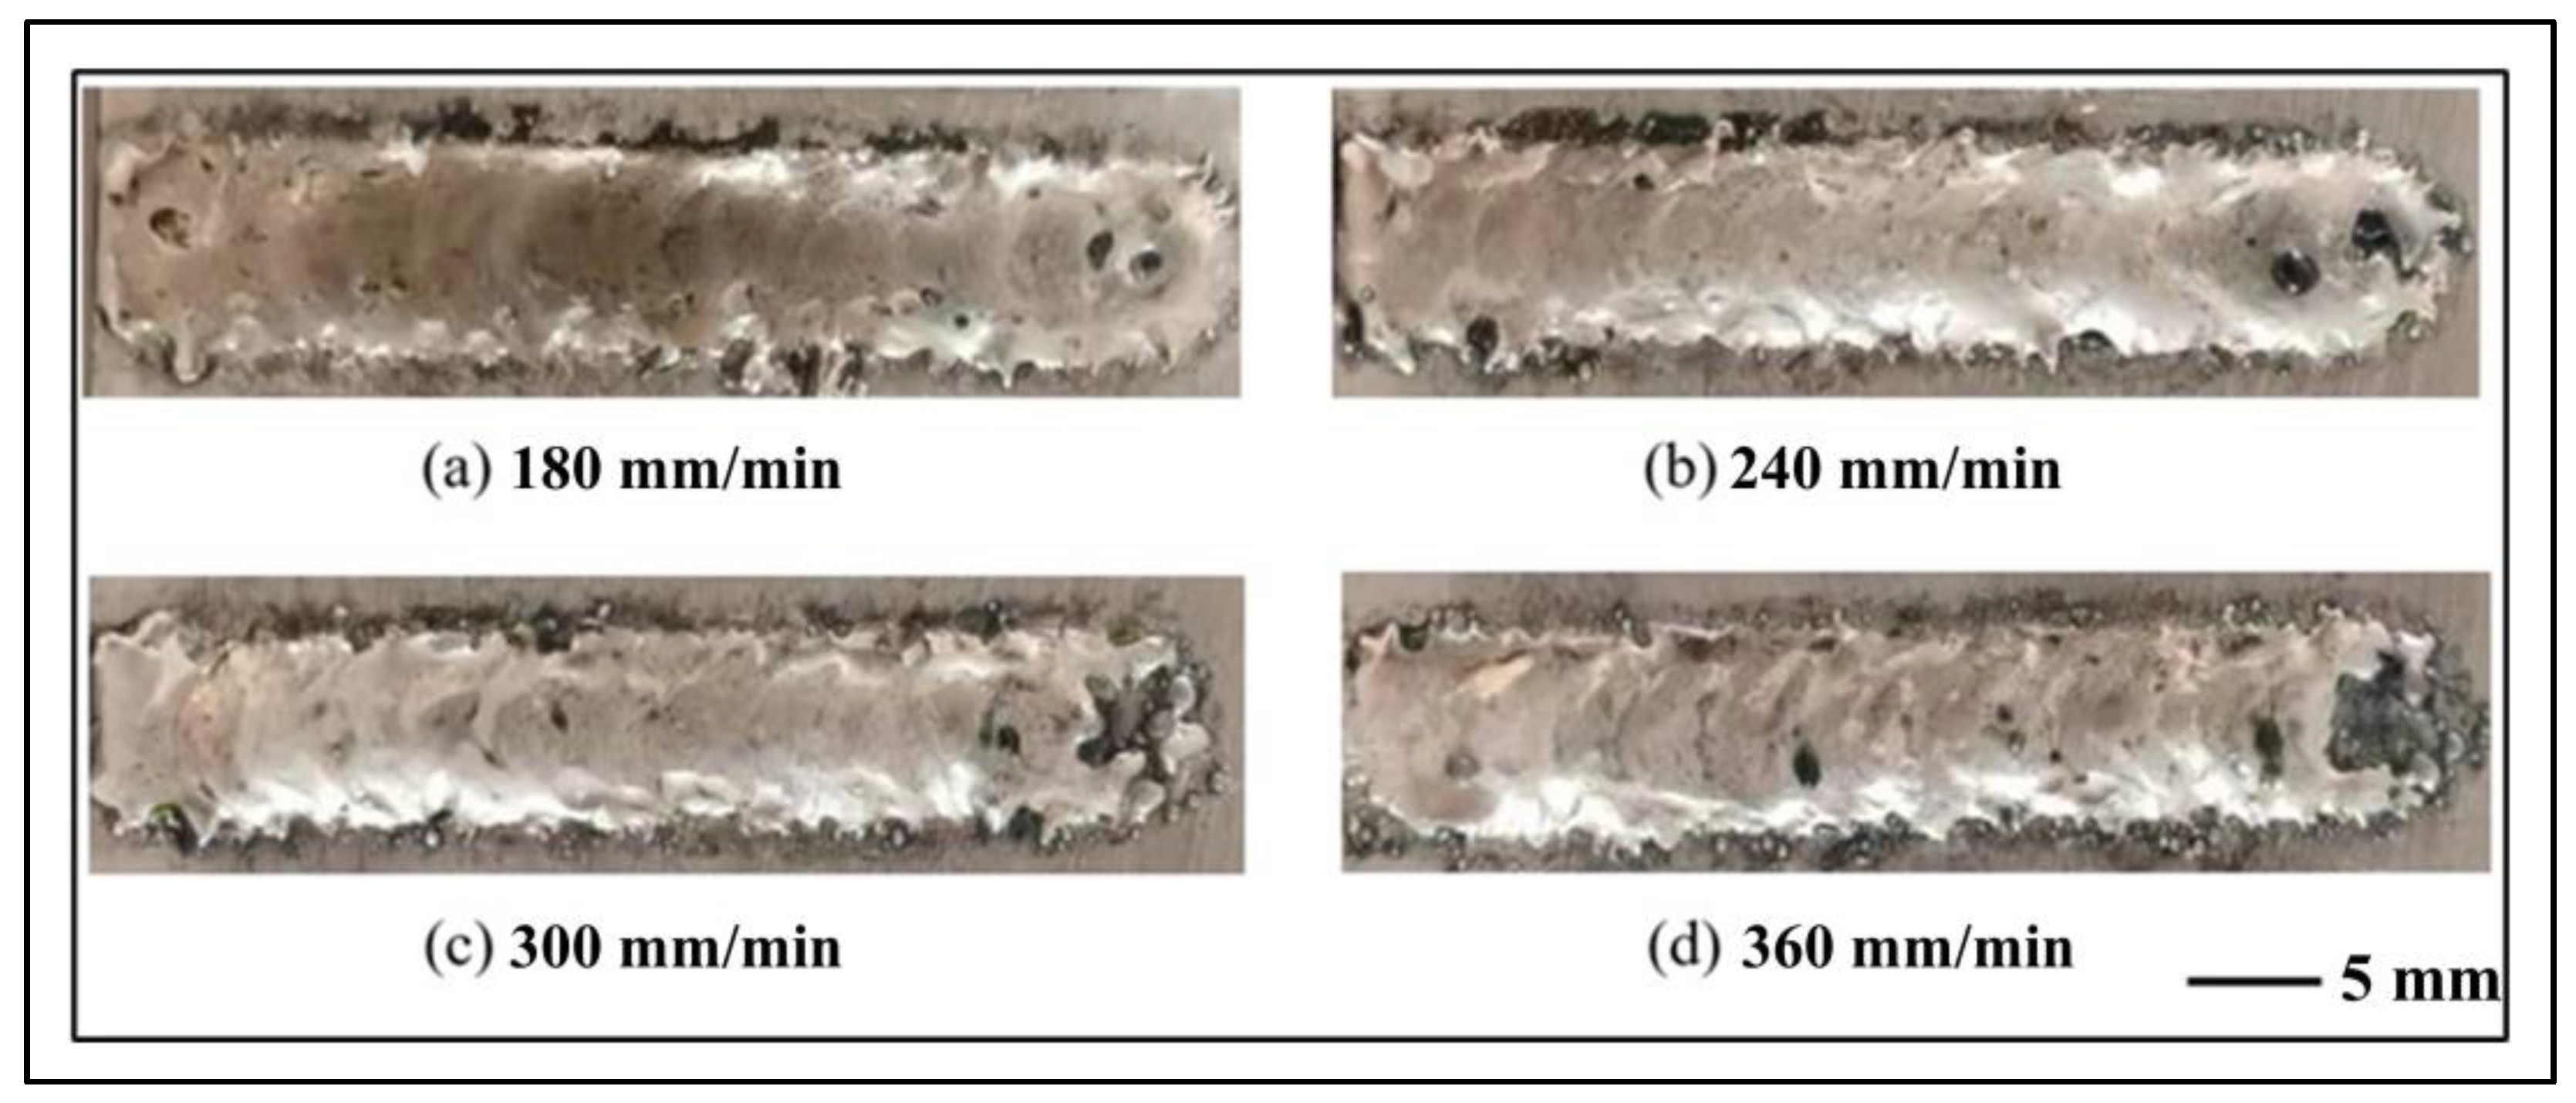
Figure 14 presents the macroscopic surface morphology of Inconel 718, which has been surface-clad with NiCrBSi powder using various scanning speeds, as documented in
Table 3. The figure reveals that, with the beam current held constant, the scanning speed increase results in a narrower melting zone. This occurs when the scanning speed is low, as the prolonged exposure of the electron beam energy on the plate’s surface leads to an increased accumulation of power. Consequently, this causes excessive remelting of material and ultimately widens the melting zone.
Energy spectrum analysis was conducted on the sub-surface of the overlay region to enhance the understanding of the bonding strength between the substrate and overlay powder.
Figure 15 presents the cross-sectional morphology of the electron beam overlay layer and the line scan image captured at a beam current of 18 mA and a scan speed of 300 mm/min. The left side depicts the substrate region, whereas the right side illustrates the overlay region. In
Figure 15a, with a beam current of 18 mA, there is a notable increase in the concentration of hard particles in the overlay region compared to the substrate. The corresponding EDS line data reveals that silicon (Si) has the highest content in the overlay region, indicating the excellent performance of the NiCrBSi powder process for electron beam surface overlay of Inconel 718 at a beam current of 18 mA.
Figure 15b demonstrates an SEM image at a scan speed of 300 mm/min, revealing a narrow and well-bonded interface region that suggests the formation of an exceptional metallurgical bonding layer. The overlay region still exhibits the highest silicon element content based on the corresponding EDS line data, indicating positive overlay effects in the 300 mm/min process. Because Inconel 718 has a relatively soft nature, the enhanced silicon content in the metallurgical bonding layer can significantly improve the overall performance of the material.
The experimental comparisons above demonstrate that the most effective overlay, characterized by a highly dense layer with strong bonding to the substrate, is achieved when using an electron beam current of 18 mA and a scan speed of 300 mm/min. The interface exhibits no visible pores or cracks. A wavy boundary between the overlay layer and the substrate suggests a favorable metallurgical bonding between the two. The simulated temperature field analysis corroborates these findings, thus validating the reliability and accuracy of the simulation.
5. Conclusions
This study established an electron beam cladding model using ABAQUS finite element simulation software. The heat source subroutine Dflux.for was used to simulate the conical heat source. Different size grids were used to divide the substrate and cladding powder, and the double ellipsoidal heat source was loaded onto the grid model according to the electron beam scanning path for simulation. The key issues affecting cladding quality, namely the density of the bonding layer and the dilution rate of the powder, were analyzed. Temperature field contour maps and temperature variation curves of the surface molten pool and bonding zone nodes were established. The main conclusions are as follows:
(1) According to the simulation results, during the electron beam scanning heating process, the surface temperature of the sample rapidly increased above the material’s melting point. The center temperature of the electron beam focus was much higher than the average temperature of the molten pool, reaching a maximum of over 5000 K. When controlling other parameters, the electron beam current and molten pool temperature were positively correlated, while the scanning speed and molten pool temperature were negatively correlated.
(2) During the electron beam cladding process, the molten pool temperature changed dramatically. The temperature in the area irradiated by the electron beam heat source increased rapidly, while the temperature rapidly decreased in the area where the electron beam heat source left. The cladding process can be divided into three stages: the heating and melting stage, the temperature stabilization stage, and the cooling and solidification stage. In the direction of cladding thickness, the temperature decrease rate becomes faster as it goes down.
(3) When the electron beam scanning current was 18 mA and the scanning speed was 300 mm/min, the peak temperature of the molten pool in the cladding zone was around 5087 K, and the lowest temperature of the isotherm line in the heat-affected zone was 1409 K. The temperature of the bonding zone nodes between the substrate and powder was around 1500 K, reaching the melting point of Inconel 718 material. At this point, the NiCrBSi powder was completely melted, and the substrate was slightly dissolved, indicating relatively ideal electron beam cladding process parameters.
(4) According to the morphology and energy spectrum analysis of the electron microscopy, the cladding layer was dense, crack-free, and tightly connected to the substrate. The wave shape of the analysis was consistent with the temperature field, verifying the reliability and accuracy of the simulation.


