Article

Assessment of the Interatomic Potentials of Beryllium for Mechanical Properties

1
Department of Physics, Beijing Normal University, Beijing 100875, China
2
College of Nuclear Science and Technology, Beijing Normal University, Beijing 100875, China
3
School of Materials Science and Engineering, Northeastern University, Shenyang 110819, China
4
State Key Laboratory of Nonlinear Mechanics, Institute of Mechanics, Chinese Academy of Sciences, Beijing 100190, China
5
School of Engineering Sciences, University of Chinese Academy of Sciences, Beijing 100049, China
6
Physics Department, King Fahd University of Petroleum & Minerals, Dhahran 31261, Saudi Arabia
*
Authors to whom correspondence should be addressed.
Crystals 2023, 13(9), 1330; https://doi.org/10.3390/cryst13091330
Submission received: 17 August 2023 / Revised: 29 August 2023 / Accepted: 29 August 2023 / Published: 30 August 2023
(This article belongs to the Special Issue Crystallization of High Performance Metallic Materials)

Abstract

:
Beryllium finds widespread applications in nuclear energy, where it is required to service under extreme conditions, including high-dose and high-dose rate radiation with constant bombardments of energetic particles leading to various kinds of defects. Though it is generally known that defects give rise to mechanical degradation, the quantitative relationship between the microstructure and the corresponding mechanical properties remains elusive. Here we have investigated the mechanical properties of imperfect hexagonal close-packed (HCP) beryllium via means of molecular dynamics simulations. We have examined the beryllium crystals with void, a common defect under in-service conditions. We have assessed three types of potentials, including MEAM, Finnis–Sinclair, and Tersoff. The volumetric change with pressure based on MEAM and Tersoff and the volumetric change with temperature based on MEAM are consistent with the experiment. Through cross-comparison on the results from performing hydrostatic compression, heating, and uniaxial tension, the MEAM type potential is found to deliver the most reasonable predictions on the targeted properties. Our atomistic insights might be helpful in atomistic modeling and materials design of beryllium for nuclear energy.

1. Introduction

Thanks to its unique properties, including high specific strength, low density, high melting point, and particularly low neutron absorption and high neutron scattering cross sections [1], beryllium finds widespread applications in nuclear energy. For instance, beryllium is the top candidate for the first wall that directly faces the plasma in the ITER [2,3] and for neutron multiplier in the DEMO tokamak fusion reactors [4]; beryllium is also commonly employed as the moderator and reflector for fission reactor and spallation neutron sources [5,6]; finally, beryllium is broadly used as the convertor to yield neutrons via (p, n) reaction in the compact accelerator-based neutron sources that serve Boron Neutron Capture Therapy (BNCT) [7,8].
In these applications, beryllium is often required to function under extreme environments, including astonishingly high temperatures and pressure, and frequent energetic particle bombardments. For example, as a first-wall material for the tokamak fusion reactor, beryllium needs to withstand temperatures and pressures as high as 1500 K and 2 GPa [3], respectively. In compact accelerator-based neutron sources, beryllium constantly suffers from impingements of 1~10 MeV protons, leading to not only dramatic thermal gradient and stress, but also significant radiation damage. The mechanical integrity of beryllium under extreme environments is thus essential to support these critical applications.
There have been a handful of studies that conducted mechanical tests on beryllium since the late 1960s. It has been known that radiation damage generally leads to mechanical degradation [9,10]. The quantitative relationship between microstructure resulted from serving under extreme environments and mechanical performance is important in safety issues and materials design but remains to be uncovered. Beryllium is highly toxic, and its supplies are very limited. As a result, the numerical investigations are more feasible. Moreover, in parallel to experiments, numerical methods and simulations have been well established as the third pillar in science and engineering investigations [11,12]. Among the numerous numerical methods, the molecular dynamics simulations method has been developed to be a reliable and indispensable tool in atomistic scale in various investigations [13,14].
The interatomic potential is the key in molecular dynamics simulations. An accurate interatomic potential is a prerequisite for molecular dynamics simulations to produce reliable and material-specific results. To this end, there are first-principles quantum mechanical [15] and various kinds of interatomic potentials developed for beryllium, such as EAM [16,17], AMEAM [18], MEAM [19], Finnis–Sinclair [20], and Tersoff [21]. Nonetheless, which potential is more suitable to simulate beryllium under extreme environments encountered in the applications listed above is still open to question. Hence, in this paper, we select three representative types of potentials and cross-compare their predictions on the mechanical properties of beryllium crystals embedded with spherical void defects, which are commonly observed in beryllium due to energetic particle bombardments. Through cross-comparisons on the simulation predictions, we point out that the MEAM type potential is the most reliable one out of three chosen potentials.

2. Materials and Methods

We have performed molecular dynamics simulations using the LAMMPS software (LAMMPS 64-bit 24 March 2022) [22] developed by the Sandia National Laboratory, because it is free, open-source, and equipped with a variety of choices of interatomic potentials, which considerably facilitates their implementations and thus, the cross-comparison. We chose three types of potentials that were previously parameterized for beryllium as detailed below.

2.1. MEAM Type Potential

The total interatomic energy E for MEAM type potential is expressed as below, all equations presented below come from [19,23,24,25],
E = i 1 2 i j ϕ ( r i j ) + F [ ρ i ¯ ]
where ϕ accounts for contribution from direct interaction between atoms i and j explicitly depending only on their distance rij, and F is the embedding function, whose input is the average electron density ρ ¯ at the position of atom i. The definition of ϕ is shown below,
ϕ r = 2 Z f C r c u t r δ E u r F ρ 0 ¯ r
The first term Z equals 12 for the reference structure, a hexagonal close-packed structure (HCP) for beryllium. The second term f C ( r c u t r δ ) is the smooth cutoff function and takes the following expression,
f C ( x ) = 1 x 1 [ 1 ( 1 x ) 4 ] 2 0 < x < 1 0 x 0
with
x = r c u t r δ
where rcut is the cutoff distance, and δ gives the cutoff region. Note that rcut and δ are both tunable parameters. The third term E u ( r ) is the energy of the reference structure and takes the following expression,
E u ( r ) = E c ( 1 + a ) e a
with
a = α ( r r e 1 )
where E c , r e , and α are adjustable parameters.
Finally, the last term F from Equations (1) and (2) is the embedding function taking the following expression,
F ( ρ ¯ ) = A E c ρ ¯ ρ 0 l n ρ ¯ ρ 0 f C ( r c u t r δ )
where A is another adjustable parameter, and ρ 0 is equal to 12 for an HCP structure. On one hand, in Equation (2),
ρ ¯ = ρ 0 ¯ ( r ) = Z ρ a ( 0 ) ( r )
where ρ a ( 0 ) is given in Equation (15). On the other hand, in Equation (1),
ρ ¯ = ρ ( 0 ) G ( Γ )
with
G ( Γ ) = e Γ 2
and
Γ = h = 1 3 t ( h ) ( ρ i ( h ) ρ i ( 0 ) ) 2
where t ( h ) are tunable parameters. The spherically symmetric partial electron density at the position of atom i is written below,
[ ρ i ( 0 ) ] 2 = [ i j S i j ρ j a ( 0 ) ( r i j ) ] 2
Moreover, the counterparts characterizing angular contributions are given by similar formulas but weighted by the Cartesian projections of the distances between two involved atoms (denoted by superscripts u, v, and w) as follows,
[ ρ i ( 1 ) ] 2 = u i j S i j ρ j a ( 1 ) ( r i j ) r i j u r i j
[ ρ i ( 2 ) ] 2 = u , v [ i j S i j ρ j a ( 2 ) ( r i j ) r i j u r i j v r i j 2 ] 2 1 3 i j [ S i j ρ j a ( 2 ) ( r i j ) ] 2
[ ρ i ( 3 ) ] 2 = u , v , w [ i j S i j ρ j a ( 3 ) ( r i j ) r i j u r i j v r i j w r i j 3 ] 2 3 5 u [ i j S i j ρ j a ( 3 ) ( r i j ) r i j u r i j ] 2
Furthermore,
ρ a ( h ) ( r ) = e β h ( r r e 1 )
where the decay lengths β h are tunable parameters. The S i j is a many-body screening function that quantifies the screening effect between two atoms i and j due to other atoms k in the system, and is defined as following,
S i j = k i , j f c [ C C m i n C m a x C m i n ]
where C m a x and C m i n are the upper and lower bounds of C. In addition,
C = 2 ( X i k + X k j ) ( X i k X k j ) 2 1 1 ( X i k X k j ) 2
where X i k = ( r i k r i j ) 2 and X k j = ( r k j r i j ) 2 .
The summary of the MEAM type potential parameterized for beryllium developed in ref. [26] is shown in Table S1 in Supplementary Information.

2.2. Tersoff Potential

The total interatomic energy for the Tersoff type potential is listed below; all equations presented below come from [21,27],
E = 1 2 i j i f C ( r i j ) [ f R ( r i j ) + b i j f A ( r i j ) ]
where rij denotes the distance r between atoms i and j. fc is the sinusoidal cut-off function that takes the following expression,
f C ( r ) = 1   r < R D 1 2 1 2 sin ( π 2 r R D ) R D < r < R + D 0 r > R + D
where R and D are tunable parameters. In addition, fR(r) and fA(r) correspond to the repulsive and attractive components, respectively, and are shown below,
f R ( r ) = A e λ 1 r
f A ( r ) = B e λ 2 r
where A, B, λ1, and λ2 are adjustable parameters. Lastly, bij encodes an angular contribution that is written below,
b i j = ( 1 + β n ζ i j n ) 1 2 n
ζ i j = k i , j f C ( r i k ) g [ θ ( r i j , r i k ) ] e λ 3 m ( r i j r i k ) m
g ( θ ) = γ ( 1 + c 2 d 2 c 2 [ d 2 + ( cos θ cos θ 0 ) 2 ] )
where θ ( r i j , r i k ) represents the angle formed between atoms i, j, and k; n, β, m, λ3, c, d, γ, and cosθ0 are the free parameters determined from fitting. The summary of the Tersoff type potential parameterized for beryllium developed in ref. [27] is shown in Table S2 in Supplementary Information.

2.3. Finnis–Sinclair Type Potential

Finnis–Sinclair type potential belongs to the embedded-atom method (EAM) potential. The total interatomic energy for the Finnis–Sinclair type potential can be written as follows, all equations presented below come from [20,28,29],
E = 1 2 i , j V ( r i j ) i f ( ρ i )
where V(rij) accounts for the direct interaction between two atoms i and j depending on their separation rij, and f(ρi) accounts for the many-body effect as shown below,
f ( ρ ) = ρ ( 1 + A ρ )
where A is an adjustable parameter, and
ρ i = j Φ ( r i j )
The V(r) and Φ(r) are cubic splines with the following expressions,
V r = k = 1 n A k ( r a k r ) 3 H ( r a k r )
Φ ( r ) = k = 1 m B k ( r b k r ) 3 H ( r b k r )
where H(x) is the Heavyside step function that equals 1 when x is greater than 0 and 0 otherwise. The n, m, Ak, rak, B, and rbk are tunable parameters. The summary of the parameters for the Finnis–Sinclair type potential developed for beryllium [29] is listed in Table S3 in Supplementary Information.

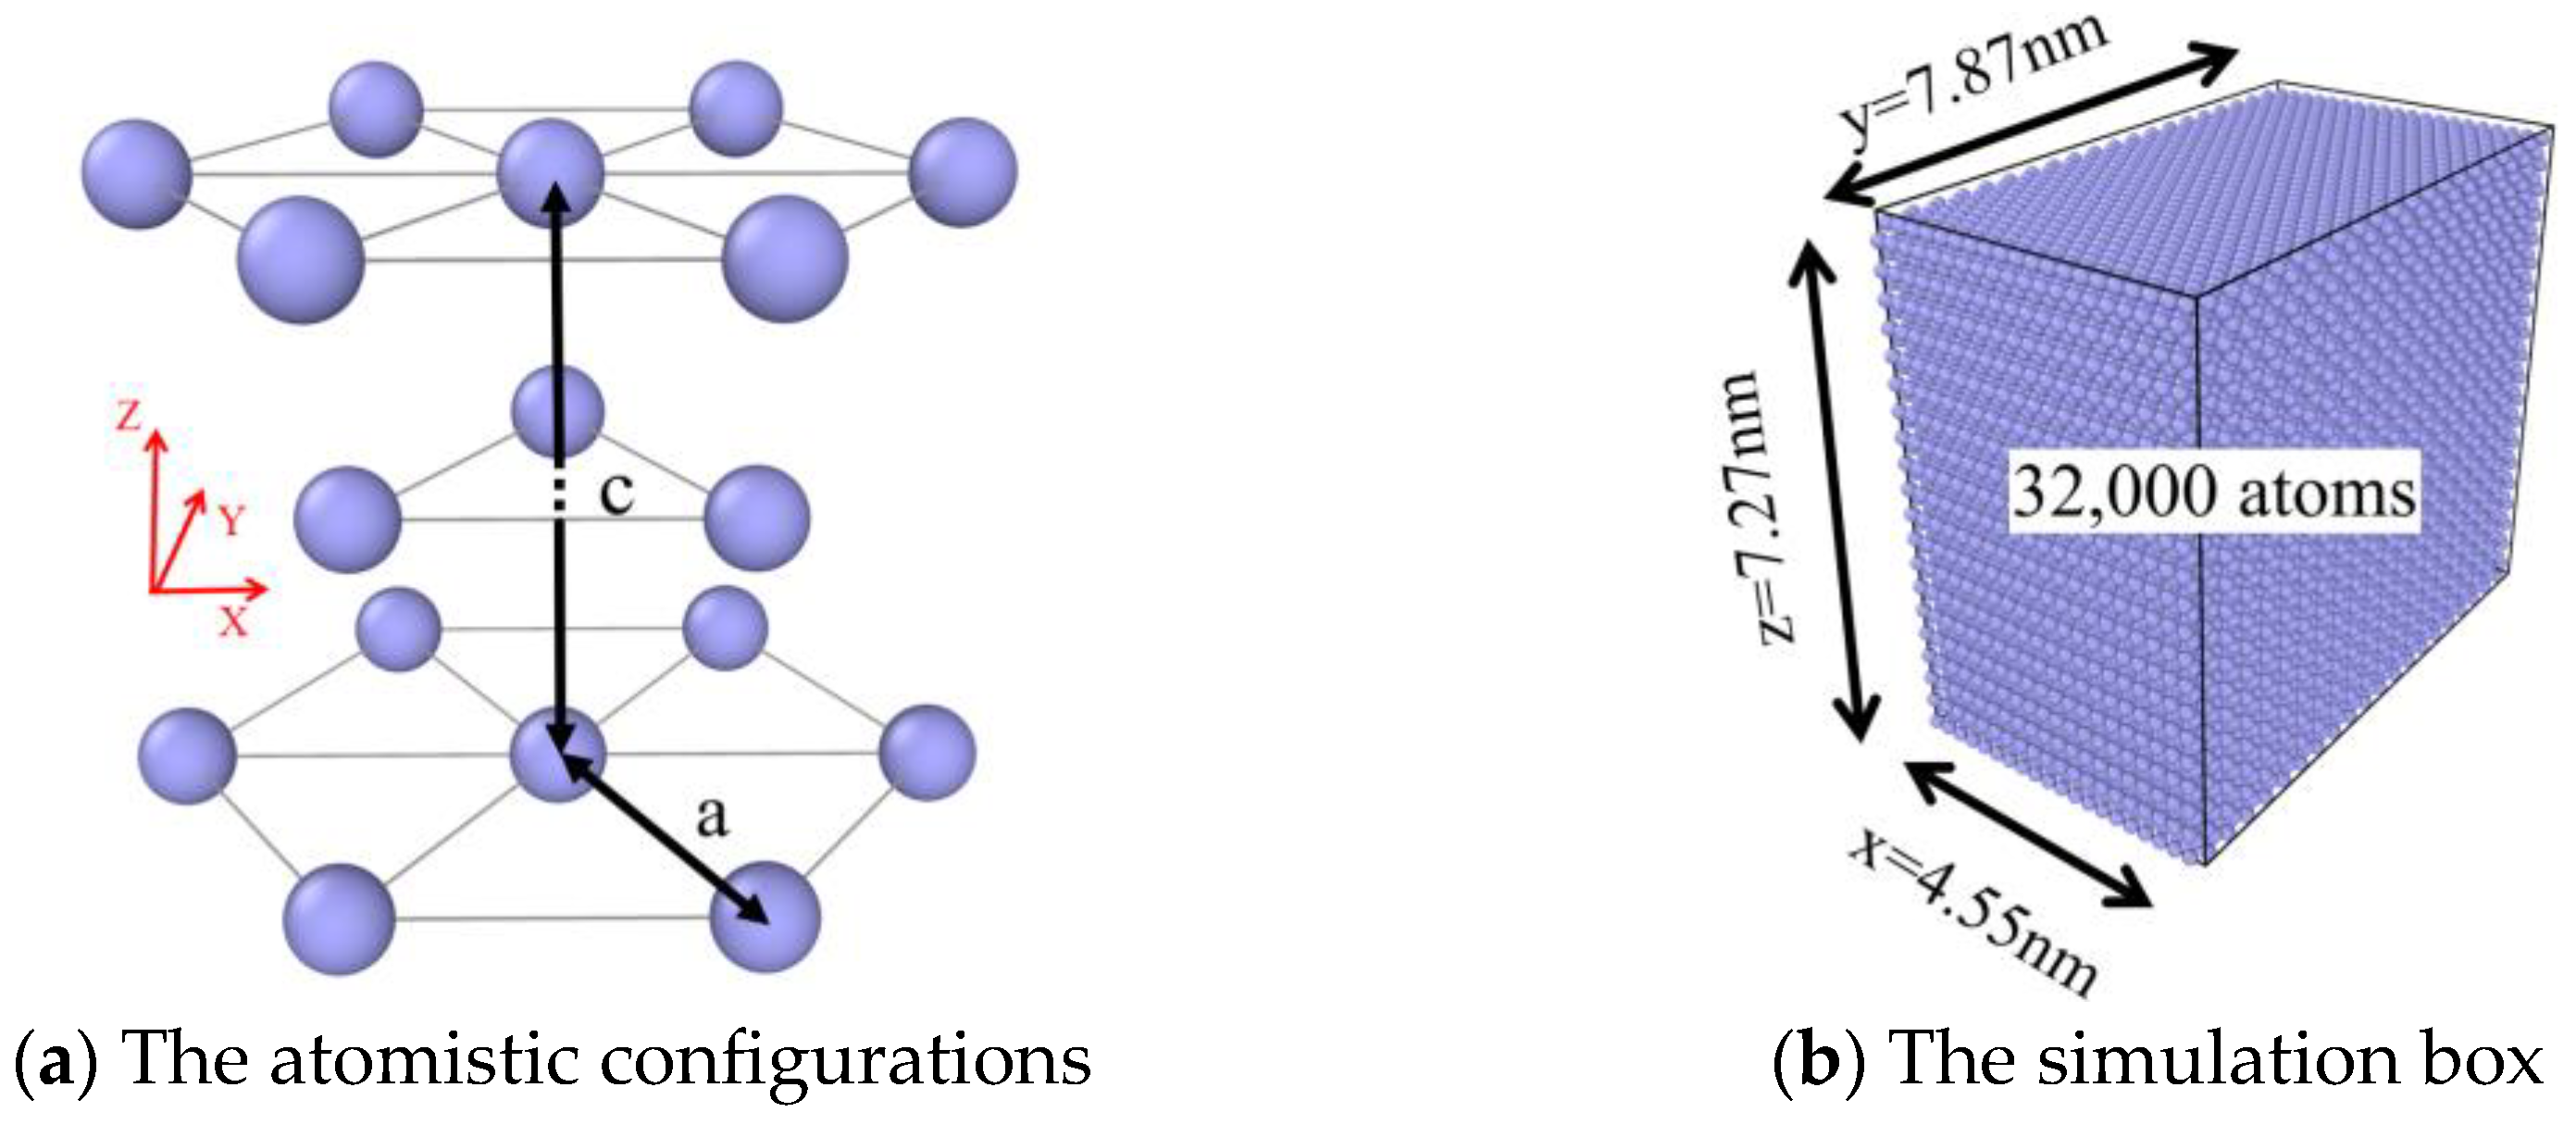
2.4. Simulation Setup

The pristine beryllium characterizes a hexagonal close-packed (HCP) structure, whose unit cell is illustrated in Figure 1. There are two parameters in the unit cell determining the HCP structure, namely a and c. In the ordinary HCP crystalline, the ratio c/a equals 2 6 / 3 ; however, experiments indicate that c/a for beryllium is slightly different from this value. The a and c/a for three types of potentials employed in this study are listed in Figure 2.
The reference axes of our simulation domain are also illustrated in Figure 1. We first created a simulation box that measures 20 a in the x direction, 36.64 a in y the direction, and 20 c in the z direction, respectively, totaling 32,000 atoms; then, the system is relaxed at 300 K and 0 external pressure for 20 ps; after relaxation, the system was subjected to thermal expansion, compression, and elongation, respectively. To create the structures with defects, the atoms in the spherical region with a set radius centering in the middle of the crystalline were deleted before relaxation and mechanical loading. We have explicitly examined nine configurations. The numbers of deleted atoms, in an ascending order, are 12, 56, 159, 407, 775, 1339, 2114, 3148 and 4505, respectively. These systems are therefore named after the number of deleted atoms for convenience. The zero void size system (i.e., 0 atoms were deleted) refers to the perfect beryllium lattice used for reference for ease of the comparison. For mechanical loading, the system is elongated in the x direction, while the other two dimensions are kept at zero stresses to simulate the uniaxial tensile testing experiment.

3. Results

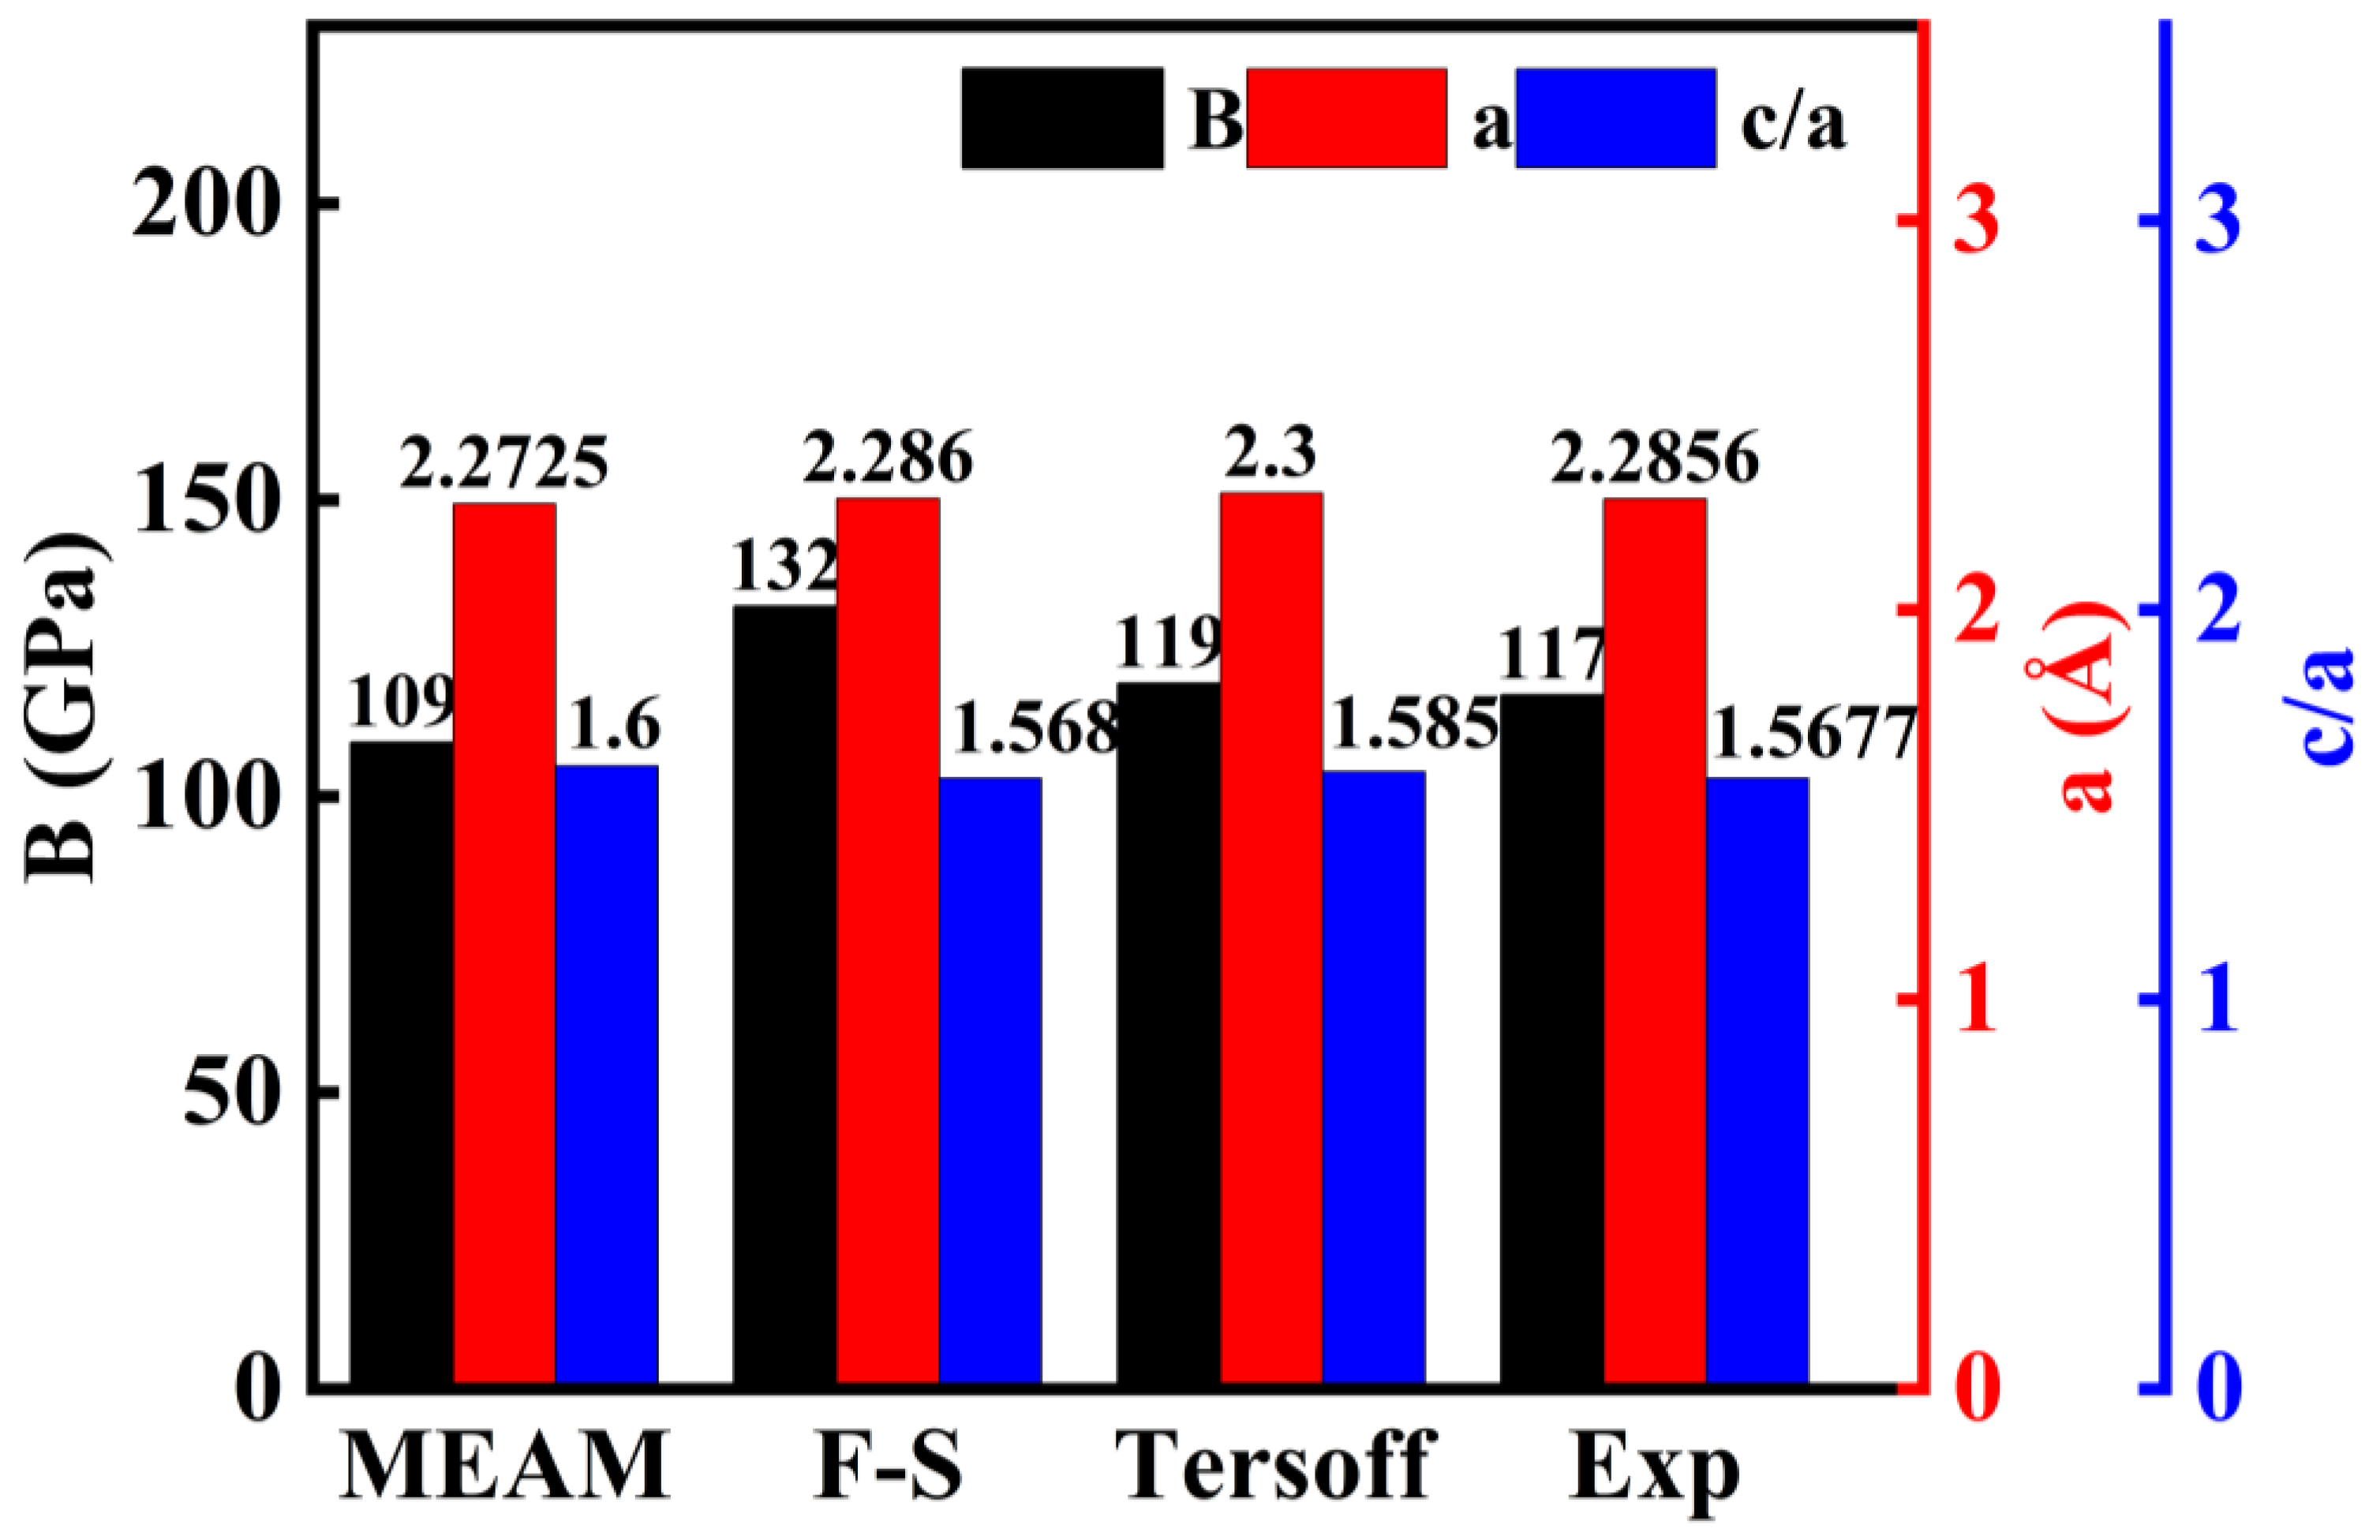
3.1. Equations of States

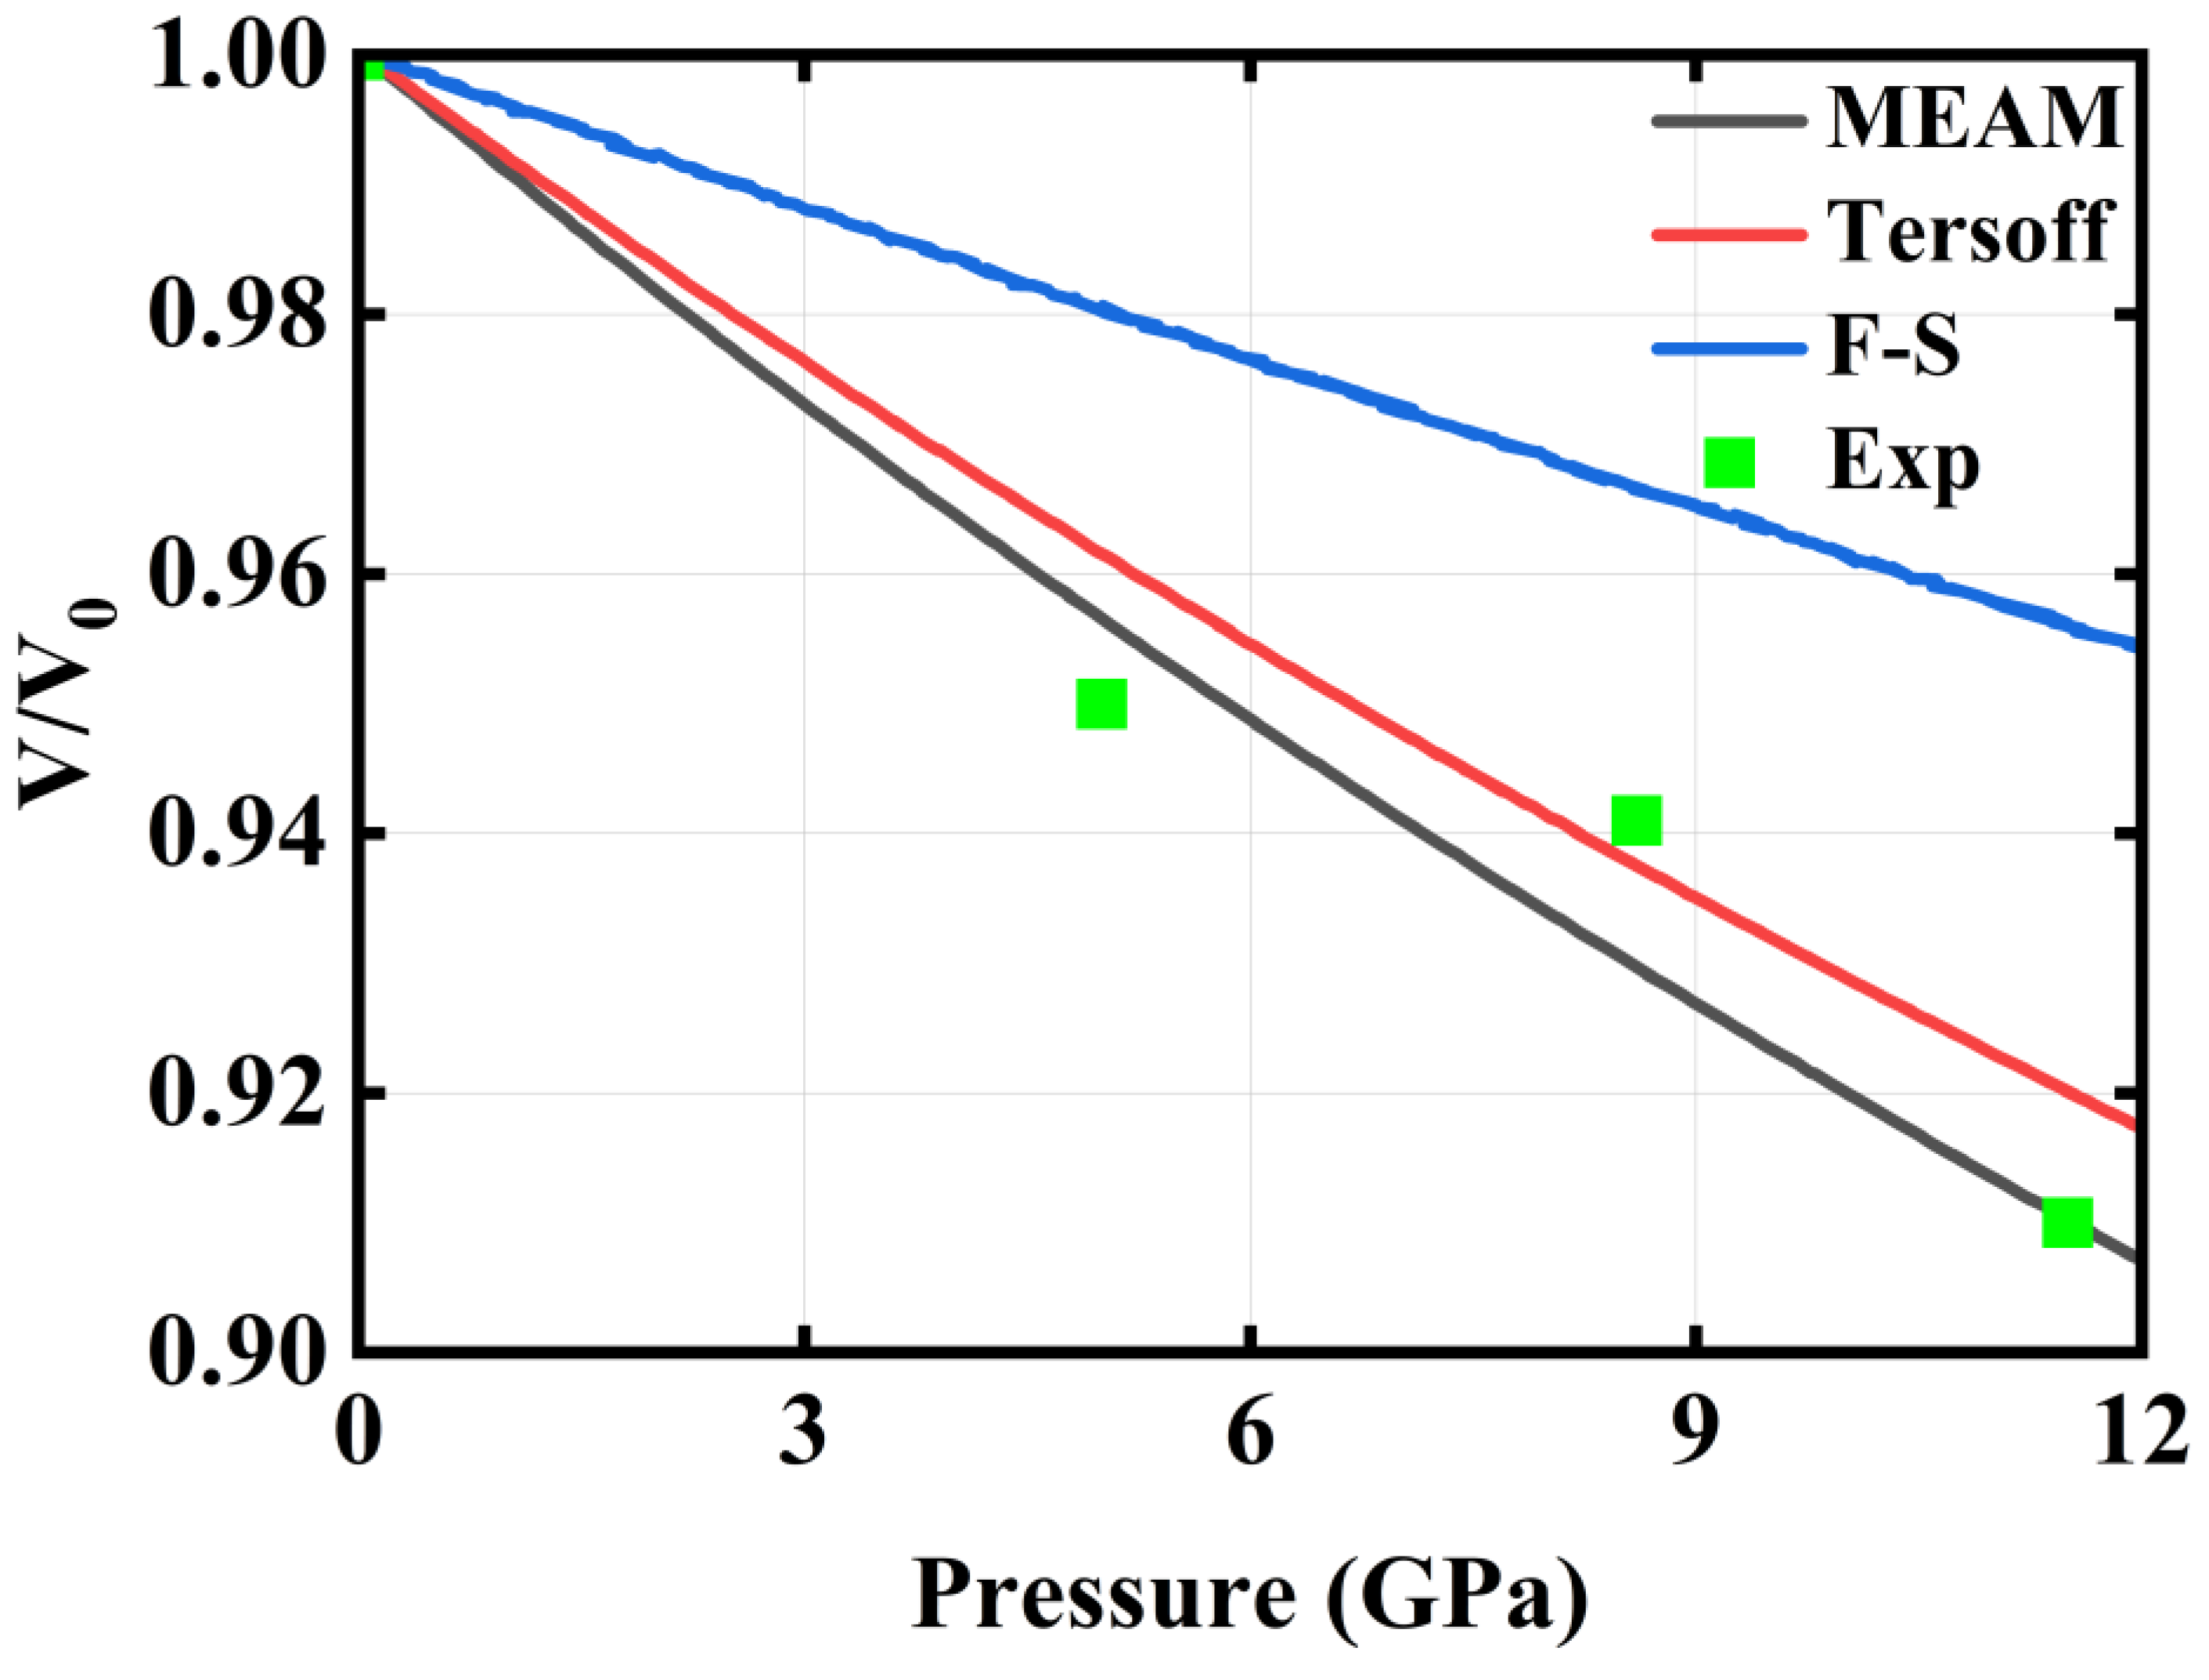
3.1.1. Hydrostatic Compression

Figure 3 illustrates the MD simulation results of volumetric change when the pristine beryllium is subject to hydrostatic compression using three types of potentials. Note that V represents the volume at the corresponding hydrostatic pressure, while V0 is the volume at 0 pressure.
It can be seen that the volume is showing linear dependence on the hydrostatic pressure, while the slope of linearity varies among the three chosen types of potentials; the MEAM type potential shows the largest volumetric change, the Tersoff type is the second, and the Finnis–Sinclair type shows the least change. It is understandable that this slope reflects the bulk modulus, which is shown in Figure 2.

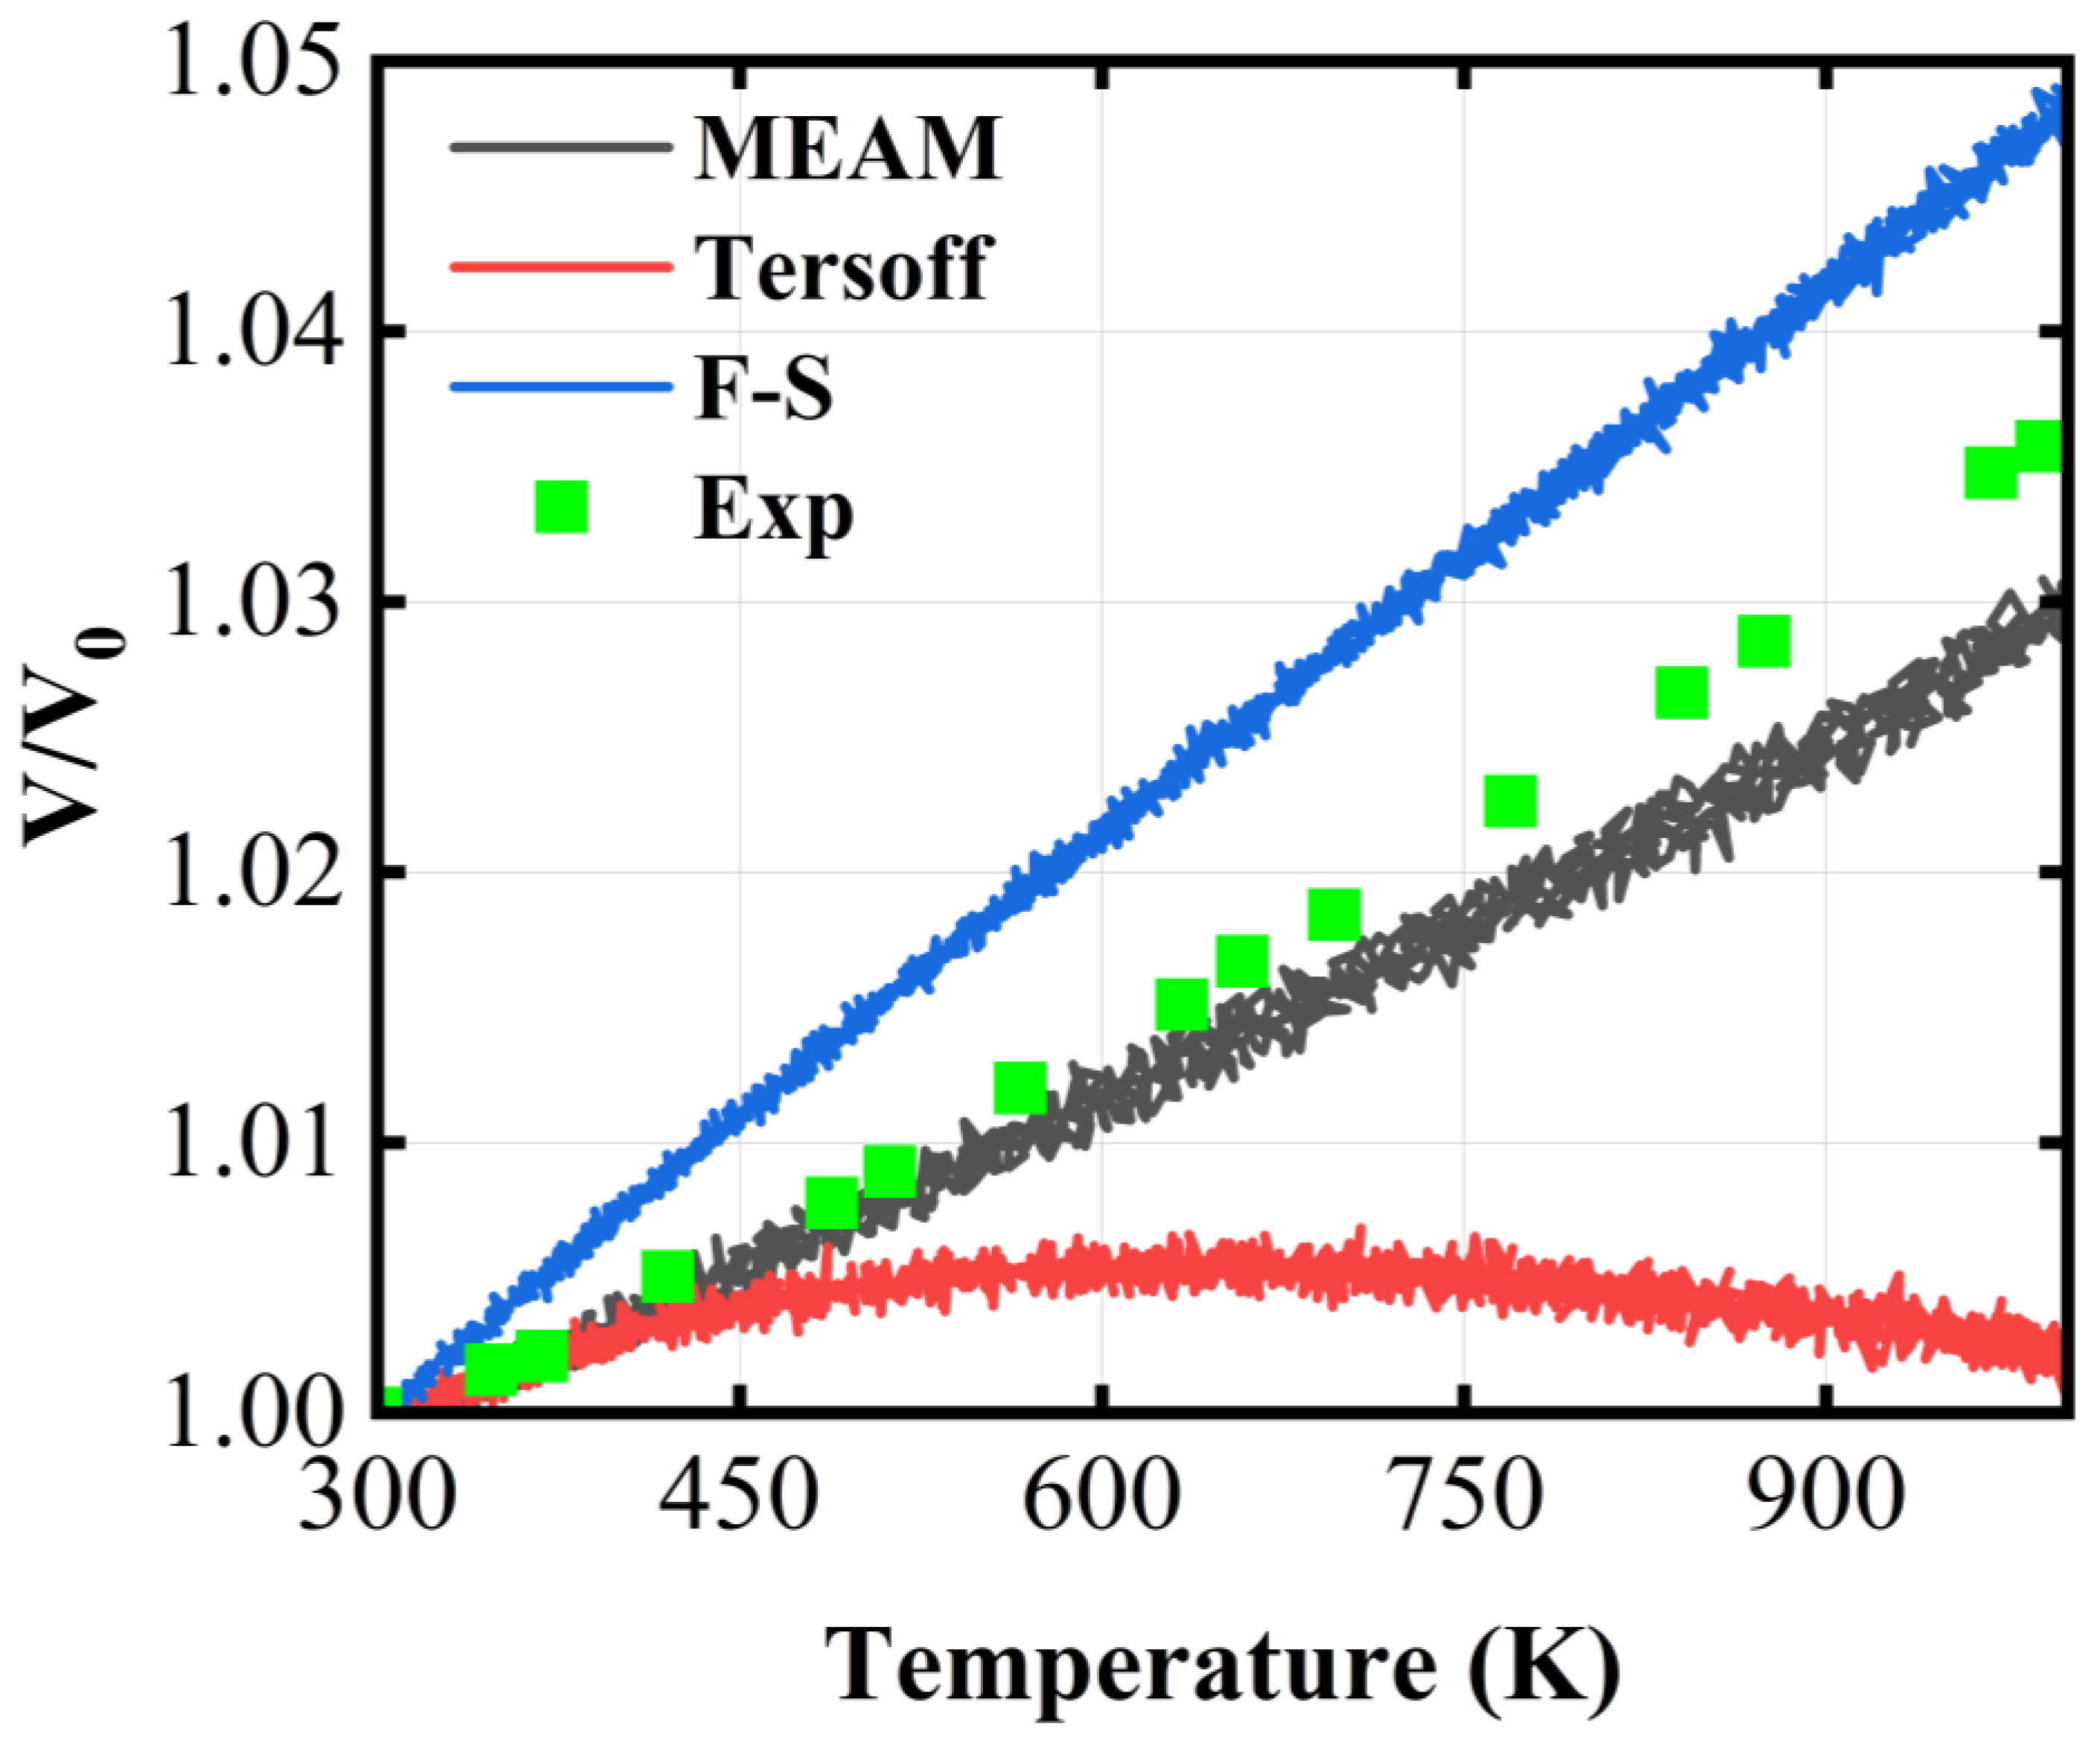
3.1.2. Thermal Expansion

Figure 4 illustrates the MD simulation results of volumetric change when the pristine beryllium is subject to heating using three types of potentials. Note that V represents the volume at the corresponding temperature, while V0 is the volume at 0 K.
It can be seen that the three types of potentials show starkly distinct behaviors. First, in contrast to the case from hydrostatic compression, the Finnis–Sinclair type potential shows the largest volumetric change when the system is subject to heating. Moreover, the volume based on MEAM and Finnis–Sinclair type potential shows a linear dependence on temperature. Second, the volumetric curve based on the Tersoff type potential is very unusual. It starts to shrink at 500 K. The result based on MEAM potential is most similar to the result from Exp.

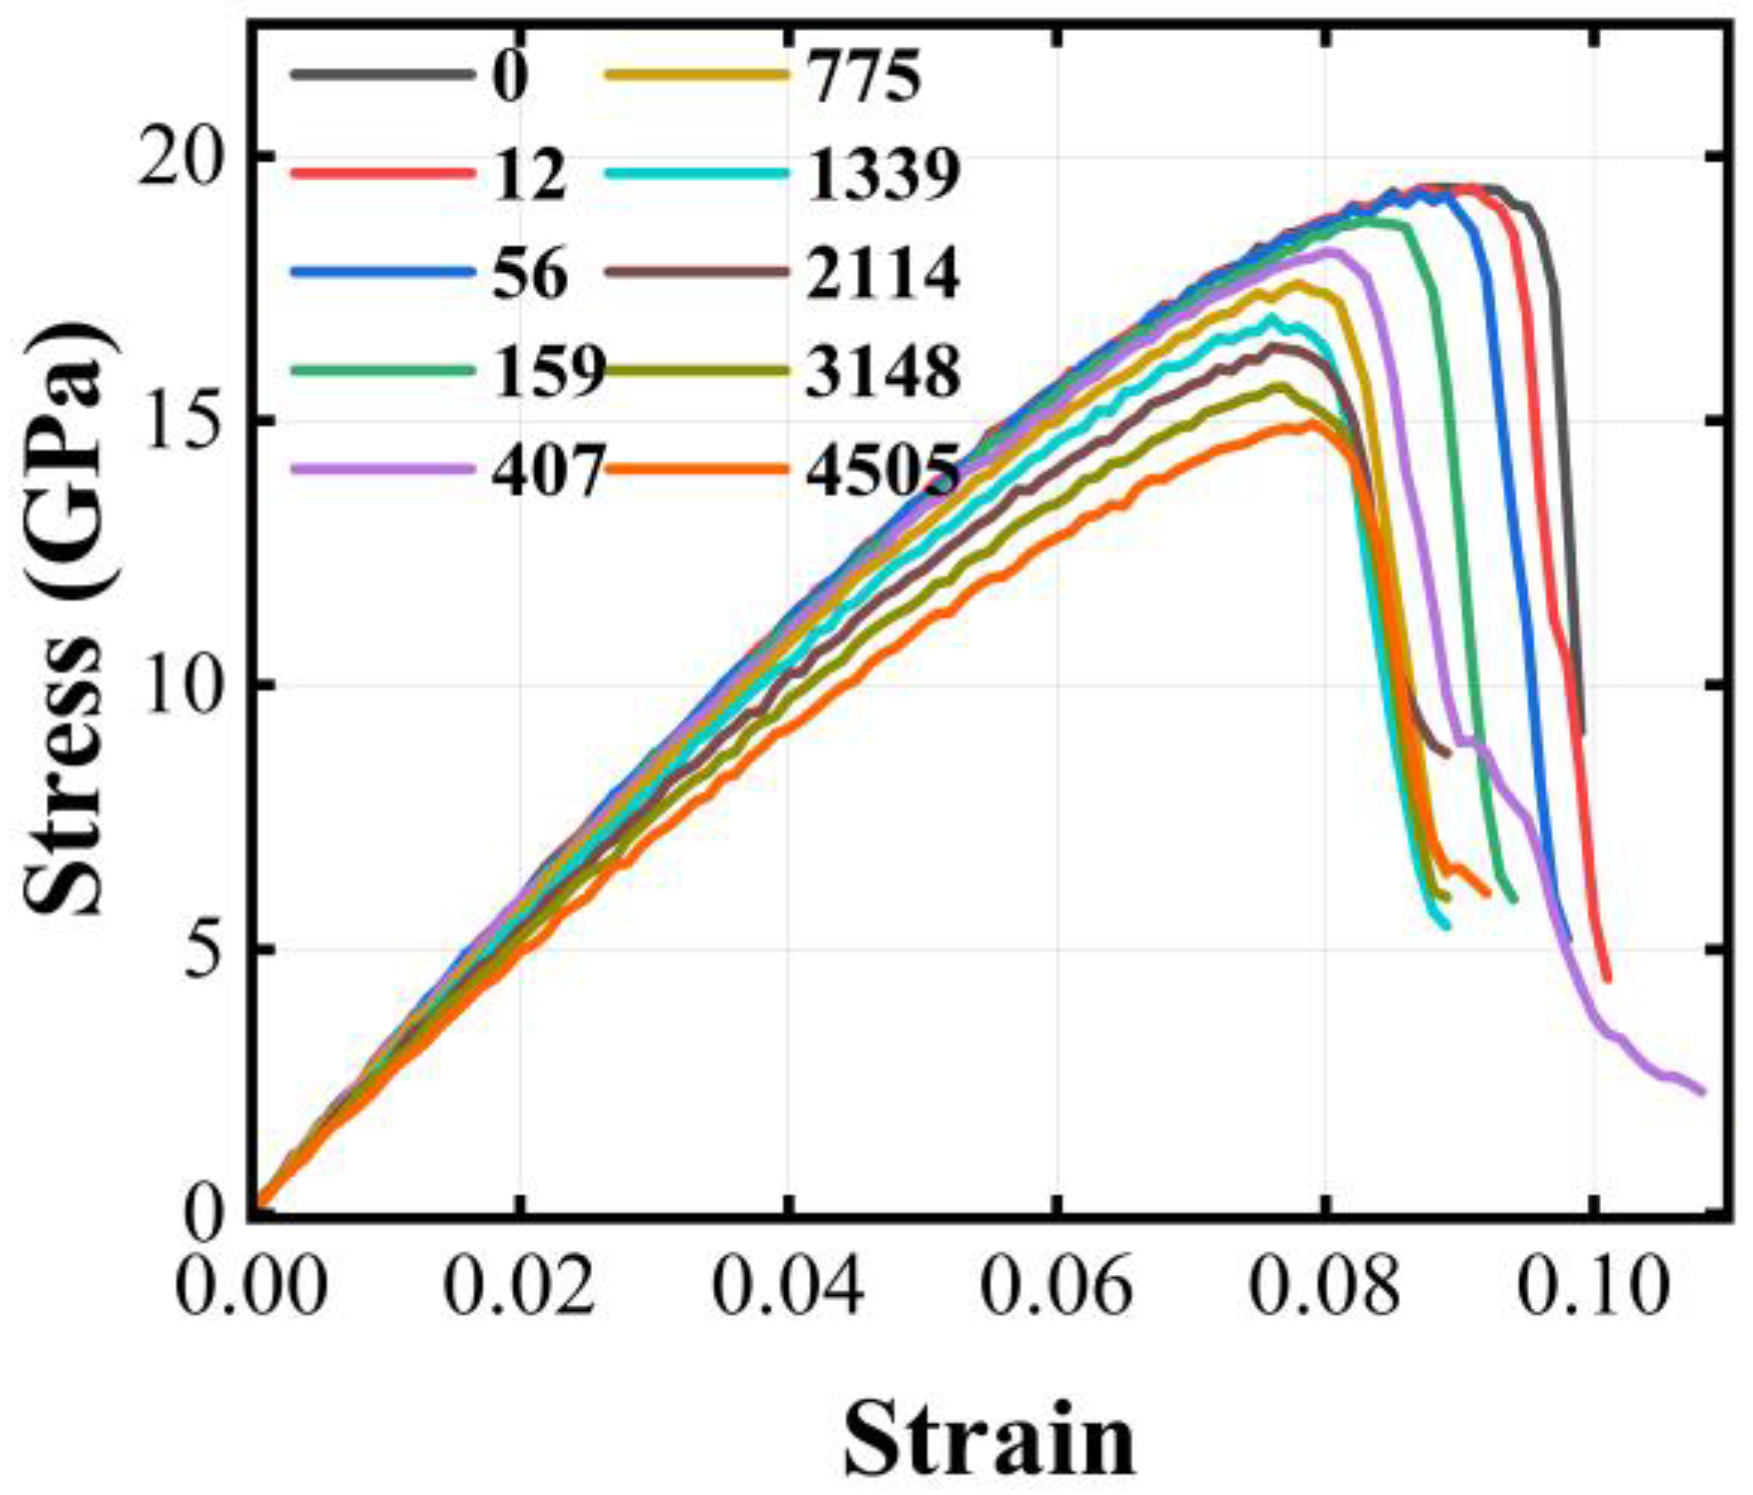
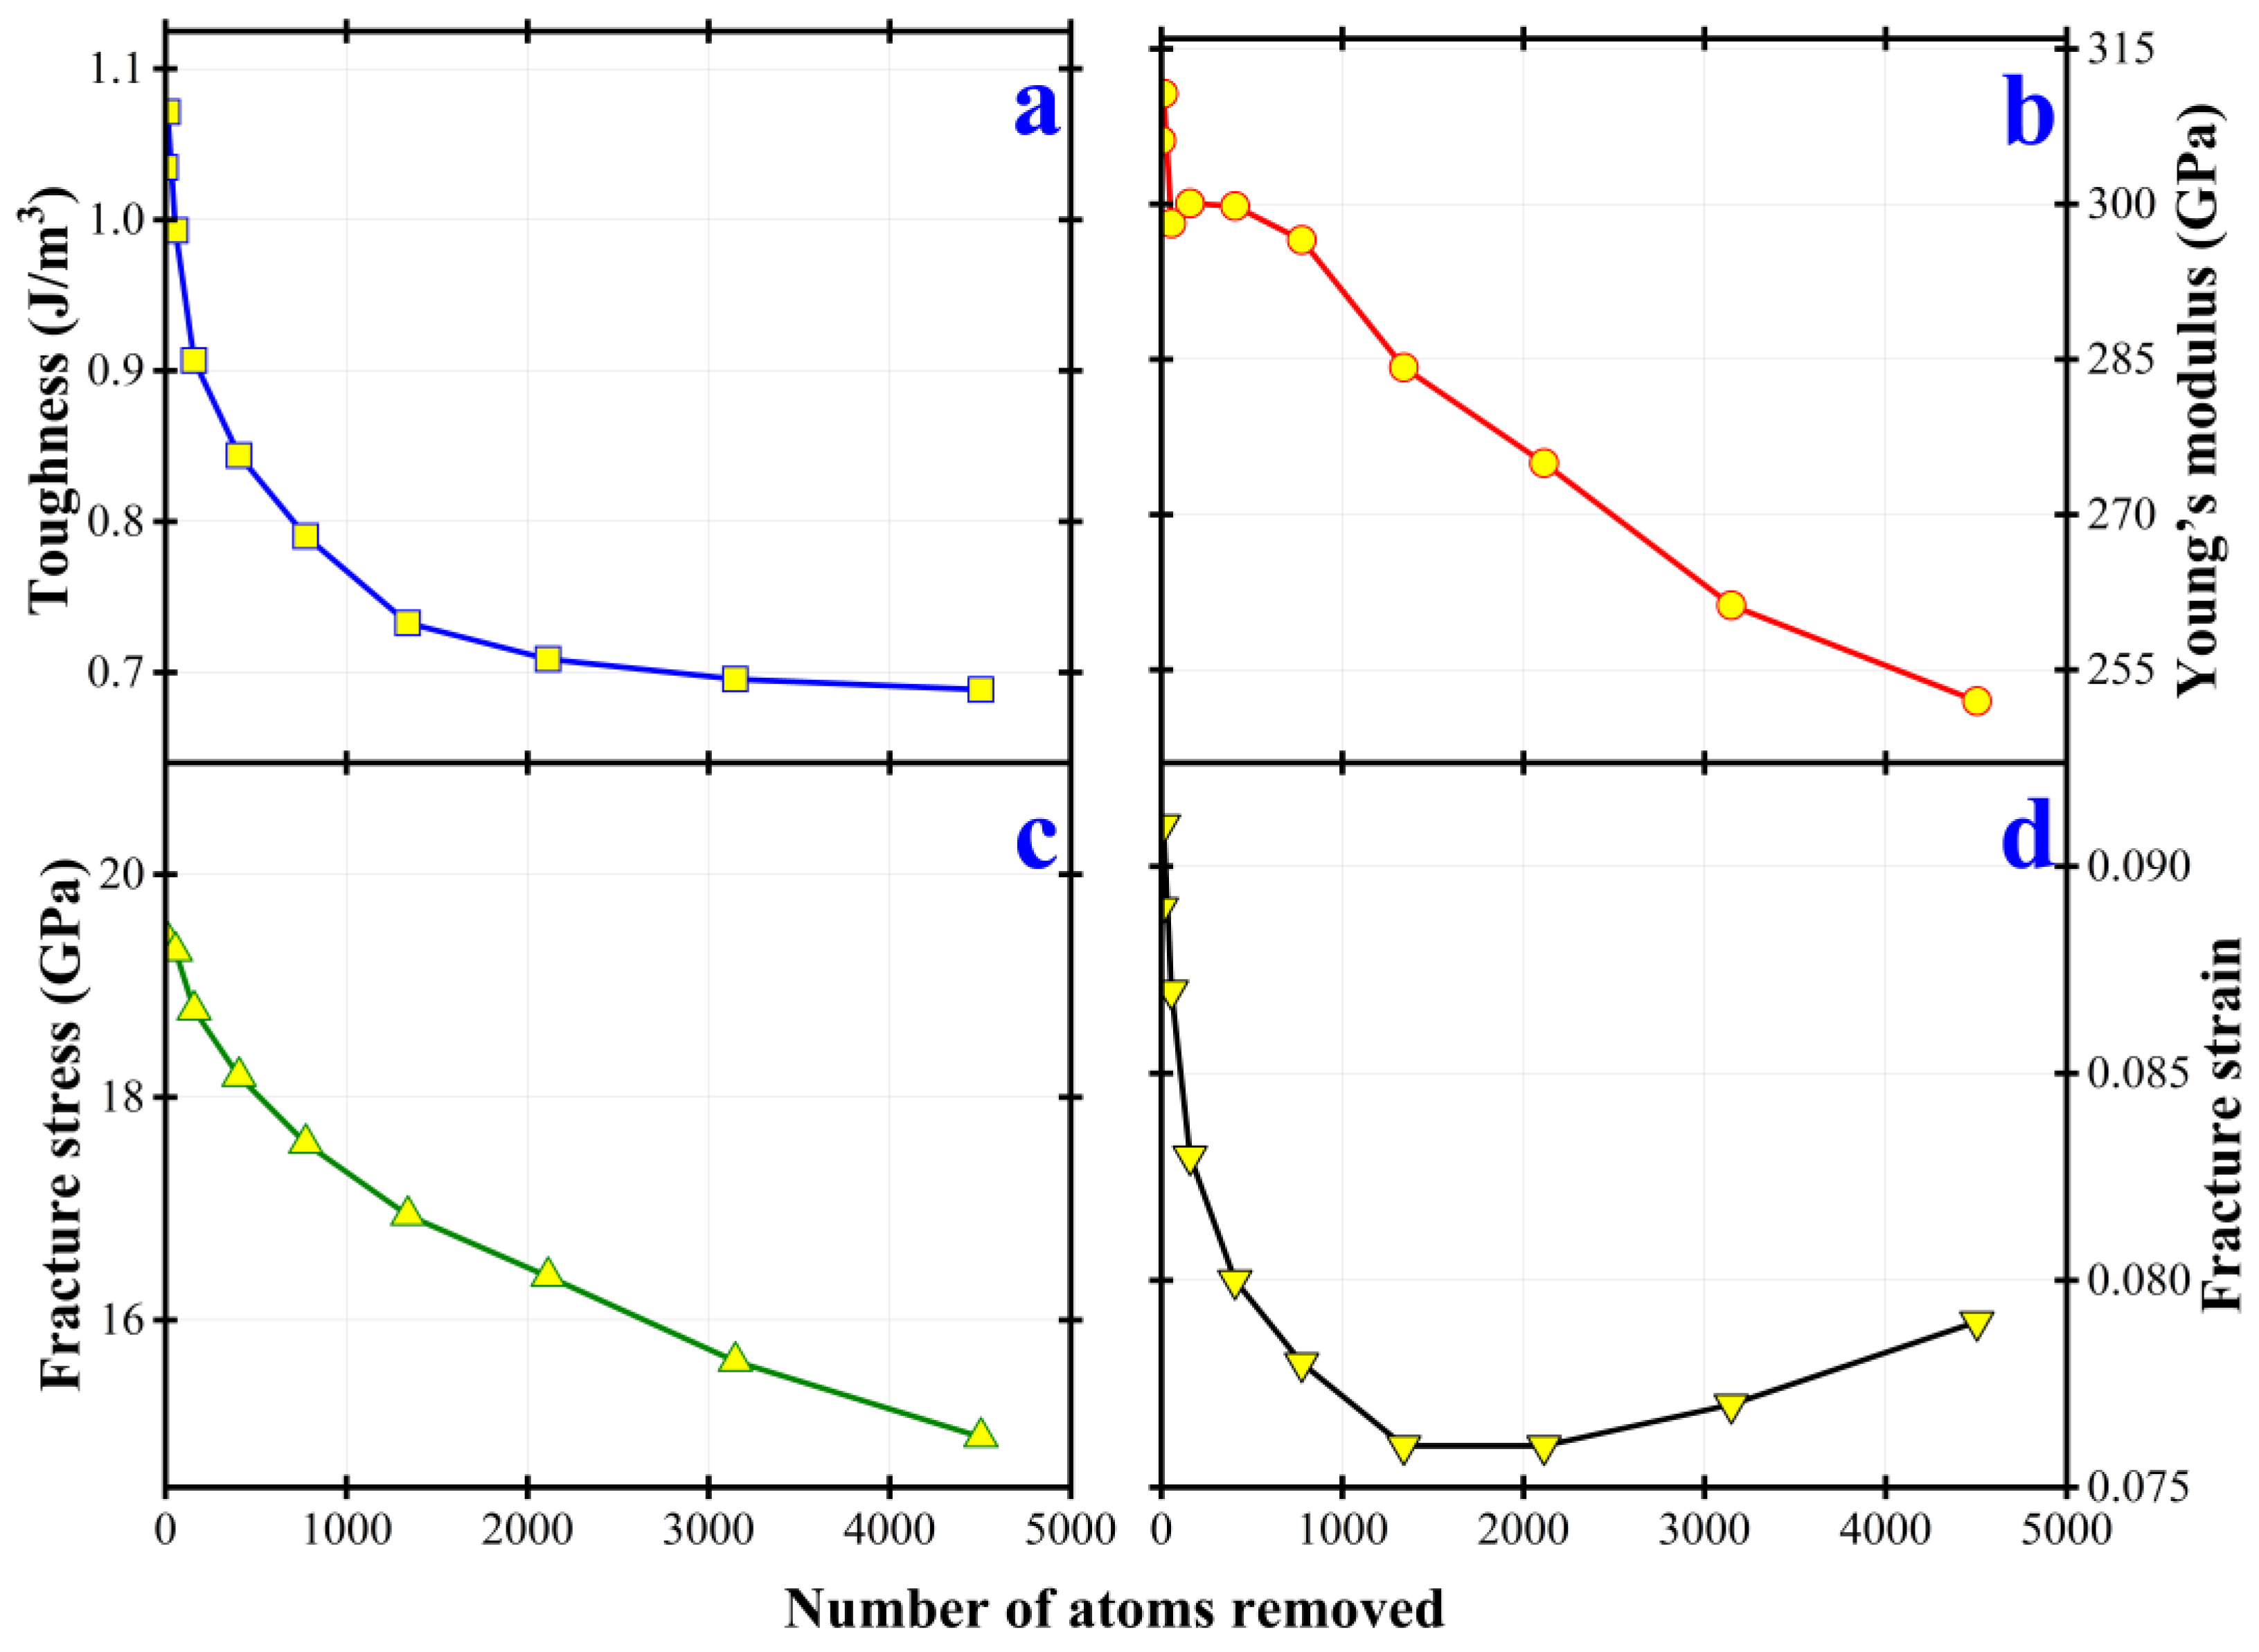
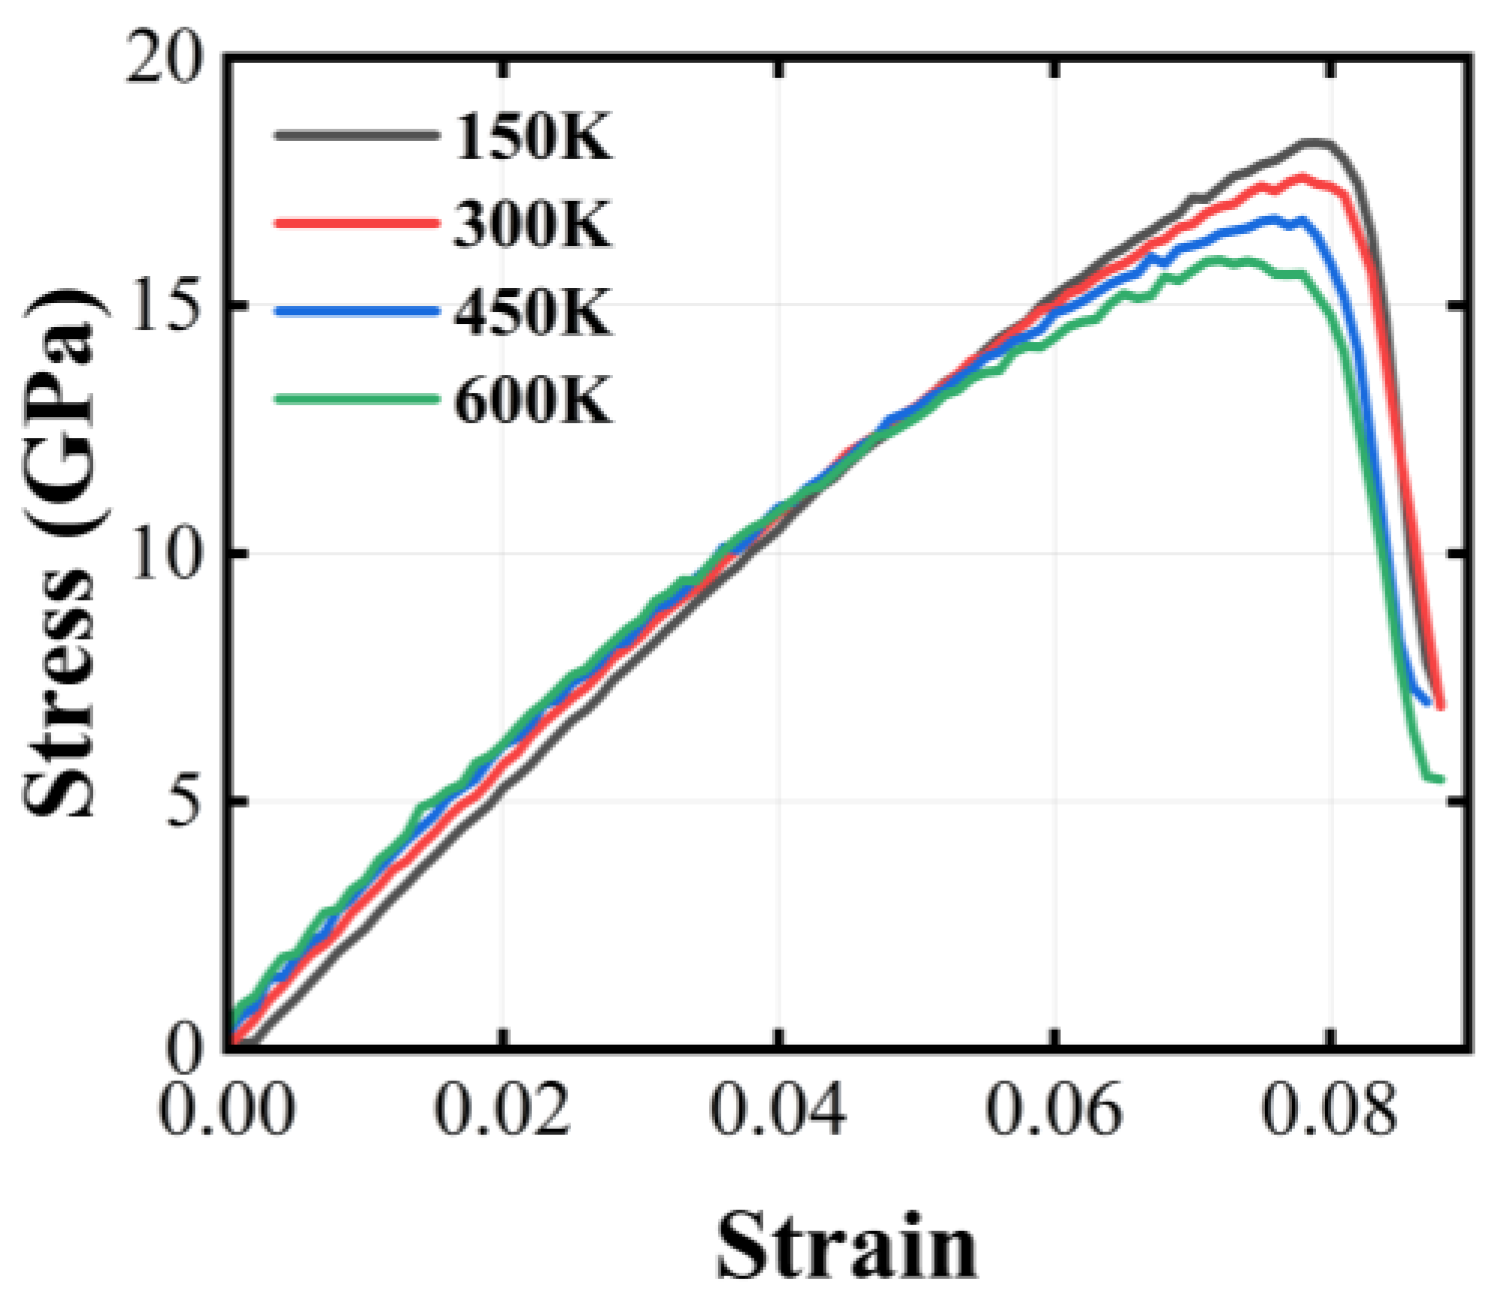
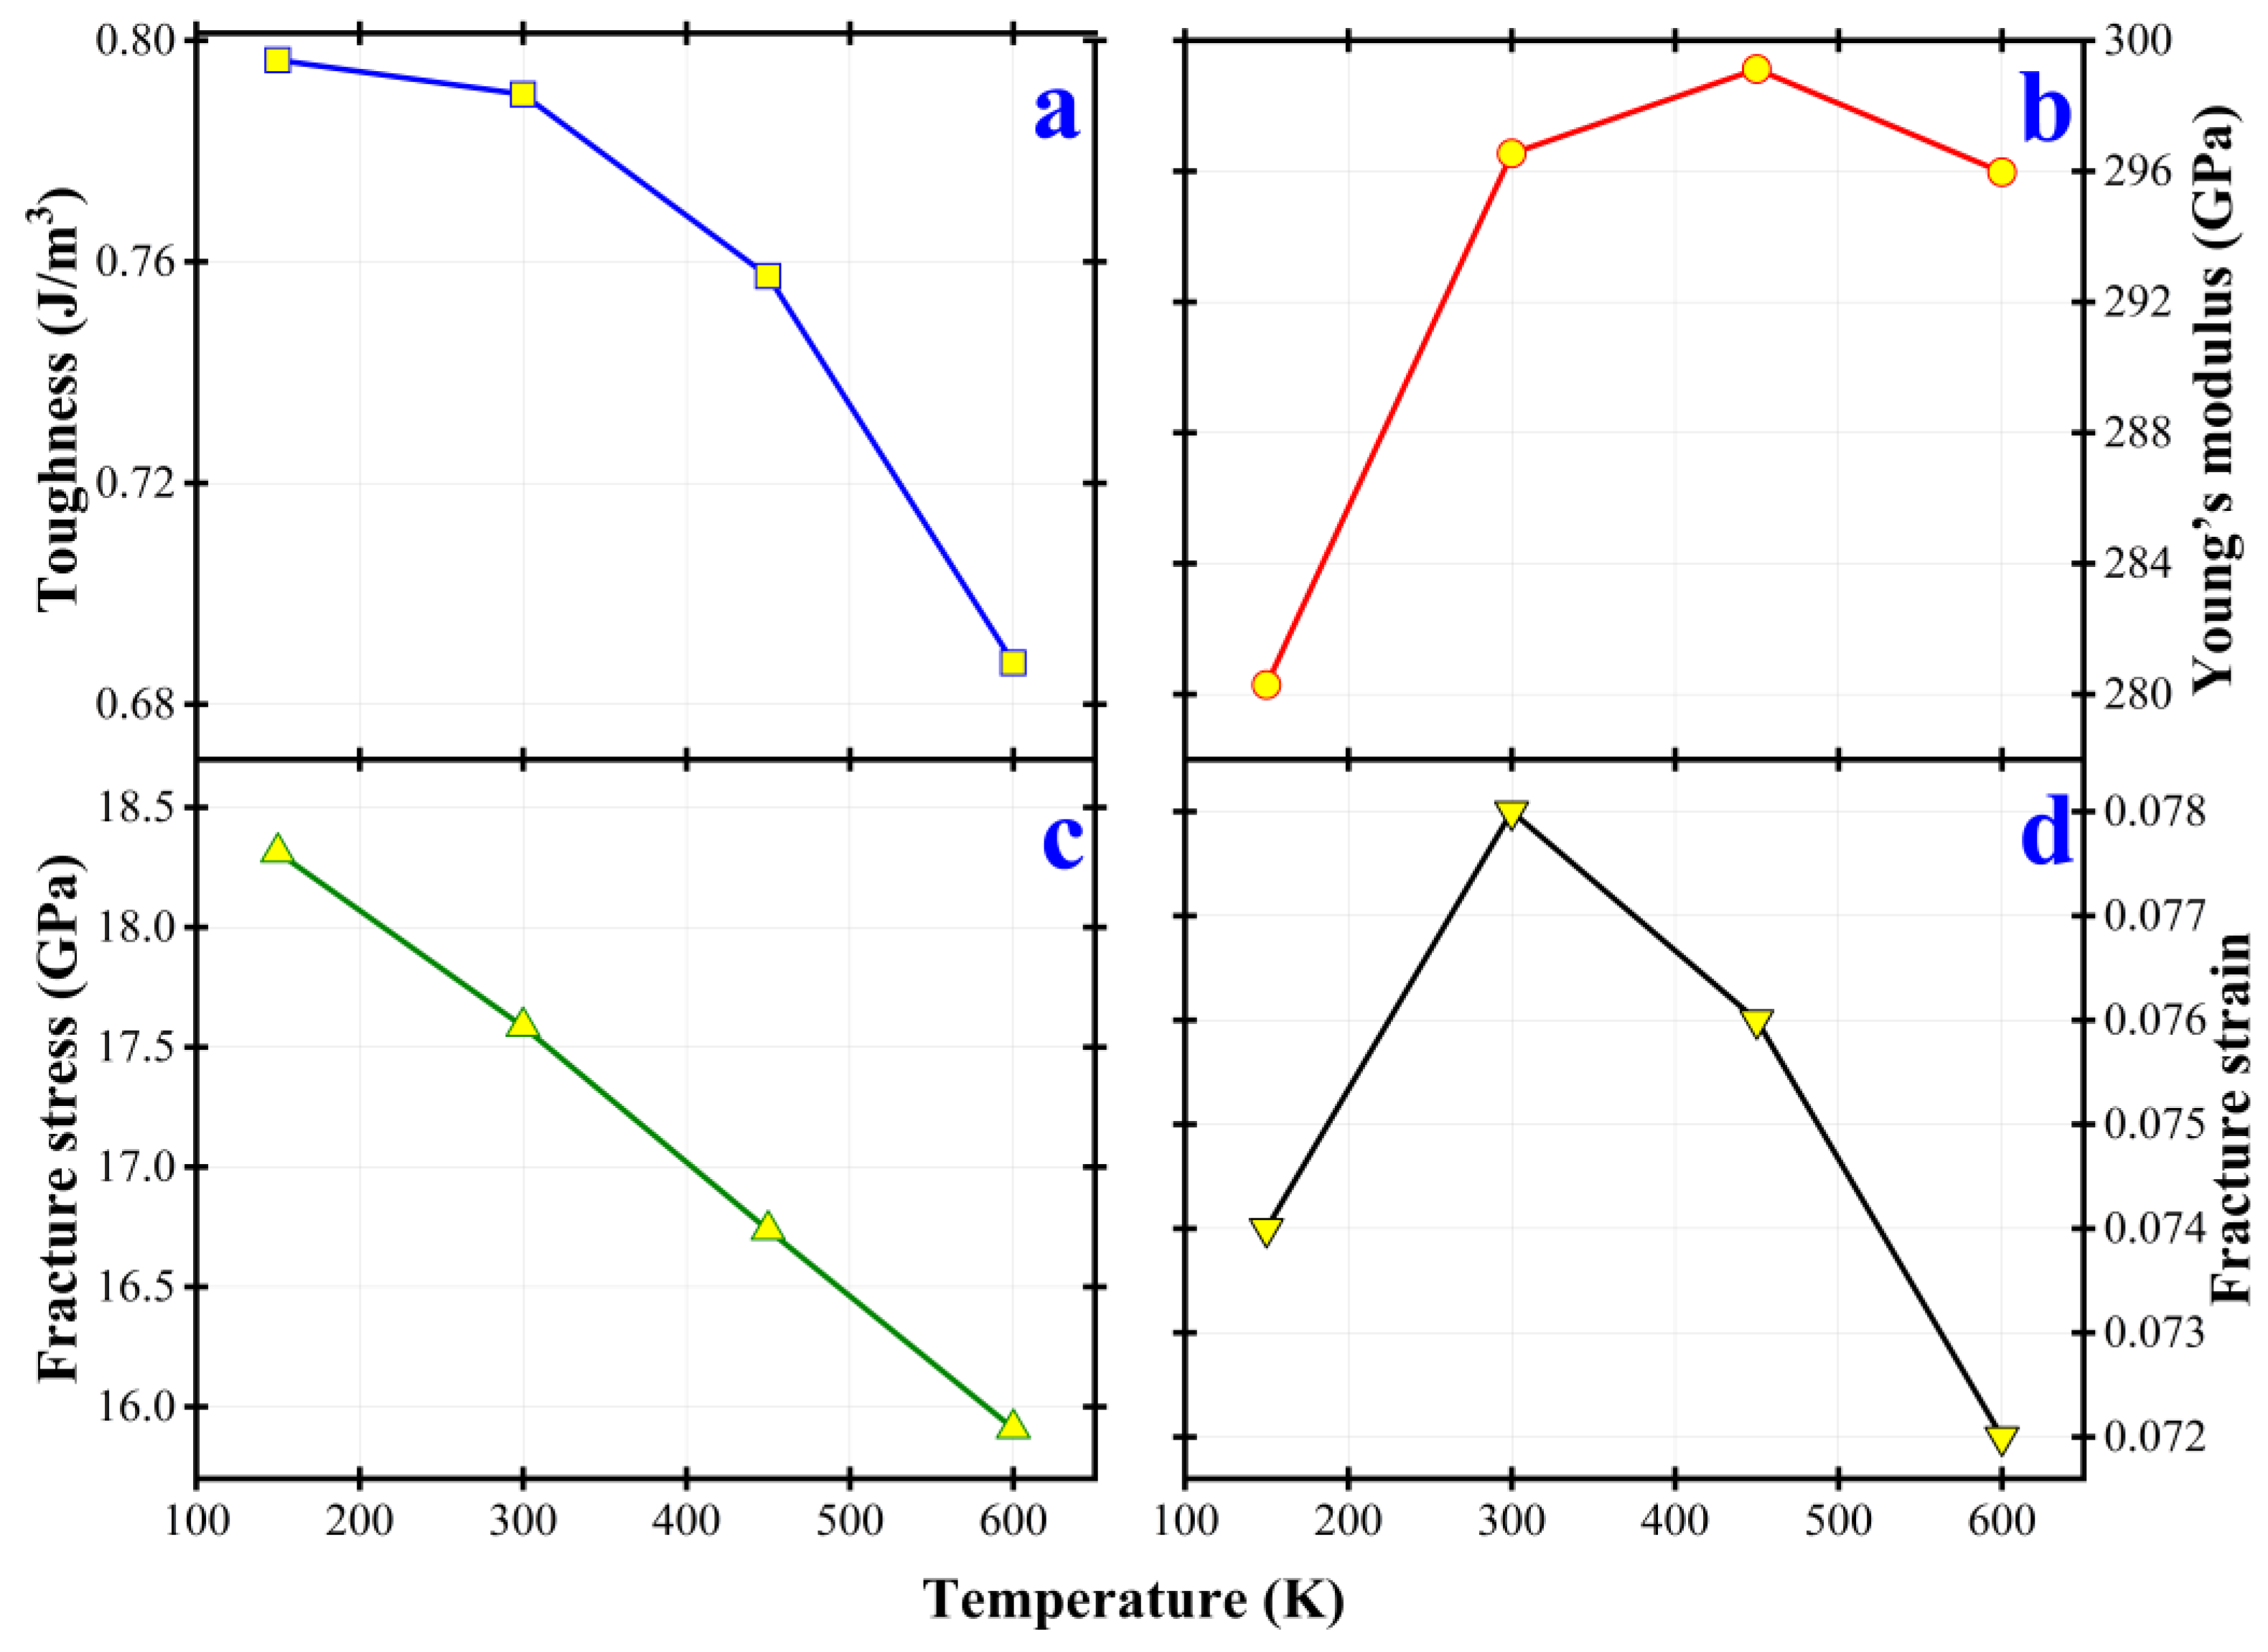
3.2. Uniaxial Tensile Response

In this section, we present the results from performing uniaxial tension on pristine beryllium crystals and those embedded with spherical void defects. Two dependent factors, namely the size of the void and temperature, along with the accompanying microstructural evolution are examined for three types of potentials.

3.2.1. MEAM Type Potential

Figure 5 illustrates the dependence on the size of the spherical void embedded in the beryllium crystals. The nine void-embedded systems (12, 56, 159, 407, 775, 1339, 2114, 3148, and 4505) and the primitive beryllium system (marked as “0”) have been studied. For mechanical loading, the system is elongated in the x direction. It shows the stress–strain curves, where the color code is employed to represent the number of atoms removed from the crystals before relaxation and subsequent loading. These curves characterize similar features; the stress gradually builds up with strain until approaching the fracture point, after which there comes a sudden drop, suggesting a considerable stress release. The microstructural characteristics at the tagged points underlying the observed stress–strain relationship will be demonstrated later in this section. It can be readily seen that the larger size of the void necessarily leads to an earlier onset of fracture.
Figure 6 illustrates the effect of the size of the spherical void on the properties of beryllium reflected by the strain–stress relationship. The tensile toughness, defined as the energy absorbed per unit volume before failure during uniaxial tensile testing, becomes smaller, and is shown in panel (a). The slope of the linear region on curves representing Young’s modulus becomes smaller too, as shown in panel (b). Similarly, panel (c) and panel (b) demonstrate the stress and strain at the onset of fracture. The original data are listed in Table S4 in Supplementary Information.
To examine the dependence on temperature on the mechanical behaviors, we have investigated the uniaxial tensile tests with the same size (775) of the void defect fixed at various temperatures. We have considered four temperatures, 150 K, 300 K, 450 K, and 600 K to show the trend. The results are displayed in Figure 7. These four stress–strain curves suggest a general trend that the stress gradually builds up with strain until approaching the fracture point, after which there comes a sudden drop, suggesting a considerable stress release. The increase in temperature lowers the ultimate tensile strength, the fracture stress, and the fracture strain of the void-embedded hcp beryllium.
Figure 8 illustrates the effect of temperature on the properties of beryllium reflected by the strain–stress relationship. Similarly, the results indicate that a higher temperature leads to smaller toughness, smaller Young’s modulus, and earlier onset of fracture (equivalently smaller fracture stress and strain). These quantities appear to be approximately linearly dependent on the temperature in the beryllium crystals. The original data are listed in Table S5 in Supplementary Information.
To investigate the fracture mechanism, we illustrate the microscopic characteristics in Figure 9. Panel (a) shows the strain–stress relationship and normalized energy change during the stretching process of strain. Panel (b) and panel (c) demonstrate the configurations of atoms on the plane slicing through the center of the void defect, where the color code is employed to represent the potential energy of each atom in panel (b) and the stress on each atom in the x direction in panel (c). Moreover, the circled numbers denote the stages throughout the loading process marked in panel (a). In addition, we know that cracks are more likely to occur where the stress is concentrated, and from Figure 9, the stress is concentrated in the middle, so the material is easy to break from the middle.
The first configuration corresponds to the onset of loading. The second configuration corresponds to the stage in the middle of loading before fracture, the color of panel (c) shows that the stress increases. The third configuration corresponds to the stage of the imminent fracture. Up to this stage, it is the point on the peak in panel (a) that some parts of panel (c) become deep red, showing that the stress is concentrated, and will crack. The fourth, fifth, and sixth configurations correspond to the process of fracture. The red color of panel (c) decreases, showing that the stress is released after the fracture.

3.2.2. Tersoff Type Potential

Figure 10 illustrates the dependence on the size of the spherical void embedded in the beryllium crystals based on the Tersoff potential. The color-code is consistent with that of Figure 5.
Figure 11 illustrates the dependence on the size of the spherical void embedded in the beryllium crystals based on the Tersoff potential. The arrangement of panels is consistent with that of Figure 6. Similarly, we see toughness depicted in panel (a), Young’s modulus shown in panel (b), and the fracture stress and strain illustrated in panel (c) and panel (d), all decrease with the enlargement of the spherical void defect. The original data are listed in Table S6 in Supplementary Information.
Figure 12 illustrates the dependence on temperature with the size of the void defect fixed. The color-code is consistent with that of Figure 7.
Figure 13 illustrates the effect of temperature on the properties of beryllium reflected by the strain–stress relationship. The arrangement is consistent with that of Figure 8. The results on the fracture strain and stress, and toughness are similar. However, surprisingly, Young’s modulus linearly increases with temperature. The original data is listed in Table S7 in Supplementary Information.
The microscopic characteristics throughout the fracture are illustrated in Figure 14. The arrangement and color-code are consistent with that of Figure 9. According to Figure 14, the stress distribution is relatively uniform, and small cracks may appear in some parts.
In the first and second configurations, the system is stressed from its initial state. In the third configuration, corresponding to the stage at the imminence of fracture, the system began to develop some small cracks. In the fourth, fifth, and sixth configurations, the crack grows in both directions. Nonetheless, the system does not tear up.

3.2.3. Finnis–Sinclair Type Potential

Figure 15 illustrates the dependence on the size of the spherical void embedded in the beryllium crystals. The color-code is consistent with that of Figure 5. The observations are also qualitatively similar.
Figure 16 illustrates the effect of the size of the spherical void on the properties of beryllium reflected by the strain–stress relationship. The arrangement of panels is consistent with that of Figure 6. The results on toughness, Young’s modulus and the fracture stress are similar. However, the fracture strain slightly increases when the atoms removed exceed 2000. The original data are listed in Table S8 in Supplementary Information.
Figure 17 illustrates the dependence on temperature with the size of the void defect fixed. The color-code is consistent with that of Figure 7. The temperature has a slight effect on the strain-stress relationship.
Figure 18 illustrates the effect of temperature on the properties of beryllium reflected by the strain–stress relationship. The arrangement is consistent with that of Figure 8. The results on toughness and fracture stress are similar. Moreover, Young’s modulus and fracture strain show very weak dependence on temperature. The original data are listed in Table S9 in Supplementary Information.
The microscopic characteristics throughout the fracture are illustrated in Figure 19. The arrangement and color-code are consistent with that of Figure 9. According to Figure 19, the stress distribution is relatively uniform, and small cracks may appear in some parts.
The first and second configurations are similar to those from prior potentials. Similarly, some cracks are created in the third configuration. However, these sheath cracks do not lead to the tearing up of the system.

4. Discussion

Figure 20 illustrates the strain–stress relationship of the three potentials, where the color code is employed to represent the type of potential. All three potentials are under the same temperature (300 K) and same size of the spherical void (775). Especially, the stress–strain relationship of MEAM and Finnis–Sinclair has some similarities.
Figure 21 illustrates the effect of the size of the spherical void on the properties of beryllium, respectively, based on the three types of potential: MEAM, Tersoff, and Finnis–Sinclair type potential. In all three potentials, the toughness becomes smaller, and is shown in panel (a). The Young’s modulus becomes smaller too, as shown in panel (b). Similarly, panel (c) and panel (b) demonstrate the fracture stress and strain at the onset of fracture.
However, there are subtle differences in the three types of potential. The toughness of the Tersoff potential is highest and the Finnis–Sinclair is lowest. Young’s modulus of Finnis–Sinclair and MEAM is much higher than that of Tersoff. Fracture stress and strain are similar to toughness.

5. Conclusions

We have assessed interatomic potentials on the mechanical properties of HCP beryllium. We have explicitly examined the beryllium with defects of spherical void as well as the referring pristine perfect beryllium using three types of interatomic potentials, namely MEAM, Finnis–Sinclair, and Tersoff. Through systematic comparison, we gain atomistic insights into the relationship between the microstructure and mechanical performances.
The bulk modulus derived from hydrostatic compression suggests that the results derived from the MEAM and Tersoff type potentials are fairly close to that from the experiment. Among the thermal expansion curves, the result derived from the Tersoff type potential is unreasonable showing a negative thermal expansion coefficient beyond the temperature of 500 K.
From the uniaxial tension testing, the MEAM type predicts a clear fracture mechanism by tearing up along the direction perpendicular to that of stretching, whereas the Finnis–Sinclair and Tersoff types tend to accommodate the deformation more homogeneously without tearing up the system. Considering the fact that beryllium tends to be brittle after neutron irradiation, the predictions from the MEAM type potential are more reasonable.
In summary, through intercomparison of the three types of potentials previously developed for beryllium, this study concludes that the MEAM type potential yields the most reasonable predictions on the pristine beryllium and those with spherically shaped void defects. Our results might be useful in further atomistic investigation and material design on beryllium, a toxic yet important nuclear material.

Supplementary Materials

The following supporting information can be downloaded at: https://www.mdpi.com/article/10.3390/cryst13091330/s1, Supplementary Information includes nine tables, as (Tables S1–S3) the parameters of three potentials developed for beryllium; (Tables S4 and S5) effect of void size of spherical void and temperature on the mechanical performance of beryllium subject to uniaxial tension based on the MEAM potential; (Tables S6 and S7) effect of void size of spherical void and temperature on the mechanical performance of beryllium subject to uniaxial tension based on the Tersoff potential; (Tables S8 and S9) effect of void size of spherical void and temperature on the mechanical performance of beryllium subject to uniaxial tension based on the Finnis–Sinclair potential.

Author Contributions

Conceptualization, B.W., J.J. and Q.P.; methodology, J.J. and Q.P.; formal analysis, C.Y. and W.D.; investigation, C.Y., W.D. and S.L.; data curation, C.Y.; writing—original draft preparation, B.W.; writing—review and editing, B.W. and Q.P.; visualization, C.Y.; supervision, B.W. and Q.P.; project administration, B.W. All authors have read and agreed to the published version of the manuscript.

Funding

Q. P. would like to acknowledge the support provided by the National Natural Science Foundation of China (Grant No. 12272378) and the LiYing Program of the Institute of Mechanics, Chinese Academy of Sciences (Grant No. E1Z1011001).

Data Availability Statement

The data presented in this study are available upon reasonable requests.

Conflicts of Interest

The authors declare no conflict of interest. The funders had no role in the design of this study; in the collection, analyses, or interpretation of the data; in the writing of the manuscript, or in the decision to publish the results.

References

  1. Zheng, L.; Liu, X.; Bao, S.; Zhang, J.; Zhong, J.; Ding, Y. Research Progress on Properties of Rare Metal Beryllium. Chin. J. Rare Met. 2023, 24, 292–302. [Google Scholar]
  2. Barabash, V.; Eaton, R.; Hirai, T.; Kupriyanov, I.; Nikolaev, G.; Wang, Z.; Liu, X.; Roedig, M.; Linke, J. Summary of beryllium qualification activity for ITER first-wall applications. Phys. Scr. 2011, T145, 014007. [Google Scholar] [CrossRef]
  3. Tolias, P. Analytical expressions for thermophysical properties of solid and liquid beryllium relevant for fusion applications. Nucl. Mater. Energy 2022, 31, 101195. [Google Scholar] [CrossRef]
  4. Vladimirov, P.V.; Chakin, V.P.; Dürrschnabel, M.; Gaisin, R.; Goraieb, A.; Gonzalez, F.A.H.; Klimenkov, M.; Rieth, M.; Rolli, R.; Zimber, N.; et al. Development and characterization of advanced neutron multiplier materials. J. Nucl. Mater. 2021, 543, 152593. [Google Scholar] [CrossRef]
  5. DiJulio, D.D.; Lee, Y.J.; Muhrer, G.; Herwig, K.W.; Iverson, E.B. Impact of crystallite size on the performance of a beryllium reflector. J. Neutron Res. 2020, 22, 275–279. [Google Scholar] [CrossRef]
  6. Muhammad, S.T.; Ahmad, S.-u.-I.; Chaudri, K.S.; Ahmad, A. Beryllium as reflector of MNSR. Ann. Nucl. Energy 2008, 35, 1708–1712. [Google Scholar] [CrossRef]
  7. Hu, N.; Tanaka, H.; Akita, K.; Kakino, R.; Aihara, T.; Nihei, K.; Ono, K.; Baxter, D.; Gutberlet, T.; Kino, K.; et al. Accelerator based epithermal neutron source for clinical boron neutron capture therapy. J. Neutron Res. 2022, 24, 359–366. [Google Scholar] [CrossRef]
  8. Magni, C.; Postuma, I.; Ferrarini, M.; Protti, N.; Fatemi, S.; Gong, C.; Anselmi-Tamburini, U.; Vercesi, V.; Battistoni, G.; Altieri, S.; et al. Design of a BNCT irradiation room based on proton accelerator and beryllium target. Appl. Radiat. Isot. 2020, 165, 109314. [Google Scholar] [CrossRef] [PubMed]
  9. Pajuste, E.; Kizane, G.; Avotiņa, L.; Zariņš, A. Behaviour of neutron irradiated beryllium during temperature excursions up to and beyond its melting temperature. J. Nucl. Mater. 2015, 465, 293–300. [Google Scholar] [CrossRef]
  10. Simos, N.; Elbakhshwan, M.; Zhong, Z.; Camino, F. Proton irradiation effects on beryllium—A macroscopic assessment. J. Nucl. Mater. 2016, 479, 489–503. [Google Scholar] [CrossRef]
  11. Peng, Q.; Zhang, X.; Hung, L.; Carter, E.A.; Lu, G. Quantum simulation of materials at micron scales and beyond. Phys. Rev. B 2008, 78, 054118. [Google Scholar] [CrossRef]
  12. Sun, Y.; Peng, Q.; Lu, G. Quantum mechanical modeling of hydrogen assisted cracking in aluminum. Phys. Rev. B 2013, 88, 104109. [Google Scholar] [CrossRef]
  13. Peng, Q.; Ma, Z.; Cai, S.; Zhao, S.; Chen, X.; Cao, Q. Atomistic Insights on Surface Quality Control via Annealing Process in AlGaN Thin Film Growth. Nanomaterials 2023, 13, 1382. [Google Scholar] [CrossRef] [PubMed]
  14. Peng, Q.; Meng, F.; Yang, Y.; Lu, C.; Deng, H.; Wang, L.; De, S.; Gao, F. Shockwave generates <100> dislocation loops in bcc iron. Nat. Commun. 2018, 9, 4880. [Google Scholar] [PubMed]
  15. Ganchenkova, M.G.; Vladimirov, P.V.; Borodin, V.A. Vacancies, interstitials and gas atoms in beryllium. J. Nucl. Mater. 2009, 386–388, 79–81. [Google Scholar] [CrossRef]
  16. Agrawal, A.; Mishra, R.; Ward, L.; Flores, K.M.; Windl, W. An embedded atom method potential of beryllium. Model. Simul. Sci. Eng. 2013, 21, 085001. [Google Scholar] [CrossRef]
  17. Daw, M.S.; Baskes, M.I. Embedded-atom method: Derivation and application to impurities, surfaces, and other defects in metals. Phys. Rev. B 1984, 29, 6443–6453. [Google Scholar] [CrossRef]
  18. Hu, W.Y.; Zhang, B.W.; Huang, B.Y.; Gao, F.; Bacon, D.J. Analytic modified embedded atom potentials for HCP metals. J. Phys. Condens. Matter. 2001, 13, 1193–1213. [Google Scholar] [CrossRef]
  19. Baskes, M.I. Modified embedded-atom potentials for cubic materials and impurities. Phys. Rev. B 1992, 46, 2727–2742. [Google Scholar] [CrossRef] [PubMed]
  20. Finnis, M.W.; Sinclair, J.E. A simple empirical N-body potential for transition metals. Philos. Mag. A 1984, 50, 45–55. [Google Scholar] [CrossRef]
  21. Tersoff, J. New empirical approach for the structure and energy of covalent systems. Phys. Rev. B 1988, 37, 6991–7000. [Google Scholar] [CrossRef]
  22. Plimpton, S. Fast Parallel Algorithms for Short-Range Molecular Dynamics. J. Comput. Phys. 1995, 117, 1–19. [Google Scholar] [CrossRef]
  23. Baskes, M.I. Determination of modified embedded atom method parameters for nickel. Mater. Chem. Phys. 1997, 50, 152–158. [Google Scholar] [CrossRef]
  24. Baskes, M.I.; Johnson, R.A. Modified embedded atom potentials for HCP metals. Model. Simul. Mater. Sci. Eng. 1994, 2, 147–163. [Google Scholar] [CrossRef]
  25. Lee, B.-J.; Ko, W.-S.; Kim, H.-K.; Kim, E.-H. The modified embedded-atom method interatomic potentials and recent progress in atomistic simulations. Calphad 2010, 34, 510–522. [Google Scholar] [CrossRef]
  26. Dremov, V.V.; Karavaev, A.V.; Kutepov, A.L.; Soulard, L.; Elert, M.; Furnish, M.D.; Chau, R.; Holmes, N.; Nguyen, J. Molecular Dynamics Simulation of Thermodynamic and Mechanical Properties of Be and Mg. In Proceedings of the Conference of the American-Physical-Society-Topical-Group on Shock Compression of Condensed Matter, Waikoloa, HI, USA, 24–29 June 2007. [Google Scholar]
  27. Bjorkas, C.; Juslin, N.; Timko, H.; Vortler, K.; Nordlund, K.; Henriksson, K.; Erhart, P. Interatomic potentials for the Be-C-H system. J. Phys. Condens. Matter 2009, 21, 445002. [Google Scholar] [CrossRef]
  28. Dai, X.D.; Kong, Y.; Li, J.H.; Liu, B.X. Extended Finnis–Sinclair potential for bcc and fcc metals and alloys. J. Phys. Condens. Matter 2006, 18, 4527–4542. [Google Scholar] [CrossRef]
  29. Igarashi, M.; Khantha, M.; Vitek, V. N-body interatomic potentials for hexagonal close-packed metals. Philos. Mag. B 2006, 63, 603–627. [Google Scholar] [CrossRef]
  30. Migliori, A.; Ledbetter, H.; Thoma, D.J.; Darling, T.W. Beryllium’s monocrystal and polycrystal elastic constants. J. Appl. Phys. 2004, 95, 2436–2440. [Google Scholar] [CrossRef]
  31. Petzow, G.; Aldinger, F.; Jönsson, S.; Welge, P.; van Kampen, V.; Mensing, T.; Brüning, T. Ullmann’s Encyclopedia of Industrial Chemistry; Wiley-VCH: Hoboken, NJ, USA, 2005. [Google Scholar]
  32. Ming, l.C.; Manghnani, M.H. Isotherma compression and phase-transition in beryllium to 28.3 GPa. J. Phys. F Met. Phys. 1984, 14, L1–L8. [Google Scholar] [CrossRef]
  33. Gordon, P. A High Temperature Precision X-ray Camera: Some Measurements of the Thermal Coefficients of Expansion of Beryllium. J. Appl. Phys. 1949, 20, 908–917. [Google Scholar] [CrossRef]
Figure 1. (a) The atomistic configurations of atoms in a conventional unit cell of the hexagonal closed-packed crystalline structure of Be. (b) The simulation box with dimensions of the 32,000 Be atoms for this MD investigation.
Crystals 13 01330 g001
Figure 2. The lattice constants a (red right y-axis), c/a (blue right y-axis), and the bulk modulus, or B (black left y-axis) of pristine beryllium crystal derived from the MEAM, Finnis–Sinclair, Tersoff type potentials [26,27,29] compared to that from experiments [30,31].
Crystals 13 01330 g002
Figure 3. Normalized volumetric change as a function of pressure derived from MD simulations based on the three tested potentials, MEAM, Finnis–Sinclair (F–S), Tersoff, and compared to that from experiment [32].
Crystals 13 01330 g003
Figure 4. Normalized volumetric change as a function of temperature from MD simulations based on the three types of potentials, MEAM, Finnis–Sinclair (F–S), Tersoff, and that from Exp [33].
Crystals 13 01330 g004
Figure 5. The strain–stress relationship of nine void-embedded beryllium systems (12, 56, 159, 407, 775, 1339, 2114, 3148, and 4505) under tensile tests compared that of pristine beryllium (“0” system). The voids are spheric. The zero void size system (0, grey line) refers to the perfect beryllium lattice used for reference for ease of the comparison. The system size is 32,000 lattice sites. The interatomic potential used is the MEAM potential. The temperature is 300 K.
Crystals 13 01330 g005
Figure 6. Effect of void size of spherical void on the mechanical performance of beryllium subject to uniaxial tension. The nine void-embedded beryllium systems (12, 56, 159, 407, 775, 1339, 2114, 3148, and 4505) are compared to the pristine one (“0”-sized void). (a) Tensile toughness; (b) Young’s modulus; (c) Fracture stress; (d) Fracture strain. The system size is 32,000 lattice sites. The interatomic potential used is the MEAM potential. The temperature is 300 K.
Crystals 13 01330 g006
Figure 7. Effect of temperature on the strain–stress relationship of beryllium subject to uniaxial tension derived from MD simulations. The system size is 32,000 lattice sites. The interatomic potential used is the MEAM potential. The void size is 775 (this number of atoms were removed to form the void).
Crystals 13 01330 g007
Figure 8. Effect of temperature on the mechanical performance of beryllium subject to uniaxial tension derived from MD simulations: (a) Toughness; (b) Young’s modulus; (c) Fracture stress; (d) Fracture strain. The system size is 32,000 lattice sites. The interatomic potential used is the MEAM potential. The void size is 775 (this number of atoms were removed to form the void).
Crystals 13 01330 g008
Figure 9. Microstructures underlying progress derived from MD simulations based on the MEAM type potential: (a) strain–stress relationship and strain–normalized energy relationship; (b) potential energy; (c) stress in the x direction. The system size is 32,000 lattice sites. The void size is 775 (this number of atoms were removed to form the void).
Crystals 13 01330 g009
Figure 10. Effect of size of spherical void on the strain–stress relationship of beryllium subject to uniaxial tension derived from MD simulations based on the Tersoff type potential. The system size is 32,000 lattice sites. The temperature is 300 K.
Crystals 13 01330 g010
Figure 11. Effect of size of spherical void on the mechanical performance of beryllium subject to uniaxial tension derived from MD simulations based on the Tersoff type potential: (a) Toughness; (b) Young’s modulus; (c) Fracture stress; (d) Fracture strain. The system size is 32,000 lattice sites. The temperature is 300 K.
Crystals 13 01330 g011
Figure 12. Effect of temperature on the strain–stress relationship of beryllium subject to uniaxial tension derived from MD simulations. The system size is 32,000 lattice sites. The interatomic potential used is the Tersoff potential. The void size is 775 (this number of atoms were removed to form the void).
Crystals 13 01330 g012
Figure 13. Effect of temperature on the mechanical performance of beryllium subject to uniaxial tension derived from MD simulations based on the Tersoff type potential: (a) Toughness; (b) Young’s modulus; (c) Fracture stress; (d) Fracture strain. The system size is 32,000 lattice sites. The void size is 775 (this number of atoms were removed to form the void).
Crystals 13 01330 g013
Figure 14. Microstructures underlying progress derived from MD simulations based on the Tersoff type potential: (a) strain–stress relationship and strain–normalized energy relationship; (b) potential energy; (c) stress in the x direction. The system size is 32,000 lattice sites. The void size is 775 (this number of atoms were removed to form the void).
Crystals 13 01330 g014
Figure 15. Effect of size of spherical void on the strain–stress relationship of beryllium subject to uniaxial tension derived from MD simulations based on the Finnis–Sinclair type potential. The system size is 32,000 lattice sites. The temperature is 300 K.
Crystals 13 01330 g015
Figure 16. Effect of size of spherical void on the mechanical performance of beryllium subject to uniaxial tension derived from MD simulations based on the Finnis–Sinclair type potential: (a) Toughness; (b) Young’s modulus; (c) Fracture stress; (d) Fracture strain. The system size is 32,000 lattice sites. The temperature is 300 K.
Crystals 13 01330 g016
Figure 17. Effect of temperature on the strain–stress relationship of beryllium subject to uniaxial tension derived from MD simulations based on the Finnis–Sinclair type potential.
Crystals 13 01330 g017
Figure 18. Effect of temperature on the mechanical performance of beryllium subject to uniaxial tension derived from MD simulations based on the Finnis–Sinclair type potential: (a) Toughness; (b) Young’s modulus; (c) Fracture stress; (d) Fracture strain. The system size is 32,000 lattice sites. The void size is 775 (this number of atoms were removed to form the void).
Crystals 13 01330 g018
Figure 19. Microstructures underlying progress derived from MD simulations based on the Finnis–Sinclair type potential: (a) strain–stress relationship and strain–normalized energy relationship; (b) potential energy; (c) stress in the x direction. The system size is 32,000 lattice sites. The void size is 775 (this number of atoms were removed to form the void). The temperature is 300 K.
Crystals 13 01330 g019
Figure 20. Strain–stress relationship of beryllium subject to uniaxial tension derived from MD simulations based on the three types of potentials: MEAM (black), Tersoff (red) and Finnis–Sinclair (blue). The system size is 32,000 lattice sites. The void size is 775 (this number of atoms were removed to form the void). The temperature is 300 K.
Crystals 13 01330 g020
Figure 21. Comparison of three potentials on the mechanical performance of beryllium subject to uniaxial tension derived from MD simulations: (a) Toughness; (b) Young’s modulus; (c) Fracture stress; (d) Fracture strain. The system size is 32,000 lattice sites. The void size is 775 (this number of atoms were removed to form the void). The temperature is 300 K.
Crystals 13 01330 g021
Disclaimer/Publisher’s Note: The statements, opinions and data contained in all publications are solely those of the individual author(s) and contributor(s) and not of MDPI and/or the editor(s). MDPI and/or the editor(s) disclaim responsibility for any injury to people or property resulting from any ideas, methods, instructions or products referred to in the content.

