Article

Negative Linear Compressibility of Formate Crystals from the Viewpoint of Quantum Electronic Pressure

by
Yury V. Matveychuk
1,*,
Sergey A. Sobalev
1,
Polina I. Borisova
1,
Ekaterina V. Bartashevich
1 and
Vladimir G. Tsirelson
1,2
1
Research Laboratory of Multiscale Modelling of Multicomponent Functional Materials, South Ural State University, 454080 Chelyabinsk, Russia
2
Quantum Chemistry Department, D.I. Mendeleev University of Chemical Technology, 125047 Moscow, Russia
*
Author to whom correspondence should be addressed.
Crystals 2023, 13(7), 1147; https://doi.org/10.3390/cryst13071147
Submission received: 30 June 2023 / Revised: 14 July 2023 / Accepted: 18 July 2023 / Published: 23 July 2023

Abstract

:
In order to understand the phenomenon of negative linear compressibility (NLC) in organic crystals, it is necessary to investigate not only the structural features but also the electronic changes taking place under external hydrostatic pressure. It is also necessary to clarify which electronic properties allow the quantification and comparison of the compressibility of crystals. In our study, the crystal structures of sodium and cadmium formates under hydrostatic compression were modeled, as well as the α and β-phases of calcium formate. The changes in cell parameters and spatial dependences of the linear compressibility were analyzed, and the ranges of external pressure, which must be applied for NLC onset, were predicted for the sodium and α-calcium formates. Although the behavior of chemical bonds is not predicted by the sign or absolute value of the quantum electronic pressure, its relative change under external pressure clearly distinguishes the soft and rigid regions in a crystal. The relationship between the NLC values and the changes in quantum electronic pressure in the cavities of formate crystals was established.

1. Introduction

Previously, when exploring the useful and unique physico-chemical properties of newly synthesized crystalline materials, researchers had little concern for their mechanical characteristics. The features of mechanical behavior can both lead to a narrowing of the opportunities for the practical application of these unique properties and open up new prospects for their application, such as increasing the sensitivity of pressure and strain sensors [1]. Therefore, in the last few years, attention to the features of the mechanical behavior of single crystals has intensified, as well as to the relationships between these properties and structural characteristics. The focus is on the nature of unusual mechanical properties, such as negative linear compressibility (NLC), the interest in which has increased significantly, both in theoretical studies and in solutions to practical problems.
Most solids contract in all directions when subjected to hydrostatic compression [2]. However, under compression, a number of crystalline materials exhibit a unique mechanical behavior called negative linear compressibility (NLC). In a certain range of increasing external pressure, they expand in one or more spatial directions. This unusual behavior is caused by the features of the crystal structure, which resists external stresses differently in various directions. Note that the negative volume compressibility, that is, expansion in all directions simultaneously, is forbidden thermodynamically [2].
We point out that besides crystalline structures, the NLC phenomenon can be observed in other common materials: polymers, certain types of paper and wood, carbon-fiber laminates [3], and biological materials [4]. In recent decades, there has been a breakthrough in the search for materials with NLC [5,6], with the aim of producing artificial muscles, microscopic pressure sensors, and nanoscale actuators controlled by a simple increase in pressure [1].
With regard to single crystals, it has been shown [4] that their percentage with the manifestation of NLC is about 2.5% in the selection containing 500 non-cubic crystalline phases, of which almost half are orthorhombic phases. A specific feature of these crystals is their frame structure, like a “wine-rack” or “honeycomb” [7]. The NLC effect also appears in structures consisting of several types of helical chains: single helices, oppositely wound helices, and networks of interconnected left- and right-handed helices [3]. The fact that the rhombic (hexagonal) lattice is theoretically able to manifest NLC has been known for a long time [8]. A study of different forms of 2D and 3D lattices with this property has also been published [9]. The authors showed that NLC can be discovered in a body-centered or face-centered tetragonal network of nodes connected by a network of beams. The NLC’s phenomenology is reviewed in [1], with particular attention to structural motifs, and the mechanistic concept of the NLC effect is presented, which can determine a clear strategy for the development of materials with a stable manifestation of this effect.
The NLC phenomenon has been extensively studied in the crystals of various phases of oxalates and oxalic acid. In particular, it has been shown by calculations [10] that the unusual mechanical behavior of zinc, cadmium, and lead oxalates is directly related to the instability of their structures, displacements of the structural motifs and sheets, and phase transitions when external uniaxial pressure is applied. At the same time, the experimentally confirmed appearance of NLC in the silver oxalate crystals [11], which do not have clear-cut 1D or 2D structural motifs, is caused by variations of silver coordination polyhedra [12]. It has been shown [13] by calculations that oxalic acid dihydrate crystals exhibit significant NLC. It has been determined [14] that both the dihydrate and two forms of anhydrous oxalic acid crystal manifest the NLC phenomenon in the direction in which the minimal Poisson’s ratio under pressure is also determined. The NLC phenomenon has also been observed [15,16] in the crystals of cyclic croconic acid, which have highly anisotropic mechanical properties and phase-transition capability at a relatively low (~1 GPa) pressure. The analyses of the changes in oxalate crystal structures as a function of pressure carried out in these studies showed that the NLC mechanism is not necessarily determined by the presence of a “wine-rack” type structure but is caused by the structure’s adaptation to external compression through the changes in the bonds set in the crystals, including weak noncovalent interactions and phase transitions.
Over the last few years, studies of the NLC phenomenon have become more versatile. In particular, the row of chemical compounds exhibiting NLC has been expanded, primarily due to metal–organic frameworks [17], perovskites [18], and microporous materials with large void channels [19]. Furthermore, in addition to negative compressibility, zero linear compressibility began to be investigated thoroughly. For example, the Li2Ti(IO3)6 gear–spring-type structure was studied [20]. In addition to the determination of the general structural reasons for this phenomenon and the identification of the structural elements responsible for the crystal expansion in one direction under hydrostatic compression [21], other important details have been determined. One example is the study of the reentrant NLC [22] or emerged NLC [23] at a continuous increase in external pressure. The disappearance of NLC under certain pressure and its reappearance in the range of higher compression made it possible to reveal a hidden structural/electrical-phase transition.
In the review [4], the authors have considered various crystals with NLC; the normalized maximum and minimum values of linear compressibility have been given based on the experimentally determined stiffness tensors. Among the noted crystals, there are the orthorhombic α-phase of calcium formate, and cadmium formate, which show high NLC values. For the α-phase of calcium formate (space group Pcab), it has been previously noted that it consists of chains formed by cations bound by the formate carboxylate groups [24]. These fragments form pleated layers [25]. Such a structure initially assumes highly anisotropic physical properties, including mechanical ones. The crystal structure of the β-phase of calcium formate (space group P41212) [26] is significantly different. The crystal consists of two orthogonal endless chains of formate anions and calcium cations, which are oriented along the a and b axes and cross-linked through calcium cations. There are no data on the possible manifestation of NLC for the β-phase crystals of calcium formate. The described [27] atomic structure of cadmium formate (space group C2/c) consists of strips along the a-axis, formed by cations and formate groups, which are cross-linked by the formate anions in the orthogonal direction along the c-axis. Such a structure can also be the reason for the high anisotropy of physical properties.
For the sodium formate crystals (space group C2/c) [28], the features of structural anisotropy have also been noted earlier: namely, they manifest the layered structure. In this crystal, in addition to various cation interactions, there are weak C–H…O bonds in the layer-forming motifs of the formate anions. The contradictory data on the possibility of phase transitions in this crystal at room temperature in the range of external pressure up to 6 GPa have been presented earlier. For example, it has been shown [29] that the sodium formate crystals exhibit two phase transitions at 0.5…1.1 and 2.3 GPa. In paper [30], three phase transitions up to 4.9 GPa have been described. In both cases, conclusions have been made on the basis of the IR and Raman spectroscopic data. However, in [31], high-pressure XRD experiments up to 6 GPa have been carried out for the determination of structural stability and equation of state, which did not reveal the previously described phase transitions.
Thus, the objects and methods for the study of the NLC phenomenon considered so far represent qualitative causes and mechanisms for the manifestation of crystal expansion in one or more spatial directions under external hydrostatic compression as a whole. However, there is a drawback in the methodology for estimation and comparison of the NLC effects: namely, predominantly phenomenological explanation of this effect by specific structural features and crystal motifs, without any detailed consideration of the following changes in crystals at the increase in external compression, such as the certain chemical bonds that form the motifs with the highest resistance to external stresses, at the macroscopic level, and the electron density functions in the regions elongated along the directions of the manifestation of NLC at the microscopic level. That is why, in the present paper, we aim to establish what the reference to the level of quantum chemical characteristics and electronic properties of crystals can yield for studying the nature of NLC. To carry this out, we have analyzed the features of changes in the electron density under increasing compression and the inner-crystal quantum electronic pressure p(r) [32,33] that depends on it. This function describes the change in the average internal energy of the electron continuum unit volume under local deformation, which changes this volume but not its shape [32]. At the equilibrium, the electrostatic forces in the electronic continuum, corrected together with electron exchange, compensate for the kinetic forces associated with electron movement. The electrostatic field of nuclei and electrons at every point is considered an external field. The quantum terms, such as the kinetic and exchange-correlation contributions to stress tensor, are expressed in terms of the DFT functionals [34]. The influence of instantaneous electron correlation is much weaker than the exchange contribution [33]; therefore, it is considered negligible.
The quantum local pressure p(r) in the electronic continuum may be determined as [32]
p r = 2 3 g r 1 4 2 ρ r 1 4 3 π 1 3 ρ ( r 4 3 .
The first two terms in (1) describe the kinetic contribution to the local pressure; g(r) is the positively defined electron density for kinetic energy [35]. We approximate these terms according to Rodger and Rappe [36]. The third term stems from the electron exchange contribution in the local density approximation [33]. It is clear from (1) that p r can be of negative value in the regions in which 2 ρ r > 0 and the electron density reaches appropriate values. It is a pure quantum phenomenon.
For covalent bonds, p(r) > 0, which means an increase in internal electron energy in these regions under compression of a crystal. For noncovalent interactions and in intermolecular space, p(r) < 0, as a rule. Since external hydrostatic compression mainly leads to molecules becoming closer, the change of the electron continuum in the intermolecular space may serve as a descriptor suitable for the characterization of mechanical properties. The negative pressure indicates the regions in which the quantum contribution to the local internal energy of the electron continuum decreases in order to compensate for the stress that increases under external compression. Thus, p(r) can increase or decrease locally, depending on the nature of external deformation.
We have traced the trends of the changes in quantum electronic pressure at the critical points of electron density p(rcp) under external compression of a crystal. They depend not only on the orientation of noncovalent bonds with respect to the compressibility axes of a crystal but also on their type. For the Hal…Hal halogen bonds, as a rule, the quantum electronic pressure has lower negative values than for van der Waals interactions, which shows a larger potential of their compensatory ability under deformation. We can also observe greater sensitivity of the halogen bonds to external compression and greater susceptibility to the change under increasing hydrostatic pressure [37,38]. The usability of the p(r) function for the estimation of mechanical properties and their changes under pressure has previously been shown in the examples of magnesium diboride [39], as well as the series of isostructural crystals of hexahalobenzenes [37], dihalides, and trinitrohalomethanes [38]. It has been found that the largest compliance of a crystal is observed in the directions in which the extended regions of negative p(r) are oriented, and the regions with positive p(r) resist external stresses to the greatest extent. It has been shown for hexahalobenzenes that the more p(r) changes value under compression, the greater the possibility that the crystal has plastic properties. An explanation of the role of Hal3-synthons [37] has been provided: the “soft” halogen bonds form the “hard” spatial frame in crystals.
The comparison of crystals with the obviously layered structural organization, such as dihalides and magnesium diboride, has shown that the axis of the largest linear compressibility, LCmax, is oriented orthogonally to the layered motifs, as a rule. At the same time, the direction of the maximal uniaxial compressibility axis, UCmax, is related to the type and character of noncovalent interactions in the interlayer space. With the increase in hydrostatic compression, the axes of minimal and maximal compressibility retain their orientation in relation to the layered motifs, though the orientation of the axes can be slightly different in the series of dihalides and hexahalobenzenes [37,38].
In order to understand the nature of the NLC effect, it is necessary to investigate which electron density features allow quantifying NLC and which of them are suitable for the prediction of this phenomenon. This is the aim of the present study. We have chosen the set of crystals of calcium, cadmium, and sodium formates for the solution of the formulated problems.

2. Materials and Methods

All calculations were carried out by the Kohn–Sham method with periodic boundary conditions using the CRYSTAL17 (v.1.0.2) software package [40] for all considered structures of crystals. The initial structural data were taken from experimental cif-files presented in the CSD database [41] with refcodes: NAFORM06 for sodium formate (Na+fmt) (C2/c), CAFORM for the α-phase of calcium formate (α-Ca2+fmt) (Pcab), CAFORM05 for the β-phase of calcium formate (β-Ca2+fmt), (P41212), and ZZZSGO01 for cadmium formate (Cd2+fmt) (C2/c). The PBE0 functional and the dou_1998 [42] all-electron basis sets on cadmium atoms and the pob-DZVP_rev2 [43] basis set on all other atoms were used in the calculations. The results of modeling the equilibrium state of the crystals are given in Table S1 (see Supplementary Materials). The HSE06 functional was also tested for the α-phase of calcium formate crystal. Despite the comparable RMSD (0.189 Å for HSE06 and 0.191 Å for PBE0), the calculation time using HSE06 increased by a factor of about 2. Therefore, only the PBE0 functional was used in further calculations. In addition, the pseudopotential (ECP) pob-DZVP [44] basis set for the Cd was tested for the calculation of equilibrium structure and stiffness tensor of cadmium formate crystals. It should be noted that the calculations using full-electron basis sets were analyzed further in order to unify and compare mechanical and electronic characteristics of all crystals.
At first, the complete optimization of atomic coordinates and cell parameters was carried out. In this case, the following convergence parameters were used: on energy in SCF cycle 10−10 a.u., on gradient 10−5 a.u., and on displacement 3 × 10⁻⁵ a.u.; the cutoff criteria for two-electron integrals were 14, 14, 14, 14, and 24 (TOLINTEG option). Then, the calculation algorithm for the stiffness tensor described in [45] (ELASTCON option) was applied with the following convergence parameters: on energy in SCF cycle 10−8 a.u., on gradient 5 × 10⁻⁵ a.u., and on displacement 10−4 a.u. The deformation of crystalline structures under external compression was also simulated with the complete relaxation of atomic coordinates and cell parameters (EXTPRESS option, [46]). It should also be noted that we performed the additional calculations of the Na+fmt crystals with the removal of all symmetry operators of C2/c space group (SUPERCON and SYMMREMO options) to check the possibility of rearranging the structure to another space group (the possibility of a phase transition) under increasing pressure. These calculations showed complete agreement with the calculation results in the C2/c space group for the considered range of pressure values. The maximal RMSD value in the series was 0.001, which confirmed the absence of the possibility of structural rearrangement in the sodium formate crystals within the applied modeling level.
The online tool ELATE [47] was used to obtain the eigenvalues of the stiffness tensor, the spatial dependences of elastic moduli with information about the minimal and maximal values of linear compressibility, as well as the directions of Cartesian axes in which those extreme values were observed. Some obtained mechanical characteristics of the equilibrium state crystals are given in Table S2, and the spatial dependences are shown in Figures S1 and S2. The mechanical stability of all structures was estimated from the eigenvalues of stiffness tensors. All structures manifested positive eigenvalues that corresponded to the stability criterion [48]. Visual representation of fragments of the crystalline structure and RMSD calculation were carried out using the Chemcraft software [49]. The spatial axes of the maximal and minimal values of linear compressibility, calculated in ELATE online tool, were visualized with the help of the “Add custom vectors and planes” Chemcraft option.
The analysis [50] of electron density calculated on the basis of the obtained electron wave functions (CRYSTAL17) was performed using the TOPOND program [51]. The distributions of electron density, ρ(r), its gradients, and positively definite kinetic energy density, g(r), were calculated to estimate the behavior of the quantum electronic pressure, p(r). For estimation of the density of kinetic energy along the interatomic line, we used the generalized Kirzhnitz gradient approximation [52]. The quantum electronic pressure, p(r), [33] was considered along the directions parallel to the axes of minimal and maximal linear compressibility; wherein its changes during simulated external compression of crystals were analyzed. The contour maps of p(r) were built in the planes informative for that analysis. The changes of the additive characteristics obtained by summation over cell of the p(rcp) values at critical points of electron density with different signatures were also considered.

3. Results and Discussion

3.1. Features of Linear Compressibility of the Formate Crystals at Hydrostatic Compression

For the optimized structure of the α-phase of calcium formate crystal (α-Ca2+fmt), the axis of minimal linear compressibility (negative linear compressibility), LCmin (NLC), is oriented along the crystallographic axis a. This means that one should expect an increase in distances inside the “pleated layer”, parallel to the a-axis, under slight hydrostatic compression of the crystal. For the sodium formate crystal (Na+fmt), the direction of the NLC axis is oriented closely to the direction of the a-axis, whereas for the cadmium formate crystal (Cd2+fmt), the direction of the NLC axis is oriented at significant angles to the a (37°) and c (25°) axes, and coplanar to the a0c plane. From the obtained spatial dependences of linear compressibility, it follows that the maximal compressibility axes, LCmax, are oriented along the b-axis for α-Ca2+fmt and Na+fmt. These observations coincide with the experimental data [4] for α-Ca2+fmt. It has been established [31] that higher compressibility is observed along the b and c axes compared to the a-axis for Na+fmt, which also corresponds to our data.
The normalized calculated extreme values of linear compressibility, LCminN and LCmaxN for α-Ca2+fmt and Cd2+fmt are quite close to the experimental ones [4] but with an underestimation of the NLC values (Table S2). It is worth noting that the NLC value obtained using the pob-DZVP basis set (LCminN = −0.11) for Cd2+fmt is closer to the experimental value (LCminN = −0.26). Also, the use of this basis set yielded a slightly better estimation of the parameters a, c, and RMSD of the Cd2+fmt unit cell (Table S1). Nevertheless, the direction of the NLC axis does not change compared to the calculations with an all-electron basis set and does not coincide with the direction obtained from the experimental stiffness tensor; that is, this basis set does not significantly improve the structural model. Therefore, we refused further consideration of the results with the ECP basis set due to the impossibility of correct comparison of electronic functions with the results of calculations using full-electron basis sets.
The spatial dependences of linear compressibility are shown in Figures S1 and S2. We can see that for the considered crystals, the NLC phenomenon appears in rather narrow (~1–2°) sectors of directions. The negative values of the Poisson ratio for α-Ca2+fmt (−0.15) and Cd2+fmt (−0.08), determined from the calculated stiffness tensors, correspond to the experimental data [4]. Thus, our estimations of the directions of the axes and the values of elastic moduli correspond reasonably to the known experimental data.
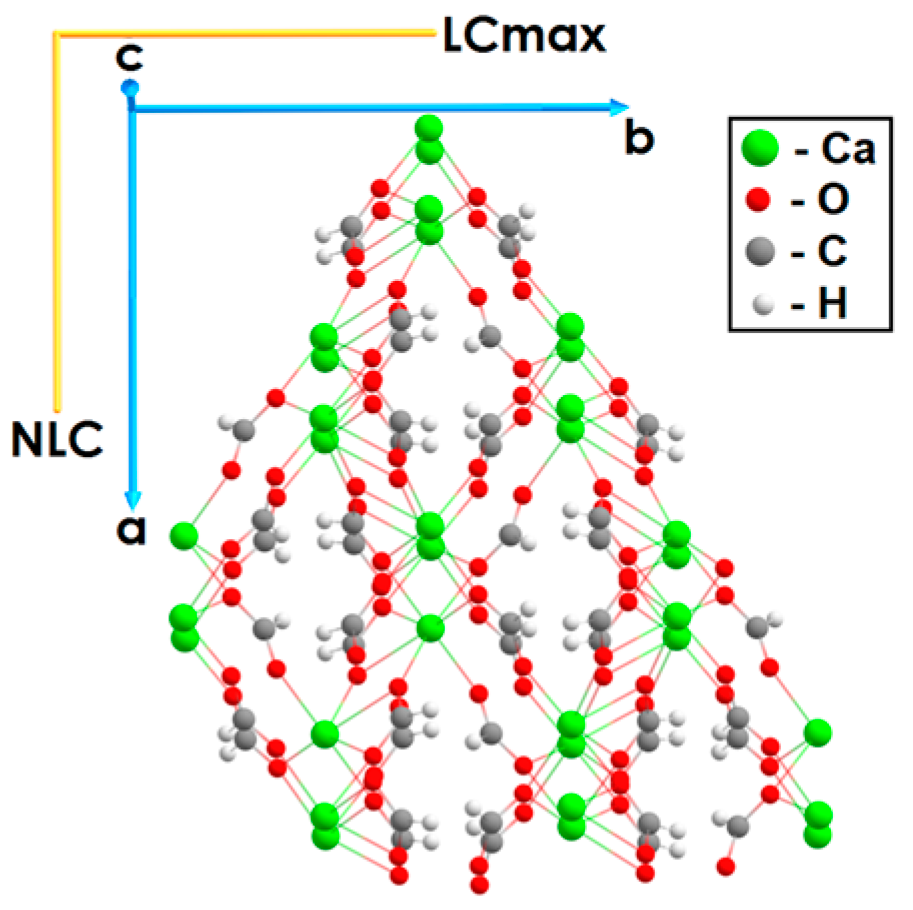
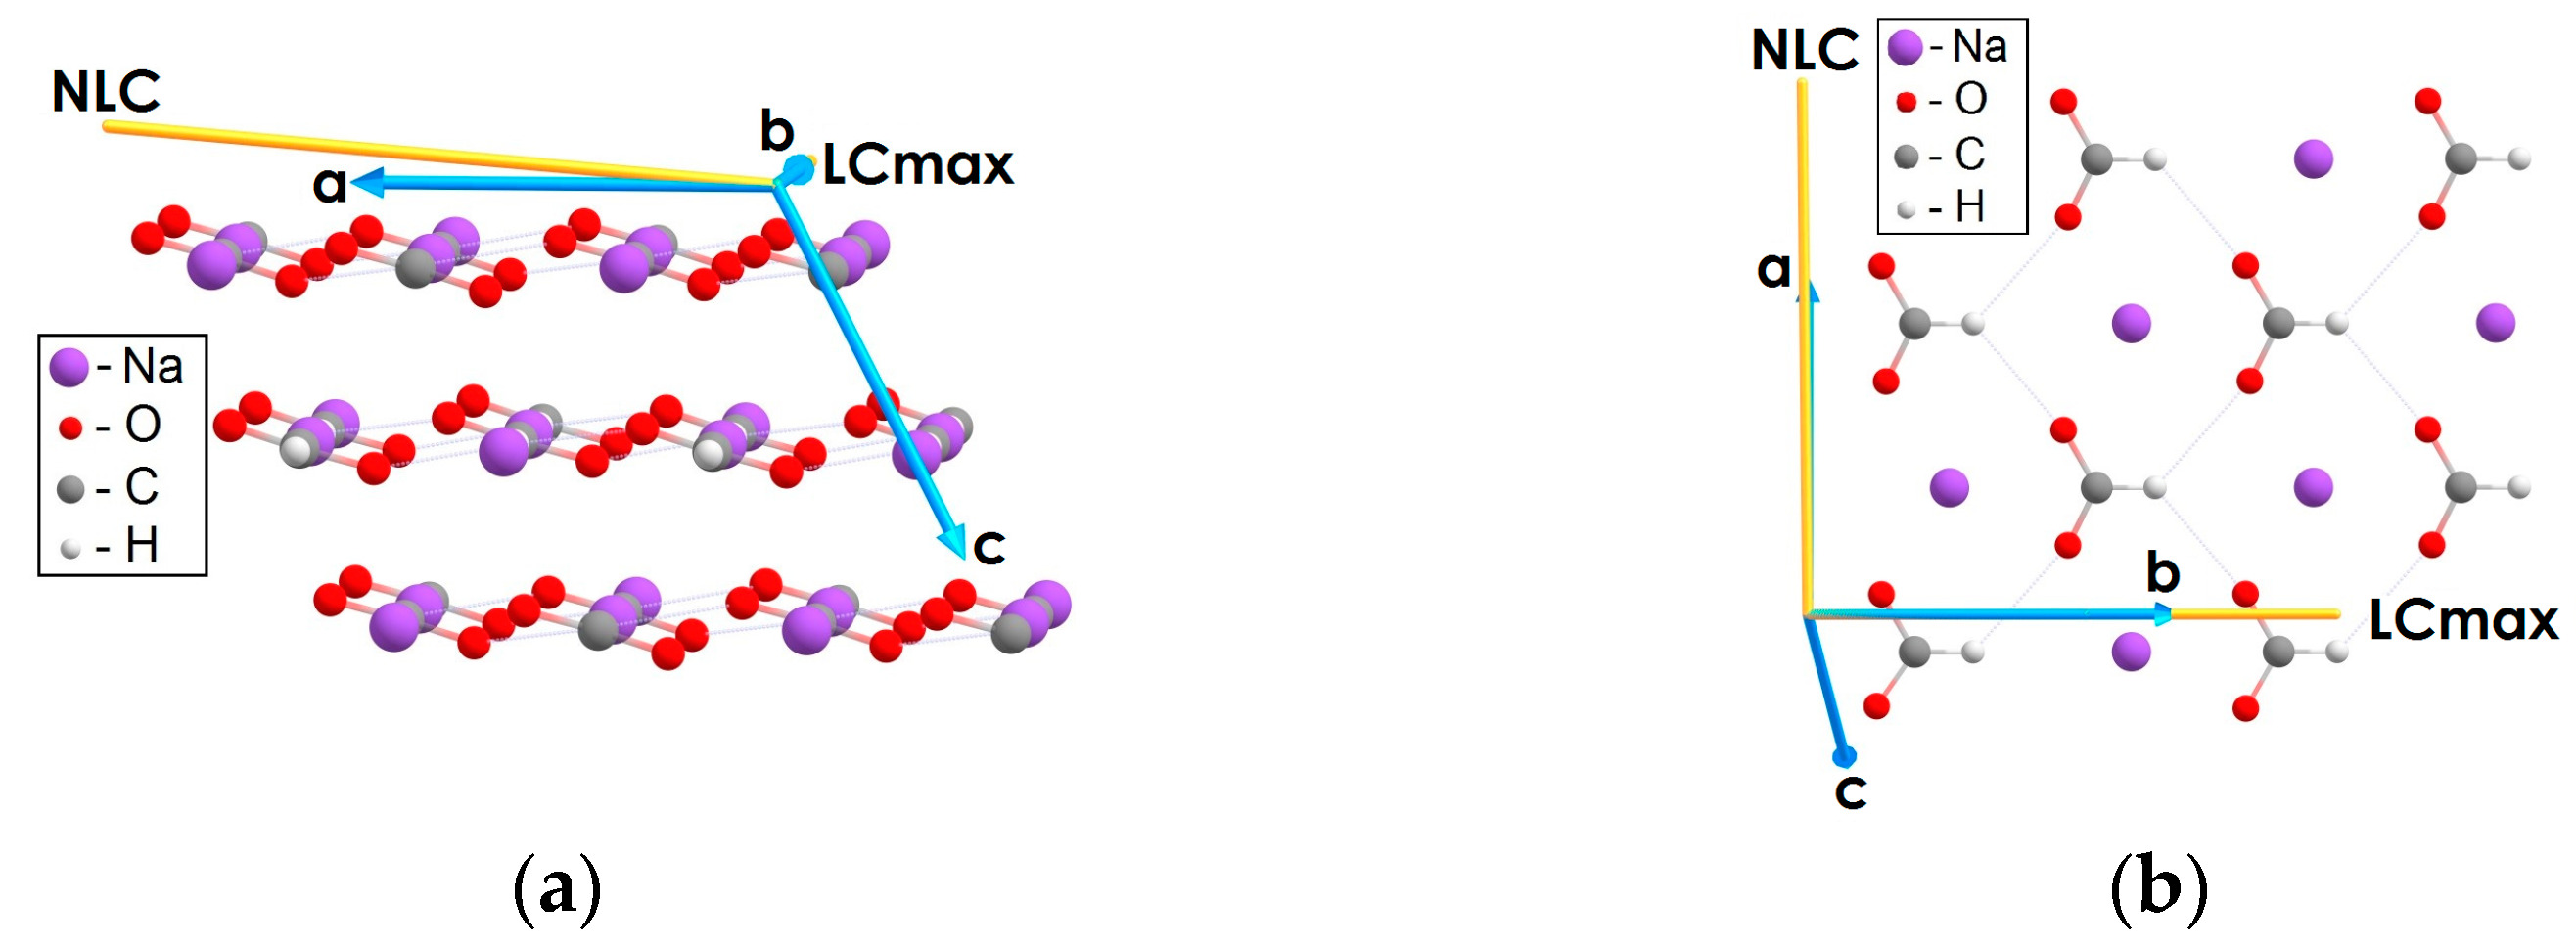
As stated above, the α-Ca2+fmt crystal manifests evident softness along the b-axis under isotropic compression in the orthogonal direction to the “pleated layers” formed by the intersected double chains (Ca2+…OCO…Ca2+) (Figure 1). As the layers converge, the angle between “pleats” increases, and this is associated with a simultaneous expansion along the a-axis. In other words, the LCmax axis is oriented along a short diagonal of the “pseudo-rhombic” void channels, which are clearly visible in the projection of crystalline structure on the a0b plane (Figure 1). The NLC axis is oriented along the long diagonal of these “pseudo-rhombic” channels, which elongates under the compression of the crystal. The Ca2+ cations and the small planar formate anions respond differently to hydrostatic compression. The cations located in neighboring positions and on the line along LCmin do not converge under compression, as a rule, forming a peculiar “rigidity frame”, while the formate anions are more easily tilted and displaced. In this case, the C–H…O hydrogen bonds, oriented around the direction of the LCmax axis, are the most susceptible to changes under compression. When α-Ca2+fmt is compressed, the C–H fragment of formate can “wedge” between the neighboring (along the a-axis) Ca2+ cations, leading to crystal expansion in this direction.
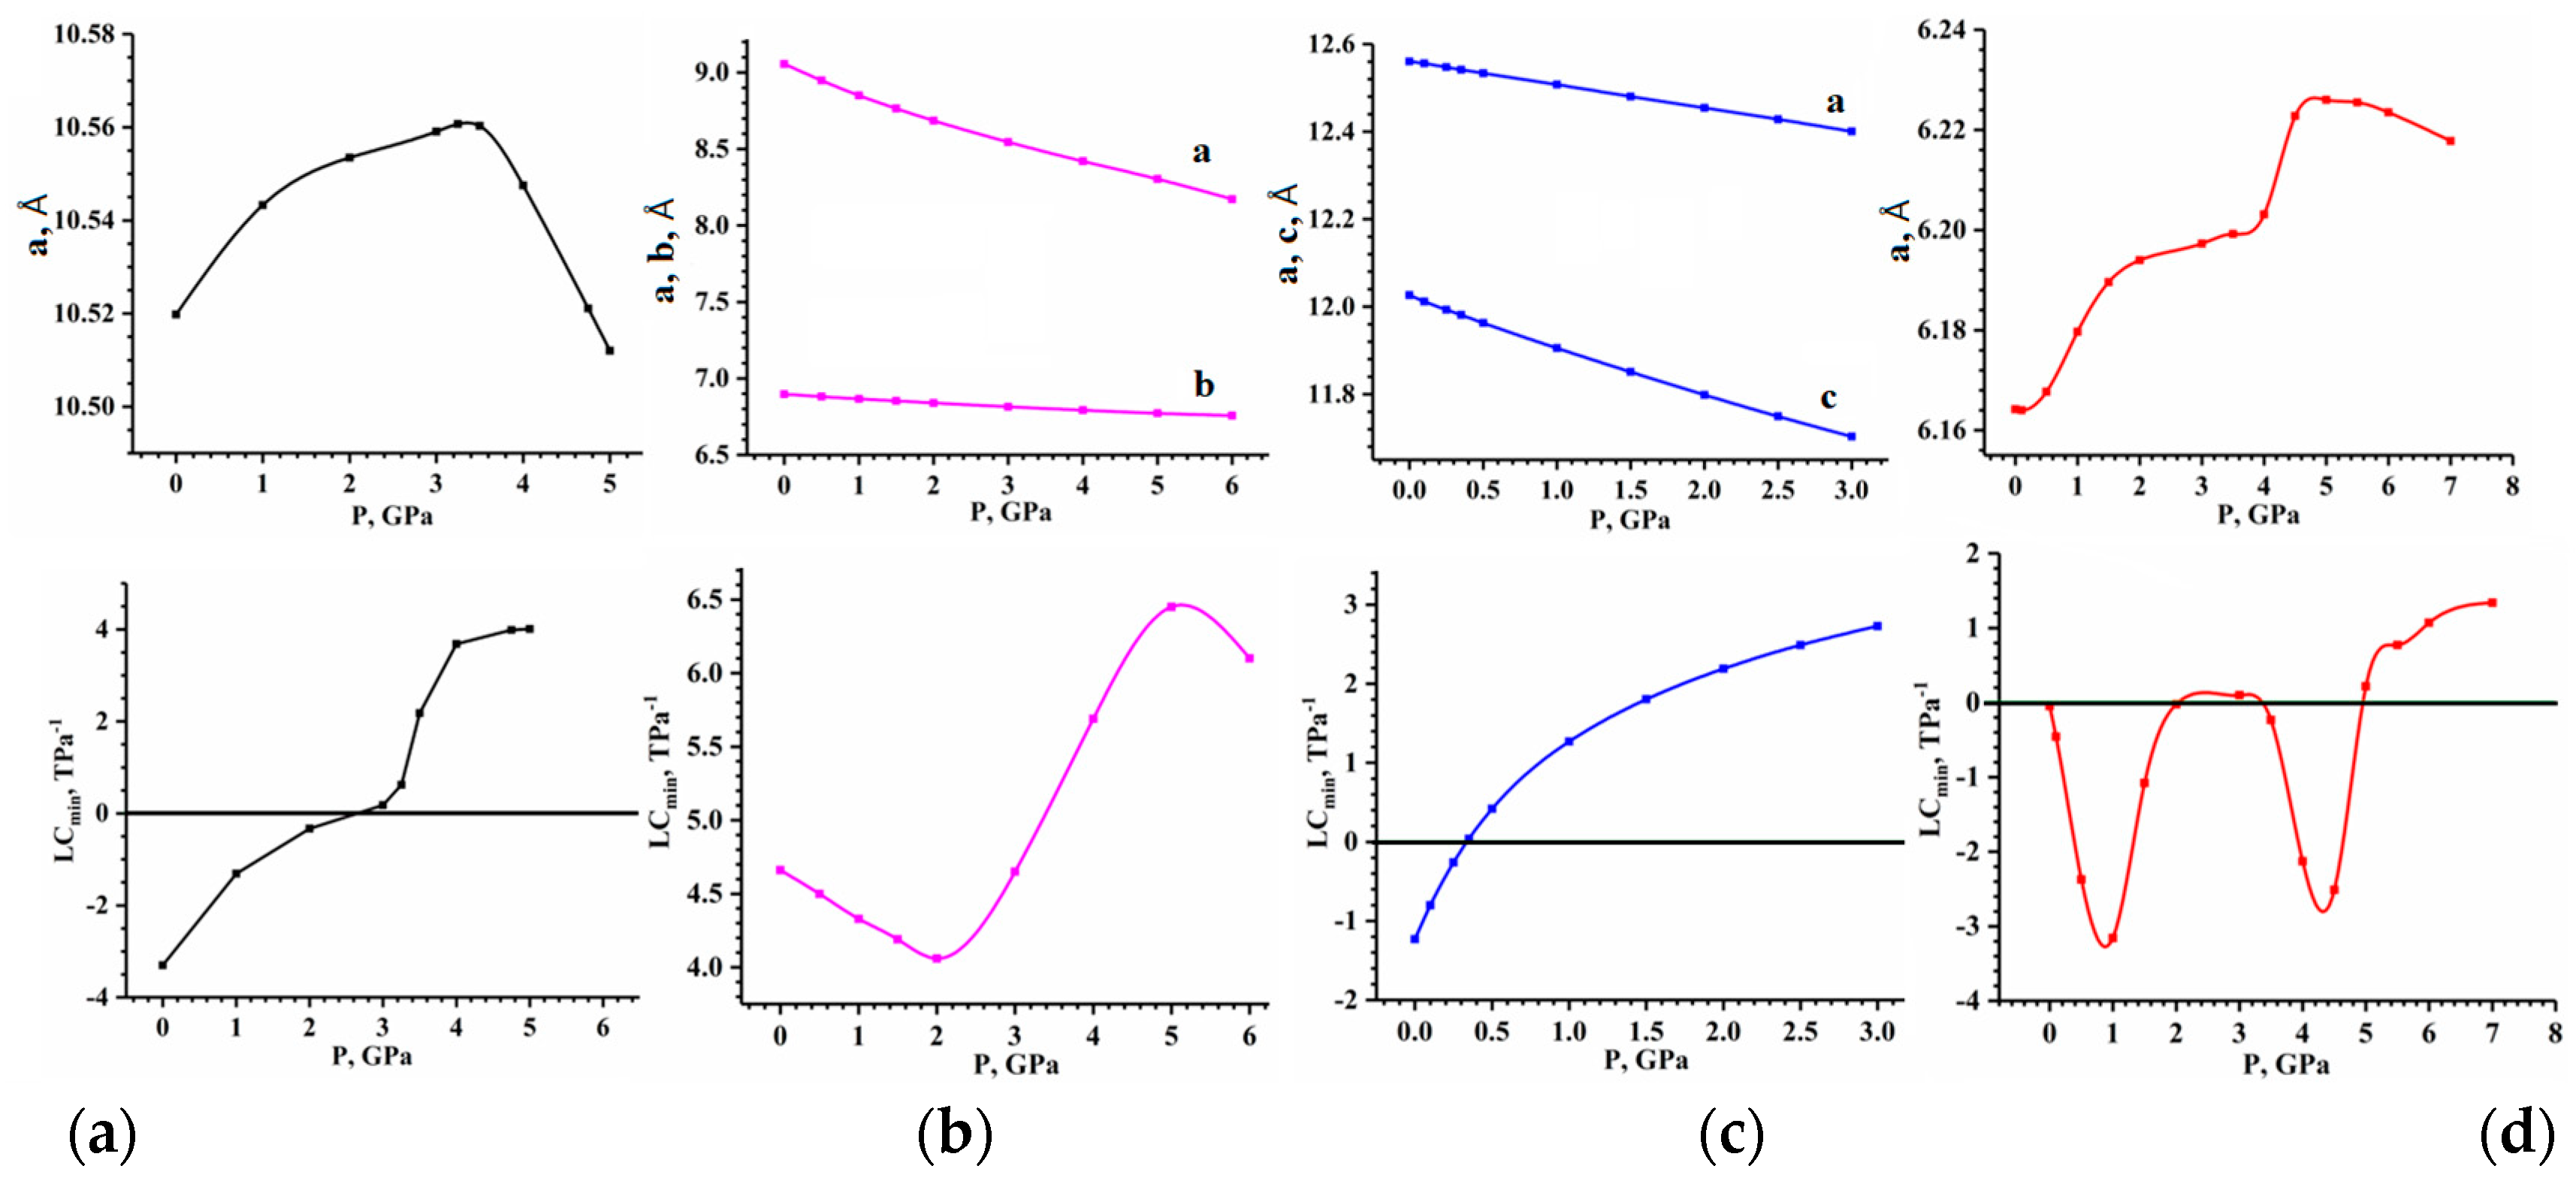
In our study, we have identified the NLC effect under hydrostatic compression being modeled in two ways. Firstly, the change of crystallographic cell parameters under increasing pressure has been monitored; secondly, the values of linear compressibility have been determined from the calculated stiffness tensors, corresponding to the structures of crystals at certain pressure values, incrementally increasing. For α-Ca2+fmt, the change in length of the a-axis is shown in the simulated pressure range from 0 to 5 GPa (Figure 2a). The maximal length of the a-axis has been noted at about 3.25 GPa. This means that the NLC effect might be manifested in the pressure range 0…3.25 GPa. At the pressure above 3.25 GPa, the response of the α-Ca2+fmt structure to compression appends a rotation move of one formate group to the synchronic shift of all elements of the structure. However, the calculated LCmin values indicate (Figure 2a and Table S4) that the manifestation range of NLC is limited by the pressure value of about 2.6 GPa. It is notable that the shape of spatial dependence of linear compressibility does not fundamentally change under compression (Figure S3): the orientation of the LCmax axis remains along the b-axis, while the direction of the LCmin axis remains along the a-axis. At that, the anisotropy of linear compressibility decreases rather sharply (Table S4).
For β-Ca2+fmt, not exhibiting the NLC phenomenon, the calculated stiffness tensors and the change trends of cell parameters under increasing pressure have shown the absence of negative values of linear compressibility in the entire range of simulated compression of a crystal (0…6 GPa, Figure 2b). The LCmax axis with the LC value 26.13 TPa−1 is observed along the c-axis (Figure 3) in the equilibrium state, and this direction does not change under increasing external pressure. The LCmin axis is coplanar to the a0b plane at an angle of about 15° to the b-axis. As the pressure increases, the direction of the LCmin axis changes somewhat but remains coplanarly oriented to the a0b plane. The anisotropy of linear compressibility decreases monotonously under increasing compression.
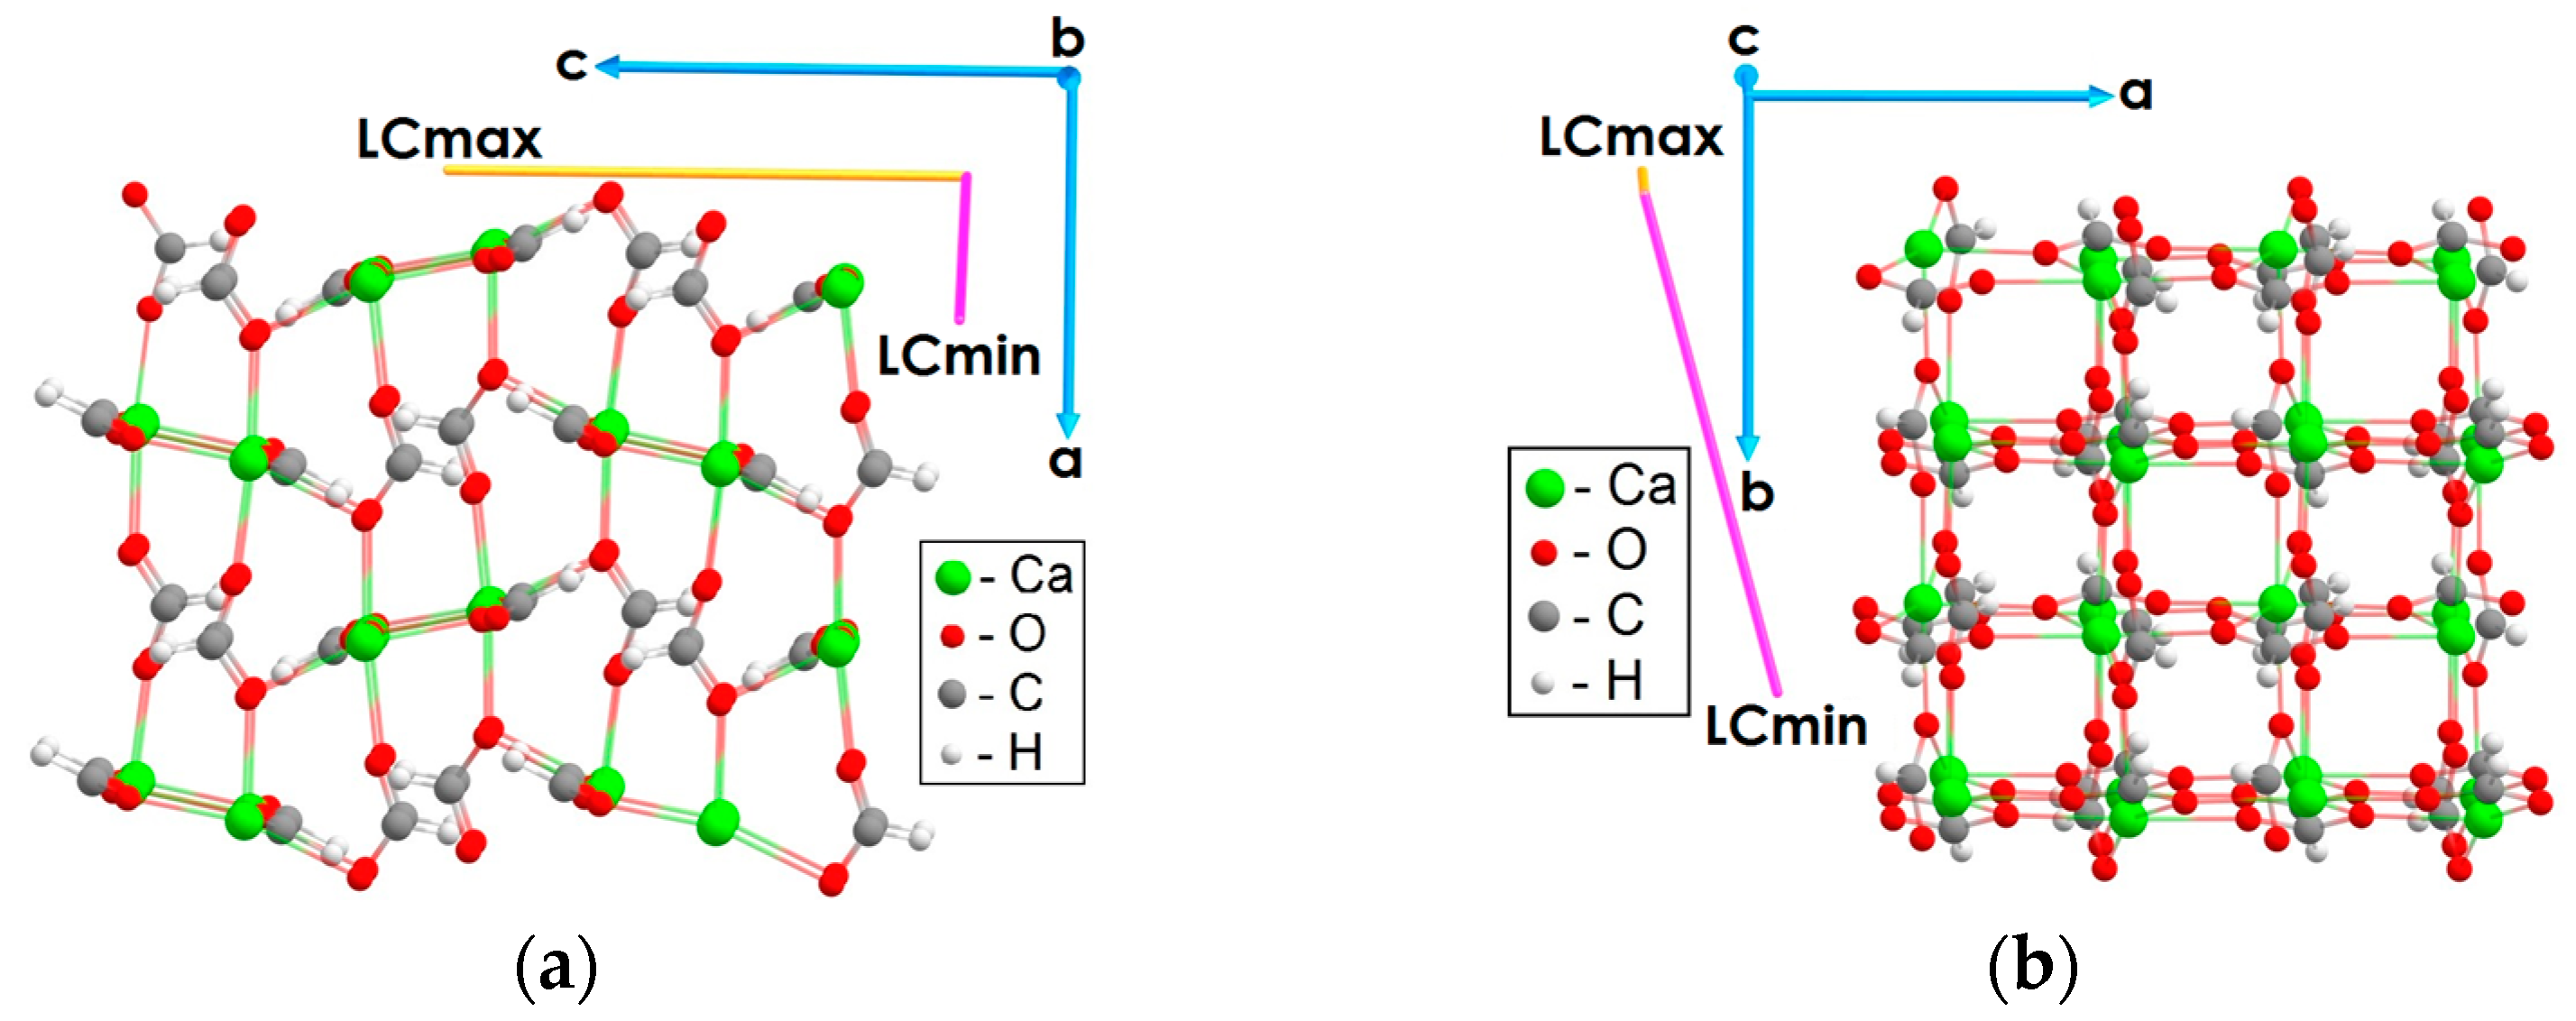
For Cd2+fmt, different spatial dependences of linear compressibility are observed (Figure S2). The axis of maximal resistance to hydrostatic compression (LCmin or NLC) does not coincide with any crystallographic axis, and it is coplanar to the a0c plane and oriented at an angle to the directions of both strip motifs consisting of double chains (Cd2+…OCO…Cd2+), similar to those in α-Ca2+fmt, and the formate chains connecting these motifs (Figure 4). On the other hand, the direction of NLC is at an angle of only 6° with the long diagonal of the “pseudo-rhombic” void channel, which is also similar to the same channel in α-Ca2+fmt. However, due to a different symmetry of the Cd2+fmt void channel, the expansion of this crystal along the long diagonal of the void channel is not manifested in such a way when the crystal is compressed. This is reflected in the lower value of NLC and the smaller pressure range of the NLC effect, as can be seen from the calculated stiffness tensors (Table S8). The direction of the LCmax axis is at a small angle, about 10⁰, with the short diagonal of the void channel, also similar to α-Ca2+fmt (Figure 1 and Figure 4).
In Cd2+fmt, the values of all cell parameters decrease monotonously in the entire compression range (0…3 GPa, Figure 2c), starting from 0.1 GPa. On the one hand, such an absence of the manifestation of NLC is possible due to a large angle of the NLC axis to the crystallographic axes. On the other hand, according to the calculated stiffness tensors, we have noted that Cd2+fmt exhibits the narrowest (among three considered crystals with the NLC effect) range of hydrostatic compression, in which the NLC phenomenon is observed: up to as little as 0.25 GPa, and the smallest values of NLC (Table S8). The common structural feature of α-Ca2+fmt and Cd2+fmt, namely, the “pseudo-rhombic” void channel, determines their similar mechanical behavior, albeit to varying degrees.
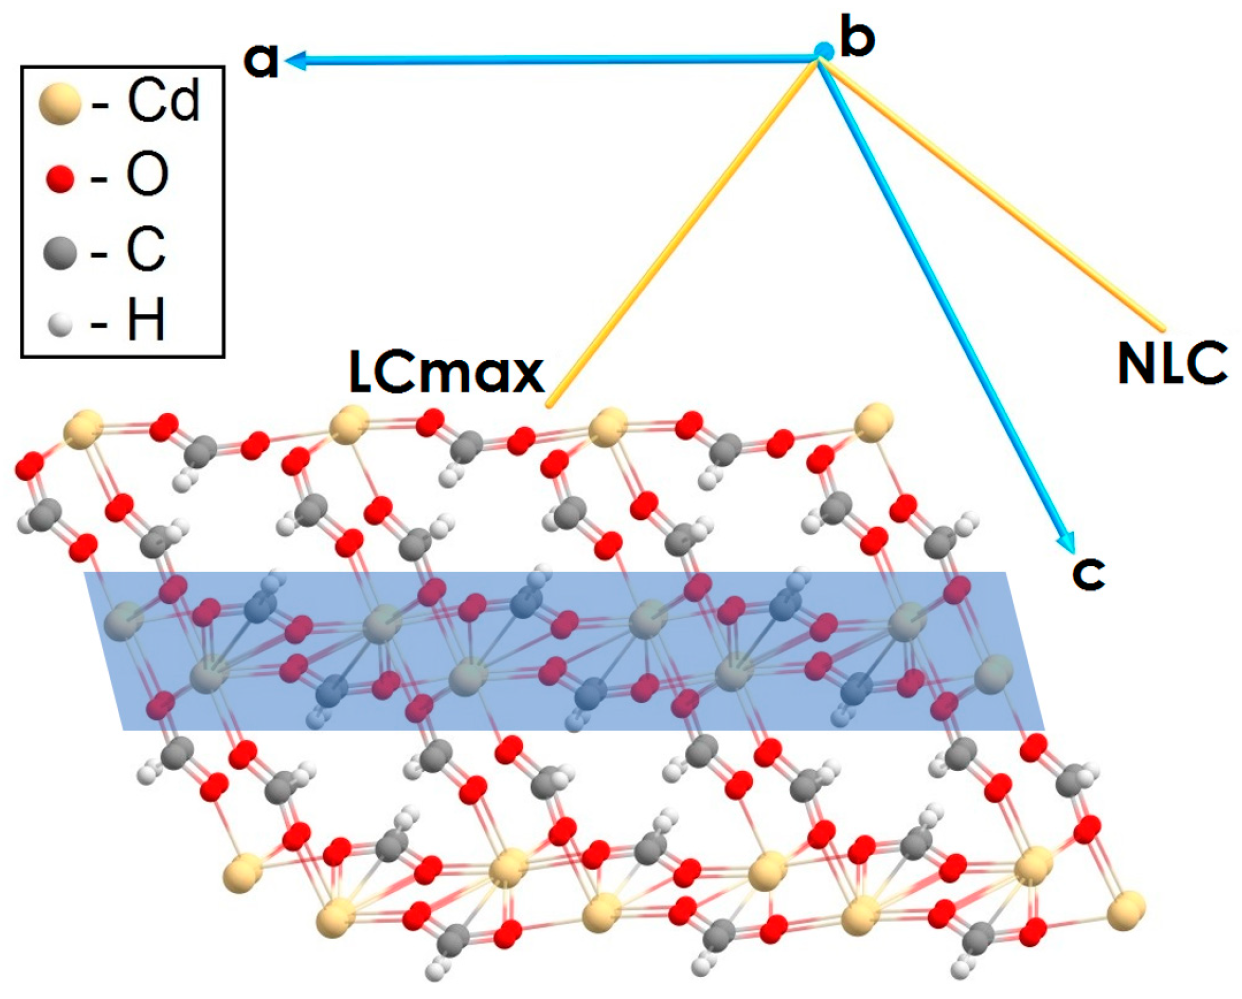
In Na+fmt, the direction of NLC (Figure 5) is at a small (about 5°) angle to the layer motif plane, a0b, and is oriented along the strips Na+…OCO…Na+ in the direction of the a-axis. However, the a cell parameter is notably increased under compression up to 5 GPa (Figure 2d, Table S9). We have observed that the response of the structure of the crystal to external compression changes under pressure above 4 GPa. This observation can be interpreted as follows. Under increasing hydrostatic pressure, the observed angle of the LCmin axis with the layer motif plane decreases until the pressure reaches 4 GPa and increases at a higher pressure when the LCmin values become positive. The LCmax axis is oriented orthogonally to the LCmin axis but also coplanarly to the layer motif plane and does not change its direction under increasing pressure. The C–H…Na+ fragments are arranged along this axis. The H…Na+ interatomic distances shorten under external compression to the greatest extent. It should be noted that the two shortest Na+…O bonds, on the contrary, retain their lengths and do not change under increasing pressure, in fact. In other words, the formate strips are approached together under pressure, affecting the O…Na+…O zigzag along the LCmin axis. This approach slows down, obviously, when the pressure reaches the value of about 5 GPa.
Generally, the analyses of stiffness tensors and trends of changes in the a value have shown the existence of two ranges of external pressure (Table S10) for the manifestation of NLC by Na+fmt: both 0…~2 GPa and ~3.5…~5 GPa. Perhaps this is due to changes in the structure and electronic properties inside the layer motifs, which are sufficient for a noticeable change in resistance to external compression, and may be sufficient for the phase transitions discovered [29,30] in Na+fmt under hydrostatic compression.
Thus, the analysis of spatial dependences of linear compressibility and their changes under an increase in hydrostatic compression leads to the following conclusions. For all considered crystals with known data about the manifestation of NLC, the theoretical estimations of the NLC values, namely, the normalized compressibilities, are in good agreement with the previously published data. The established spatial directions in which this effect is observed correspond to the available experimental data. The ranges of external pressure for the NLC effect have been predicted, which are 0…2.6 GPa for the α-phase of calcium formate crystals, 0…0.35 GPa for the cadmium formate crystals, and two ranges 0…2.0 and 3.5…5.0 GPa for the sodium formate crystals. The absence of published experimental data about NLC for the latter crystal may be due to the extremely small value of NLC under normal conditions, at which most experiments that reveal the effect of NLC in a crystal were carried out.

3.2. Analysis of the Quantum Electronic Pressure in Crystals under External Compression

Positive values of the quantum electronic pressure, p(r), in the studied formate crystals, have been observed for all covalent bonds of a formate anion. In the intermolecular space, such as voids, and in the regions of the ionic M…O and hydrogen H…O bonds, the p(r) values are negative, as a rule. The lower negative p(r) is typical for the stronger noncovalent bonds.
Let us analyze the behavior of p(r) under an increase in hydrostatic compression using contour maps plotted in the intersection plane of the axes of the maximal (LCmax) and minimal (LCmin) crystal compressibility. Presumably, the common plane with information about the extreme values of compressibility will allow us to analyze the more contrasting changes within one piece. Such a plane can be used to scan the crystal, shifting it along the cell in order to reveal the regions that are most informative in relation to the structural and electronic changes that occur under external pressure.
For the α-Ca2+fmt crystal, we have chosen a plane formed by the Ca2+ cations, coplanar to the LCmin and LCmax axes (Figure S4). In the pressure range of 0…3.5 GPa, at which NLC manifests itself, the distance between the Ca2+ positions along the LCmax direction noticeably shortens while the Ca2+ cations move away, and the crystal expands along the LCmin direction. By monitoring the structural changes under increasing pressure, we have found how the H atom of the formate group is wedged between neighboring Ca2+…Ca2+ positions with a displacement along the LCmin direction. At the same time, interatomic distances for ionic bonds Ca2+…O change very little; the cation–anion ionic pairs are displaced synchronously. There are practically no changes in the p(r) distribution between the Ca2+ and carboxylate oxygen atoms of formates (Figure S4). The visual 3D analysis has shown that under the threshold pressure of 3.5 GPa, at which the LC
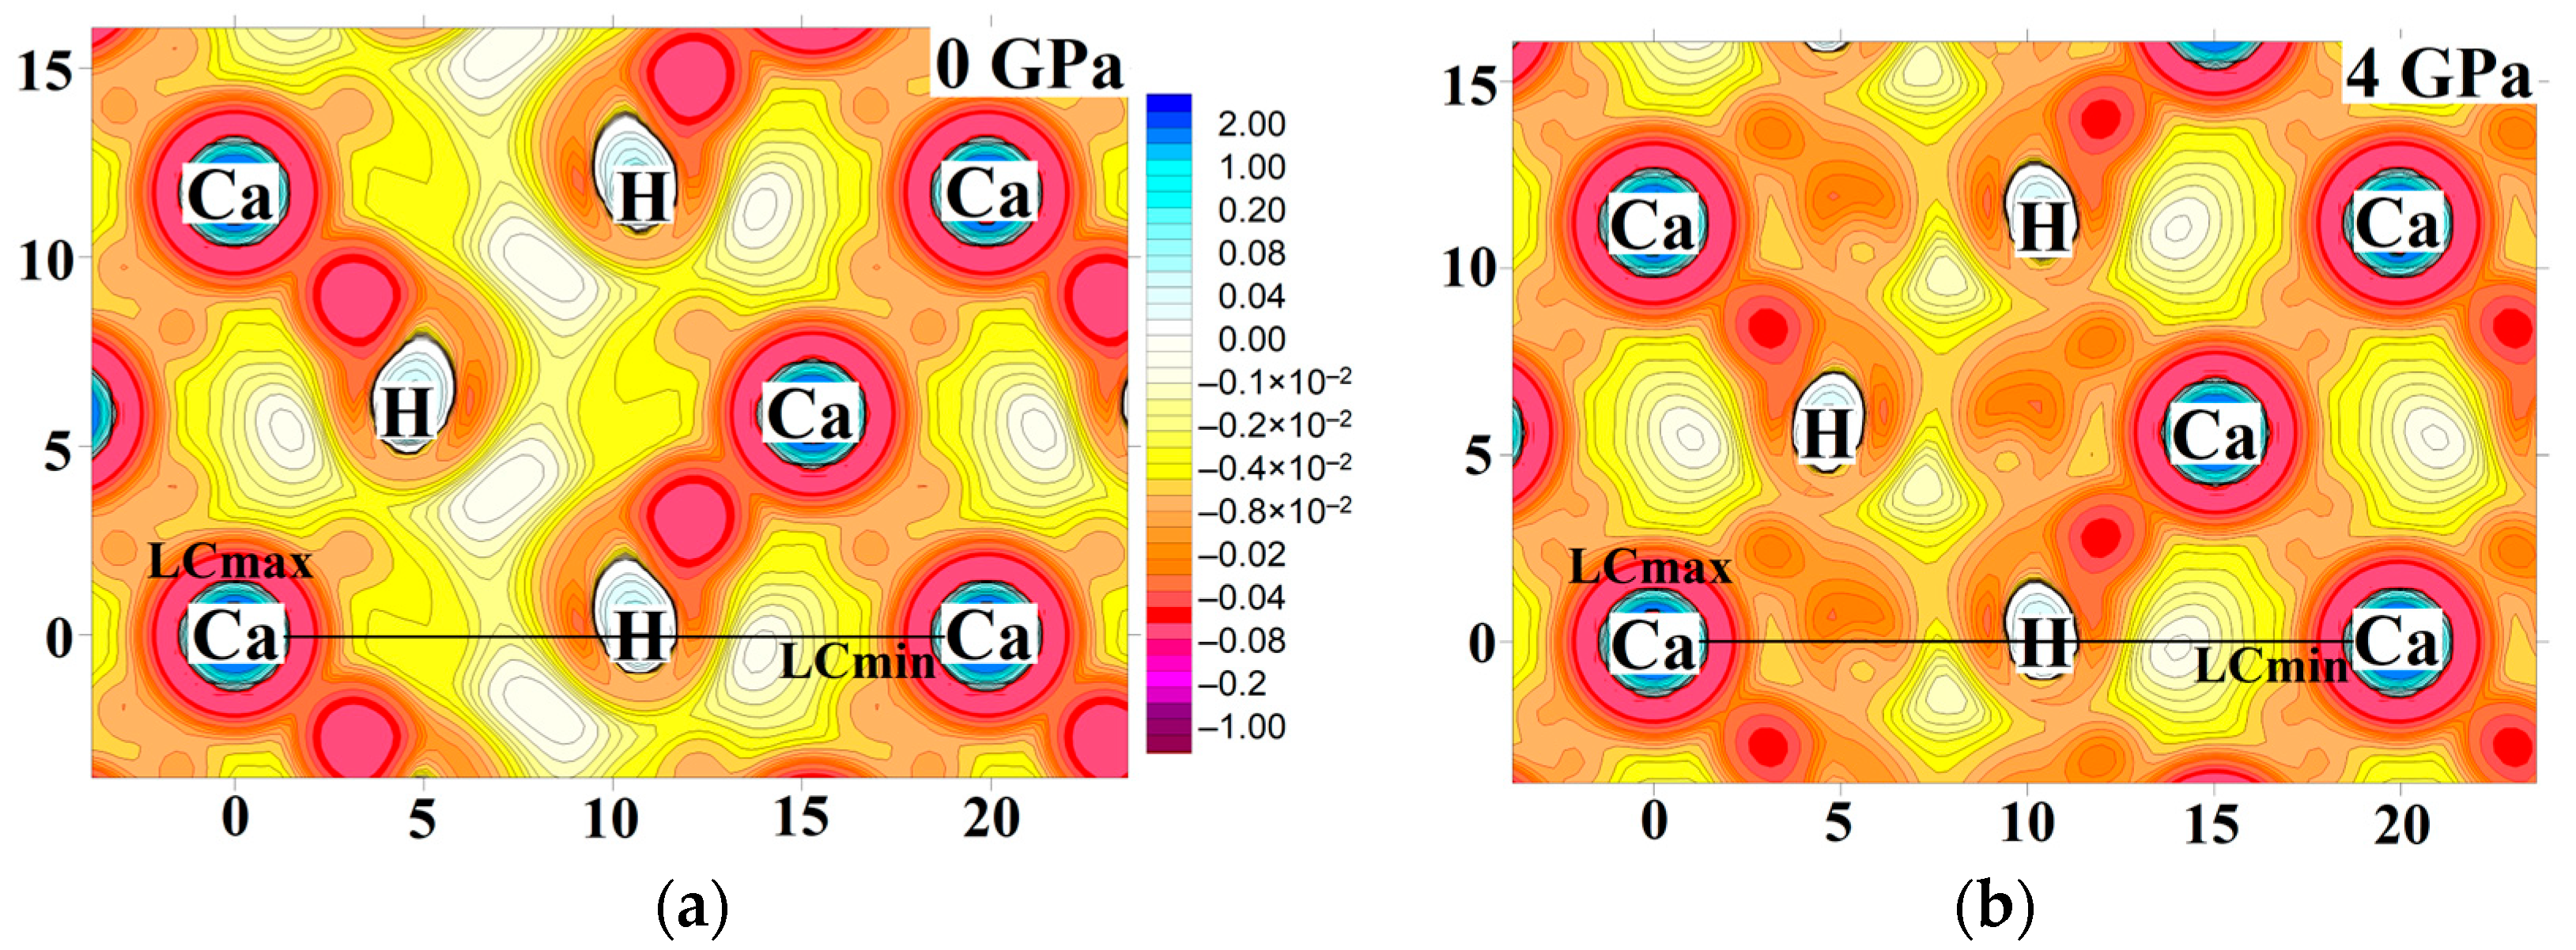
min values become positive (it means that the NLC effect is lost), noticeable structural changes are manifested. One of the ionic pairs is displaced asynchronously with respect to the others, with a slight turn relative to its axis. Such a “leap” after monotonous changes can be correlated to the loss of NLC. This is also a noticeable feature on the maps of the p(r) distribution in the plane across the “pseudo-rhombic” void channel, along the LCmin axis and perpendicular to the LCmax axis (Figure 6).
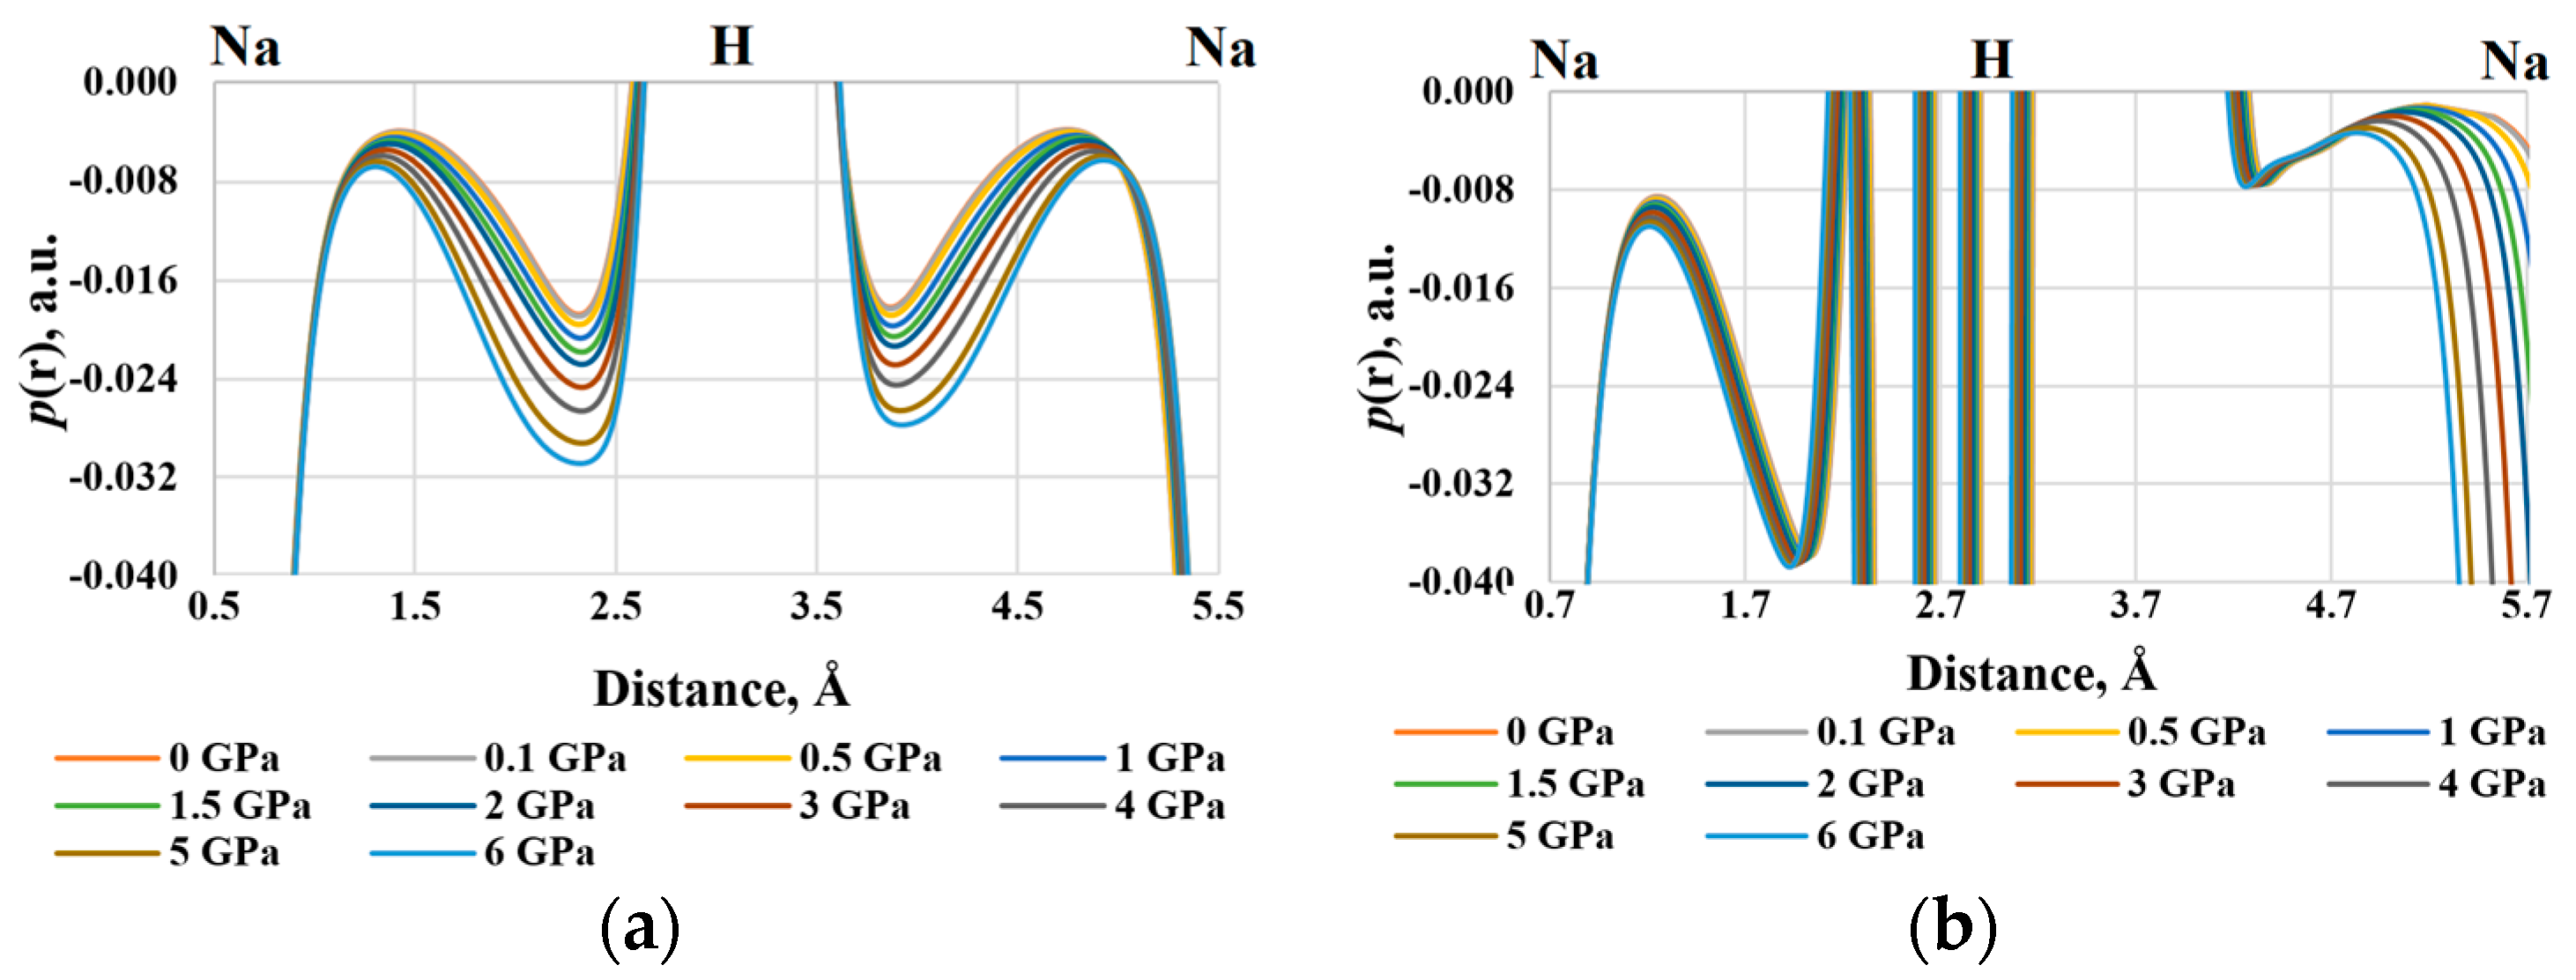
Let us analyze the distribution of 
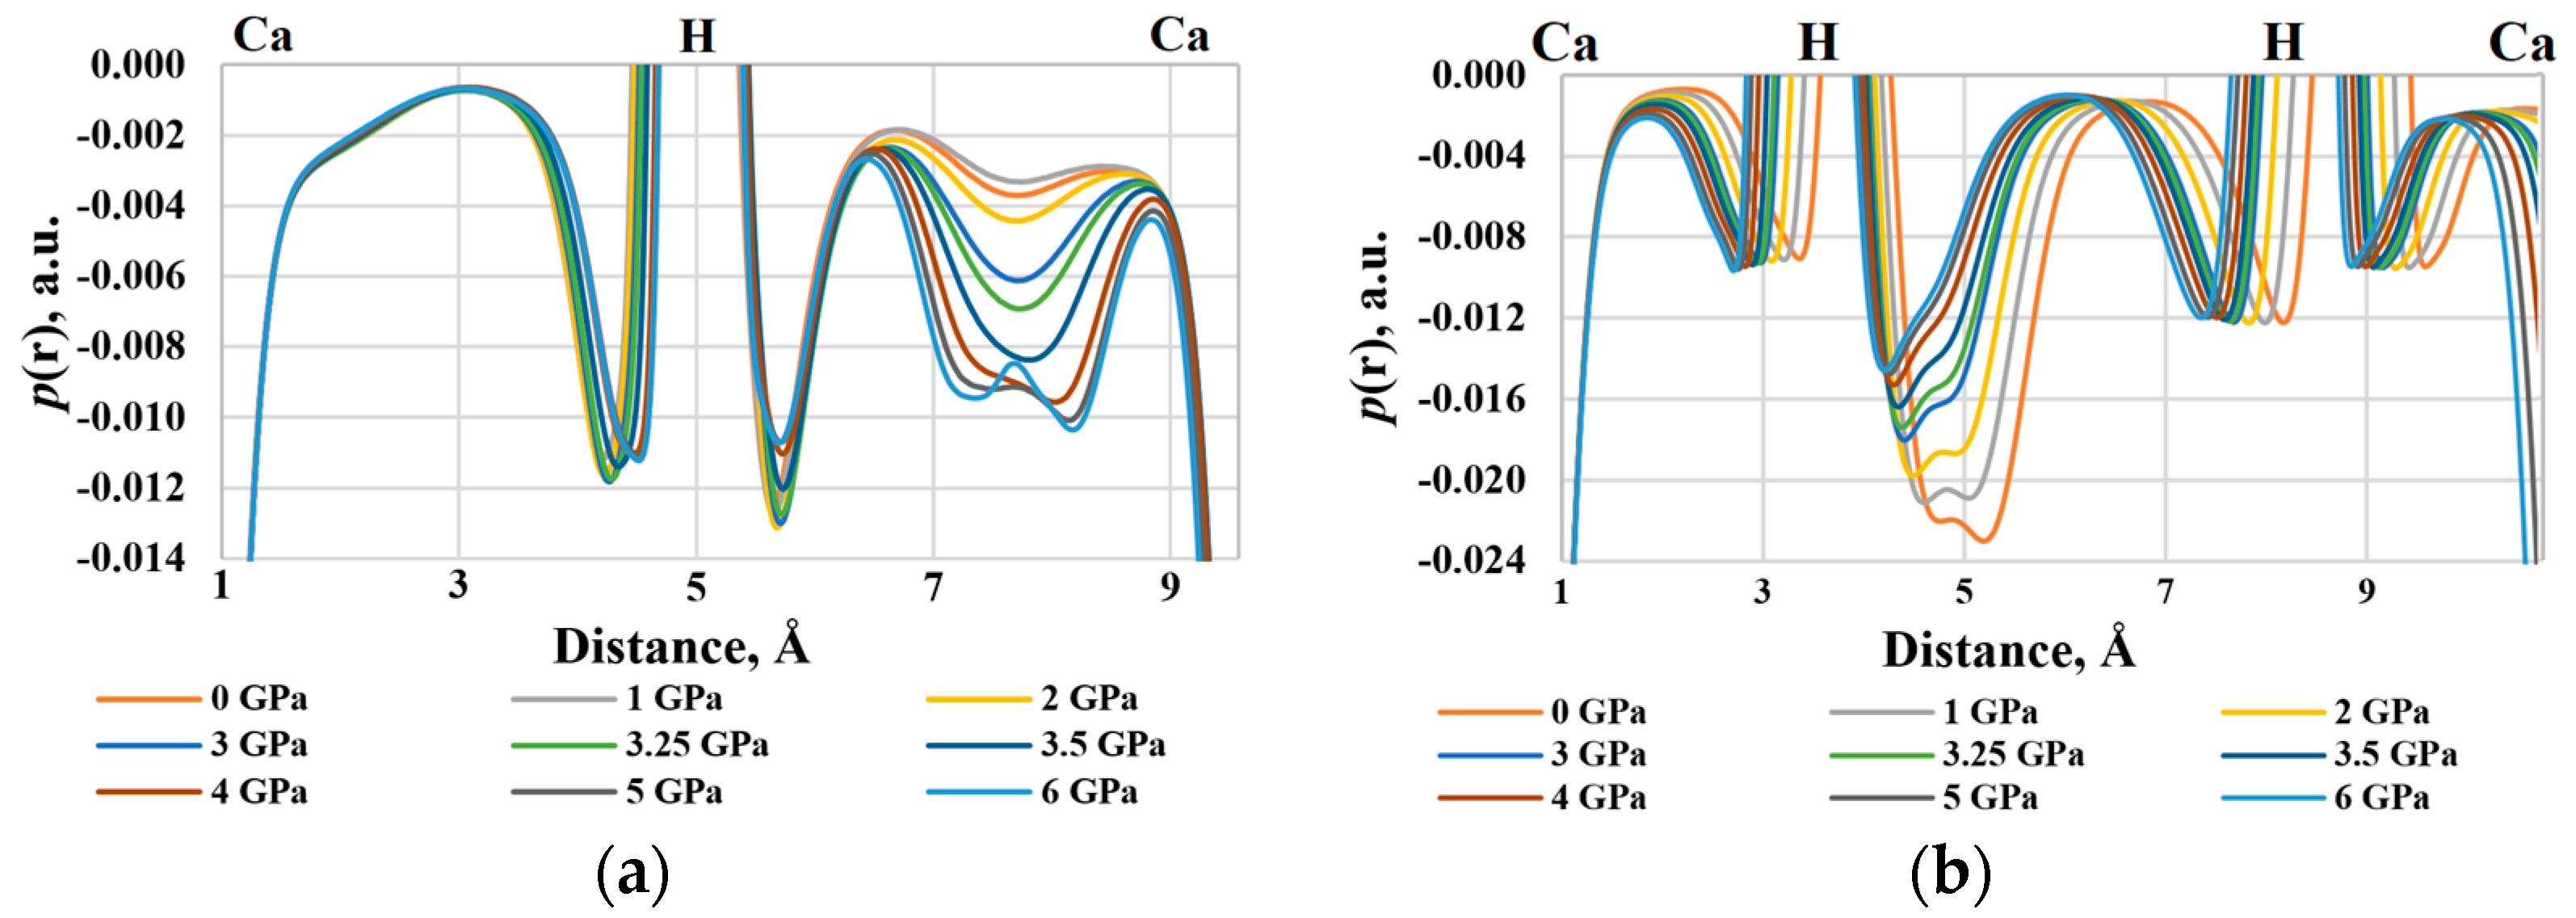
p(r) along the extreme directions of linear compressibility. In the α-Ca2+fmt crystal along the LCmin (NLC) axis, there are distinct regions in which the change of p(r) is strongly pronounced. Figure 7a represents the change of p(r) between positions of two Ca2+ along the LCmin axis at a distance equaling the parameter a. In the left part of the graph, relative to the peak corresponding to the H position, there are practically no changes in the chosen scale. On the right side of the graph, after 1 GPa, the values at the minimum, p(r)min, become more negative with increasing compression (∆p(r)min = 129%, relative to 0 GPa). Under pressure 3.5 GPa, which coincides with the disappearance of NLC, a narrow maximum rises in the center of a wide minimum. Along the LCmax direction, the p(r) values change more uniformly (Figure 7b). As the compression increases, one can note the smooth increase of p(r) in the pit near the H atom (∆p(r) = 34%) between positions of two Ca2+. The detected changes in p(r) coincide with the NLC range: the gradual decrease of p(r)min stops, and the increase of p(r)min weakens after 3 GPa.
The maps of p(r) distribution in Cd2+fmt, which has a similar “pseudo-rhombic” void channel, show a general pattern of changes of p(r) under crystal compression that is practically similar to α-Ca2+fmt. However, in contradistinction to α-Ca2+fmt, there are no structural changes near the pressure value at which NLC disappears. Possibly it is because the range of NLC is preserved only for very low values of external pressure (0.25 GPa). When the Cd2+fmt crystal is compressed, the LCmin direction slightly deviates from its orientation at 0 GPa. As the external pressure increases, the p(r) value along the Cd2+…Cd2+ line co-directional with the LCmin gradually decreases at the minima and at the central maximum (Figure S5). Along the perpendicular line and parallel to LCmax, p(r) changes uniformly on all segments (Figure S6).
For the NLC-free β-Ca2+fmt crystal (LCmin > 0), we have found that the orientation of the LCmin axis oscillates, moving at each step of external pressure between the a and b axes. In an uncompressed structure, the LCmin axis lies at ~15° to the b-axis. As the external pressure increases, the LCmin axis strongly deviates to 90°, but it remains in the a0b plane. As the direction of LCmin oscillates, we have not made a strict comparison of the p(r) function along the LCmin directions in the row of increased values of external pressure. Nevertheless, we can compare the properties in this plane. Figure 8 clearly shows the decrease of negative p(r) values in the cavity formed by the Ca2+…O–C–O…Ca2+ bond motifs. It is explained by the displacement of cation–anion pairs along the LCmax direction, which is perpendicular to the a0b plane. In the plane coplanar to LCmax (Figure S7), the regions with less negative p(r) values change more than the rest. The region of the Ca…O bond is still the least susceptible to changes. Thus, the more negative values of p(r) tend to flatten in cavities under pressure. In this case, weakly negative values of p(r), which are inherent, as a rule, change much more strongly (in relative terms) in the regions of cavities and noncovalent bonds.
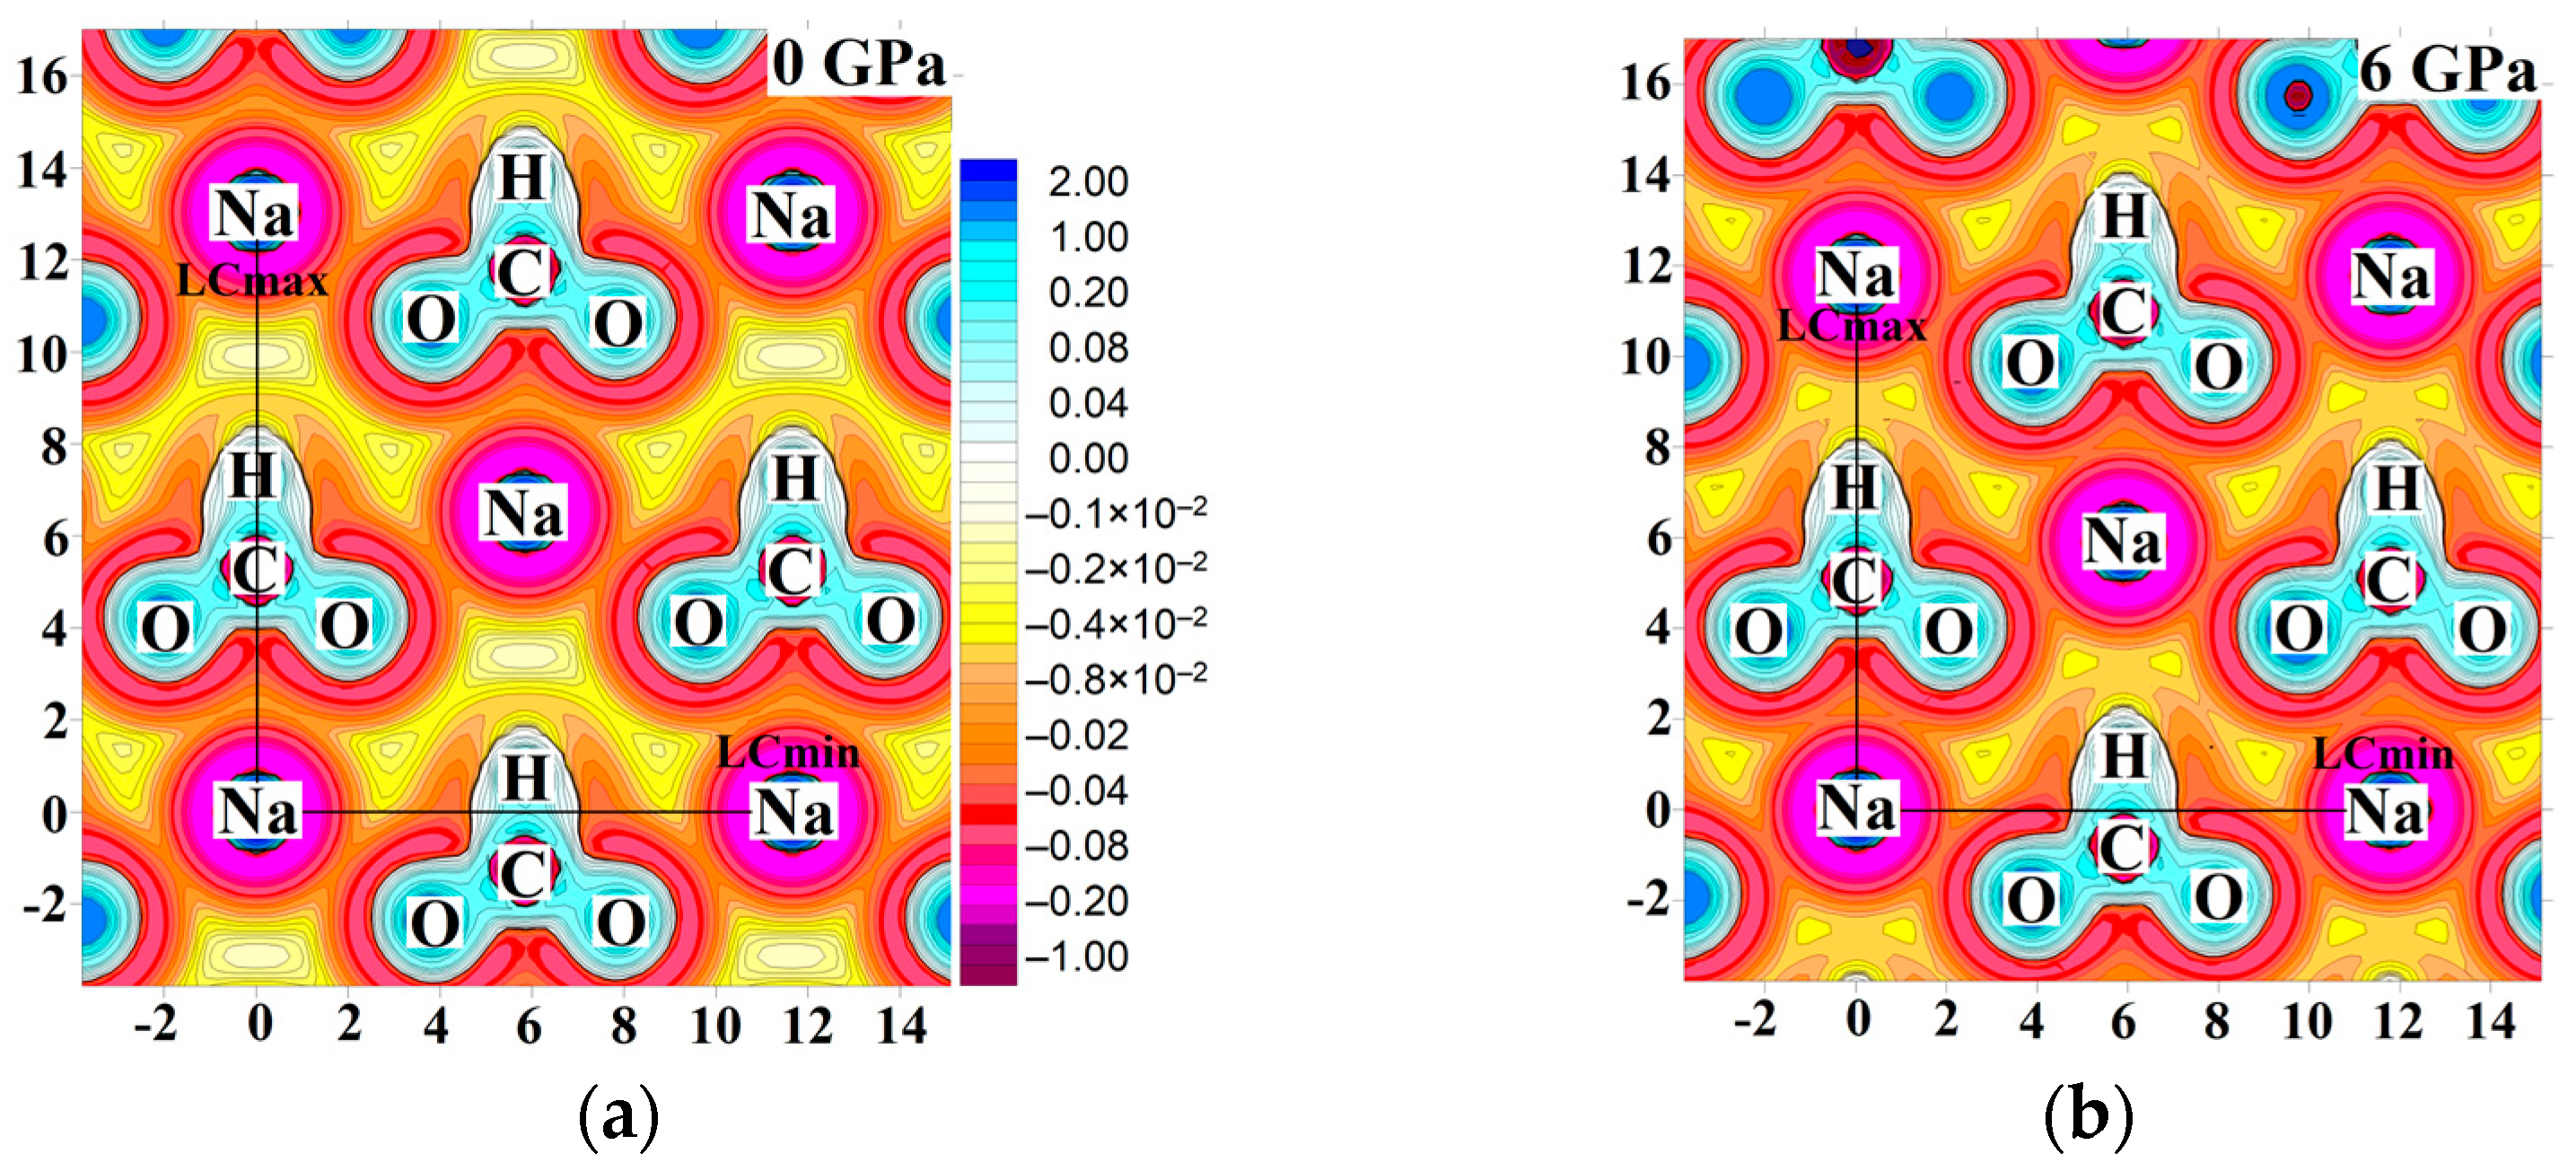
A similar observation is illustrated by the example of Na+fmt as well (Figure 9). With the increase in external pressure, the greatest changes are observed in the regions of weakly negative p(r) values: along LCmax between the C–H bond and the Na+ position. The smallest changes of the p(r) function are observed for the Na+…O ionic bond in the motif extending along the LCmin direction. For the Na+fmt crystal, the LCmin direction slightly oscillates with an increase in compression, so we have considered a line between a pair of Na+ cations co-directional with the LCmin axis (Figure 10a). As the external pressure increases, the values of p(r) gradually decrease at the pit. Under pressure above 4 GPa, near the limit of NLC, where the LCmin becomes positive, the rate of fall for p(r) values increases. The changes of p(r) along the LCmax direction are monotonous (Figure 10b). The difference in the p(r) behavior along the directions of maximal and minimal compressibility can be related to the different reactions of a crystal to external deformation.
While the electron density inevitably increases under hydrostatic pressure at all points of the crystal, the p(r) values can increase and decrease depending on the structural element of a crystal. The pronounced sensitivity to compression is observed precisely for the range of the small negative values of p(r). This fact indicates that the most complete compensation of external stress occurs in the intermolecular space, where the localization of bonding electron pairs is not high: for the H…O bonds and in the voids, but not for the M…O and covalent bonds. Since p(r) takes into account the electronic exchange, it can be said that the local increase of internal energy is compensated precisely due to this effect. The quantum electronic pressure makes it possible to identify the areas with the highest and lowest compliance of a crystal and to obtain the regions in which p(r) renders the compensating role. Thus, as a tool for analysis, the p(r) function allows recognition of the response of the electronic continuum to hydrostatic compression.
In order to consider the properties of chemical bonds and to quantify local changes in the intermolecular space of crystals under external compression, we have analyzed the quantum electronic pressure at the bond critical points (bcp) of electron density, p(rbcp). For most Ca…O bonds in α-Ca2+fmt, p(rbcp) decreases under external pressure up to 3.25 GPa (Figure S8). The exception is one Ca…O bond, for which p(rbcp) changes the most under external compression up to 6 GPa (29%). The length of this bond decreases more than the other, and this formate group shifts and rotates. Probably, such rotation of one formate group portends the loss of the NLC effect (Figure S8).
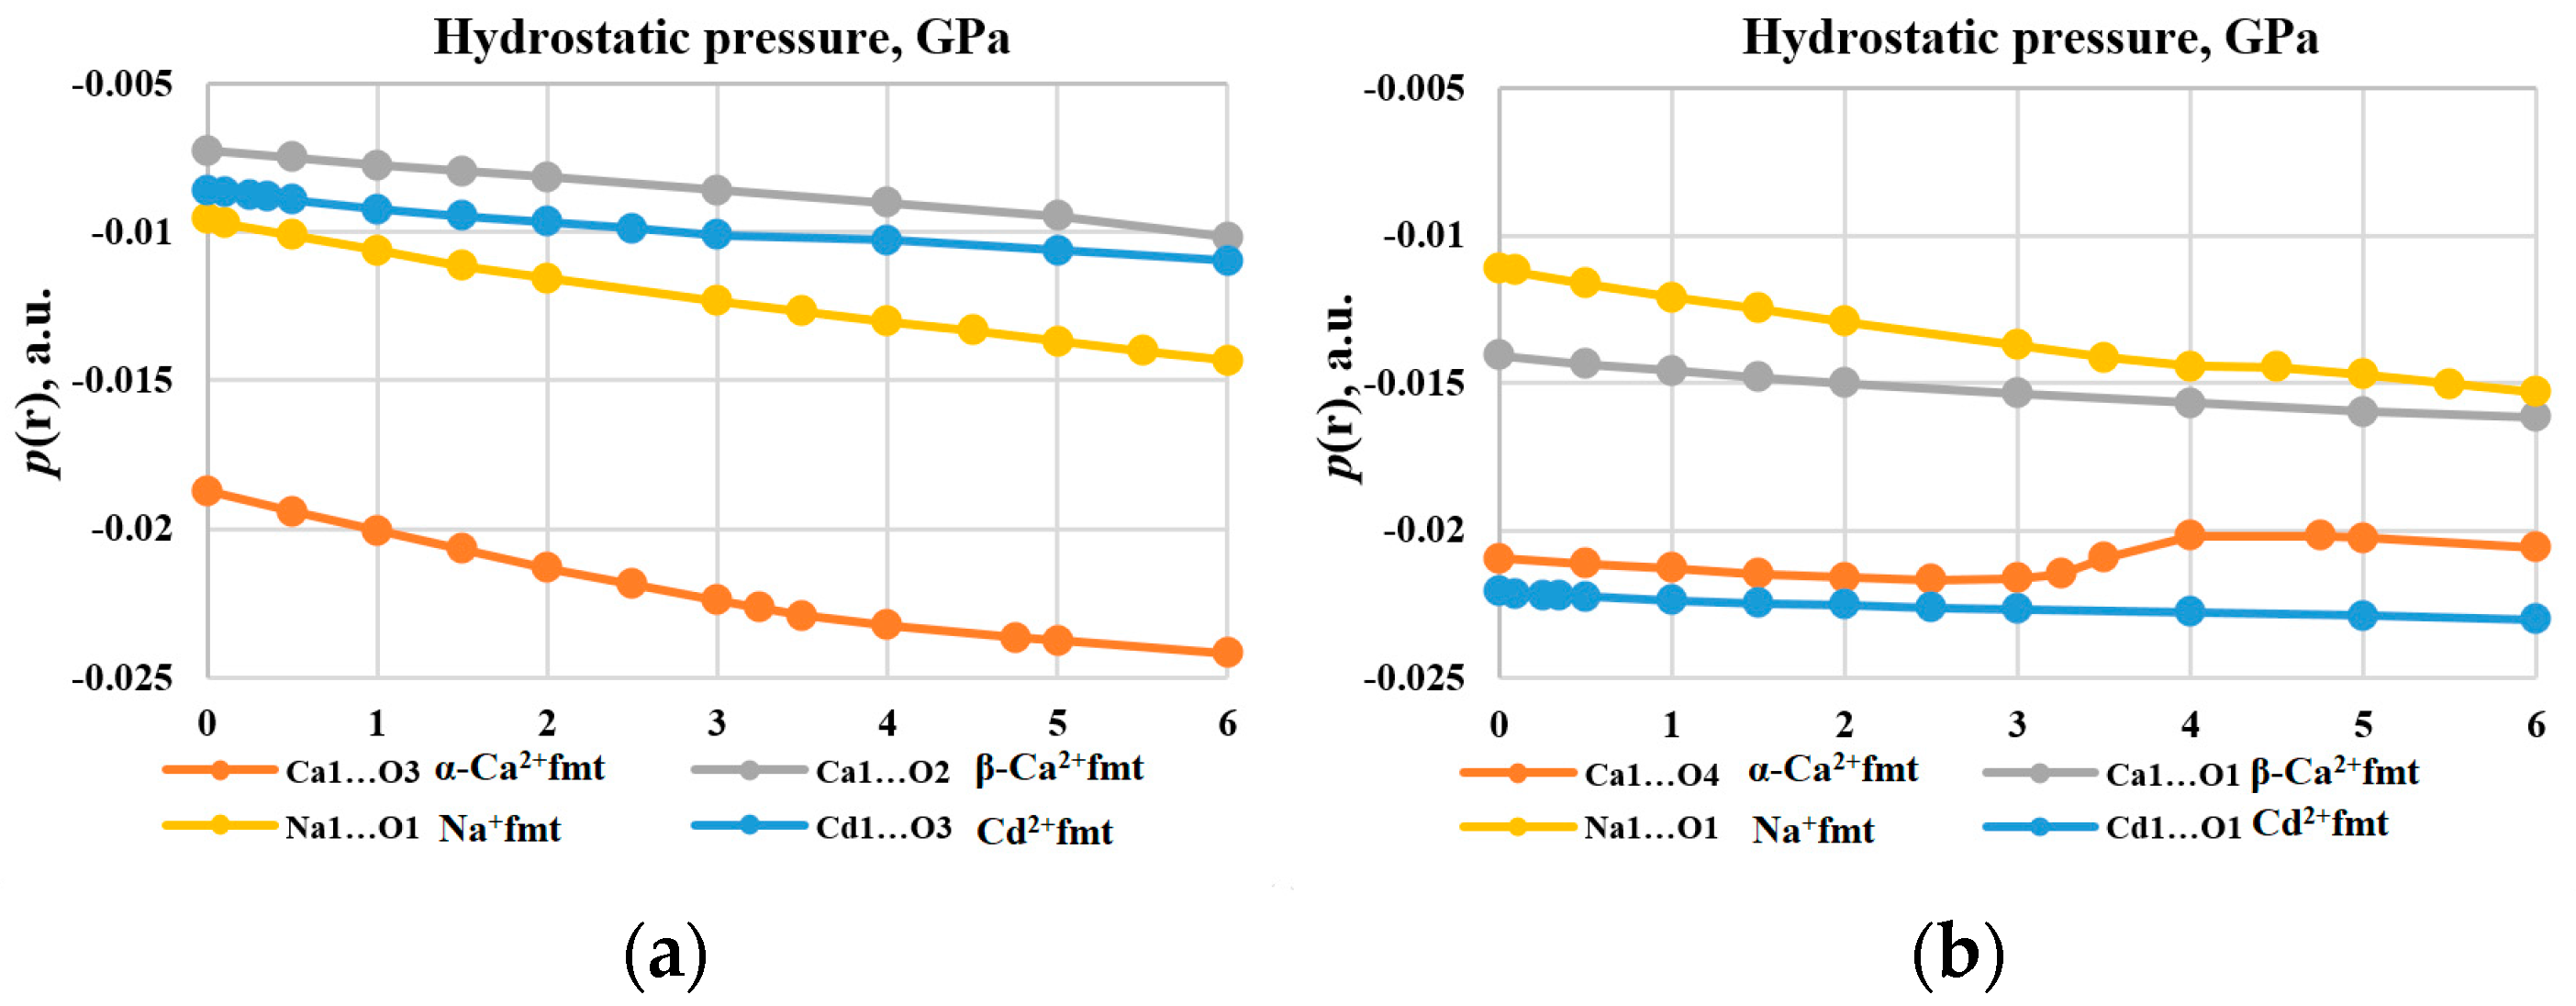
Figure 11 shows the behavior of p(rbcp) for the M…O bonds that change the most and the least. For the most strongly changed M…O bonds, it can be seen that their trends line up in the order corresponding to the highest value of NLC in this pressure range: α-Ca2+fmt < Na+fmt < Cd2+fmt < β-Ca2+fmt. The most negative values can be noted for α-Ca2+fmt, which is very different from other crystals. Interestingly, the structural changes that occur in the α-Ca2+fmt and Na+fmt crystals are best seen in p(rbcp) of the least changing M…O bonds. In α-Ca2+fmt, the rotation of ionic pairs and a slight displacement of “layers” occur under the compression up to 3.5 GPa, which coincides with the loss of the NLC effect (the crystal stops expanding). In Na+fmt, the layers are shifted relative to each other in the pressure range from 4 to 5 GPa, while the crystal stops expanding under pressure above 5 GPa. We have to note that the LCmin axis in Na+fmt is at a small angle to the a crystallographic axis.
Hydrogen bonds O…H are not the most convenient for observing changes in p(rbcp) under external compression: with an increase in pressure, some of them often disappear, while others are formed. 
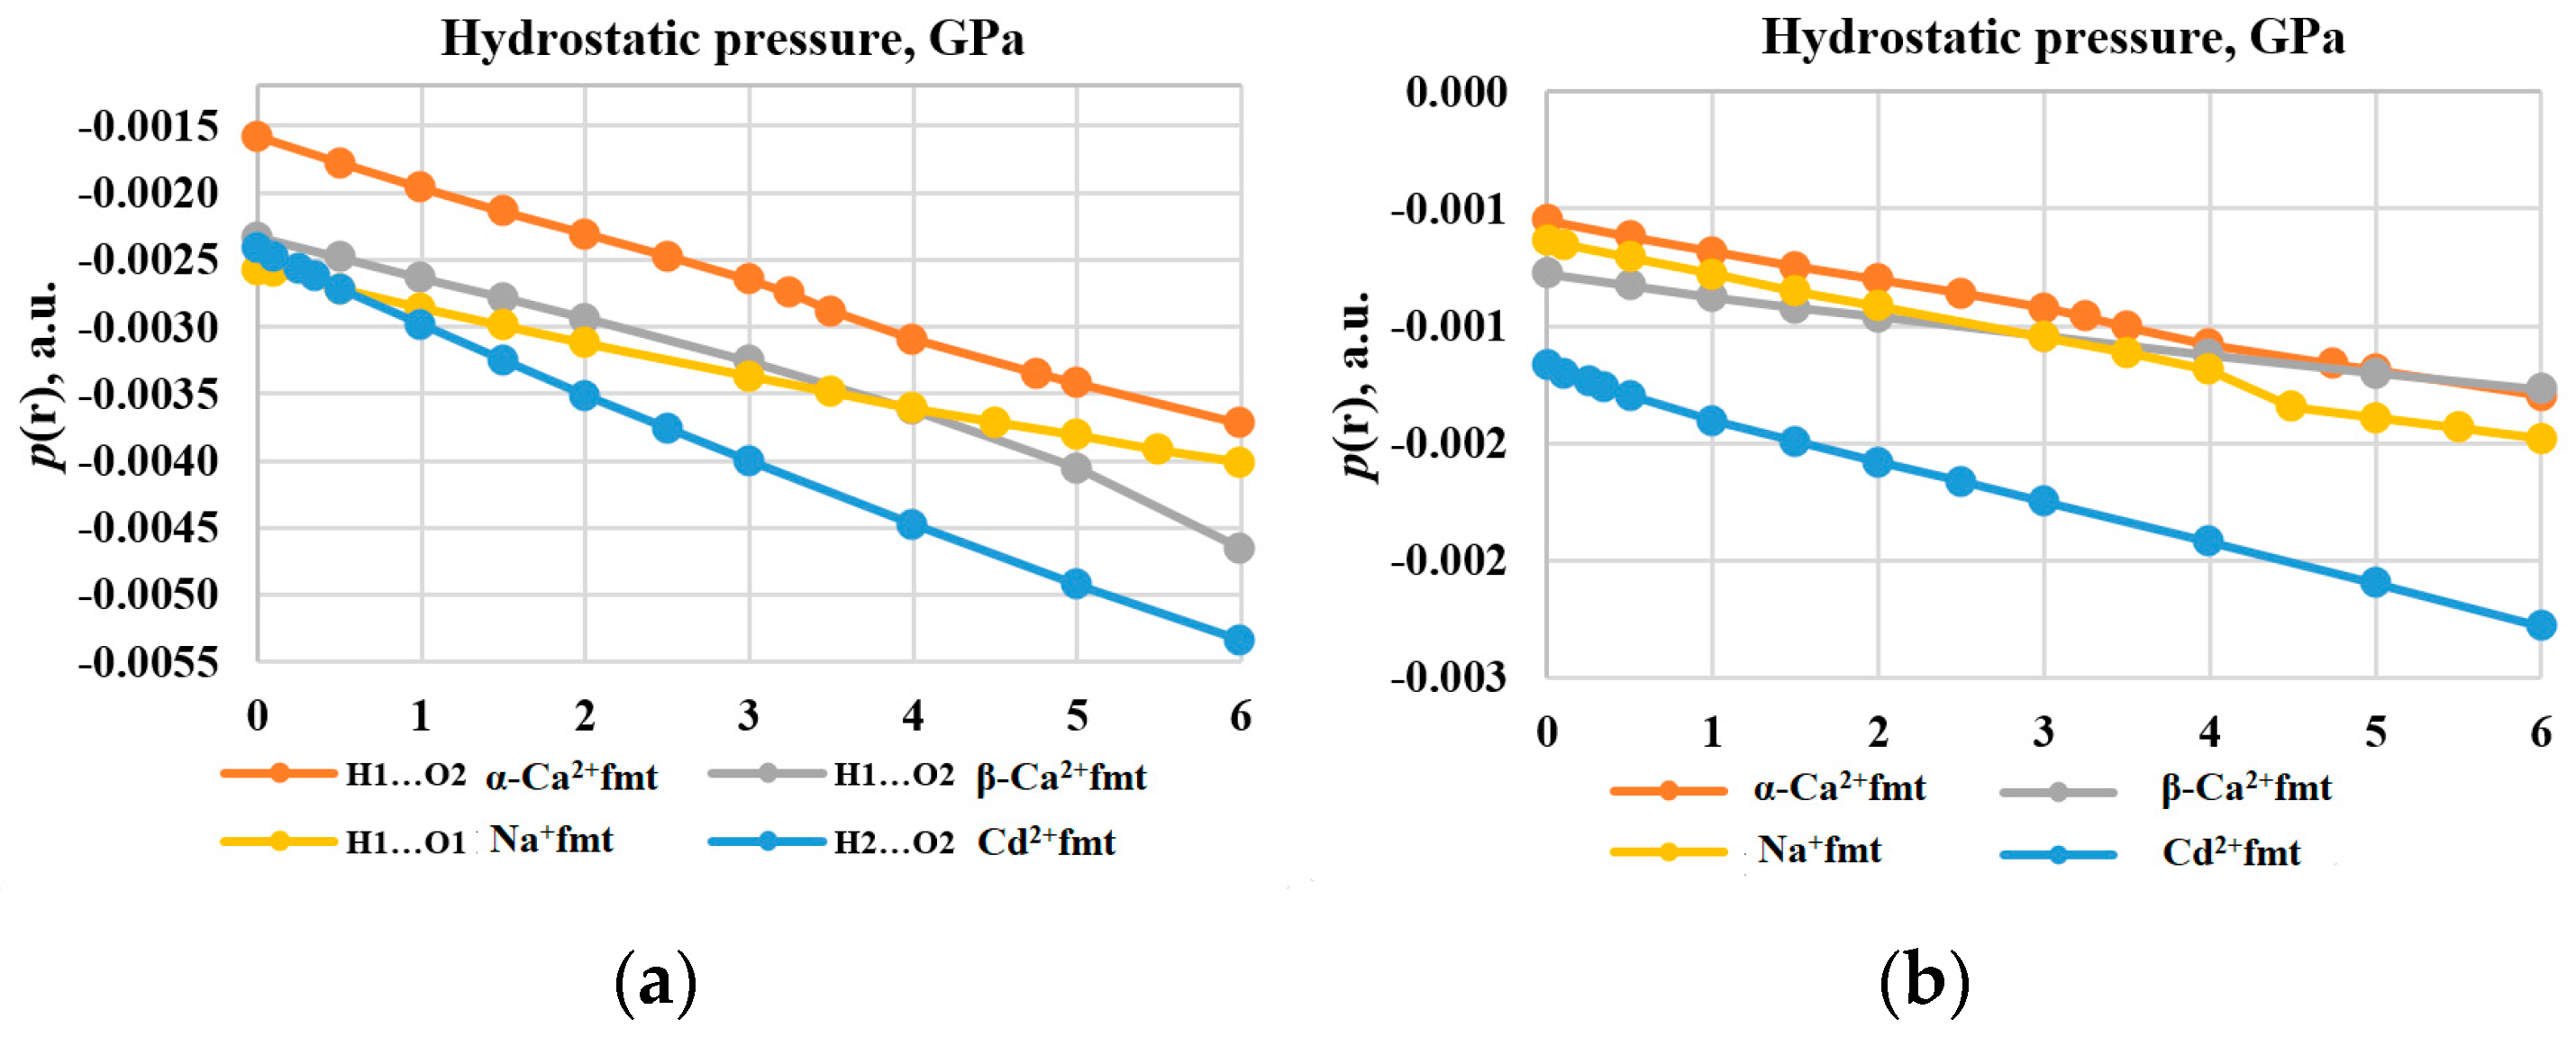
Figure 12a presents the behavior of p(rbcp) for the most changed H…O bonds. In α-Ca2+fmt, the H1…O2 bond with the greatest change (135%) is located in the “pseudo-rhombic” void channel, and it has the least negative values of p(rbcp) (Figure S9). In β-Ca2+fmt, the values of p(rbcp) for the H1…O2 bond, oriented approximately along the LCmax axis, are more negative and change only slightly (Figure S10). Another H1…O2 bond, oriented almost along the LCmin axis, has less negative p(rbcp) values, which change more strongly (99%). As well as in α-Ca2+fmt, in Cd2+fmt, the bonds with the least negative values of p(rbcp) located in the “pseudo-rhombic” void channel have undergone the greatest change (Figure S11). The H1…O2 bond inside the ribbon motif changes the least. In Na+fmt, there is only one unique H…O bond in the original structure, which is oriented at a small angle to LCmin (Figure S12). We have noted that the largest relative change of p(rbcp) is observed for the H…O bonds located at a smaller angle to LCmax, and the smallest change is observed for the bonds that are more co-directional with LCmin. At the same time, the least negative values of p(rbcp) change most sharply, in relative terms, and the most negative values of p(rbcp) change less. Thus, the analysis of p(rbcp) has shown that the H…O bonds are more sensitive to external pressure than the M…O bonds, and the more “soft” H…O bonds make the greater compensation of internal stress than the relatively “rigid” bonds.
According to the largest relative changes of p(rbcp) under compression up to 6 GPa, all types of bonds in formates can be ranked as follows: H…O > M…O > C–H > C=O. The largest relative change is at bcp of the H…O bonds, while the smallest change of p(rbcp) is observed for the C=O covalent bonds. Based on this, we can conclude that the smaller this change, the more “rigid” this region of the electronic continuum is, and vice versa. For absolute changes, the ranking is completely different: C–H > M…O > C=O > H…O. Here, the greatest absolute change occurs at bcp of the C–H covalent bonds, which experience the maximum stress among all types of bonds, while remaining the least susceptible to change. This also suggests that despite the pliability of the noncovalent bonds that compensate for stress, the covalent bonds do not cease to experience growing stress, as evidenced by quantum electron pressure.
The analysis of the quantum electronic pressure at the cage critical points of electron density (ccp), p(rccp), has been carried out for the points that persist over the entire compression range (Figure 12b). Such points serve as a guide characterizing the approximate center of the cavity, which is preserved under compression. In the α-Ca2+fmt and Cd2+fmt crystals, such a point is located in a “pseudo-rhombic” channel. The lowest negative values of p(rccp) have been observed in Cd2+fmt, while the least negative values have been found in the α-Ca2+fmt crystal. In the Na+fmt crystal, such ccp point has been observed at the equilibrium state (Figure S18). The largest relative change of the p(rccp) value (136%) is observed in the α-Ca2+fmt crystal with the large NLC effect (most negative value), and the smallest one (42%) is observed in the Cd2+fmt crystal with the less negative value of NLC. Figure S18 also shows a feature for the α-Ca2+fmt and Na+fmt crystals, possibly associated with structural changes under this external pressure. A pattern has been found for the change in p(rccp): the value of the relative change in the formate crystals is ranked in the order corresponding to the maximum value of NLC in the range from 0 to 6 GPa: α-Ca2+fmt > Na+fmt > Cd2+fmt > β-Ca2+fmt.

4. Conclusions

The analysis of the calculated stiffness tensors has allowed us to determine the directions of maximal and minimal (including negative) linear compressibility of the considered series of formate crystals at equilibrium state and under external hydrostatic pressure. We have theoretically estimated the ranges of applied pressure in which the simulated structures of crystals manifest NLC based on both the analysis of change of certain cell parameters and the analysis of spatial dependences of linear compressibility under different applied pressures. The definite ranges of applied pressure, in which the considered crystals manifest the NLC effect, are 0…2.6 GPa for the α-phase of calcium formate and 0…0.35 GPa for the cadmium formate crystals. The two ranges 0…2 and 3.5…5 GPa are observed for the sodium formate crystals.
The influence of the specific features of crystalline structures or structural motifs at equilibrium on the directions of maximal and minimal compressibility axes, including the NLC effect, such as the “pseudo-rhombic” void channels in calcium and cadmium formates, has been revealed. Changes in the electronic functions in such regions of a crystal cell, namely, in cavities or interlayer space and in the bonds forming the structural motifs, affect the orientation of the minimal and maximal compressibility axes, among others. As a rule, stronger bonds with smaller relative changes of p(rbcp), which contribute less to external stress compensation, orient the axis of minimal compressibility along themselves. On the contrary, the direction of the maximal compressibility axis is determined by weaker bonds, with larger relative changes of p(rbcp). In such cases, the crystal is capable of showing NLC along the former axis. In the cases in which the orientation of these axes with respect to different strength bonds is reversed, the phenomenon of NLC is less likely, which can be seen in the example of the β-Ca2+fmt crystals. However, the exceptions found confirmed that the orientation of axes describing extreme compressibility is determined not only by the bond strength, as bonds of the same type can change their electronic properties under pressure differently.
The analysis of changes of p(r) with an increase in compression of a crystal reveals the following effects. Firstly, the largest compensation of growing internal stress occurs in the cavities and the H…O hydrogen bonds characterized by small negative p(rbcp), which can be defined as soft regions. Compared to them, the M…O bonds are characterized as more rigid because they have more negative values of p(rbcp), which change little under compression. The least changing regions are the C–H and C=O covalent bonds, which have positive p(r) values and can be defined as rigid regions. All considered bonds are ranked in the following order by values of ∆%p(rbcp): H…O > M…O > C–H > C=O. Among the least changing noncovalent bonds, most of them are oriented along the LCmin axis (or at a small angle to it), and vice versa; the most changing bonds are elongated along the LCmax axis. However, exceptions have been observed for the β-Ca2+fmt crystal without NLC. This brings us back to understanding the importance of structural factors associated with the anisotropy of the orientation of chemical bonds. Note that the sign and absolute value of quantum electronic pressure itself are unable to predict the behavior of any chemical bond: some of them can be stretched or shortened depending on the structural features of a crystal. Nevertheless, the information about how much the quantum electron pressure changes in certain structural fragments plays a key role in the prediction of the mechanical behavior of a crystal.
Secondly, we have found that the relative change of p(rccp) in the formate crystals can be ranked in the order corresponding to the maximal values of NLC in the considered pressure range: α-Ca2+fmt > Na+fmt > Cd2+fmt > β-Ca2+fmt. Thus, in a crystal with a large NLC effect, the change of p(rccp) is bigger, which indicates a greater compensation potential of the corresponding cavity. The fact that the intensity of the NLC effect in formate crystals is correlated with ∆%p(rccp), characterizing the cavities and voids, indicates that quantum effects play an important role in the response of the structure of a crystal to external hydrostatic compression.

Supplementary Materials

The following supporting information can be downloaded at https://www.mdpi.com/article/10.3390/cryst13071147/s1. Figure S1: Spatial dependencies of linear compressibility for the calcium formate crystals; Figure S2: Spatial dependencies of linear compressibility for the cadmium and sodium formate crystals; Figure S3: Change of the spatial dependences of linear compressibility for the calcium formate α-phase crystals under increasing pressure; Figure S4: Contour maps of p(r) distribution in Ca…O…O plane in equilibrium structure and under the hydrostatic pressure in α-Ca2+fmt; Figure S5: Change of p(r) along the LCmin axis between Cd2+ ions in Cd2+fmt with increasing hydrostatic compression; Figure S6: Change of p(r) along LCmax axis between Cd2+ ions in Cd2+fmt with increasing hydrostatic compression; Figure S7: Contour maps of p(r) distribution in Ca…Ca…Ca plane, coplanar LCmax, in equilibrium structure and under hydrostatic pressure in β-Ca2+fmt; Figure S8: Change of p(rbcp) of Ca…O ionic bonds in α-Ca2+fmt with increasing hydrostatic pressure; Figure S9: Change of p(rbcp) of H…O hydrogen bonds in α-Ca2+fmt with increasing hydrostatic pressure; Figure S10: Change of p(rbcp) of H…O hydrogen bonds in β-Ca2+fmt with increasing hydrostatic pressure; Figure S11: Change of p(rbcp) of H…O hydrogen bonds in Cd2+fmt with increasing hydrostatic pressure; Figure S12: Change of p(rbcp) of H…O hydrogen bonds in Na+fmt with increasing hydrostatic pressure; Figure S13: Change of p(rccp) in formate crystals with increasing hydrostatic pressure; Table S1: Comparison of the experimental and calculated crystal cell parameters for the equilibrium forms of considered crystals; Table S2: Comparison of the mechanical characteristics of the equilibrium forms of considered crystals; Table S3: Change of crystal cell parameters of the calcium formate α-phase crystals at hydrostatic compression; Table S4: Linear compressibility and bulk modulus values of the calcium formate α-phase crystals at hydrostatic compression; Table S5: Change of crystal cell parameters of the calcium formate β-phase crystals at hydrostatic compression; Table S6: Linear compressibility and bulk modulus values of the calcium formate β-phase crystals at hydrostatic compression; Table S7: Change of crystal cell parameters of the cadmium formate crystals at hydrostatic compression; Table S8: Linear compressibility and bulk modulus values of the cadmium formate crystals at hydrostatic compression; Table S9: Change of crystal cell parameters of the sodium formate crystals at hydrostatic compression; Table S10: Linear compressibility and bulk modulus values of the sodium formate crystals at hydrostatic compression; Table S11: Values of absolute change of p(r), ∆p, and relative change, ∆p% of ionic bonds with increasing hydrostatic compression; Table S12: Values of absolute change of p(r), ∆p, and relative change, ∆p% of hydrogen bonds with increasing hydrostatic compression; Table S13: Bond lengths for M…O and H…O bonds estimated by various calculation methods. XYZ-files of all crystal’s optimized structures under considered pressures were applied.

Author Contributions

Conceptualization, E.V.B. and V.G.T.; methodology, Y.V.M.; validation, Y.V.M.; formal analysis, S.A.S.; investigation, S.A.S. and P.I.B.; writing—original draft preparation, Y.V.M. and S.A.S.; writing—review and editing, E.V.B.; visualization, P.I.B.; supervision, V.G.T.; project administration, E.V.B. All authors have read and agreed to the published version of the manuscript.

Funding

This research received no external funding.

Data Availability Statement

The data presented in this study are available on request from the corresponding author.

Acknowledgments

The authors acknowledge the TORNADO supercomputer of South Ural State University for providing computational resources and support. The authors are also especially grateful to E. Danilina for the great help in extensive English editing.

Conflicts of Interest

The authors declare no conflict of interest.

References

  1. Cairns, A.B.; Goodwin, A.L. Negative linear compressibility. Phys. Chem. Chem. Phys. 2015, 17, 20449–20465. [Google Scholar] [CrossRef] [PubMed] [Green Version]
  2. Nye, J.F. Physical Properties of Crystals: Their Representation by Tensors and Matrices; Clarendon Press: Oxford, UK, 1985. [Google Scholar]
  3. Miller, W.; Evans, K.E.; Marmier, A. Negative linear compressibility in common materials. Appl. Phys. Lett. 2015, 106, 231903–2319034. [Google Scholar] [CrossRef] [Green Version]
  4. Baughman, R.H.; Stafstrom, S.; Cui, C.; Dantas, S.O. Materials with negative compressibilities in one or more dimensions. Science 1998, 279, 1522–1524. [Google Scholar] [CrossRef] [PubMed]
  5. Baughman, R.H. Auxetic materials: Avoiding the shrink. Nature 2003, 425, 667. [Google Scholar] [CrossRef] [PubMed]
  6. Evans, K.E.; Alderson, A. Auxetic Materials: Functional Materials and Structures from Lateral Thinking! Adv. Mater. 2000, 12, 617–628. [Google Scholar] [CrossRef]
  7. Formosa, J.P.; Cauchi, R.; Grima, J.N. Carbon allotropes exhibiting negative linear compressibility. Phys. Status Solidi B 2015, 252, 1656–1663. [Google Scholar] [CrossRef]
  8. Grima, J.N.; Attard, D.; Caruana-Gauci, R.; Gatt, R. Negative linear compressibility of hexagonal honeycombs and related systems. Scr. Mater. 2011, 65, 565–568. [Google Scholar] [CrossRef]
  9. Barnes, D.L.; Miller, W.; Evans, K.E.; Marmier, A. Modelling negative linear compressibility in tetragonal beam structures. Mech. Mater. 2012, 46, 123–128. [Google Scholar] [CrossRef] [Green Version]
  10. Colmenero, F.; Timón, V. Extreme negative mechanical phenomena in the zinc and cadmium anhydrous metal oxalates and lead oxalate dihydrate. J. Mater. Sci. 2020, 55, 218–236. [Google Scholar] [CrossRef]
  11. Colmenero, F.; Jiang, X.; Li, X.; Li, Y.; Lin, Z. Negative area compressibility in silver oxalate. J. Mater. Sci. 2021, 56, 269–277. [Google Scholar] [CrossRef]
  12. Colmenero, F. Silver Oxalate: Mechanical Properties and Extreme Negative Mechanical Phenomena. Adv. Theory Simul. 2019, 2, 1900040. [Google Scholar] [CrossRef]
  13. Colmenero, F. Negative area compressibility in oxalic acid dihydrate. Mater. Lett. 2019, 245, 25–28. [Google Scholar] [CrossRef]
  14. Colmenero, F. Mechanical properties of anhydrous oxalic acid and oxalic acid dihydrate. Phys. Chem. Chem. Phys. 2019, 21, 2673–2690. [Google Scholar] [CrossRef]
  15. Colmenero, F. Anomalous mechanical behavior of the deltic, squaric and croconic cyclic oxocarbon acids. Mater. Res. Express 2019, 6, 045610. [Google Scholar] [CrossRef]
  16. Colmenero, F. Addendum: Anomalous mechanical behavior of the deltic, squaric and croconic cyclic oxocarbon acids. Mater. Res. Express 2019, 6, 069401. [Google Scholar] [CrossRef]
  17. Colmenero, F.; Timón, V. ZIF-75 under Pressure: Negative Linear Compressibility and Pressure-Induced Instability. Appl. Sci. 2022, 12, 10413. [Google Scholar] [CrossRef]
  18. Ghosh, P.S.; Ponomareva, I. Negative Linear Compressibility in Organic–Inorganic Hybrid Perovskite [NH2NH3]X(HCOO)3 (X = Mn, Fe, Co). J. Phys. Chem. Lett. 2022, 13, 3143–3149. [Google Scholar] [CrossRef]
  19. Colmenero, F.; Lobato, Á.; Timón, V. Mechanical Characterization of Anhydrous Microporous Aluminophosphate Materials: Tridimensional Incompressibility, Ductility, Isotropy and Negative Linear Compressibility. Solids 2022, 3, 457–499. [Google Scholar] [CrossRef]
  20. Jiang, D.; Wen, T.; Song, H.; Jiang, Z.; Li, C.; Liu, K.; Yang, W.; Mao, H.-K.; Wang, Y. Intrinsic Zero-Linear and Zero-Area Compressibilities over an Ultrawide Pressure Range within a Gear-Spring Structure. CCS Chem. 2022, 4, 3246–3253. [Google Scholar] [CrossRef]
  21. Fu, Z.; Yang, Z.; Yang, X.; Wang, K.; Zou, B. Multiple responses of 1,6-diphenyl-1,3,5-hexatriene to mechanical stimulation: Emission enhancement, piezochromism and negative linear compressibility. Chem. Sci. 2023, 14, 4817–4823. [Google Scholar] [CrossRef]
  22. Jiang, D.; Wen, T.; Guo, Y.; Liang, J.; Jiang, Z.; Li, C.; Liu, K.; Yang, W.; Wang, Y. Reentrant Negative Linear Compressibility in MIL-53(Al) over an Ultrawide Pressure Range. Chem. Mater. 2022, 34, 2764–2770. [Google Scholar] [CrossRef]
  23. Yuan, S.; Wang, L.; Zhu, S.-c.; Liu, F.; Zhang, D.; Prakapenka, V.B.; Tkachev, S.; Liu, H. Negative linear compressibility in Se at ultra-high pressure above 120 GPa. IUCrJ 2022, 9, 253–260. [Google Scholar] [CrossRef] [PubMed]
  24. Burger, N.; Fuess, H.; Mason, S.A. Neutron diffraction of [alpha]-calcium formate at 100 and 296 K. Acta Crystallogr. Sect. B 1977, 33, 1968–1970. [Google Scholar] [CrossRef]
  25. Watanabe, T.; Matsui, M. A redetermination of the crystal structures of α-calcium formate, α-strontium formate and barium formate by X-ray analyses. Acta Crystallogr. Sect. B 1978, 34, 2731–2736. [Google Scholar] [CrossRef]
  26. Matsui, M.; Watanabe, T.; Kamijo, N.; Lapp, R.L.; Jacobson, R.A. The structures of calcium formate β-Ca(HCOO)2 and δ-Ca(HCOO)2, and the tetragonal mixed crystals Ca(HCOO)2-Sr(HCOO)2. Acta Crystallogr. Sect. B 1980, 36, 1081–1086. [Google Scholar] [CrossRef]
  27. Weber, G. The structure of anhydrous cadmium formate. Acta Crystallogr. Sect. B 1980, 36, 1947–1949. [Google Scholar] [CrossRef]
  28. Fuess, H.; Bats, J.W.; Dannohl, H.; Meyer, H.; Schweig, A. Comparison of observed and calculated densities. XII. Deformation density in complex anions. II. Experimental and theoretical densities in sodium formate. Acta Crystallogr. Sect. B 1982, 38, 736–743. [Google Scholar] [CrossRef]
  29. Heyns, A.M. The effect of pressure on the Raman spectra of solids. III. Sodium formate, NaHCOO. J. Chem. Phys. 1986, 84, 3610–3616. [Google Scholar] [CrossRef]
  30. Hamann, S.D.; Spinner, E.E. The Effect of Pressure on the Infrared Spectra of the Formates of the Alkali and Alkaline Earth Metals. Aust. J. Chem. 1977, 30, 957–970. [Google Scholar] [CrossRef]
  31. Kang, L.; Li, S.; Wang, B.; Li, X. The effect of high pressure on the structure and stability of sodium formate: Probed by in situ synchrotron X-ray diffraction technique. Solid State Commun. 2019, 289, 67–70. [Google Scholar] [CrossRef]
  32. Tsirelson, V.G.; Stash, A.I.; Tokatly, I.V. Bonding in molecular crystals from the local electronic pressure viewpoint. Mol. Phys. 2016, 114, 1260–1269. [Google Scholar] [CrossRef] [Green Version]
  33. Tsirelson, V.G.; Stash, A.I.; Tokatly, I.V. Quantum pressure focusing in solids: A reconstruction from experimental electron density. Acta Crystallogr. Sect. B 2019, 75, 201–209. [Google Scholar] [CrossRef] [PubMed]
  34. Becke, A.D. Density-functional exchange-energy approximation with correct asymptotic behavior. Phys. Rev. A 1988, 38, 3098–3100. [Google Scholar] [CrossRef] [PubMed]
  35. Bader, R.F.W.; Beddall, P.M. Virial Field Relationship for Molecular Charge Distributions and the Spatial Partitioning of Molecular Properties. J. Chem. Phys. 1972, 56, 3320–3329. [Google Scholar] [CrossRef]
  36. Rogers, C.L.; Rappe, A.M. Geometric formulation of quantum stress fields. Phys. Rev. B 2002, 65, 224117. [Google Scholar] [CrossRef] [Green Version]
  37. Bartashevich, E.; Sobalev, S.; Matveychuk, Y.; Tsirelson, V. Variations of quantum electronic pressure under the external compression in crystals with halogen bonds assembled in Cl3-, Br3-, I3-synthons. Acta Crystallogr. Sect. B 2020, B76, 514–523. [Google Scholar] [CrossRef]
  38. Bartashevich, E.V.; Sobalev, S.A.; Matveychuk, Y.V.; Tsirelson, V.G. Simulation of the compressibility of isostructural halogen containing crystals on macro- and microlevels. J. Struct. Chem. 2021, 62, 1607–1620. [Google Scholar] [CrossRef]
  39. Matveychuk, Y.V.; Bartashevich, E.V.; Skalyova, K.K.; Tsirelson, V.G. Quantum electronic pressure and crystal compressibility for magnesium diboride under simulated compression. Mater. Today Commun. 2021, 26, 101952. [Google Scholar] [CrossRef]
  40. Dovesi, R.; Erba, A.; Orlando, R.; Zicovich-Wilson, C.M.; Civalleri, B.; Maschio, L.; Rérat, M.; Casassa, S.; Baima, J.; Salustro, S.; et al. Quantum-mechanical condensed matter simulations with CRYSTAL. Wiley Interdiscip. Rev. Comput. Mol. Sci. 2018, 8, e1360. [Google Scholar] [CrossRef]
  41. Groom, C.R.; Bruno, I.J.; Lightfoot, M.P.; Ward, S.C. The Cambridge Structural Database. Acta Crystallogr. Sect. B 2016, 72, 171–179. [Google Scholar] [CrossRef]
  42. Dou, Y.; Egdell, R.G.; Law, D.S.L.; Harrison, N.M.; Searle, B.G. An experimental and theoretical investigation of the electronic structure of CdO. J. Phys. Condens. Matter 1998, 10, 8447–8458. [Google Scholar] [CrossRef] [Green Version]
  43. Vilela Oliveira, D.; Laun, J.; Peintinger, M.F.; Bredow, T. BSSE-correction scheme for consistent gaussian basis sets of double- and triple-zeta valence with polarization quality for solid-state calculations. J. Comput. Chem. 2019, 40, 2364–2376. [Google Scholar] [CrossRef]
  44. Laun, J.; Vilela Oliveira, D.; Bredow, T. Consistent gaussian basis sets of double- and triple-zeta valence with polarization quality of the fifth period for solid-state calculations. J. Comput. Chem. 2018, 39, 1285–1290. [Google Scholar] [CrossRef]
  45. Perger, W.F.; Criswell, J.; Civalleri, B.; Dovesi, R. Ab-initio calculation of elastic constants of crystalline systems with the CRYSTAL code. Comput. Phys. Commun. 2009, 180, 1753–1759. [Google Scholar] [CrossRef]
  46. Doll, K. Analytical stress tensor and pressure calculations with the CRYSTAL code. Mol. Phys. 2010, 108, 223–227. [Google Scholar] [CrossRef] [Green Version]
  47. Gaillac, R.; Coudert, F.-X. ELATE: Elastic Tensor Analysis. Available online: http://progs.coudert.name/elate (accessed on 30 June 2023).
  48. Mouhat, F.; Coudert, F.-X. Necessary and sufficient elastic stability conditions in various crystal systems. Phys. Rev. B 2014, 90, 224104. [Google Scholar] [CrossRef] [Green Version]
  49. Zhurko, G.A. Chemcraft—Graphical Program for Visualization of Quantum Chemistry Computations; Ivanovo, Russia. 2005. Available online: https://chemcraftprog.com (accessed on 30 June 2023).
  50. Bader, R.F.W. A quantum theory of molecular structure and its applications. Chem. Rev. 1991, 91, 893–928. [Google Scholar] [CrossRef]
  51. Gatti, C.; Casassa, S. Topond14 User’s Manual; University of Torino: Torino, Italy, 2014. [Google Scholar]
  52. Kirzhnits, D.A. Quantum Corrections to the Thomas-Fermi Equation. J. Exp. Theor. Phys. 1957, 5, 64–72. [Google Scholar]
Figure 1. Orientation of the axes of maximal and minimal linear compressibility in the α-Ca2+fmt.
Crystals 13 01147 g001
Figure 2. Changes of certain cell parameters and minimal linear compressibility values under hydrostatic compression of crystals: (a) α-Ca2+fmt, (b) β-Ca2+fmt, (c) Cd2+fmt, (d) Na+fmt.
Crystals 13 01147 g002
Figure 3. Orientation of the axes of maximal and minimal linear compressibility in β-Ca2+fmt. View of the structure along (a) the axis b and (b) the axis c.
Crystals 13 01147 g003
Figure 4. Orientation of the axes of maximal and minimal linear compressibility in the Cd2+fmt crystal; the selection shows the orientation of strip motif of Cd2+ and formate groups.
Crystals 13 01147 g004
Figure 5. Orientation of the axes of maximal and minimal linear compressibility in Na+fmt. View of the structure (a) along the axis b and (b) orthogonal to layer.
Crystals 13 01147 g005
Figure 6. Maps of p(r) across the “pseudo-rhombic” void channel, along the LCmin axis and perpendicular to the LCmax axis in α-Ca2+fmt under pressure (a) 0 GPa and (b) 4 GPa (scale in Bohr, p(r) in a.u.).
Crystals 13 01147 g006
Figure 7. The change of p(r) between Ca2+ ions with increasing external compression in α-Ca2+fmt: (a) along the LCmin axis, (b) along the LCmax axis.
Crystals 13 01147 g007
Figure 8. Maps of p(r) in the coplanar plane to the a0b plane passing through the Ca2+…Ca2+…Ca2+ positions and perpendicular to the LCmax axis in β-Ca2+fmt under the pressure (a) 0 GPa; (b) 6 GPa (scale in Bohr, p(r) in a.u.).
Crystals 13 01147 g008
Figure 9. Maps of p(r) in the plane formed by the LCmin and LCmax axes reduced to the Na…Na…Na positions in Na+fmt under the pressure (a) 0 GPa and (b) 6 GPa (scale in Bohr, p(r) in a.u.).
Crystals 13 01147 g009
Figure 10. Change of p(r) in the Na+fmt crystal with increasing external compression: (a) along the LCmin axis, (b) along the LCmax axis, reduced to the Na+…Na+ line.
Crystals 13 01147 g010
Figure 11. The behavior of p(rbcp) for (a) the most changing M…O bonds, (b) the least changing M…O bonds with an increase in hydrostatic compression.
Crystals 13 01147 g011
Figure 12. The behavior of the p(r) values with increasing hydrostatic compression: (a) p(rbcp) for the most changing H…O bonds, and (b) p(rccp).
Crystals 13 01147 g012
Disclaimer/Publisher’s Note: The statements, opinions and data contained in all publications are solely those of the individual author(s) and contributor(s) and not of MDPI and/or the editor(s). MDPI and/or the editor(s) disclaim responsibility for any injury to people or property resulting from any ideas, methods, instructions or products referred to in the content.

