Article

TIC Reorientation under Electric and Magnetic Fields in Homeotropic Samples of Cholesteric LC with Negative Dielectric Anisotropy

1
Univ Lyon, ENS de Lyon, Univ Claude Bernard, CNRS, Laboratoire de Physique, F-69342 Lyon, France
2
L2C, Univ Montpellier, CNRS, F-34070 Montpellier, France
3
Departament de Ciència de Materials i Química Física, Universitat de Barcelona, Martí i Franquès 1, 08028 Barcelona, Spain
4
Institute of Nanoscience and Nanotechnology, IN2UB, Universitat de Barcelona, Martí i Franquès 1, 08028 Barcelona, Spain
*
Author to whom correspondence should be addressed.
Crystals 2023, 13(6), 957; https://doi.org/10.3390/cryst13060957
Submission received: 19 May 2023 / Revised: 9 June 2023 / Accepted: 11 June 2023 / Published: 15 June 2023

Abstract

:
In this paper, we numerically and experimentally show that the director field orientation degeneracy within the Translationally Invariant Configuration (TIC) of a cholesteric liquid crystal under an electric field can be lifted by imposing a magnetic field  B  parallel to the electrodes. The configuration can be either parallel or perpendicular to the magnetic field depending on the values of the sample thickness, pitch, and applied voltage, with two equiprobable orientations in each case. The transition between the parallel and perpendicular orientations has hysteresis, suggesting that it is first order. When  B  is slightly tilted with respect to the electrode plane, the indeterminacy on the TIC orientation is removed when the TIC is directed along  B .

1. Introduction

Chiral nematic, or cholesteric, liquid crystals (LCs), can be obtained upon mixing a small amount of a chiral dopant into a nematic mesogen. As a result, molecules have a tendency to align at a small, but finite, angle with their neighbors, leading to spontaneous twist distortions of the director field. This tendency is frustrated under confinement, for instance, when a thin cholesteric layer is placed between parallel plates treated to impose perpendicular, or homeotropic, anchoring. Such configurations result in the formation of complex structures, for example finger-like distortions [1,2,3,4,5] and topological solitons called spherulites (or cholesteric bubbles) [6]. Recently, it has been shown that spatial confinement combined with electric fields leads to the emergence of an even richer variety of complex solitonic-like topological structures, which can be dynamically self-assembled into ordered reconfigurable lattices or driven as active colloidal quasi-particles [7,8]. This has unveiled new opportunities within the context of active colloids in complex fluids [9] and in the development of LC-based metamaterials [10].
When a homeotropic sample of cholesteric LC of negative dielectric anisotropy is placed under a strong enough electric field perpendicular to the confining electrodes, a Translationally Invariant Configuration (TIC) spontaneously forms [4,5,11,12]. In this configuration, the director rotates on a cone whose axis is tilted with respect to the normal to the two electrodes limiting the sample. In usual conditions, the projection of the cone orientation in the plane of the sample, defined by a polar  c -director, is random (Figure 1). Controlling the TIC orientation is important, for instance, to determine the direction of motion of propelled topological solitons, and this has been addressed either using a photosensitive dopant, which photoaligns the material using excitation with polarized light [13], or through unidirectional mechanical buffing of the polymeric anchoring layer [14]. While these two methods offer some degree of directional control, the former alters the physical properties of the mesogen, and the latter does not allow us to reconfigure the TIC direction.
In this work, we show that an in-plane magnetic field is able to break the degeneracy of the TIC that develops in a cholesteric liquid crystal with negative dielectric anisotropy and positive magnetic anisotropy. We further show that, depending on the interplay between the material properties, the thickness of the cell gap, the cholesteric pitch, the strength and orientation of the magnetic field, and the amplitude of an applied electric field, the  c -director can orient either parallel or perpendicular to the magnetic field, with a first order phase transition observed between the two configurations.
The manuscript is structured as follows. In Section 2, we perform a theoretical (both analytical and numerical) study of the TIC orientation in the presence of an in-plane magnetic field, and discuss the observation of a transition between two stable configurations. The effect of a small out-of-plane component of the magnetic field will be discussed at the end of the session, and a detailed analysis of the transition between the two TIC configurations is included as an appendix. In Section 3, we present our experimental setup and results, which feature an excellent agreement with the theoretical predictions. We finish the paper with some concluding remarks.

2. Theoretical Study of the TIC Orientation

2.1. Basic Equations and Numerical Method

Let us consider a layer of a cholesteric liquid crystal (LC) of negative dielectric anisotropy sandwiched between two parallel flat electrodes treated for strong homeotropic anchoring. The bottom electrode is at  z = 0  and the top one at  z = d . In the frame ( x , y , z ), the director  n  has as components:
n x = cos β sin α , n y = sin β sin α , n z = cos α .
In this work, we will consider that the TIC is only twisted along the z direction (perpendicular to the sample plane). As a result, angles  α  and  β  are only a function of z (also of time t, in the non-stationary regime). The  c -director of the TIC has for components (Figure 1)
c x = cos [ β m ( t ) ] , c y = sin [ β m ( t ) ] , c z = 0 ,
where  β m ( t ) = β ( d / 2 , t ) .
If only an electric field perpendicular to the electrodes is applied,  c  could assume any orientation in the (x, y) plane, since all orientations of the TIC are energetically equivalent ( β  is then defined up to an additive constant).
In the following, we will set  α m ( t ) = α ( d / 2 , t )  and will simply designate by  β m  and  α m  the values of  β m ( t )  and  α m ( t )  in the stationary regime.
In this paper, we will show that the indeterminacy in the orientation of the  c -director can be lifted by imposing a magnetic field, of components
B x = B cos θ , B y = 0 , B z = B sin θ ,
where  θ  denotes the tilt angle of the magnetic field with respect to the horizontal (sample) plane.
Note that the  c -director degeneracy can also be lifted trough unidirectional buffing of the anchoring surfaces, although, in this case, its orientation cannot be reconfigured [14]. For this reason, we will not study this method in the following.
Because the magnetic field does not break the translational invariance of the TIC in the horizontal plane, the director field inside the sample will remain a function of z and t only.
In continuum theory, the Euler–Lagrange motion equations for  α  and  β  read, when backflow effects are neglected:
δ R a δ α ˙ = δ F δ α   ,
δ R a δ β ˙ = δ F δ β   ,
where F is the total free energy per area in the  ( x , y )  plane,
F = 0 d 1 2 [ K 1 ( · n ) 2 + K 2 ( n · × n + q ) 2 + K 3 ( n × × n ) 2 D · E χ a μ 0 ( B · n ) 2 ] d z ,
and  R a  is the Rayleigh dissipation function,
R a = 0 d 1 2 γ 1 n ˙ 2 d z .
In these equations,  K 1 K 2  and  K 3  are the splay, twist and bend elastic constants, respectively,  γ 1  is the rotational viscosity,  χ a  is the magnetic anisotropy (positive),  q = 2 π / P  is the equilibrium twist of the cholesteric phase, P is the equilibrium cholesteric pitch,  E  is the electric field, and  D  is the electric displacement.
Using Equations (6) and (7), Equations (4) and (5) become, by assuming that  α  and  β  are functions of z and t only,
γ 1 α ˙ = K SB ( α ) α + sin 2 α 2 K 1 K 3 α 2 + K 3 2 K TB ( α ) β 2 + 2 K 2 q β ε 0 ε a E 2 + χ a B 2 2 μ 0 sin 2 α cos 2 β cos 2 θ sin 2 θ + cos 2 α cos β sin 2 θ ,
and
γ 1 sin 2 ( α )   β ˙ = z sin 2 α K TB ( α ) β K 2 q χ a B 2 μ 0 sin α sin β cos θ ( sin α cos β cos θ + cos α sin θ ) ,
where  K SB ( α ) K 1 sin 2 α + K 3 cos 2 α K TB ( α ) K 2 sin 2 α + K 3 cos 2 α u ˙ u / t  and  u u / z  for any function u. Note that the z-derivatives terms in Equation (5) were reorganized in Equation (9) to explicitly show the existence of a first integral when B and  β ˙  are zero.
In these equations, the local electric field along z is  E = U z = U , with U the electric potential. Because the TIC is translationally invariant in the horizontal plane, the only nonzero component of the displacement field  D  is  D z = ε 0 ( ε + ε a cos 2 α ) U  where  ε  ( ε ) is the relative dielectric permittivity perpendicular (parallel) to  n  and  ε a = ε ε < 0  is the dielectric anisotropy. In the dielectric regime, the potential U must satisfy the Maxwell equation  · D = 0 , which imposes that  D z  is a constant:
z ( ε + ε a cos 2 α ) U = 0 .
Using this conservation law and defining the rms applied voltage  V = 0 d U d z , we remark that the field E can be expressed in the following integral form:
E = V ( ε + ε a cos 2 α ) 0 d d z ε + ε a cos 2 α .
Equations (8)–(10) must be solved with the following boundary conditions (BC) on the two electrodes:
α ( 0 , t ) = α i ; α ( d , t ) = α i
β ( 0 , t ) = K 2 q K TB α ( 0 , t ) ; β ( d , t ) = K 2 q K TB α ( d , t )
U ( 0 , t ) = 0 ; U ( d , t ) = V
Equation (12) corresponds to Dirichlet boundary conditions for the polar angle  α , set to a small value  α i < 10 3  rad to avoid a numerical singularity (division by 0) on the electrodes and still satisfy, to a very good approximation, homeotropic anchoring conditions. Equation (13) corresponds to the surface torque equation for the azimuthal angle  β . Finally, Equation (14) corresponds to Dirichlet boundary conditions for the electric potential.
We numerically solved these equations with Mathematica 12 using the method of lines which is a general procedure for finding the solution of time dependent partial differential Equations [15]. To regularize the problem, we added to the r.h.s. of Equation (10) an arbitrary relaxation term of the form  γ u U t  and we chose the nonphysical friction coefficient  γ u  small enough for the electric potential to relax much faster than the director field (in practice, we took  γ u 0.01   s   μ m 2 ).
To explore the possibility of having multiple solutions at the same voltage V in the steady state, we also assumed that the voltage was of the form
V ( t ) = V + ( V i V ) e t / τ i
where  V i  is an initial voltage that was taken either smaller that  V t h  (0 in general) or larger. The transient time  τ i  was chosen much smaller than the final time  t f  at which the steady state is reached. Generally, we took  τ i = 10 s and  t f = 1000 s. We obviously checked that the final solution did not depend on the choice of  τ i V i  and  γ u  once the stationary state was reached.
Finally, it was necessary to specify, in the numerical code, how angles  α  and  β  and voltage U vary as a function of z at  t = 0 . In our case we simply took  α ( z , 0 ) = α i β ( z , 0 ) = β i + K 2 q / K TB ( α i ) ( z d / 2 )  with  β i  an arbitrary constant (we have chosen very often  β i = 0.1  or  β i = π / 2 0.1 ), and  U ( z , 0 ) = V i z / d , to satisfy the BCs above.
Before detailing the results of these simulations, we first examine under what conditions the TIC develops in the samples when the magnetic field is horizontal ( θ = 0 ). The case of a magnetic field slightly inclined with respect to the horizontal will be discussed later.

2.2. Spinodal Limit ( θ = 0 )

We begin by analyzing the onset of the transition to the TIC when an in-plane magnetic field is applied ( θ = 0 ). We know from previous studies that the cholesteric phase completely unwinds in homeotropic samples and gives a homeotropic nematic (HN) texture when the thickness d is smaller than  P K 32 / 2  [4,5], with  K 32 K 3 / K 2 , or equivalently when the confinement ratio  C = d / P  is smaller than the critical value  C K 32 / 2 . In these conditions, it is necessary to impose a destabilizing field so that the TIC develops. In the plane of the control parameters  ( V , d ) , there is therefore a particular line, called the spinodal line of the HN, above which the HN spontaneously destabilizes to form a TIC. The calculation of this spinodal limit is straightforward when  B = 0 . In this case, Equation (9) has a first integral, in steady state, of the form
β = q K 32 ,
where we assumed  α 1  (weak director deformation near the destabilization threshold). This gives, after integration,
β = β m + π C K 32 2 z d 1 ,
where the integration constant  β m  gives the orientation of the  c -director according to Equation (2). For  B = 0 , this constant is arbitrary, which means that the TIC can take any direction in the plane  ( x , y ) . The spinodal limit is then obtained by setting  α = α m sin ( π z / d )  and by expanding the energy F to second order in  α m F = F 0 + F 2 α m 2 + O ( α m 4 ) . The spinodal limit  V t h  of the HN is reached when  F 2  changes sign. This calculation gives the well-known result [4,5,11,12,16] (see Figure 2)
V t h = π 2 K 3 ε a ε 0 1 C C 2 .
It should be noted that, in this case,  V t h  only depends on the confinement ratio C.
The analysis is more complex when  B 0 . Doing the same expansion of the free energy as above, we find a  F 2  term of the form given in Appendix A, which is a functional of the  β -profile. By imposing that  F 2 = 0  at the spinodal limit, one can therefore find an analytical expression for  V t h  depending on integrals of the  β -profile. An easy way of estimating these integrals is expanding the solution for  β  as a Taylor series of the magnetic field, using at order 0 the simple form given in Equation (17):
β = β m + π C K 32 2 z d 1 + B 2 δ β .
Using this general solution in the integral expression of  F 2  in the appendix, one finds that the correction  δ β  disappears from terms of order 2 in the magnetic field and only intervenes at order 4. Furthermore, we also find that  β m = 0  minimizes the  F 2  term of the free energy. This means that, at the spinodal limit, the  c -director of the TIC—or more simply the TIC—orients parallel to the magnetic field. All this leads to the following simple analytical form for the spinodal threshold  V t h , valid at order 2 in B without having to explicitly know  δ β :
V t h ( B ) = V t h ( 0 ) 1 1 + sinc π C / C 1 C / C 2 B 2 2 B 2 .
Here,  sinc ( x ) sin x / x V t h ( 0 )  is given in Equation (18) and  B  is the magnetic Freedericksz threshold:
B π d μ 0 K 3 χ a 1 C C 2 .
To evaluate the validity of these formulae, we shall take in the following the values of the material constants and experimental conditions given in Table 1.
The spinodal limit calculated with Equation (20) is shown in Figure 2, which also includes the spinodal curve obtained with a rigorous numerical calculation of  β  (see Appendix A for details). As observed, the approximate formula is almost identical to the numerical one, confirming that an expansion at order 2 in B is enough for the typical magnetic fields used here. Note also that the spinodal curve calculated with  B 0  vanishes at a thickness  d = 10.73   μ m and is always below the one calculated with  B = 0  [green line in Figure 2], which vanishes at  d ( B = 0 ) = P K 3 2 K 2 = 11.63   μ m. This is expected since the magnetic field tends to destabilize the homeotropic nematic. Finally, it should be noted that the spinodal threshold  V t h  is no longer a universal function of the confinement ratio C when a magnetic field is applied, since the critical magnetic field  B c  explicitly depends on the sample thickness d.

2.3. Orientation Transitions of the TIC  ( θ = 0 )

A detailed analysis of the transition between the TIC and HN structures (see Appendix B) suggests the existence of a first order transition between two TIC states, TIC1, oriented parallel to B and TIC2, oriented perpendicular to B. In this section, we will find the line of coexistence between these two TIC states,  V 1 ( d ) , and the associated spinodal lines  V 1 ( d )  and  V 1 + ( d ) . The coexistence line intersects the spinodal curve of the HN at [ d = d 1 , V = V t h ( d 1 ) ], and the spinodal curves intersect the spinodal curve of the HN at [ d = d 1 V = V t h ( d 1 ) ]  and [ d = d 1 + V = V t h ( d 1 + ) ], respectively. To this purpose, we solved for each thickness d the motion Equations (8)–(10) as a function of V by taking  V i = V  and  β i = 0.1  or  β i = π / 2 0.1  and we plotted  β m ( t )  to find the orientation of the TIC in the stationary regime. A few curves calculated at  d = 7.5   μ m are shown in Figure 3a. First, we observed that in all cases,  β m ( t )  tends either to  β m = 0  (or  π ) or to  β m = ± π / 2 , meaning that only solutions of type TIC1 or TIC2 are stable [Figure 3b]. Second, we observed that below the voltage  V 1 2.82   Vrms, only a TIC1 develops, while above  V 1 + 3.15   Vrms, only a TIC2 is present. On the other hand, the two TIC may be observed between these two limits, meaning that they are either stable or metastable in this interval. To find at which voltage  V 1  the two solutions coexist, we calculated their energy  F 1  and  F 2  and solved the equation  F 1 ( V 1 ) = F 2 ( V 1 ) . At  d = 7.5   μ m, we found  V 1 = 2.974   Vrms [Figure 3c]. Reproducing the same calculation at different thicknesses allowed us to plot in the phase diagram the coexistence curve  V 1 ( d )  (solid red line in Figure 4) and the two spinodal curves  V 1 ( d )  and  V 1 + ( d )  (dashed and dotted red lines in Figure 4, respectively).
We also found that there exists a second transition of the same type in the phase diagram, but this time between a TIC2 and a TIC1 solution when the voltage—or the thickness—is increased. The coexistence curve  V 2 ( d )  and the two associated spinodal curves  V 2 ( d )  and  V 2 + ( d )  are also shown in Figure 4 (solid blue curve and dashed and dotted blue curves, respectively).

2.4. Role of a Tilted Magnetic Field ( θ 0 )

It is easy to verify that if the magnetic field is in-plane ( θ = 0 ) and if  β  is a solution of the equations of motion (8) and (9), then  β ± π  is also a solution of these equations. This means that there are two possible opposite directions for the  c -director of TIC1 or TIC2.
This degeneracy is lifted, at least in the case of TIC1, when the field B is tilted with respect to the horizontal ( θ 0 ). To verify this point, we solved the equations of motion by placing ourselves in a region of the phase diagram where TIC1 develops and by assuming that the field is slightly tilted. The curves (a–d) in Figure 5, calculated by taking  d = 7.5   μ m,  α i = 10 3 t f = 5   s,  V i = V = 2   Vrms,  B = 0.56   T and  β i = π / 2  show that the angle  β m ( t )  tends to 0 when  θ > 0  (here,  θ = 0.1 ) and to  π  when  θ < 0  (here,  θ = 0.1 ). This means that the  c -director of TIC1 orients in the direction of increasing x when  θ > 0  and in the direction of decreasing x when  θ < 0 .
By contrast, the orientation degeneracy is not lifted in the case of TIC2 as shown in the curves (e–h) in Figure 5 calculated by taking  d = 7.5   μ m,  α i = 10 3 t f = 100   s,  V i = V = 4   Vrms,  B = 0.56   T and  θ = 0.1 . At this voltage, a TIC2 develops when the magnetic field is horizontal. In this example, we see that  β m ( t )  tends to  β m + = 1.526  when we choose  β i = 0.1  and to  β m + = 1.526  when we take  β i = 0.1 . These two solutions have the same energy and are therefore equiprobable, but we note that their  c -director is no longer strictly perpendicular to B. In the same way, we verified that when  θ = 0.1 , two solutions with the same energy as the previous ones are possible. For these two solutions  β m ( t )  tends either to  β m = 1.615  or to  β m = 1.615  depending on the value of  β i  chosen. By symmetry, we have  β m + + β m = π . This discussion on the possible orientations of TIC1 and TIC2 when the magnetic field is tilted from the horizontal is summarized in Figure 6.
To complete this study, we investigated how the  V 1  transition line and its spinodal limits  V 1 +  and  V 1  were modified when the magnetic field B is tilted from the horizontal. The result is shown in Figure 7a where we have plotted how  V 1 V 1 +  and  V 1  change as a function of  θ  in a sample of thickness  d = 7.5   μ m. These curves show that, at constant B (here  B = 0.56   T),  V 1 V 1 +  and  V 1  increase when  θ  increases. On the other hand, the hysteresis characterized by the difference  V 1 + V 1  decreases when  θ  increases. Finally, we show in Figure 7b how angle  β m + —which gives the orientation of the  c -director of TIC2—changes as a function of the applied voltage and tilt angle  θ  in a sample of thickness  d = 7.5   μ m. This figure shows that the larger the tilt angle  θ , the further TIC2 is from being perpendicular to B, especially when the voltage is close to  V 1 . A remarkable feature in this figure is that all the curves intersect at the same point. At this particular point corresponding to a voltage  V 5   Vrms, TIC2 is perpendicular to B whatever the value of  θ .

3. Comparison with the Experiment

3.1. Cholesteric Mixture and Experimental Setup

The LC used is the mixture MLC2079. It was purchased from Merck (Darmstadt, Germany) and used as received. This mixture is nematic at room temperature and melts around 102  C. This mixture was doped with 0.813% by weight of the chiral molecule R811 (from Merck, Germany). For this concentration, the cholesteric pitch is  10 ± 0.25 μ m at room temperature (21  C) at which all the experiments were carried out. This point was checked by using a Cano wedge. The samples were all prepared between two glass slides covered with ITO (Indium Tin Oxide) to impose the electric field. Nickel wires of calibrated diameters were used as a spacer to fix the thickness of the samples. Particular care was taken with the parallelism between the electrodes, the angle of which was always less than 2 × 10 5  rad. Thickness was measured using a USB2000 Ocean Optic Spectrometer. Both electrodes were treated with the Nissan Polyimide SE-4811 to ensure strong homeotropic anchoring of the LC molecules. For increased precision, we remeasured most of the material constants, as given in Table 1. More precisely, we determined the elastic constants  K 1  and  K 3  and the two dielectric constants  ε  and  ε  by measuring with a capacitance method the Fredericksz transition in a  50 μ m-thick homeotropic sample. The magnetic anisotropy was then found by looking at how much the Fredericksz voltage drops when the homeotropic sample is subjected to a horizontal magnetic field of 1 T. For this measurement, a Halbach ring (from Magnetic Solutions Ltd., Sheffield, UK) of height 50 mm with a 26 mm bore was used. All these experiments were performed in the nematic phase using the pure MLC2079 mixture. We assumed that these constants were not modified in the dilute cholesteric phase. The constant  K 2  was determined in the cholesteric phase by measuring the threshold voltage  V t h  for the appearance of the TIC [given by Formula (18)] in three homeotropic samples with a thickness less than  P K 32 / 2  (to ensure unwound homeotropic texture, see above). Our values of the elastic and dielectric constants are in reasonable agreement with those given in the literature. For instance, the manufacturer gives, at 20  C,  ε = 10.2 ε a = 6.1 K 1 = 15.9 pN and  K 3 = 18.3 pN, while V. Joshi gives in their thesis [17] K 1 = 18   pN,  K 2 = 7.5   pN and  K 3 = 20   pN. For the rotational viscosity and the optical indices, we used the values given by the manufacturer (see Table 1).
To test our theoretical predictions on the orientation transition of the TIC, we used four homeotropic samples with thicknesses d = 6.05, 7.51, 10.3, 12.65  μ m. To facilitate the observations, we simply placed each sample on the upper face of the Halbach ring. At this place, the magnetic field is horizontal (in-plane) only in the center of the ring and is  B = 0.56   T (for a calibration of the Halbach ring along its axis of revolution, see Ref. [18]). This ring is fixed on an optical bench equipped with a halogen lamp housing, an interference filter at 546 nm, a polarizer oriented along the x-axis parallel to B, a quarter-wave plate (rigorously quarter-wave at 578 nm) whose slow axis is at an angle of 45  with the x-axis, a macrozoom lens, a rotating analyzer driven by a stepping motor, and a Guppy Pro F-125B camera (Allied Vision) interfaced with a LabView program (Figure 8).
We now detail the results obtained for each of the samples. All the measurements were performed under AC electric field in the LC dielectric regime, at a frequency of 1 kHz.

3.2. Orientation Transitions and Hysteresis

We first examine the behavior of the thinnest sample, of thickness  d = 6.05 μ m. A direct observation in the vicinity of the axis of the Halbach ring revealed that a wall systematically forms along the y-axis perpendicular to B when a large enough voltage is applied (see Figure 9a–e). This wall develops above the onset of instability of the TIC and separates two regions where the  c -director of the TIC is oriented in opposite directions. The formation of this wall was expected since the magnetic field lines are curved outside the magnet and are therefore slightly tilted with respect to the horizontal plane on either side of the wall in the sample. The formation of this wall thus confirms our theoretical prediction on the orientation of the TIC by a tilted magnetic field (see Section 2.4). We also noted that no other wall formed parallel to B, which clearly indicates that only one solution exists on either side of the wall. We are therefore dealing with a TIC1, in accordance with the phase diagram shown in Figure 4. Figure 9a–e shows images of this wall at different voltages when it is observed between polarizer and analyzer parallel to the x-axis (without the  λ / 4 -wave plate). Under these optical conditions, we numerically checked using Jones calculus that between 2 and 7 Vrms the intensity transmitted through the TIC is minimal when its  c -director is close to 45  or 135  (mod. 180 ) from the x-axis. Consequently, the  c -director rotates by 90  between the two minima of the intensity profile, the distance of which defines the width W of the wall. Figure 9f shows how W varies as a function of V. It clearly appears that W diverges when the voltage reaches a value close to 6.4 Vrms. Above this value, the wall disappears, meaning that the TIC1 is transformed into a TIC2. Note that the  c -director of the TIC2 is strictly perpendicular to B only in the center of the sample where B is horizontal and turns to the right or to the left on either side of the center as predicted by our calculation because of the inclination of the magnetic field with respect to the horizontal (see Section 2.4). The approximate orientation of the  c -director deduced from the measurement of the local intensity between parallel polarizer and analyzer is indicated on each panel of Figure 9a–f. By decreasing the voltage, we observed that the wall reappears, but at a lower voltage, of the order of 5.6 Vrms, as shown in Figure 9g, where we also plotted W as a function of V at decreasing voltage. This behavior confirms the numerical observation that the TIC1->TIC2 transition has hysteresis. Note that these values are in rather good agreement with the values calculated above, which are  V 1 = 5.21   Vrms (downwards ramp) and  V 1 + = 6.39   Vrms (upwards ramp).
To confirm the existence of this orientation transition, we also measured the curve of transmitted intensity  I ( φ )  through the sample when the polarizer is parallel to the x-axis and the analyzer rotates by 360  starting from  φ = 0 . Here,  φ  denotes the angle of the analyzer with the x-axis. For this measurement, performed with a  6.05 μ m-thick sample, it was essential to add the quarter-wave plate to differentiate the two types of TIC. However, this optical measurement does not allow to determine in which direction each TIC is oriented, the intensity curves being invariant by the transformation  β β + π . All measurements were performed inside a 50 × 50    μ m 2  square whose center was slightly offset from the center of the wall to have a homogeneous intensity. A few curves are shown in Figure 10 and are compared to the theoretical curves calculated using Jones calculus and the numerical director field found by taking  θ = 0 . In this figure, we note that, at 6 Vrms, the curve of TIC1 is observed during an upward voltage ramp while the curve of the TIC2 is observed when decreasing the voltage, again revealing that the transition does indeed have hysteresis. This figure shows that there is very good agreement between theory and experiment in this sample.
We performed similar measurements in a 7.51  μ m-thick sample, where we found experimentally a threshold voltage for the TIC formation  V t h 1.3  Vrms and we observed that the two TIC coexist between  V 1 2.8  Vrms and  V 1 + 3.2  Vrms, while the numerics give  V t h = 1.32  Vrms,  V 1 = 2.82  Vrms, and  V 1 + = 3.15  Vrms. The main difference with the  6.05 μ m-thick sample is that the TIC1 is now unstable with respect to the formation of cholesteric fingers of the first type (CF1) between 1.6 and 2.4 Vrms (Figure 11). These fingers are perpendicular to B, which is compatible with a periodic modulation perpendicular to the  c -director of the TIC1, as expected for a CF1 [4,5,11]. This result contrasts with a previous study, which suggested that fingers always align parallel to the magnetic field [19].
The next measurements were performed in a 10.3  μ m-thick sample. As expected, we did only observe the TIC2 solution above 3 Vrms. Below this voltage, TIC2 destabilizes to form CF1, this time parallel to B. A few experimental and theoretical curves  I ( φ )  are shown in Figure 12. Again we note a very good agreement between experiments and theory.
Finally, we performed measurements in a 12.65  μ m-thick sample at voltages larger than 2.3 Vrms. As expected, we observed a TIC2→TIC1 transition at increasing voltage and the coexistence between the two TIC between 3.5 and 4.5 Vrms. This is compatible with our numerics which give, in excellent agreement,  V 2 = 3.4   Vrms and  V 2 + = 4.5   Vrms. The optical curves  I ( φ )  experimentally measured are also in good agreement with the theoretical curves as can be seen in Figure 13. Below 2.3 Vrms, cholesteric fingers develop. Surprisingly, these fingers are perpendicular to the magnetic field, whereas we would rather expect them to be parallel to B as in the 10.3  μ m-thick sample, since they also form from a TIC2. This observation indicates that we are no longer dealing with CF1, but with a new type of fingers with a different topology. This issue will be discussed in a future publication.

4. Conclusions

In this work, we have shown that the in-plane magnetic field generated with a ring of permanent magnets can determine the orientation of the  c -director of a confined layer of cholesteric liquid crystal with negative dielectric anisotropy. The mesogen is confined between two parallel electrodes that impose homeotropic anchoring conditions, and the cell gap is close to the cholesteric pitch of the chiral mesogen.
Interestingly, we have put into evidence analytically, numerically, and experimentally the existence of two stable configurations where the  c -director is either perpendicular or parallel to the applied magnetic field. The transition between the two configurations, which can be controlled by tuning the amplitude of the applied electric field, is shown to be first order as evidenced by the hysteresis observed between upward and downward electric field ramps. At constant voltage, the stable TIC orientation depends on the confinement ratio, that is, the ratio between the cell gap, d, and the cholesteric pitch, P. A detailed analysis of the phase diagram reveals that there are in fact two transitions between the two TIC configurations. For  d < P , the TIC is parallel to B at low voltages and perpendicular to B at high voltages, while the order is reversed when  d > P .
It will be interesting to extend this study to the regime where cholesteric fingers are stable under the external magnetic field, exploring the relationship between finger and TIC orientation. In the known fingers of type 1, the latter are perpendicular to the TIC, but different possibilities may arise in the presence of the magnetic field at large confinement ratio ( d / P > 1.1 ). Similarly, the control over the TIC orientation endowed by the magnetic field will be exploited to steer the driving of stable spherulites. Preliminary experiments have shown that this does not work with the mesogen used in this work, as the range of stable spherulites and stable fingers overlap in the regions of interest where the transition between the two types of TIC is observed. Other mesogens with significanly different material properties will have to be considered.

Author Contributions

Conceptualization, P.O. and J.I.-M.; methodology, P.O. and J.I.-M.; software, P.O. and G.P.; formal analysis, P.O.; writing—original draft preparation, P.O.; writing—review and editing, G.P. and J.I.-M. All authors have read and agreed to the published version of the manuscript.

Funding

J.I.-M. acknowledges funding from MICINN/AEI/10.13039/501100011033 (Grant No. PID2019-108842GB-C22).

Data Availability Statement

Data and numerical tools are available from corresponding author upon reasonable request.

Acknowledgments

J.I.-M. acknowledges the hospitality from ENS Lyon.

Conflicts of Interest

The authors declare no conflict of interest.

Appendix A. Numerical Calculation of the Spinodal Limit

When  B 0 , Equation (9) for  β  no longer has a steady-state first integral. That means that  β  deviates from the simple form given in Equation (17) and must be calculated numerically. The procedure is as follows: first, we set  α = α m sin ( π z / d )  and we then expand F to second order in  α m . We note that the electric potential also must be expanded up to order 2 in  α m  for this expansion to be correct, especially when calculating the tricritical point as in the next appendix. This can be done using Equation (11), which gives (This expansion was not performed in an earlier work by Ribière et al. [11] whose calculations, therefore, are not entirely correct, even in the simple case where  B = 0 .):
E = V d 1 ε a 2 ε cos 2 π z d α m 2 .
After a straightforward calculation, we find that the total free energy can be written as  F 0 + α m 2 F 2 , where each term has the following form:
F 0 = K 2 ( q d ) 2 ϵ V 2 2 d ,
F 2 = K 3 π 2 ϵ a V 2 4 d + 0 d sin 2 π z d f k ( β ) + B 2 f b ( β ) d z
f k ( β ) = 1 2 ( K 3 β 2 K 2 q ) β
f b ( β ) = 1 2 χ a cos 2 β
Minimizing the  F 2  term with respect to  β  leads in steady state to the following Euler–Lagrange equation for  β ( z ) :
β + K 3 cot π z d β q K 32 2 π d χ a B 2 μ 0 K 3 sin β cos β = 0 .
This equation must be solved with the two BCs  β ( 0 ) = β ( d ) = q / K 32 .
We solved this equation with Mathematica 12 by using a shooting method with starting initial conditions:  β ( d / 2 ) = β i  and  β ( d / 2 ) = K 2 q / K 3 , where  β m  is an arbitrary constant. Depending on the value of  β i , we found two solutions corresponding to  β m = 0  (sol 1) and  β m = π / 2  (sol 2) in the final (steady) state. For each of these solutions, we then calculated  F 2  and noted that, whatever the thickness, the value of  F 2  found for sol 2 was always greater than that found for sol 1. This means that, at the spinodal limit, the  c -director of the TIC -or more simply the TIC– orients parallel to the magnetic field.
On Figure A1, we compare the numerically calculated sol 1 with the approximate profile using Equation (17) with  β m = 0 . As visible, these profiles are extremely close, which further validate the theoretical approach in the main text. Finally, the critical voltage  V t h  was determined numerically by finding for what value of V the coefficient  F 2  calculated with sol 1 vanishes, leading to the following integral formula:
V t h V 0 2 = 2 π 0 π 1 2 C C β Z + β Z 2 B B 0 2 cos 2 β sin 2 Z d Z ,
with  V 0 = π K 3 / ( ε 0 ε a ) B 0 = ( π / d ) μ 0 K 3 / χ a , and  Z = π z / d . Evaluating this formula with the numerically calculated sol 1 gave the dashed red line of Figure 2, which is also very close to the approximate formula given in the main text.
Figure A1. Comparison between the exact profile  β ( z )  (solid line) obtained by solving Equation (A6) with  B = 0.56 T and the analytical profile (dashed line) found at  B = 0  when  β m = 0  [Equation (17)]. The sample thickness is  d = 9   μ m and the cholesteric pitch is  P = 10   μ m.
Crystals 13 00957 g0a1

Appendix B. Order of the Transition between TIC and Homeotropic Structures (θ = 0)

Previous studies in the absence of magnetic field indicate the presence of a tricritical point on the spinodal line of coordinates  ( d t c , V t c )  with  V t c = V t h ( d t c ) . At this point, the transition changes order, being second order when  d < d t c  and first order when  d > d t c .
To find the position of the tricritical point in the presence of a magnetic field, a calculation to order 4 in a disturbance is necessary. This calculation is complicated because it is necessary to take into account not only the disturbance of the type  α m sin ( π z / d )  for angle  α  but also a disturbance of the type  δ β = β c cos ( π z / d )  for the angle  β , as the previous appendix suggests when  B 0  (see Equation (A6) and Figure A1). Moreover, at order 4 in the disturbance, the electric field must be expanded at order 2 in  α m  similar to the previous appendix.
As an approximation, we can neglect the disturbance in  β c , which leads to the following equation in  Q = q d / ( π K 32 ) = C / C  that must be solved to find the cell thickness at the tricritical point,  d t c :
Q 2 = κ 1 κ 2 B 2 2 B 0 2 g ( Q ) ,
with  κ 1 K 13 ε a / ε κ 2 3 1 K 23 ε a / ε B 0 = ( q / K 32 ) μ 0 K 3 / χ a K i j = K i / K j  and:
g ( Q ) ε a ε + ( ε Q 2 + 4 ε a ) sinc π Q ε ( Q 2 4 ) ( Q 2 1 ) .
Solving Equation (A8) with the values of the material constants given in Table 1 gives  d t c = 9.66   μ m.
To test the accuracy of this prediction, we calculated the position of the tricritical point by solving numerically for each thickness Equations (8)–(10) in a small interval of voltages around  V t h . In the following, we will set  Δ V = V V t h  and  Δ V i = V i V t h , with V (resp.,  V i ) the final (resp., initial) voltage in our simulations as described above. In our calculations, we took  γ u = 0.01   μ m 2 τ i = 10   s,  α i = 10 6 β i = 1  and  t f  large enough for the stationary regime to be reached. For the initial voltage, we took either  V i = 0  or  V i = V t h + 0.5   Vrms ( Δ V i = 0.5   Vrms). In the first case, the initial state is the HN, while in the second, the system transits through a high amplitude TIC before relaxing towards the steady state. In the following, all the curves calculated by taking  V i = 0  will be drawn in blue, while those obtained by using  Δ V i = 0.5   V will be drawn in red.
A first set of curves calculated this way is shown in Figure A2 when  d = 9   μ m and  Δ V = 0.1   Vrms. In this example,  β m = 0  and  α m = 0.749  for all cases. This shows that there is only one steady state here, corresponding to a TIC of finite amplitude oriented parallel to B.
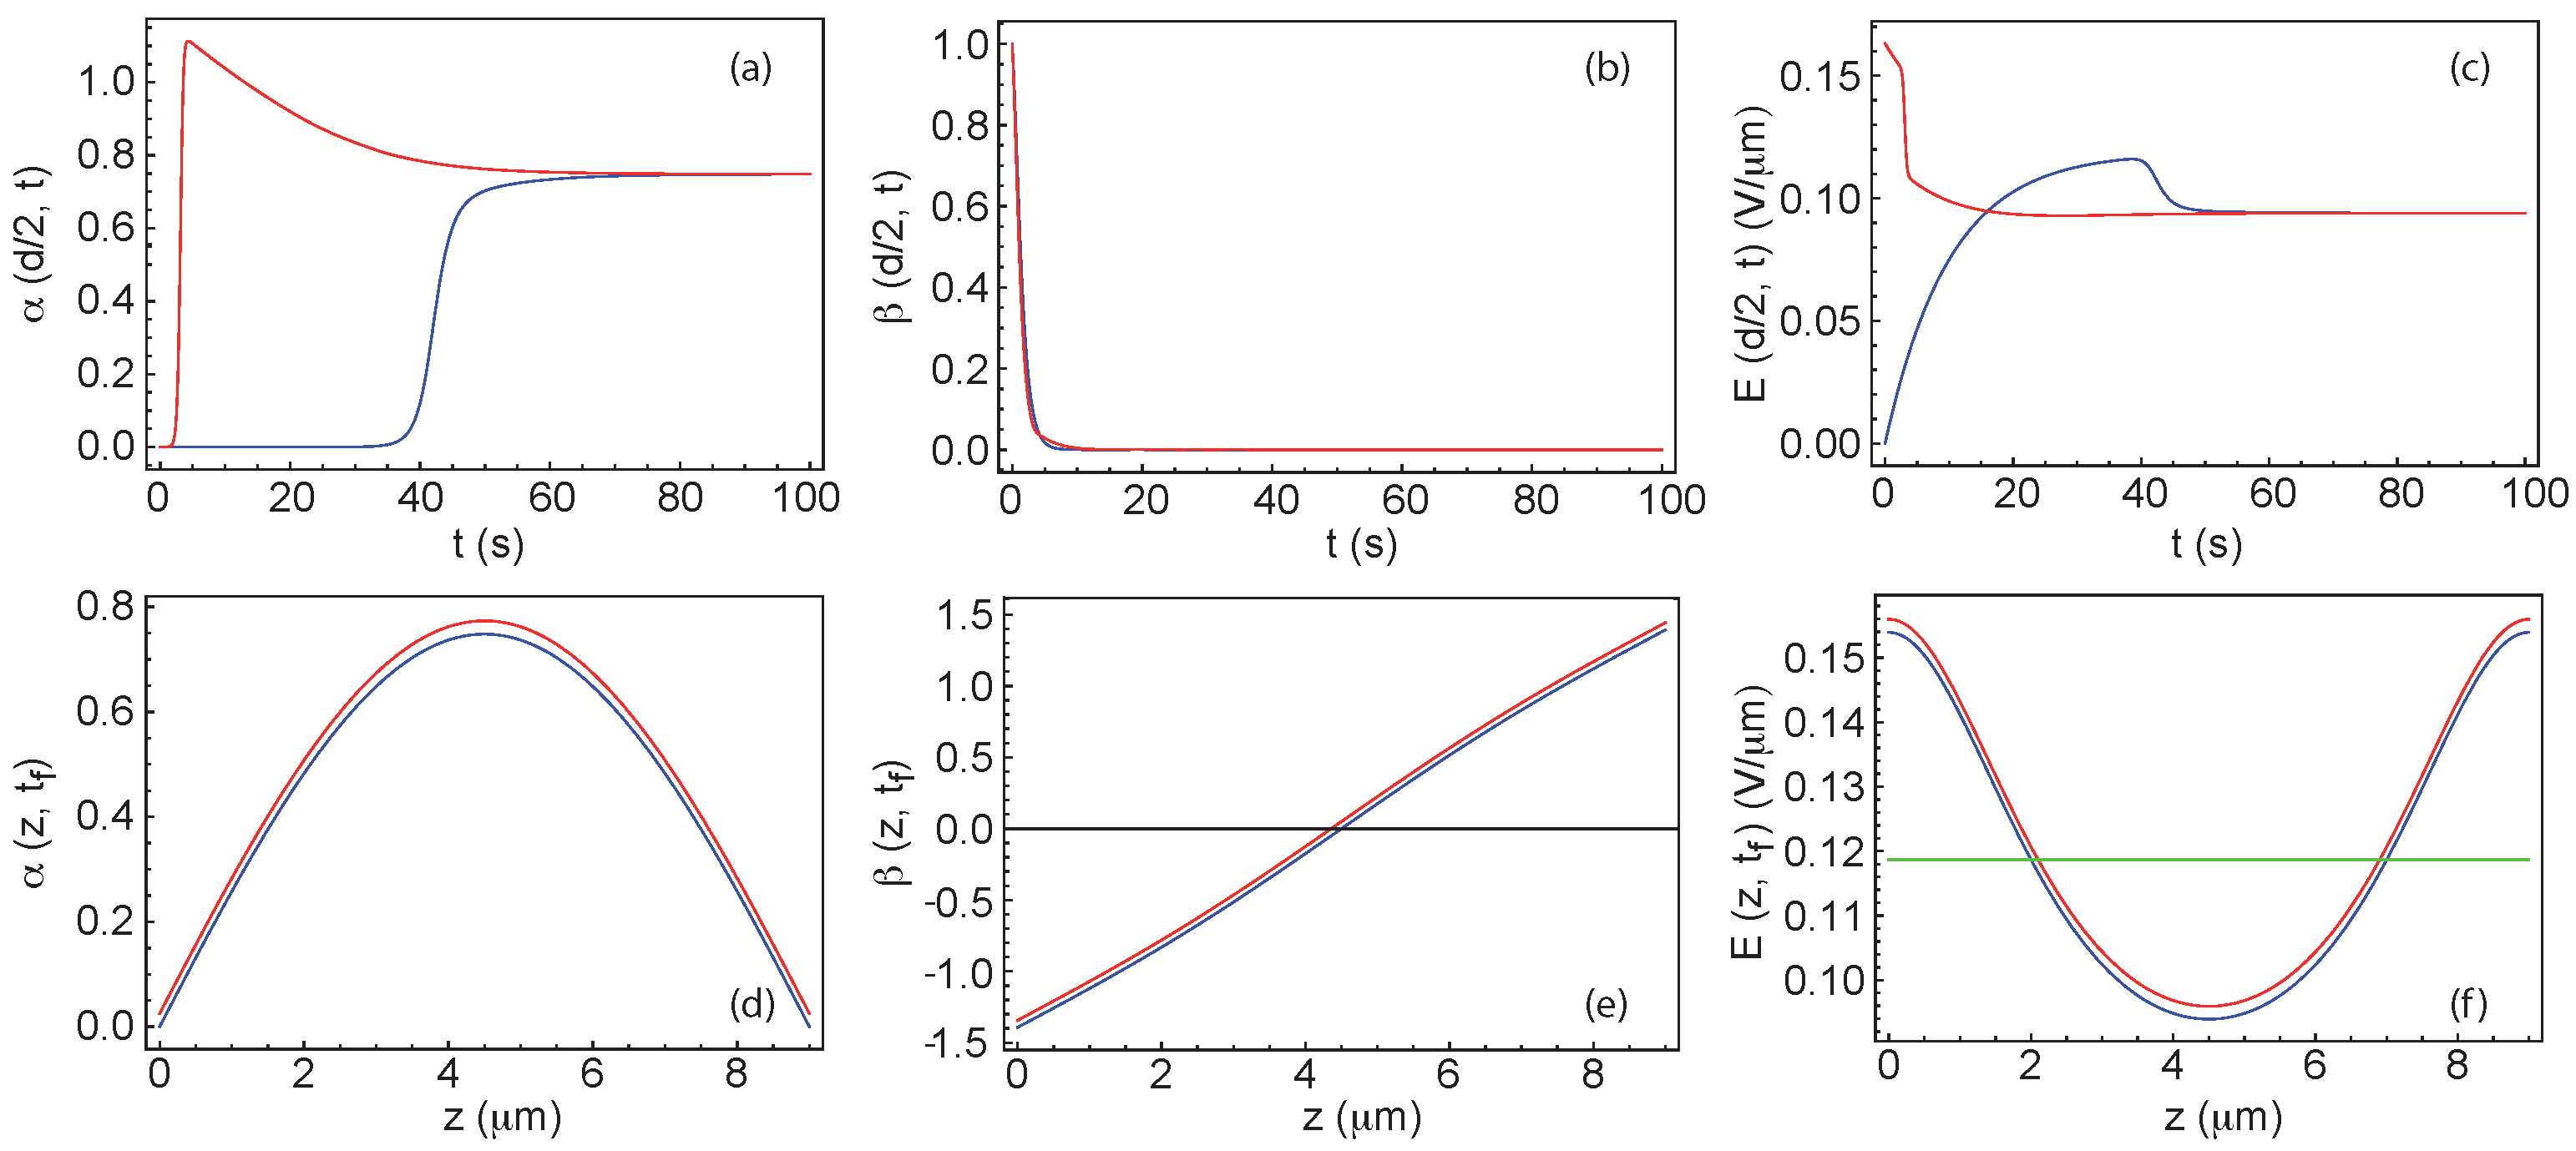
The situation is different at larger thickness as shown in Figure A3 calculated by taking  d = 9.5   μ m and  Δ V = 0.01   Vrms. In this particular example, two distinct stationary states are reached depending on the value of  V i : a TIC of small amplitude when  V i  is small (here equal to 0) and a TIC with a larger amplitude when  Δ V i  is large enough (here equal to 0.5 Vrms). Note that these two TIC orient parallel to B since  β m = 0  in the two cases (whatever the chosen value of  β i ). The calculation of F gives  F = 11.714  for the TIC of small amplitude (blue curve) and  F = 11.711  for the TIC of large amplitude. Here the energy is given in pN/ μ m. As a consequence, the TIC of small amplitude is metastable while the one of larger amplitude is stable. This calculation shows the existence of a first order transition line between two TIC parallel to B with different amplitudes, in the vicinity of the spinodal line of the HN.
Figure A2. Numerical solutions of Equations (8)–(10) at  d = 9   μ m and  Δ V = 0.1   Vrms calculated by taking  V i = 0  (blue curves) and  Δ V i = 0.5   Vrms (red curves). (ac) Time evolution of the angles  α  and  β  and of the electric field E in the middle of the sample; (df) z-profiles of angles  α  and  β  and of the electric field E in steady state. In graphs (df), the red curves have been shifted slightly upwards to become visible. In (f) the green line shows the average electric field  V / d .
Crystals 13 00957 g0a2
Figure A3. Numerical solutions at  d = 9.5   μ m and  Δ V = 0.01   Vrms calculated by taking  V i = 0  (blue curves) and  Δ V i = 0.5  (red curves). (ac) Time evolution of the angles  α  and  β  and of the electric field E in the middle of the sample; (df) z-profiles of angles  α  and  β  and of the electric field E in steady state. In (f) the green line shows the average electric field  V / d . In this example, two different stationary solution are found. The blue one is stable, and the red one metastable.
Crystals 13 00957 g0a3
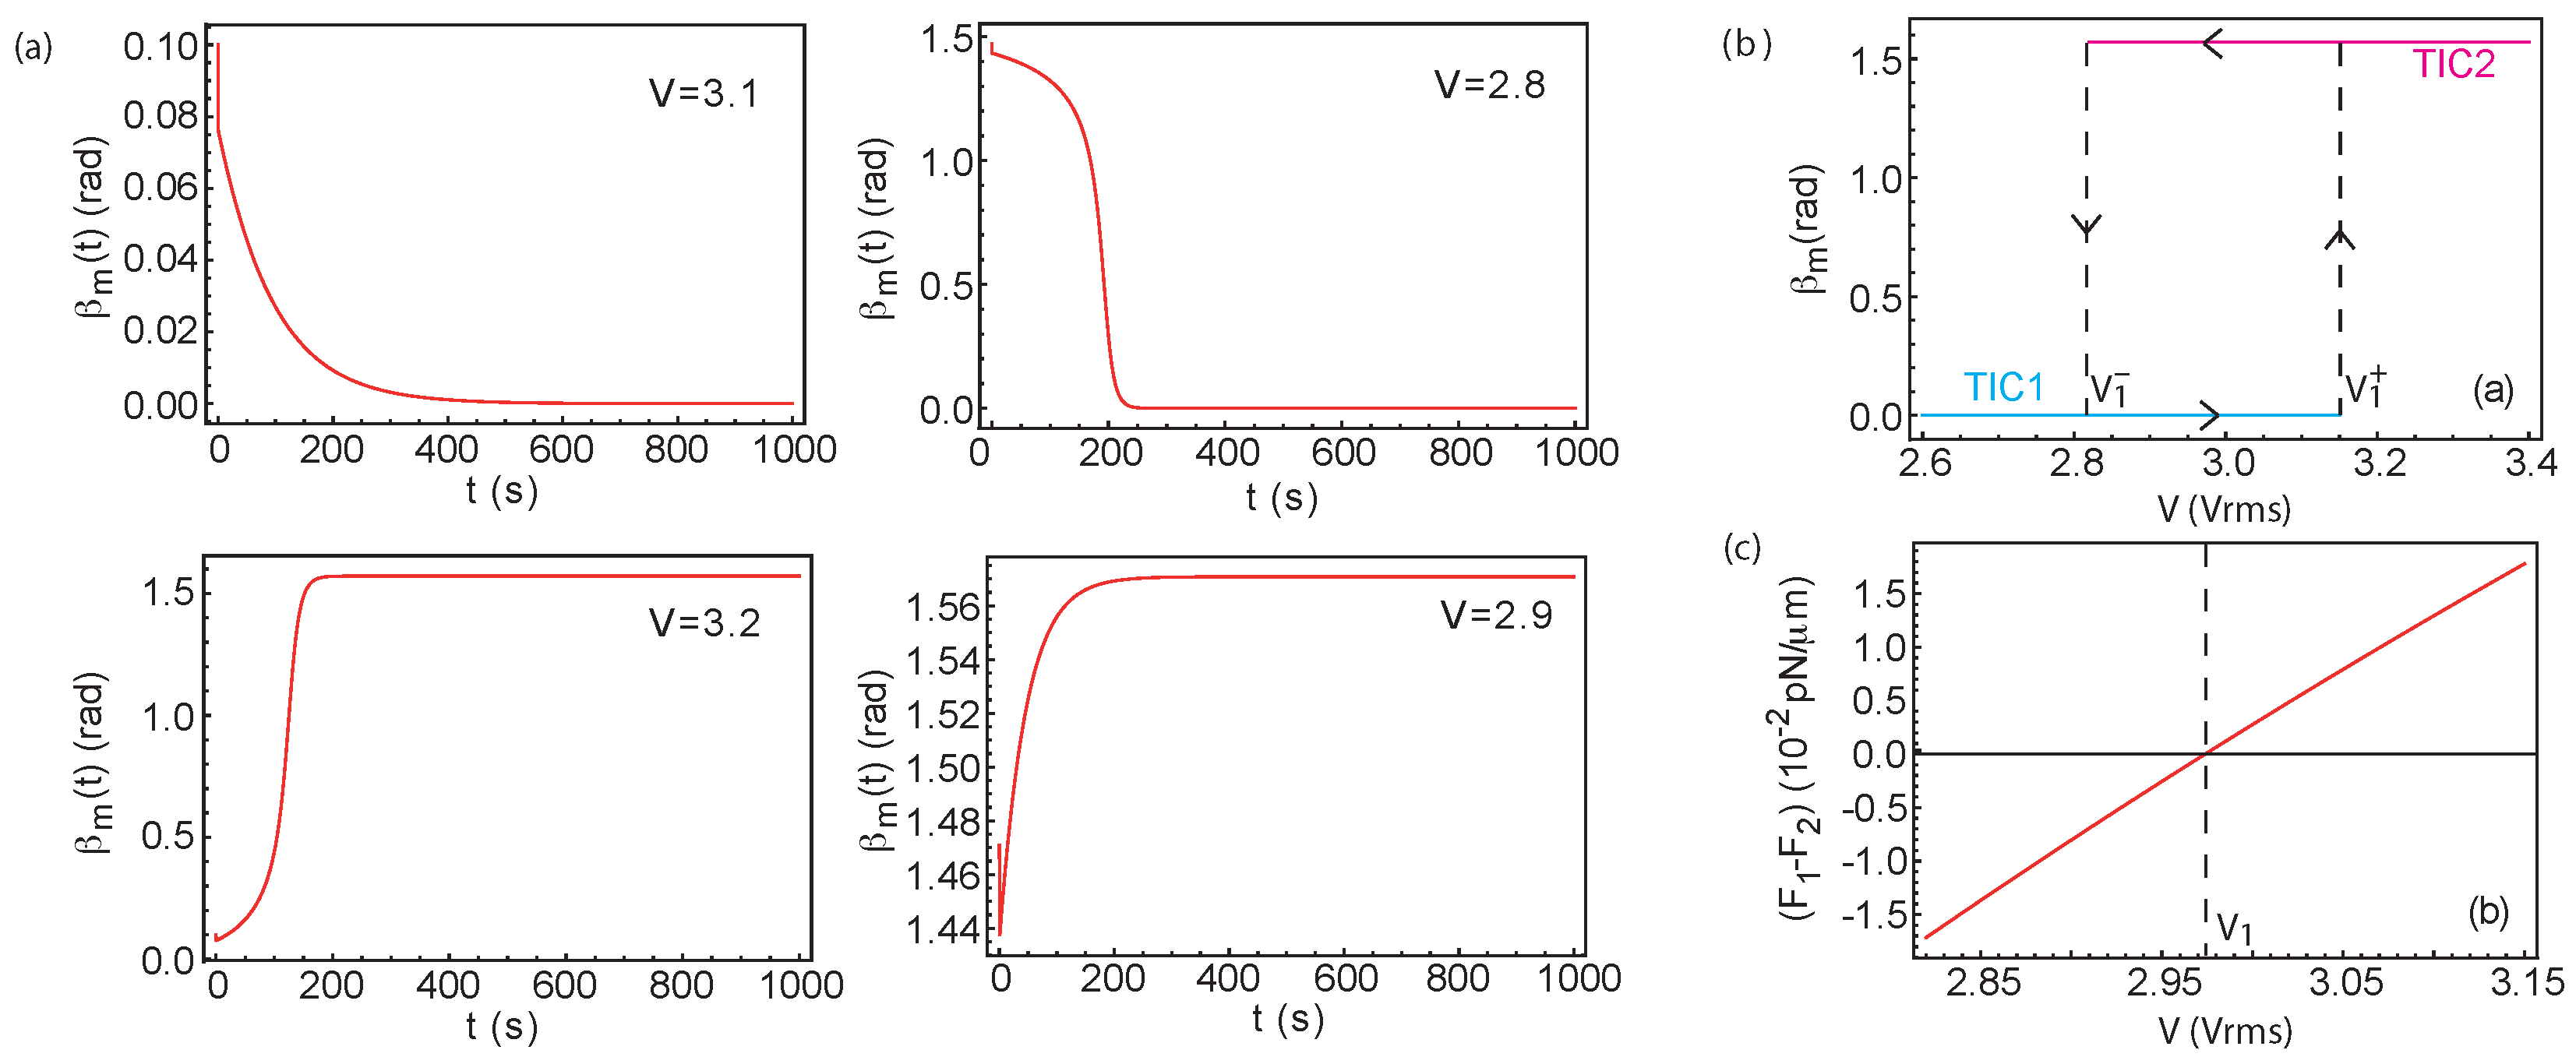
To confirm this point and determine the order of the HN→TIC transition, we systematically calculated  α m  as a function of V at different thicknesses (Figure A4). As before the blue curves were calculated by taking  V i = 0   Vrms and the red curves by taking  Δ V i = 0.5   Vrms. With these values, we found that, in all cases, the TIC orients parallel to B in the stationary regime ( β m = 0 ). However, important changes appear depending on the thickness. At small thicknesses, the red and blue curves  α m ( V )  are identical. They vary continuously at the transition, with a concave shape at all voltages  Δ V > 0 . This is characteristic of a second-order phase transition. An example calculated at  d = 9   μ m is shown in Figure A4a. At larger thicknesses, the situation becomes more complex. At  d = 9.3   μ m, the red and blue curves are still identical and the HN→TIC transition is still second order, but we can note now that the curves deform above  V t h  and become convex at some intermediate voltages as can be seen in Figure A4b.
Figure A4. Amplitude  α m  of the TIC as a function of the voltage difference  Δ V = V V t h  calculated at different thicknesses:  d = 9   μ m (a);  d = 9.3   μ m (b);  d = 9.39   μ m (c);  d = 9.5   μ m (d);  d = 9.7   μ m (e) and  d = 10   μ m (f). In (df), the dotted-dashed line indicates the value of  Δ V  at which the two solutions have the same energy. On the left (resp., right) of this line, the most stable solution is that of low (resp., large) amplitude.
Crystals 13 00957 g0a4
The situation drastically changes at  d = 9.39   μ m. At this thickness, the red and blue curves are different. The HN→TIC transition is still second order but there appears a discontinuity on each curve, at voltage  Δ V 0.027   Vrms for the red curve and voltage  Δ V 0.026   Vrms for the blue curve. The appearance of this hysteresis cycle reveals the presence of a first order transition between two TIC oriented parallel to B, but of different amplitudes. This change in behavior is shown in Figure A4c. In the phase diagram, this results in the appearance of a critical point (CP) in ( d c 9.38   μ m,  Δ V c = V c V t h 0.028   Vrms). The situation remains unchanged as long as the thickness is less than  9.9   μ m as shown in Figure A4d calculated at  d = 9.5   μ m, where we clearly see the two transitions of second and first order. On the other hand, the second order NH→TIC transition tends to disappear when the thickness increases as shown in Figure A4e calculated at  d = 9.7   μ m, where it has almost disappeared. Above the thickness  d = 9.9   μ m, only a first order HN→TIC transition is observed as shown in Figure A4f calculated at  d = 10   μ m. In Figure A4d–f, the vertical dash-dotted lines indicate at which voltages the two TIC or the TIC and the HN coexist.
This study is summarized in Figure A5, which shows a zoom of the phase diagram around the tricritical point in the parameter plane  ( d , Δ V ) . In this figure, the base line  Δ V = 0  corresponds to the spinodal line of the HN. The two blue dashed lines and the red solid line are, respectively, the spinodal lines and the coexistence line of the transition between the two TICs on the left of the tricritical point TCP and between the TIC and the NH on the right of this point. Note that the point TCP is at the intersection of this coexistence line and the spinodal line of the HN and has for coordinates ( d t c = 9.55   μ m,  Δ V t c = 0 ). We add that the existence of the critical point is not linked to the presence of the magnetic field since it also exists at field B = 0. On this subject, we refer to the theoretical article by Gartland et al. [20] where this result is rigorously demonstrated in the case  B = 0 .
To conclude this study, we calculated the amplitude of the TIC on the spinodal curve  V t h  of the HN at large thicknesses when d approaches  d c , the thickness at which  V t h  vanishes. By choosing  V i = 0  or  Δ V = 0.5   Vrms as before, we found systematically a TIC oriented parallel to B between  d t c  and a thickness  d 1 + 10.8   μ m. By contrast, by taking  Δ V i = 2   Vrms, we observed for thicknesses larger than a thickness  d 1 9.8   μ m, a second branch of solution, corresponding to a TIC oriented perpendicular to B ( β m = π / 2 ). This TIC (TIC2) has a larger amplitude than the TIC parallel to B (TIC1) as shown in Figure A6a. By calculating the energy of these two TIC [see Figure A6b], we found that TIC1 has less energy than TIC2 when  d < d 1 10.04   μ m and, conversely, that TIC2 has less energy than TIC1 when  d > d 1 .
Figure A5. Phase diagram in the vicinity of the tricritical point (TCP). On the left of TCP, two transitions are observed as a function of the voltage: a second order transition between the HN and a TIC of small amplitude and a first order transition between two TIC of non-zero amplitudes. This transition ends at the critical point CP (cusp point). On the right of the tricritical point, a first order transition between the HN and a TIC of large amplitude is observed.
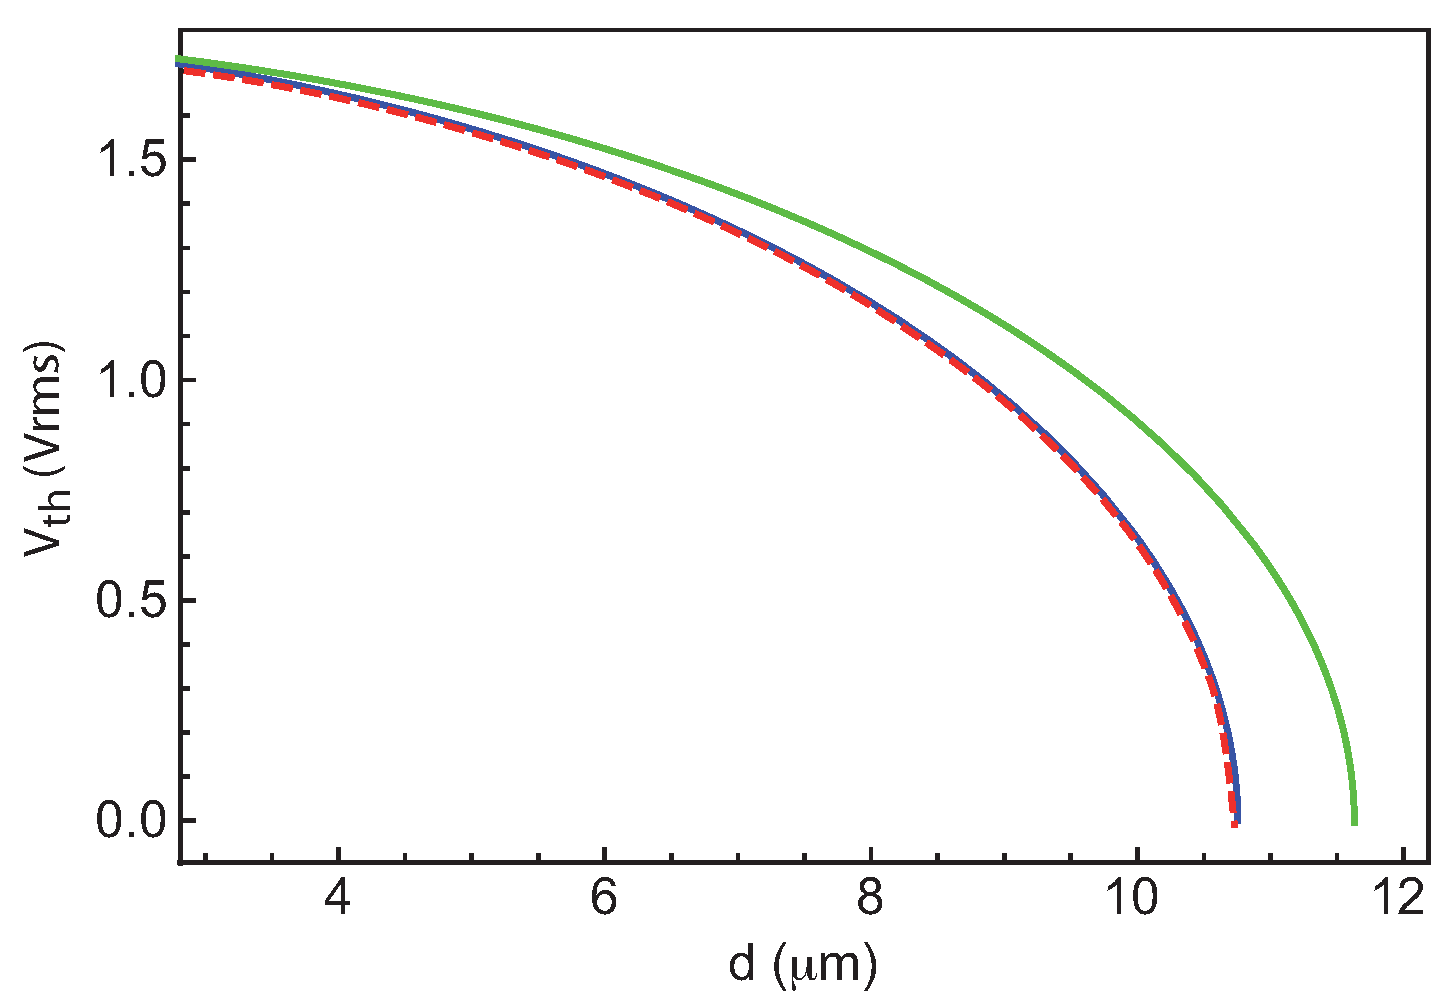
Crystals 13 00957 g0a5
Figure A6. Maximal tilt angle (a) and energy (b) of TIC1 and TIC2 solutions as a function of the thickness calculated on the spinodal line of the HN when  V = V t h . The two solutions coexist between  d 1  and  d 1 +  and have the same energy at  d = d 1 . When  d < d 1 , TIC1 forms (TIC parallel to B), while TIC2 is preferred when  d > d 1  (TIC perpendicular to B).
Crystals 13 00957 g0a6

References

  1. Cladis, P.E.; Kleman, M. The cholesteric domain texture. Mol. Cryst. Liq. Cryst. 1972, 16, 1–20. [Google Scholar] [CrossRef]
  2. Press, M.J.; Arrott, A.S. Static strain waves in cholesteric liquid crystals.-I. homeotropic boundary conditions. J. Phys. Paris 1976, 37, 387–395. [Google Scholar] [CrossRef]
  3. Gil, L.; Gilli, J.M. Surprising dynamics of some cholesteric liquid crystal patterns. Phys. Rev. Lett. 1998, 80, 5742. [Google Scholar] [CrossRef]
  4. Oswald, P.; Baudry, J.; Pirkl, S. Static and dynamic properties of cholesteric fingers in electric field. Phys. Rep. 2000, 337, 67–96. [Google Scholar] [CrossRef]
  5. Oswald, P.; Pieranski, P. Nematic and Cholesteric Liquid Crystals: Concepts and Physical Properties Illustrated by Experiments; The liquid crystals book series; Taylor & Francis: Boca Raton, FL, USA, 2005; 618p. [Google Scholar]
  6. Nawa, N.; Nakamura, K. Observation of Forming Process of Bubble Domain Texture in Liquid Crystals. Jpn. J. Appl. Phys. 1978, 17, 219–225. [Google Scholar] [CrossRef]
  7. Smalyukh, I.I. Review: Knots and other new topological effects in liquid crystals and colloids. Rep. Prog. Phys. 2020, 83, 106601. [Google Scholar] [CrossRef] [PubMed]
  8. Wu, J.; Smalyukh, I.I. Hopfions, heliknotons, skyrmions, torons and both abelian and nonabelian vortices in chiral liquid crystals. Liq. Cryst. Rev. 2022, 1–35. [Google Scholar] [CrossRef]
  9. Ignés-Mullol, J.; Sagués, F. Experiments with active and driven synthetic colloids in complex fluids. Curr. Opin. Colloid Interface Sci. 2022, 62, 101636. [Google Scholar] [CrossRef]
  10. Hess, A.J.; Poy, G.; Tai, J.S.B.; Žumer, S.; Smalyukh, I.I. Control of Light by Topological Solitons in Soft Chiral Birefringent Media. Phys. Rev. X 2020, 10, 031042. [Google Scholar] [CrossRef]
  11. Ribière, P.; Pirkl, S.; Oswald, P. Electric-field-induced phase transitions in frustrated cholesteric liquid crystals of negative dielectric anisotropy. Phys. Rev. A 1991, 44, 8198–8209. [Google Scholar] [CrossRef] [PubMed]
  12. Smalyukh, I.I.; Senyuk, B.I.; Palffy-Muhoray, P.; Lavrentovich, O.D.; Huang, H.; Gartland, E.C.; Bodnar, V.H.; Kosa, T.; Taheri, B. Electric-field-induced nematic-cholesteric transition and three-dimensional director structures in homeotropic cells. Phys. Rev. E 2005, 72, 061707. [Google Scholar] [CrossRef] [PubMed]
  13. Sohn, H.R.O.; Liu, C.D.; Voinescu, R.; Chen, Z.; Smalyukh, I. Optically enriched and guided dynamics of active skyrmions. Opt. Express 2020, 28, 6306–6319. [Google Scholar] [CrossRef] [PubMed]
  14. Ackerman, P.J.; Boyle, T.; Smalyukh, I.I. Squirming motion of baby skyrmions in nematic fluids. Nat. Commun. 2017, 8, 673. [Google Scholar] [CrossRef] [PubMed]
  15. Hamdi, S.; Schiesser, W.E.; Griffiths, G.W. Method of lines. Scholarpedia 2007, 2, 2859. [Google Scholar] [CrossRef]
  16. Ribière, P. Déroulage d’un Cholestérique Frustré en Champ électrique. Ph.D. Thesis, Université Claude Beranrd Lyon I, Lyon, France, 1992. [Google Scholar]
  17. Yoshi, V. Electro-Optical and Flexoelectro-Optical Properties Enhanced by Bimesogen-Doped Chiral Nematic Liquid Crystals. Ph.D. Thesis, Kent State University, Kent, OH, USA, 2010. [Google Scholar]
  18. Oswald, P. Measurement with a rotating magnetic field of the surface viscosity of a nematic liquid crystal. EPL (Europhys. Lett.) 2012, 100, 26001. [Google Scholar] [CrossRef]
  19. Nagaya, T.; Hikita, Y.; Orihara, H.; Ishibashi, Y. Growth of Cholesteric Finger under the Magnetic Field. J. Phys. Soc. Japan 1998, 67, 2546–2550. [Google Scholar] [CrossRef]
  20. Gartland, E.C.; Huang, H.; Lavrentovich, O.D.; Palffy-Muhoray, P.; Smalyukh, I.I.; Kosa, T.; Taheri, B. Electric-Field Induced Transitions in a Cholesteric Liquid-Crystal Film with Negative Dielectric Anisotropy. J. Comput. Theor. Nanosci. 2010, 7, 709–725. [Google Scholar] [CrossRef]
Figure 1. (a) Cross section in a plane containing the  c -director of the cholesteric director field in the TIC configuration, as described in the text. In the nail diagram, the head of the nails illustrate the out-of-plane component of the director. (b) S2 sphere trajectory of the director field along the straight path indicated by the arrow in (a), which results in a closed path that begins and ends in the North pole. The different geometrical parameters defined in the text are depicted in the sketch.
Crystals 13 00957 g001
Figure 2. Spinodal limit calculated with Equation (18) when  B = 0  (green line), and spinodal limit calculated numerically (dashed red line) and with the approximate Formula (20) (solid blue line) when  B = 0.56 .
Crystals 13 00957 g002
Figure 3. (a) Angle  β m  giving the orientation of the TIC as a function of time when  d = 7.5   μ m and  β i = 0.1  (left column) or  β i = π / 2 0.1  (right column). In each case, a voltage below and above the spinodal limit is shown. The voltage (in Vrms) is indicated on each graph. (b) Angle  β m  as a function of the applied voltage V; (c) Energy difference between the TIC1 and the TIC2 as a function of the applied voltage V calculated in the voltage interval where the two TIC are observed.
Crystals 13 00957 g003
Figure 4. Phase diagram showing the two transition lines between the TIC1 and TIC2 solutions. The dashed and dotted lines are the spinodal limits. (AC) Director trajectories on the sphere S2 calculated at points A ( d = 7   μ m,  V = 2.5   Vrms), B ( d = 10   μ m,  V = 5   Vrms) and C ( d = 14   μ m,  V = 8   Vrms) of the phase diagram. The North pole N corresponds to the homeotropic nematic.
Crystals 13 00957 g004
Figure 5. Angles  α  and  β  of a TIC1 (ad) and a TIC2 (eh) configuration in the middle of the sample  ( z = d / 2 )  as a function of time when the magnetic field is slightly tilted. (a,b,e,f) correspond to  θ = 0.1 ; (c,d,g,h) correspond to  θ = 0.1 .
Crystals 13 00957 g005
Figure 6. Possible orientations of the  c director of the TIC1 and TIC2 when the magnetic field is slightly tilted from the horizontal. Solid red arrows:  θ > 0 ; dotted blue arrows:  θ < 0 .
Crystals 13 00957 g006
Figure 7. (a) Voltages  V 1 V 1 +  and  V 1  as a function of the inclination angle  θ  of the magnetic field.  d = 7.5   μ m and  B = 0.56   T. (b) Angle  β m +  (in degree) as a function of the applied voltage for different inclinations of the magnetic field. From bottom to top,  θ  = 0, 0.1, 0.2 and  0.3  rad.  d = 7.5   μ m and  B = 0.56   T.
Crystals 13 00957 g007
Figure 8. Schematic representation of the experimental setup. S: Halogen lamp; F: green filter ( λ = 546 nm); P: polarizer parallel to x; QW: quarter-wave plate with its slow axis oriented at  45  with respect to the x-axis; M: permanent magnet (Halbach ring). The dotted line gives the orientation of the magnetic field; S: homeotropic sample; O: objective (macrozoom lens); A: rotating analyzer motorized with a stepping motor. C: video camera.
Crystals 13 00957 g008
Figure 9. (ae) Pi-wall between two TIC1 oriented in opposite directions which forms spontaneously in the middle of the 6.05  μ m-thick sample when a voltage larger than  V t h  is applied. From (ae V = 3.5 , 4 , 5 , 6 , 6.3 Vrms. The wall is perpendicular to the magnetic field B. (f) TIC2 observed at  V = 6.8 Vrms. The arrows indicate how the  c -director rotates in the sample. Observation without the quarter-wave plate between crossed polarizers (analyzer parallel to B). The white bar is 50  μ m long. (g) Width W of the pi-wall as a function of the voltage measured at increasing and decreasing voltage.
Crystals 13 00957 g009
Figure 10. Transmitted intensity as a function of angle  φ  between the analyzer and the x-axis. The polarizer is along the x-axis and a quarter-wave plate has been inserted between the polarizer and the sample, with its slow axis at 45  from the x-axis. Sample of thickness  d = 6.05 μ m. The curves on the top row are experimental and those in the bottom row are theoretical. From (ac) V = 5, 6, and 6.3 Vrms. The solid line curves correspond to a TIC1 and the dashed lines to a TIC2. In (b) the curves in full line have been obtained by increasing the voltage and those in dashed line by decreasing the voltage.
Crystals 13 00957 g010
Figure 11. Cholesteric fingers of the first type (CF1) observed between crossed polarizer and analyzer in the  7.51 μ m-thick sample by focusing on a dust particle inside the sample. From (ai) V increases from 1.6 to 2.4 Vrms by increments of 0.1. The white bar is  50 μ m long.
Crystals 13 00957 g011
Figure 12. Transmitted intensity as a function of angle  φ . Same optical conditions as in Figure 10. Sample of thickness  d = 10.3 μ m. From (ac),  V = 3, 8, and 20 Vrms. The curves on the top row are experimental and those in the bottom row are theoretical. At this thickness, only the TIC2 is observed.
Crystals 13 00957 g012
Figure 13. Transmitted intensity as a function of angle  φ . Same conditions as in Figure 10. Sample of thickness  d = 12.65 μ m. From (ac),  V = 3, 4, and 5 Vrms. The curves on the top row are experimental and those in the bottom row are theoretical. The solid line curves correspond to a TIC1 and the dashed lines to a TIC2. In (b), the curves in dashed line (TIC2) have been obtained by increasing the voltage and those in solid line (TIC1) by decreasing the voltage.
Crystals 13 00957 g013
Table 1. Material constants and experimental conditions used in the numerical analysis. The elastic constants are in pN, the rotational viscosity  γ 1  is in Pa.s, the cholesteric pitch P is in  μ m, and the magnetic field B is in T. Dielectric susceptibilities, magnetic anisotropy, and elastic constants have been measured in this work.  γ 1  and the refraction indices are given by the LC manufacturer.
ε ε a K 1 K 2 K 3 γ 1 χ a n o n e PB
9.727−5.63914.776.9616.190.1631.03 × 10 6 1.4901.635100.56
Disclaimer/Publisher’s Note: The statements, opinions and data contained in all publications are solely those of the individual author(s) and contributor(s) and not of MDPI and/or the editor(s). MDPI and/or the editor(s) disclaim responsibility for any injury to people or property resulting from any ideas, methods, instructions or products referred to in the content.

