Article

A Phenomenological Study of Chromium Impurity Effects on Lattice Microstrains of SnO2 Nanoparticles Prepared Using Sol–Gel Technique

by
Leili Motevalizadeh
1,* and
Masoud Tahani
2,3,*
1
Department of Physics, Mashhad Branch, Islamic Azad University, Mashhad 91871-47578, Iran
2
Department of Mechanical Engineering, Ferdowsi University of Mashhad, Mashhad 91779-48974, Iran
3
Institute of Fundamental Technological Research, Polish Academy of Sciences, Pawińskiego 5B, 02-106 Warsaw, Poland
*
Authors to whom correspondence should be addressed.
Crystals 2023, 13(6), 919; https://doi.org/10.3390/cryst13060919
Submission received: 27 April 2023 / Revised: 29 May 2023 / Accepted: 5 June 2023 / Published: 7 June 2023
(This article belongs to the Special Issue Synthesis, Characterization and Application of Novel Nanoparticles)

Abstract

:
In this study, the effect of chromium impurities on the crystal structure and lattice microstrains of tin oxide nanoparticles was investigated. Pure SnO2 nanoparticles were synthesized and subjected to calcination at different temperatures. Additionally, various concentrations (5%, 8%, 10% and 15%) of Cr-doped SnO2 nanoparticles were prepared using the sol–gel technique and subsequently calcined at 550 °C. Transmission electron microscopy (TEM) and X-ray diffraction (XRD) techniques were utilized to examine the structure and morphology of the doped nanoparticles. The XRD patterns of tin oxide nanoparticles with different percentages of chromium impurities showed a tetragonal structure without any additional phase. The TEM images of pure SnO2 nanoparticles showed a uniform distribution of size and shape, with relatively smaller sizes compared to Cr-doped nanoparticles. To investigate the peak broadening of Cr-doped SnO2 nanoparticles, the Halder–Wagner method and Williamson–Hall models were employed to examine the effects of crystallite sizes and lattice strain. The results showed that increasing the impurity has a dual effect on nanoparticle sizes. Increasing the chromium impurity up to 8% led to an increase in compressive stress caused by the substitution of Sn ions with Cr ions on the crystal structure of rutile, resulting in an increase in the magnitude of lattice strain. However, when the chromium impurity was increased up to 15%, interstitial doping was preferred over substitutional doping. The compressive stress was subsequently converted to tensile stress, requiring the system to spend some of its energy to overcome the compressive stress, with the remaining energy reflected in the form of tensile stress. Furthermore, Fourier transform infrared (FTIR) spectra were obtained for all of the samples, confirming the XRD analyses.

1. Introduction

Stannic oxide (SnO2, tin oxide), as a transparent n-type semiconductor, has numerous applications in a variety of areas, such as transparent electrodes in flat panel displays [1], gas sensors [2], solar cells [3], photocatalysts [4], photodiodes [5], lithium-ion batteries [6], biosensors [7], etc.
The broad scope of practical applications of tin oxide nanostructures is due to the specific properties of this semiconductor. Tin oxide is a non-stoichiometric crystal, and its crystals have a tetragonal rutile structure with space group D14 (P42/mnm). SnO2 has a wide bandgap with a value of approximately 3.6 eV at room temperature [8]. This compound has very good transparency within the range of the visible light spectrum. The nanoparticles of this compound have a high surface-to-volume ratio, which improves their relevant surface properties, such as photocatalytic activity and surface reactivity. In addition, the effects of various impurities on improving the properties of these nanoparticles have been widely studied [9,10,11]. The most important effect of impurities in semiconducting nanostructures is increasing the carrier density. Tin oxide exhibits n-type conductivity due to the presence of intrinsic defects, such as oxygen vacancies and interstitial tin atoms, in its tetragonal lattice. Another mechanism that influences carrier density in SnO2 is related to dopant impurities. Among the different studied impurities, the transition metals dopants, such as vanadium [9], manganese [10], cobalt [11], nickel [12] and iron [13], have beneficial effects on changing and improving the electrical, optical and catalytic properties. Numerous studies have been conducted recently to investigate the doping of SnO2 with non-metal elements, such as F [14] and S [15], using first-principles calculations and DFT. For example, the doping of SnO2 with B and S introduced additional defect energy levels in the forbidden bandgap, thereby enhancing crystal conductivity [16]. The physical properties of tin oxide, in addition to impurity, strongly depend on the morphology and size of the nanostructures, which are, in turn, affected by the synthesis method. For instance, to achieve high capacity when using SnO2 nanoparticles in lithium-ion batteries, very fine tin oxide particles are required [17]. Extensive efforts have been devoted to the synthesis and characterization of tin dioxide nanoparticles, owing to the broad utilization of SnO2 and various methods, such as co-precipitation [18], sol–gel [19], hydrothermal [20], chemical vapor deposition [21], carbothermal [22] and environmentally friendly methods [7]. Among the manufacturing methods, the sol–gel technique has received more attention because of its low-temperature process, easy composition control and cost-effectiveness. Sol–gel is a wet method that offers higher homogeneity and purity in nanoparticle production compared to other methods, as well as greater reactivity [19].
XRD is widely employed to characterize nanoparticles, providing insights into their crystalline structure, phase nature, lattice parameters and grain size. The size of crystallites and the presence of defects are the main causes of the broadening of XRD peaks. Therefore, peak broadening is utilized to determine the crystallite size and lattice strain. Lattice strain is caused by crystal flaws, grain boundaries, stacking sources, impurities and lattice dislocations, while crystallite size measures the size of coherently diffracting domains [23,24,25].
In this study, XRD patterns of chromium-doped SnO2 nanoparticles synthesized via the sol–gel process with varying percentages of impurity, are analyzed. The Halder–Wagner (H–W) and Williamson–Hall (W–H) analysis models are used to estimate the mean crystallite size and microstrain of all samples. Finally, the results for crystallite sizes from these methods are compared with those of the Scherer method. TEM is employed to examine the morphology of Cr-doped nanoparticles, while FTIR spectroscopy was used to conduct additional analysis on the samples.

2. Materials and Methods

2.1. Synthesis of Tin Oxide Nanoparticles Using the Sol–Gel Technique

Before the synthesis of Cr-doped SnO2 nanoparticles, pure SnO2 particles were prepared at different calcination temperatures (350, 450 and 550 °C), to determine the optimized calcination temperature. The properties of pure nanoparticles were studied using XRD and FTIR techniques and their results are given in Section 3.1. The results showed that a more suitable temperature for calcination would be 550 °C.
SnO2 nanoparticles were synthesized by adding 50 mL pure ethanol and 0.1 mol SnCl2·2H2O to 50 mL de-ionized water, followed by magnetic stirring at 40 °C. The resulting solution was further stirred for half an hour at 40 °C using a magnetic stirrer. While stirring, ethylene glycol (polymerization agent) and citric acid (complexing agent) in a 2:1 and 3:1 ratio, respectively, to SnCl2·2H2O, were gradually added to the solution and dissolved under continuous stirring until a clear solution was achieved.
The mixture was transferred to a balloon and subjected to reflux at 120 °C for 3 h to yield a homogeneous and complex solution. The resulting product (the refluxed solution) was aged at 80 °C for 20 h with indirect heating to obtain an adhesive gel and at 80 °C for 4 h with direct heating to obtain a fluffy gel. After drying at 150 °C for 12 h, resulting in a completely dried gel, the dried product was pulverized into powder using a mortar. The final powder was then calcined at different calcination temperatures (350, 450 and 550 °C) for 1.5 h.

2.2. Synthesis of Cr-Doped SnO2 Nanoparticles Using the Sol–Gel Technique

To synthesize the Cr-doped SnO2 nanoparticles with various doping contents (5, 8, 10 and 15%), the same procedure was followed. In order to dope, a certain amount of CrCl3·6H2O was added to the precursor solution and stirred, and then all steps were repeated to produce the dried powder. Finally, the obtained powder was calcined at 550 °C for 1.5 h.

2.3. Characterization

The characterization of the samples’ crystalline phase and structure was performed using XRD with Cu-Kα radiation. Transmission electron microscopy was employed to observe the morphology of the particles. These analyses provide valuable insights into the structural and morphological features of the products, which are essential for understanding their properties and potential applications. The FTIR spectra of the samples pressed with KBr in the range of 400 to 4000 cm−1 were recorded.

2.4. Quantitative Analysis of XRD Data

2.4.1. Scherrer Method

The two primary characteristics obtained from the broadening of the XRD pattern are crystallite size and lattice strain. The size of a coherently diffracting domain can be measured as the crystallite size, which is commonly determined using the Scherrer method. This method suggests that peak broadening is a consequence of the crystallite sizes, and the average nanocrystallite size can be calculated using Debye–Scherrer’s formula [26]:
D = K λ β h k l cos θ ,
where, D is the size of the crystallite, K is the shape factor constant (almost equal to one for spherical particles), λ is the wavelength of Cu-kα radiation and βhkl is the FWHM (full width at half maximum) of the peak [26].
The Scherrer equation solely addresses the impact of crystallite size on the broadening of the XRD peak and disregards the influence of lattice strain. To enhance the accuracy of crystallite size determination, both factors should be simultaneously taken into consideration. Two distinct types of strain, namely homogeneous and non-homogeneous lattice strains, should be considered as they influence the broadening and position of the peak, respectively [27,28,29].

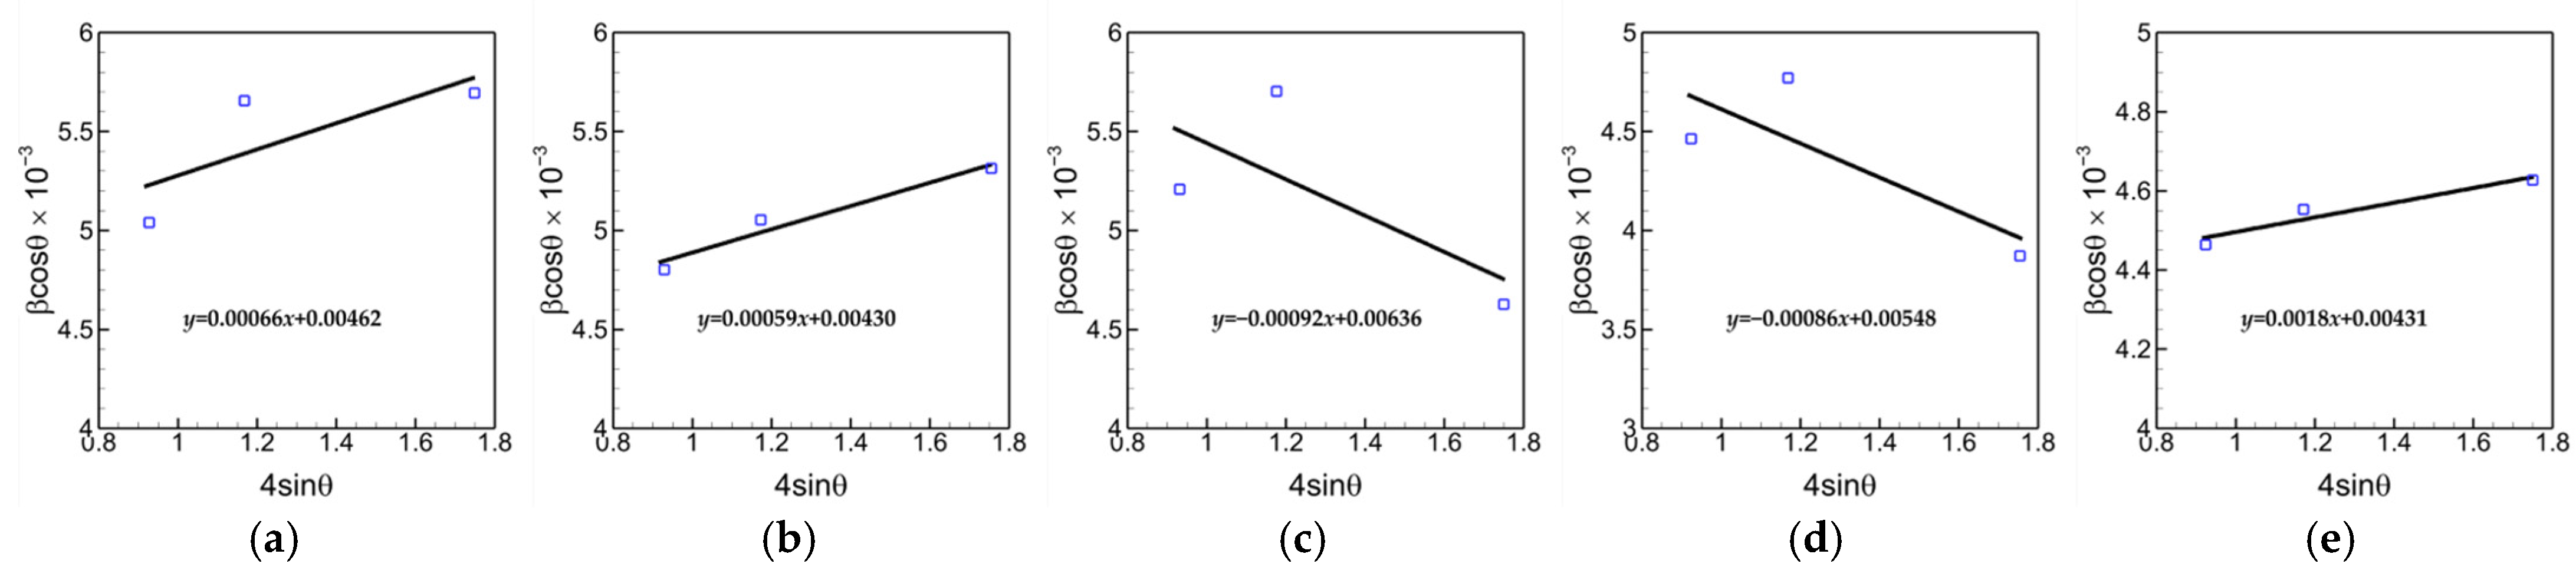
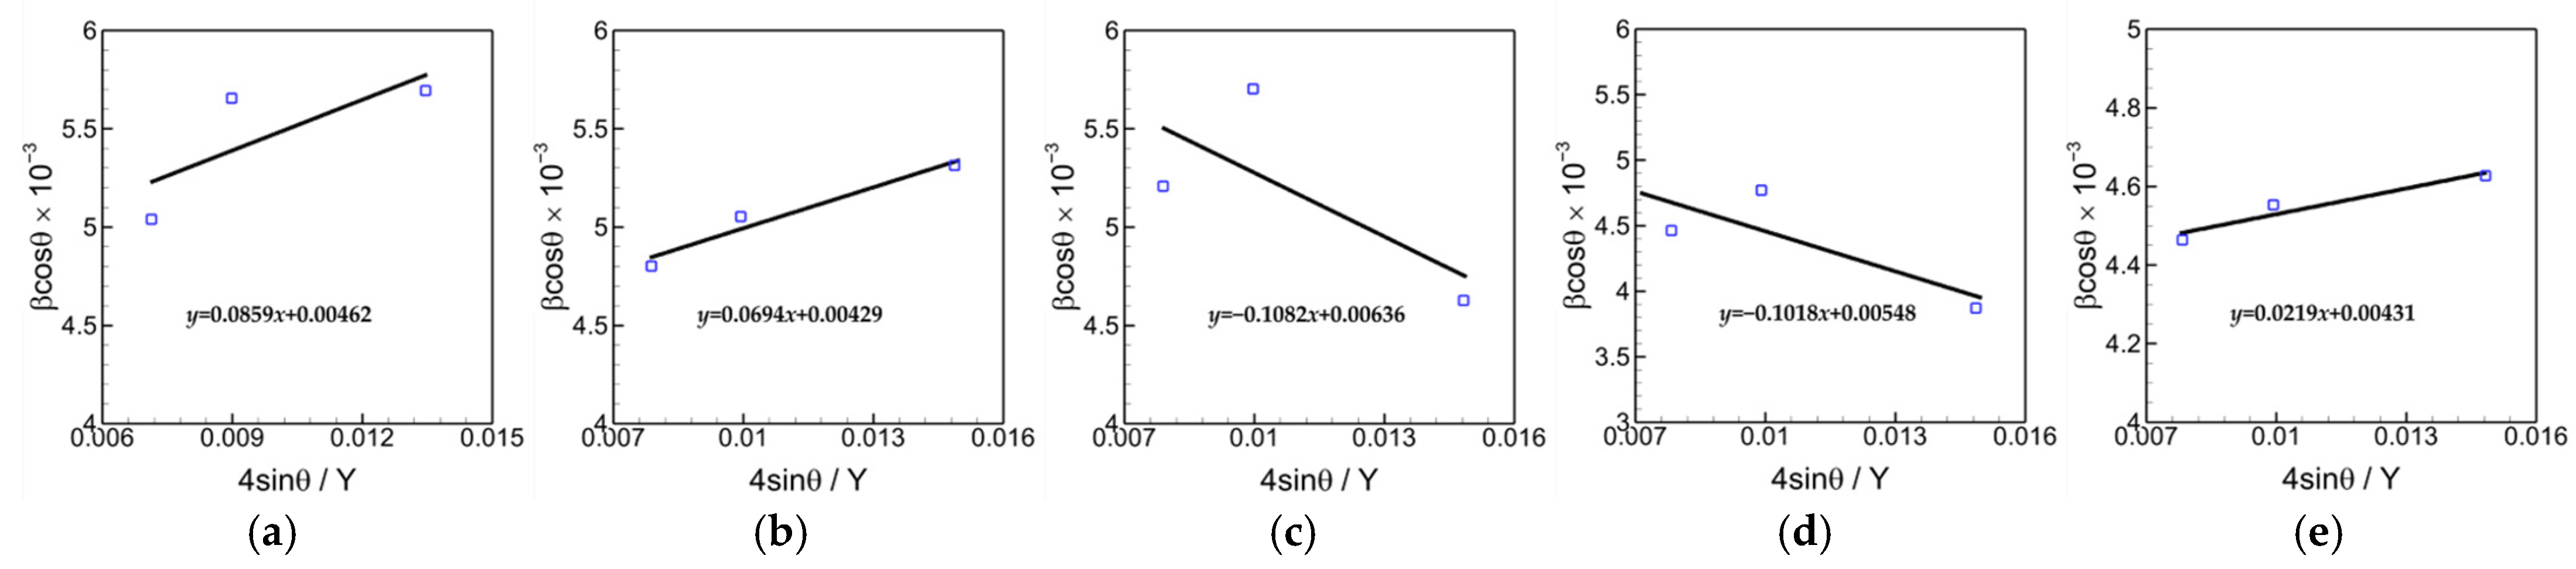
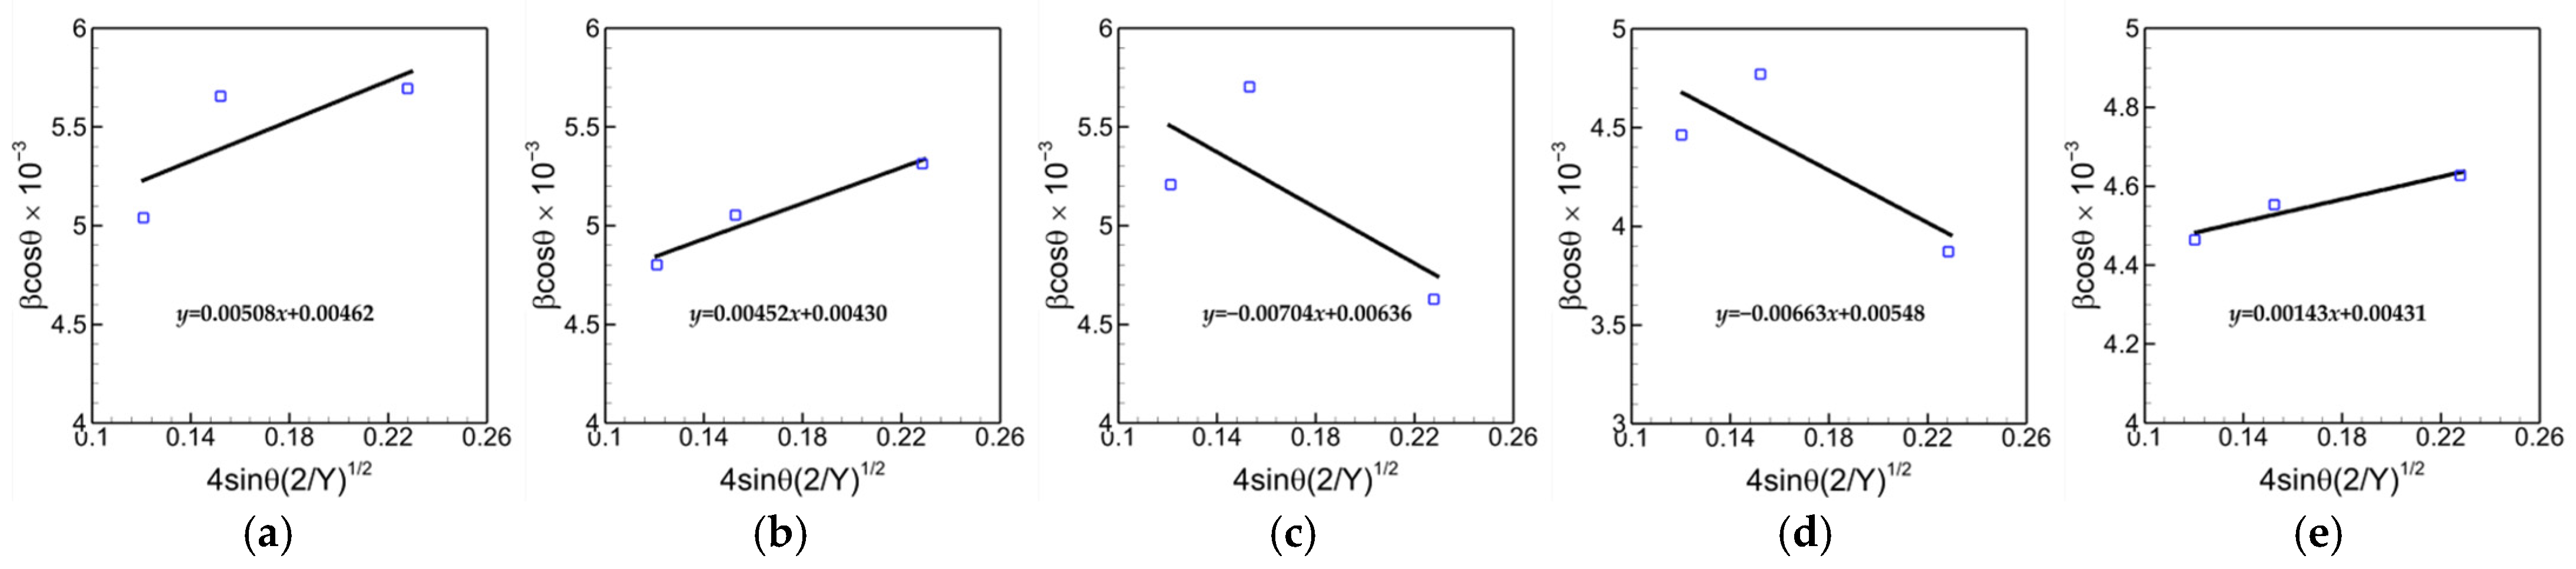
2.4.2. Williamson–Hall Method

According to the Williamson–Hall approach, the broadening observed in the diffraction line is a result of both crystallite size and strain. In order to assess the strain resulting from lattice deformation, three modified Williamson–Hall (W–H) models have been proposed, which consider the uniformity or non-uniformity of the strain. The Williamson–Hall models consist of the uniform deformation model, the uniform stress deformation model and the uniform density energy deformation model known as UDM, USDM and UDEDM, respectively [27,28,29].
The UDM assumes the crystal to be isotropic and in this model, the broadening resulting from size (βD) and the broadening resulting from strain (βS) are assumed to be independent, and can be expressed as [26]:
β h k l = β D + β S = K λ D cos θ + 4 ε tan θ ,
where, ε is the lattice strain. The above equation can be rewritten as follows [27]:
β h k l cos θ = K λ D + 4 ε sin θ .
In USDM, the stress resulting from lattice deformation is assumed to be uniform in all directions of crystallography and the lattice strain is small. Consequently, the relation between stress (σ) and strain (ε) is linear and expressed by the equation σ = Yhkl ε, where, Yhkl is the proportionality constant and is called Young’s modulus. Thus, Equation (3) is stated as follows [26]:
β h k l cos θ = K λ D + 4 σ Y h k l sin θ .
The directional dependent Young’s modulus of SnO2 nanoparticles which is related to elastic compliances and stiffness constants was calculated to be 118 GPa [25].
The UDEDM does not assume isotropy and homogeneity. Furthermore, when taking into account the strain energy density, the proportionality constants related to the stress–strain relation are no longer independent. The strain energy density (u), the energy per unit volume for an elastic system obeying Hooke’s law, can be calculated using the following equation:
u = 1 2 σ ε = 1 2 ε 2 Y h k l .
The substitution of ε from Equation (5) into Equation (4) yields the Williamson–Hall equation in the following form [29]:
β h k l cos θ = K λ D + 4 sin θ ( 2 u Y h k l ) 1 / 2 .

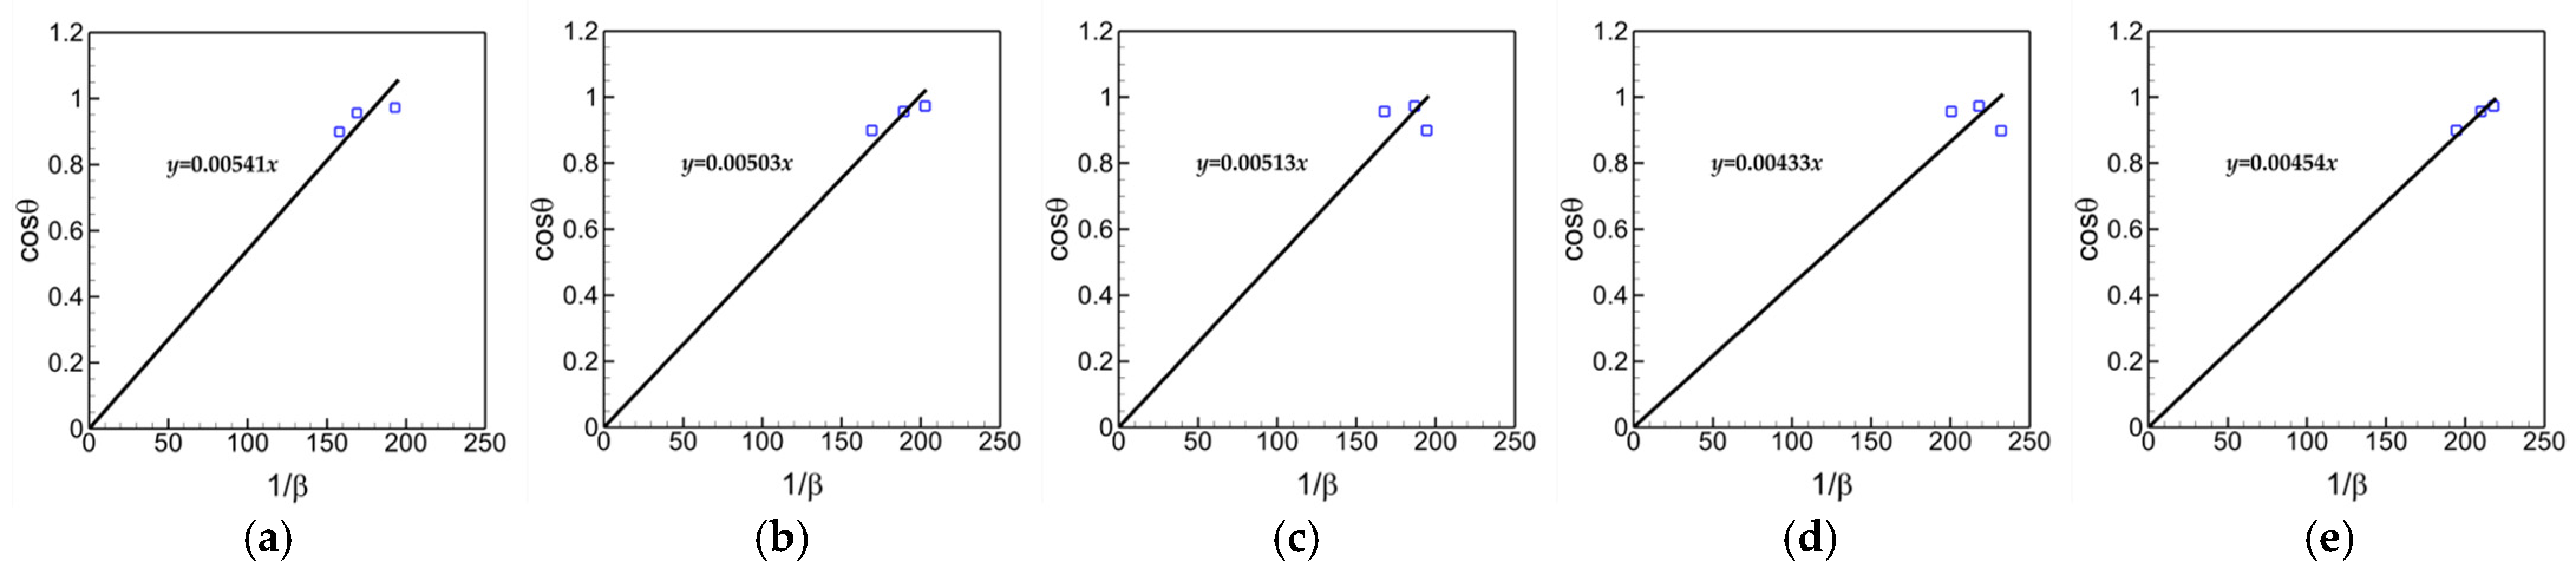
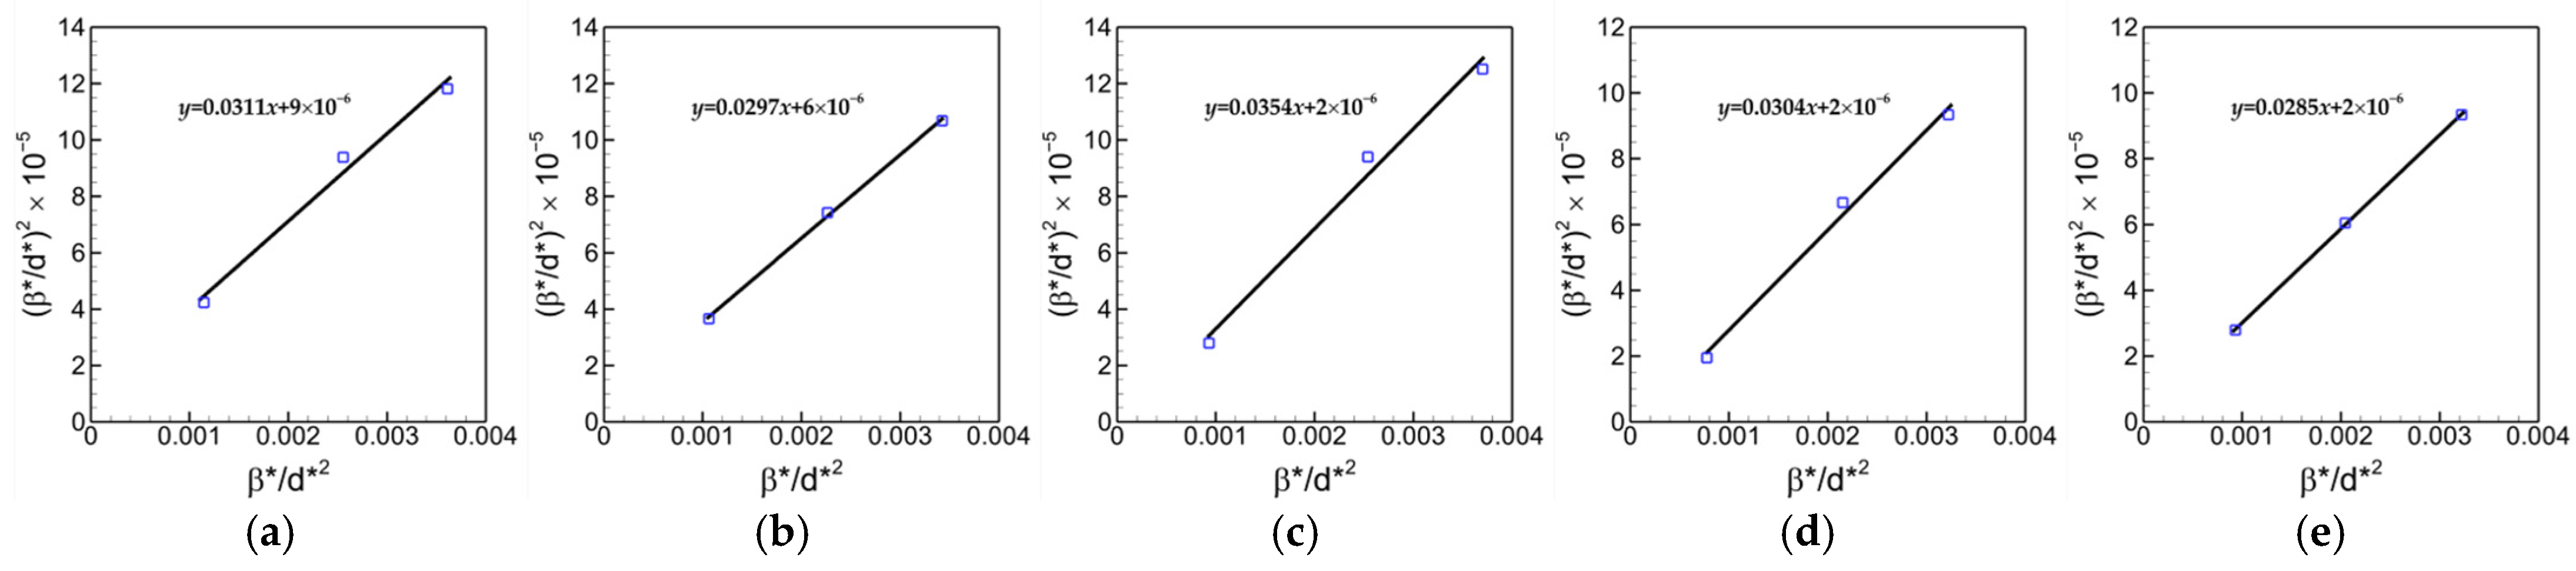
2.4.3. Halder–Wagner Method

The Halder–Wagner method employs the Lorentzian and Gaussian functions to describe the crystallite size and strain profiles, respectively. The approach assumes that the broadening of the peak takes the form of a symmetric Voigt distribution, which arises from the convolution of Lorentzian and Gaussian functions [28]. The Halder–Wagner method provided an approximation for the integral breath of the Voigt function as follows [28]:
β hkl 2 = β L β h k l + β G 2 ,
where, βL represents the Lorentzian component and βG is the Gaussian component. The size of the crystallites and lattice strain are described in this model by [28],
( β h k l * d h k l * ) 2 = 1 D ( β h k l * d h k l * 2 ) + ( ε 2 ) 2 ,
in which,
β h k l * = β h k l cos θ / λ ,   d k k l * = 2 d h k l cos θ / λ .

3. Results and Discussion

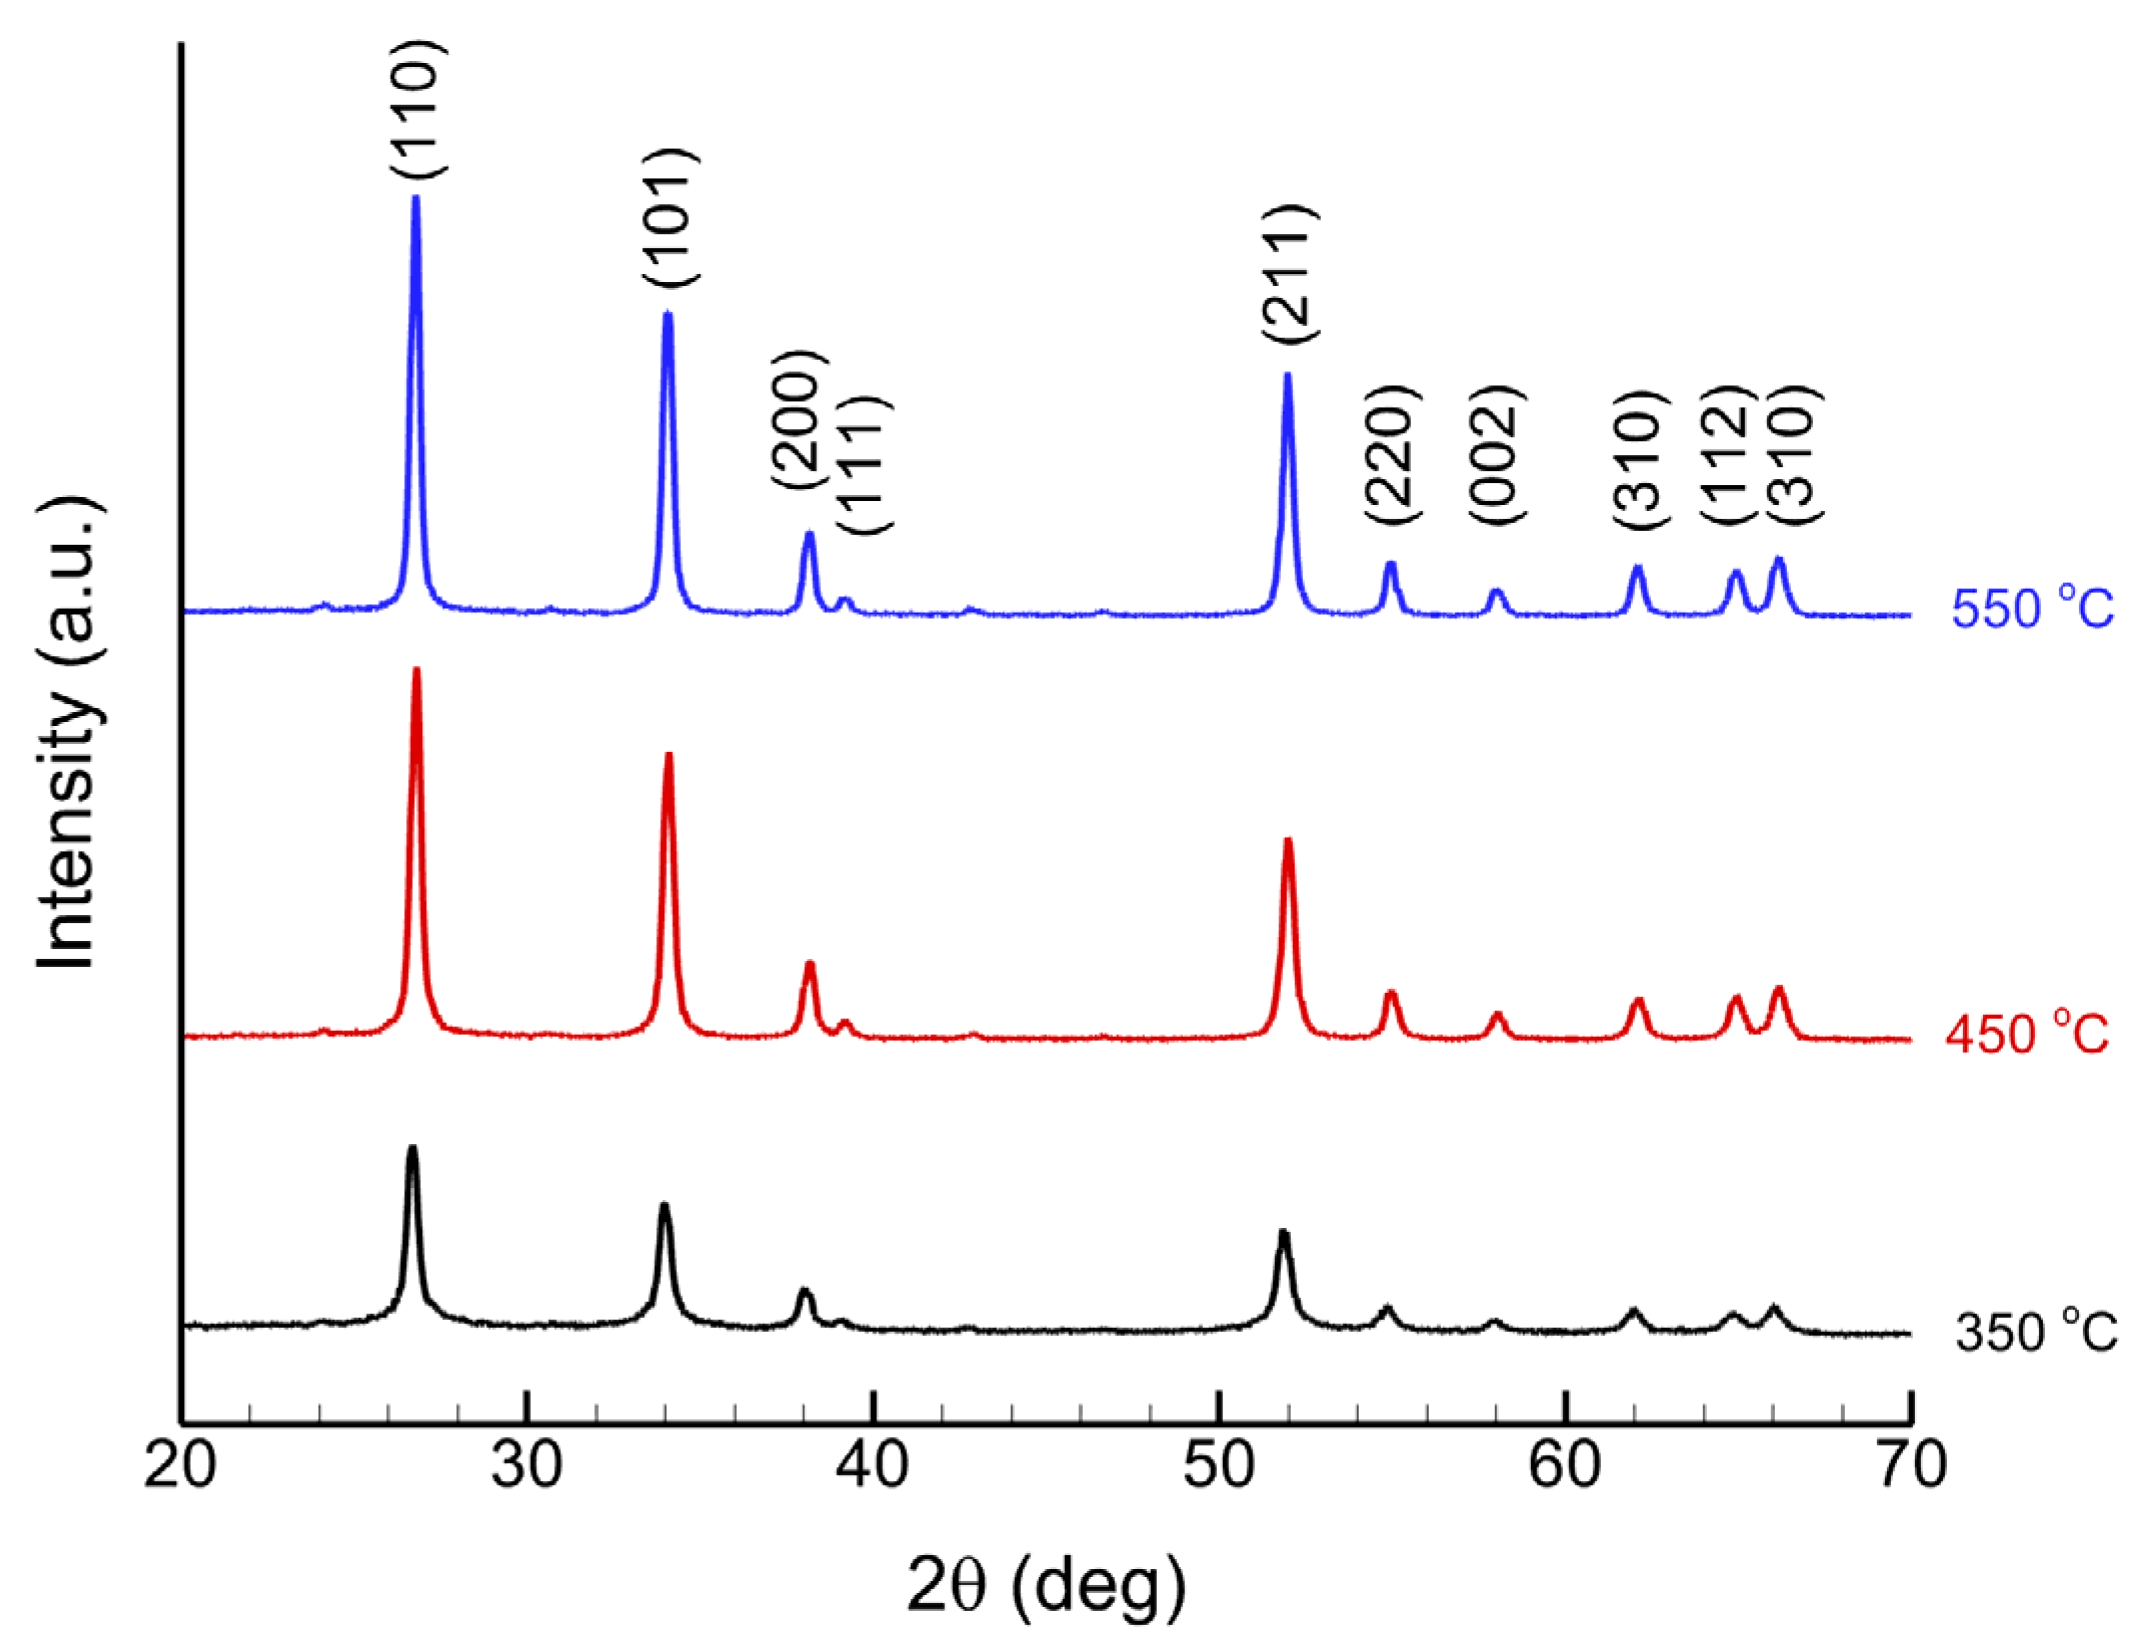
3.1. Characterization of Pure SnO2 Nanoparticles

Tin oxide nanoparticles were synthesized and subjected to calcination at various temperatures of 350, 450 and 550 °C. Table 1 presents the weights of the samples, measured both before and after the calcination process. From this table, the highest relative mass reduction is observed at the calcination temperature of 550 °C. Due to the higher relative reduction in mass at this specific temperature, it can be concluded that the majority of organic additives have been effectively eliminated from the material.
The X-ray diffraction pattern analysis of tin oxide nanoparticles at different calcination temperatures of 350, 450 and 550 °C, depicted in Figure 1, shows that all samples are single phase without any additional phase. The XRD patterns show that as the calcination temperature increases, the peaks become sharper which is related to an increase in the crystallite size of nanoparticles, enhancing the crystalline order and reducing lattice strain. The mean crystallite size for the samples prepared at different calcination temperatures of 350, 450 and 550 °C, were measured as 21.48, 24.11 and 26.59 nm, respectively.
Figure 2 displays the FTIR spectra of SnO2 nanoparticles synthesized at different calcination temperatures. This figure shows that the peaks observed around 3400 and 1630 cm−1 are attributed to the stretching vibrations of water molecules and hydroxide groups adsorbed on the surface of SnO2 nanoparticles. With an increase in the temperature of calcination, these peaks decrease. The weak peaks around 2400 cm−1 correspond to the stretching vibrations of CO2, and the peak at 1097 cm−1 indicates the bending vibrations of C–O, while the peak at 1400 cm−1 corresponds to both the bending and stretching vibrations of C-H. These suggest that some organic groups have been adsorbed on the surface of the powders. As observed in Figure 2, an increase in temperature leads to a decrease in these peaks which indicates the disappearance of organic materials from the samples. Two prominent absorption peaks at 623 and 470 cm−1 correspond to the stretching modes of Sn=O and Sn–O, respectively, confirming the presence of crystalline SnO2 [30]. Analysis of these results shows that preparing SnO2 nanoparticles with calcination at 550 °C leads to an increase in the crystallite size of SnO2 particles and the removal of organic additives.

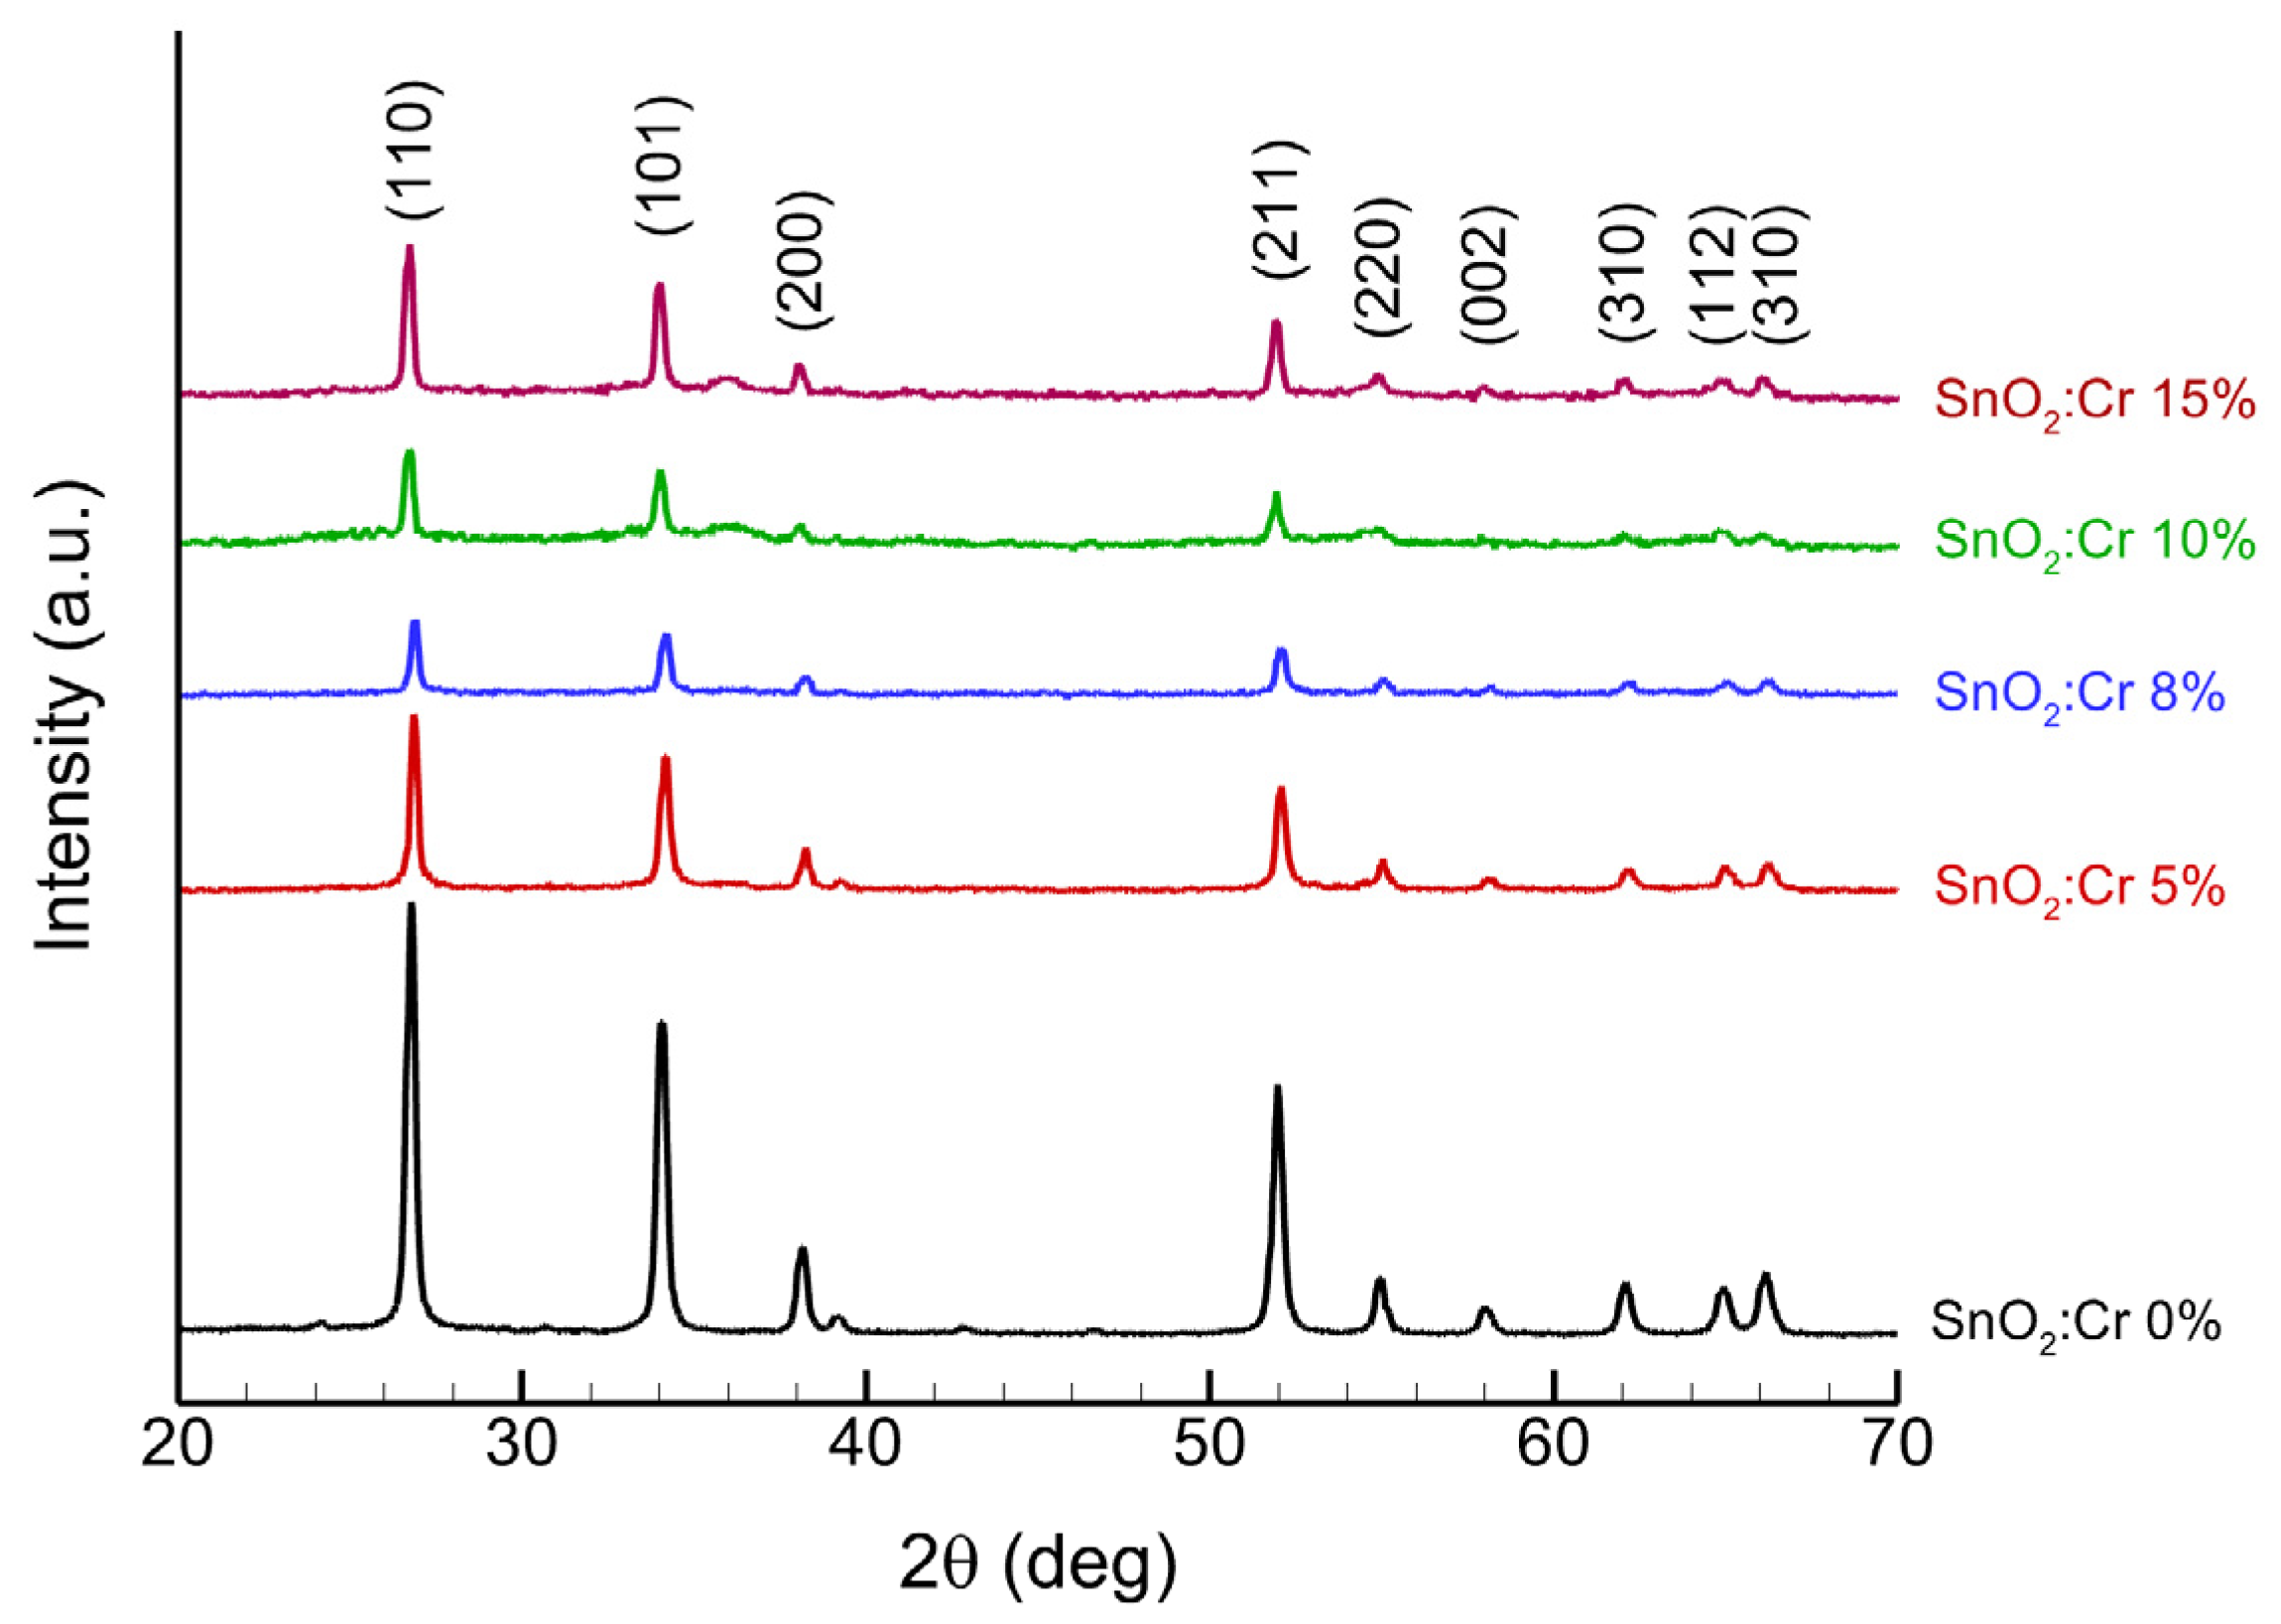
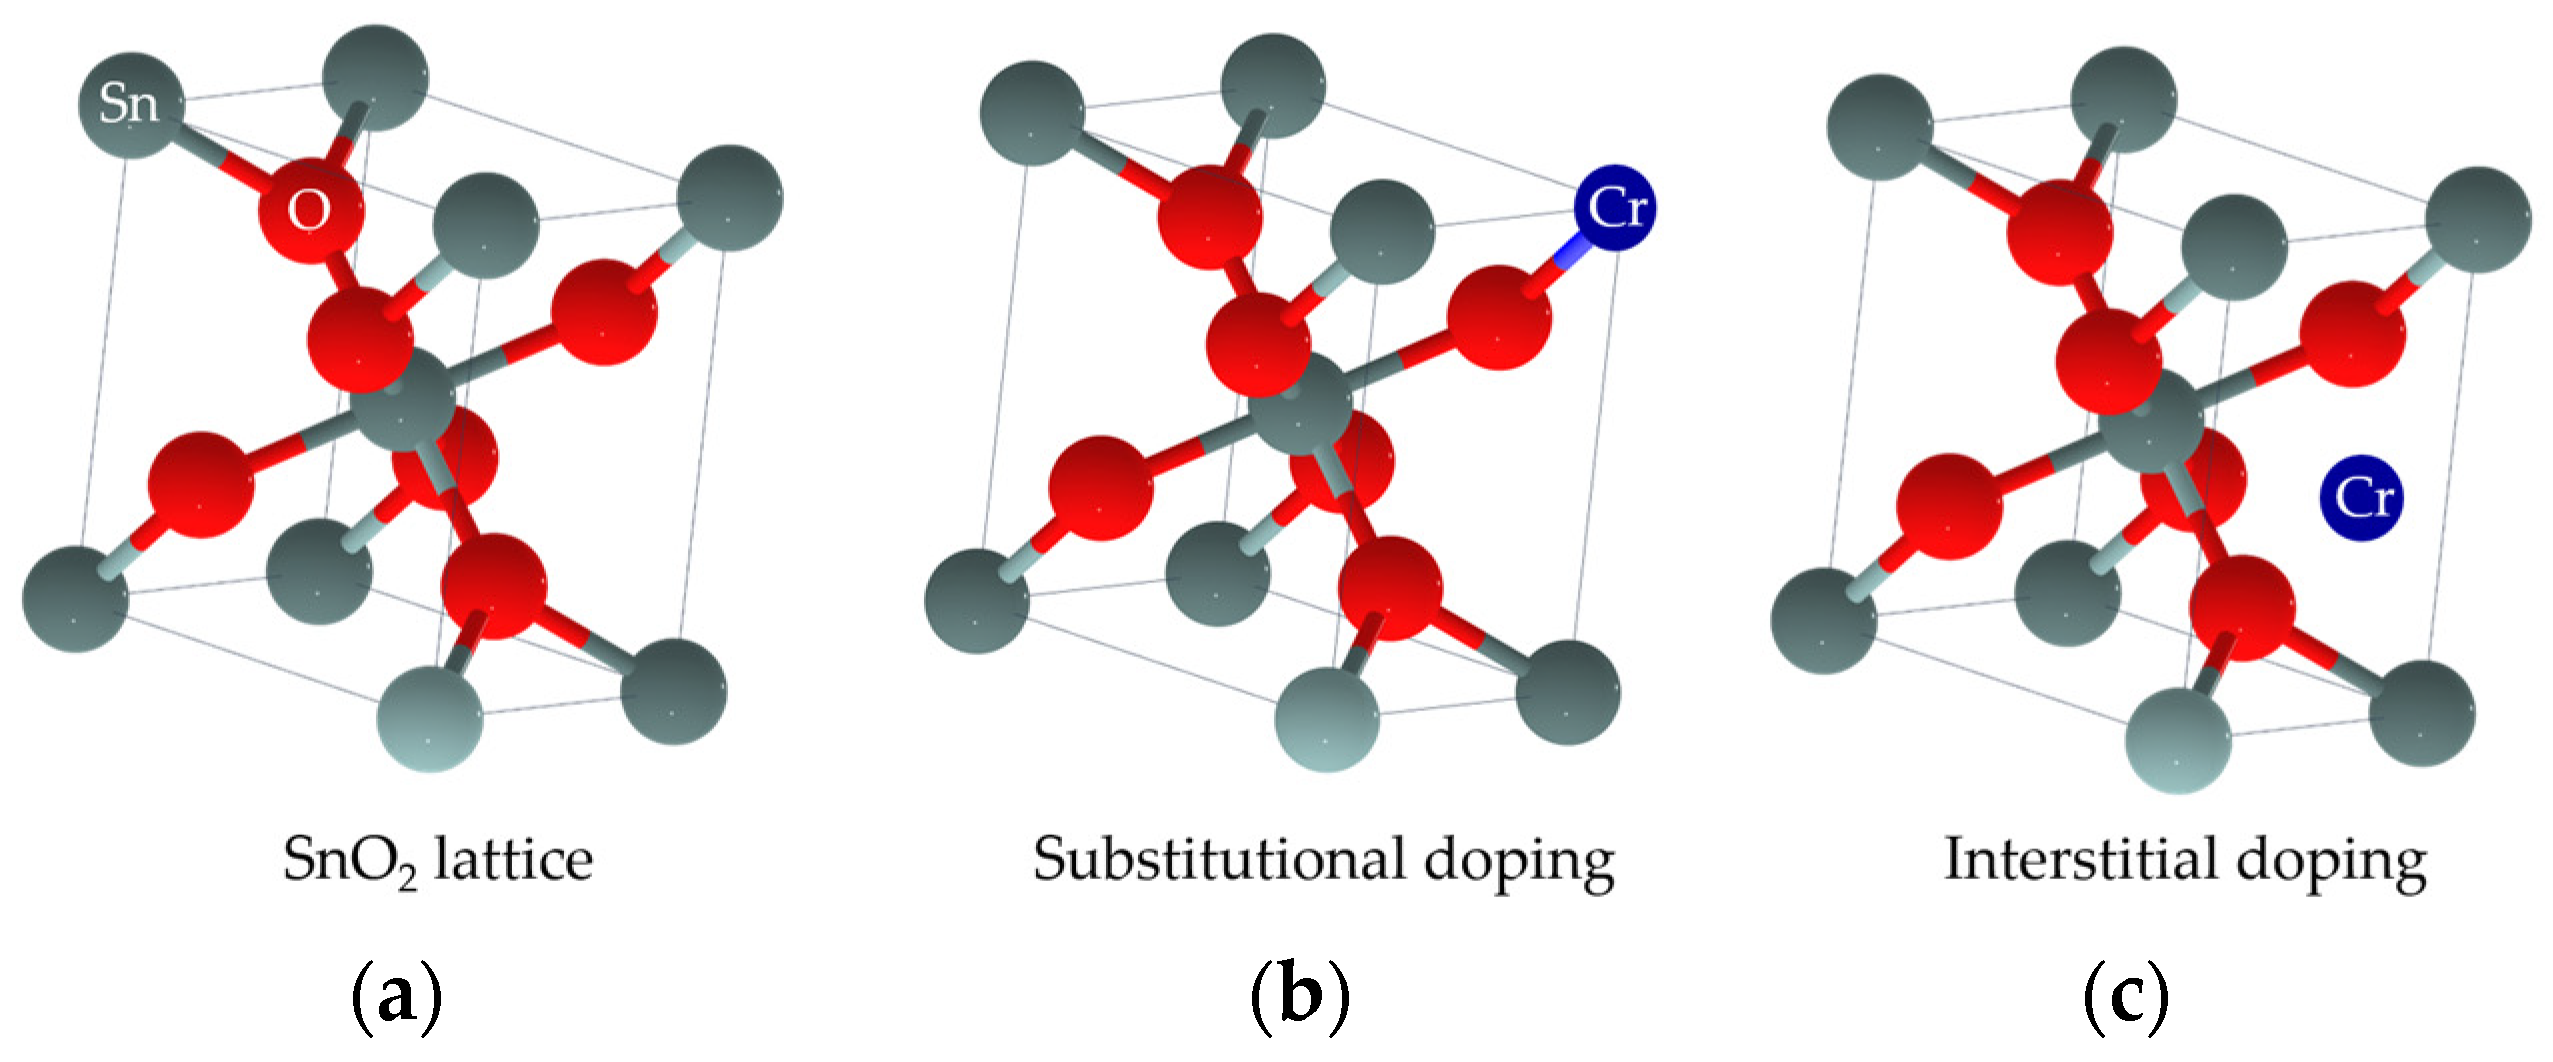
3.2. Characterization of Cr-Doped SnO2 Nanoparticles

3.2.1. The XRD Analysis

The XRD patterns of the samples with different Cr contents are illustrated in Figure 3. The diffraction peaks can be easily assigned to the tetragonal rutile configuration of SnO2. The absence of additional diffraction peaks signifies that the SnO2 nanoparticles are solely composed of crystalline material. The sharp and narrow intensity of the peaks confirms that the sample possesses a high quality, excellent crystalline structure and small grain size.

3.2.2. Determination of Crystallite Size and Microstrain

To find the size of the crystallites and the strain in the samples using the methods described earlier, only the three prominent peaks of the (110), (101) and (211) planes evident in the XRD patterns, were taken into consideration.
In accordance with Equation (1) and Figure 4, for each sample, a line was plotted through the origin with cosθ on the y-axis and 1/β on the x-axis. The Scherrer method was then employed to calculate the mean crystallite size. The results of this analysis are presented in Table 2.
The UDM data plot for the SnO2 nanoparticles is shown in Figure 5, with 4sinθ on the x-axis and βhkl cosθ on the y-axis. Using Equation (3), the y-intercept and slope of the linear fit of the data in this figure were used to estimate the crystallite size, D, and microstrain, ε, respectively. Furthermore, Figure 6 shows the USDM plots, where 4sinθ/Yhkl is plotted on the x-axis and βhkl cosθ is plotted on the y-axis, and based on Equation (4), the crystalline size and microstrain values were determined. The plots drawn based on UDEDM are also presented in Figure 7. The value of u (Equation (6)) was obtained from the slope and the crystallite size was obtained from the y-intercept of the linear fit of the plot between 4sinθ(2/Yhkl)1/2 and βhkl cosθ. Moreover, the plots generated using the Halder–Wagner method are shown in Figure 8. The values of β h k l * / d h k l * 2 and ( β h k l * / d h k l * ) 2 were used to generate the plot; the crystallite size was determined from the slope of the linear fit, and the strain was calculated from the square root of the y-intercept. These results are summarized in Table 2.
Based on the results in Table 2, it can be observed that the lattice strains from the three methods (UDM, USDM and UDEDM) based on the Williamson–Hall analysis do not differ significantly from each other. It is evident that the lattice strains calculated via different Williamson–Hall models are comparable with high accuracy. The lattice strain obtained using the Halder–Wagner method is found to be greater than that of the Williamson–Hall method. This significant difference could be attributed to the contribution of small angle X-ray scattering in the Halder–Wagner method. It seems that the lattice distortion has a considerable effect on the width of the peak located at smaller angles compared to the larger ones. Additionally, the average size of the crystallites obtained using the Halder–Wagner model is larger than that of the Williamson–Hall models [20].
It can be observed that initially, by adding the chromium content up to 5%, the value of strain decreases and subsequently, the crystallite size increases. With a further increase in impurities, the strain changes from tensile to compressive, resulting in a significant decrease in crystallite size. As the impurities increase up to 10%, the crystallites start to grow again due to the reduction in compressive strain and their size increases. Finally, with further increase in impurities, up to 15%, the strain changes back to tensile, and the crystallite size increases. This indicates that the lattice strains exhibited by the samples are not homogeneous and isotropic.
This behavior can be explained by examining the mechanisms of Cr doping. The ionic radius of Cr3+ (0.62 Å) is slightly smaller than that of Sn4+ (0.69 Å), making them compatible. When Cr is doped up to 8%, it substitutes for Sn ion, as it has a smaller ionic radius, causing the lattice to contract. However, when the dopant is increased beyond 8%, it seems that the Cr ions, which are small enough to reside in the interstitial positions of SnO2 lattice, prefer to occupy the interstitial sites rather than the substitutional ones. Figure 9 schematically illustrates these two different types of sites in SnO2 lattice.
The results show that the initial substitution of chromium ions for tin ions reduces the strain and facilitates crystallite growth due to the smaller radius of chromium ions. However, with an increase in the concentration of chromium ions, up to 8%, the crystals begin to contract and the strains become compressive. When up to 10% of Cr concentration are added, it appears that rather than substituting tin ions, the chromium ions may occupy interstitial spaces, leading to a reduction in the compressive strain within the structure. When Cr ion is increased up to 15%, interstitial doping continues, the compressive strain vanishes and a tensile strain reappears.

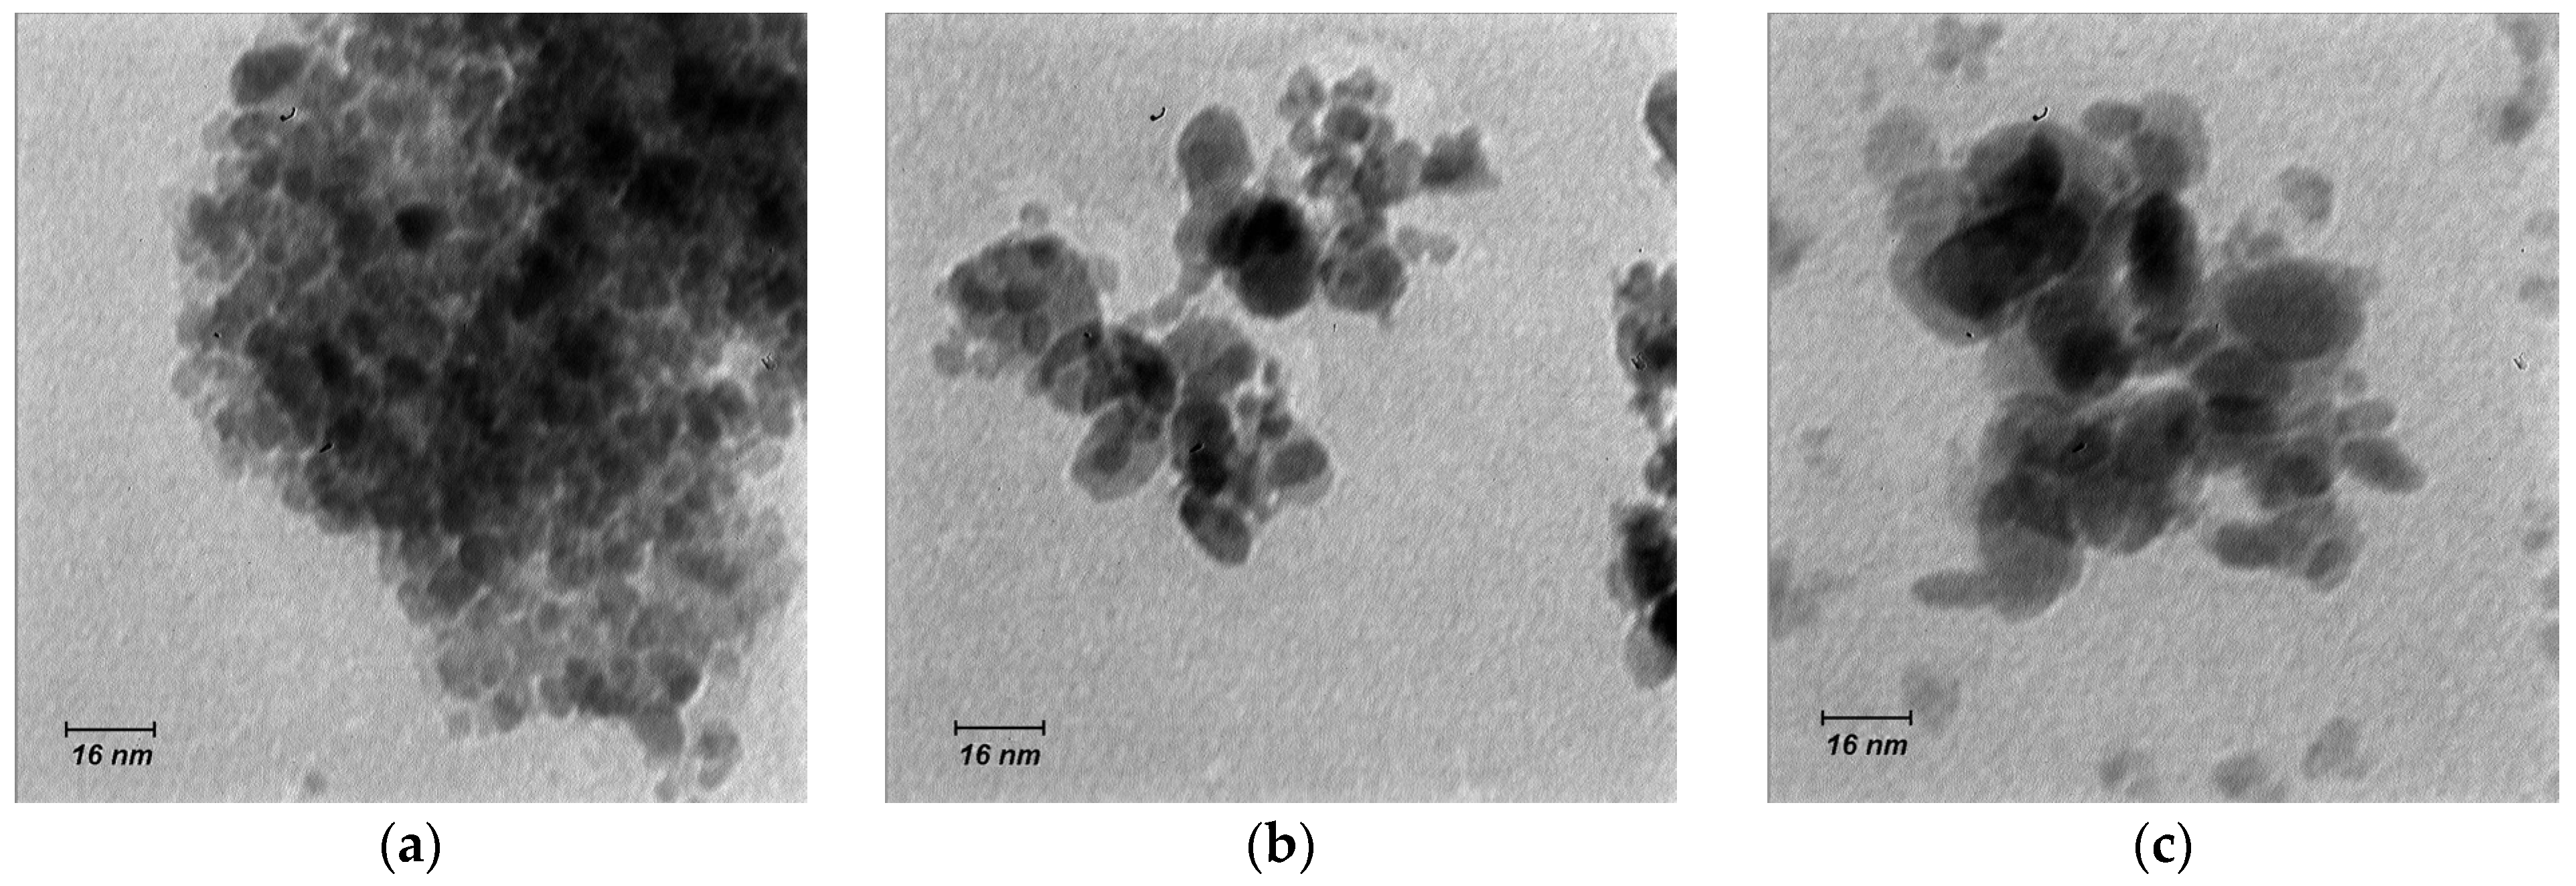
3.2.3. Morphology Analysis
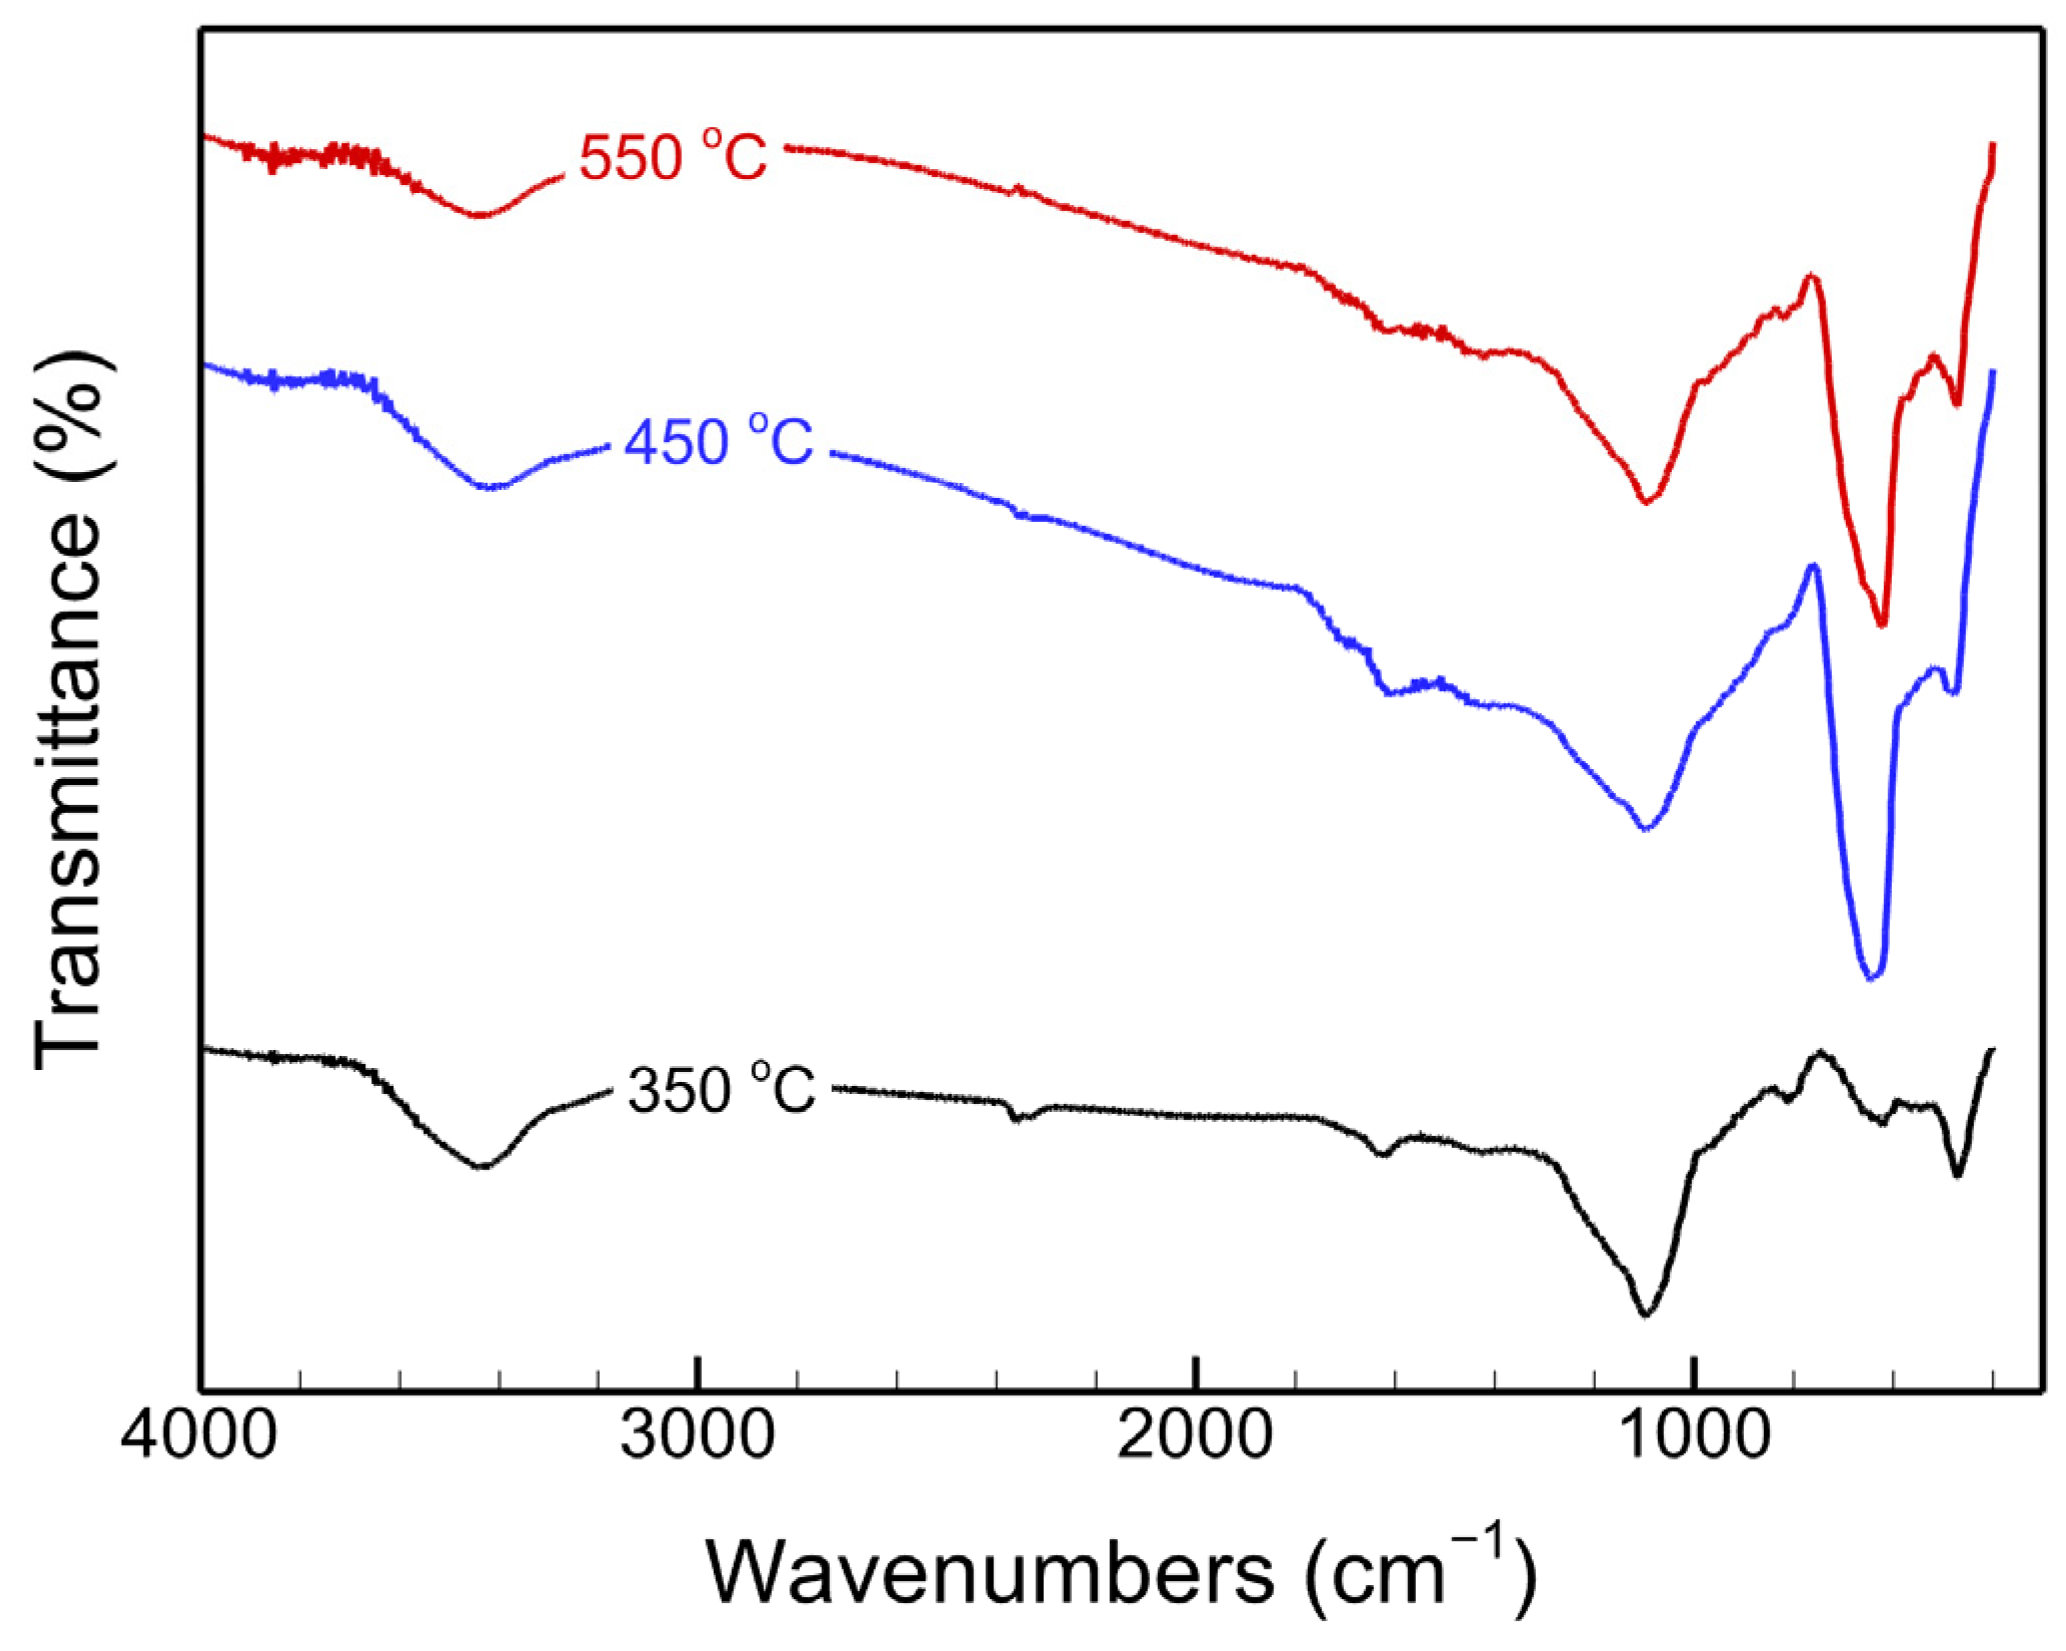
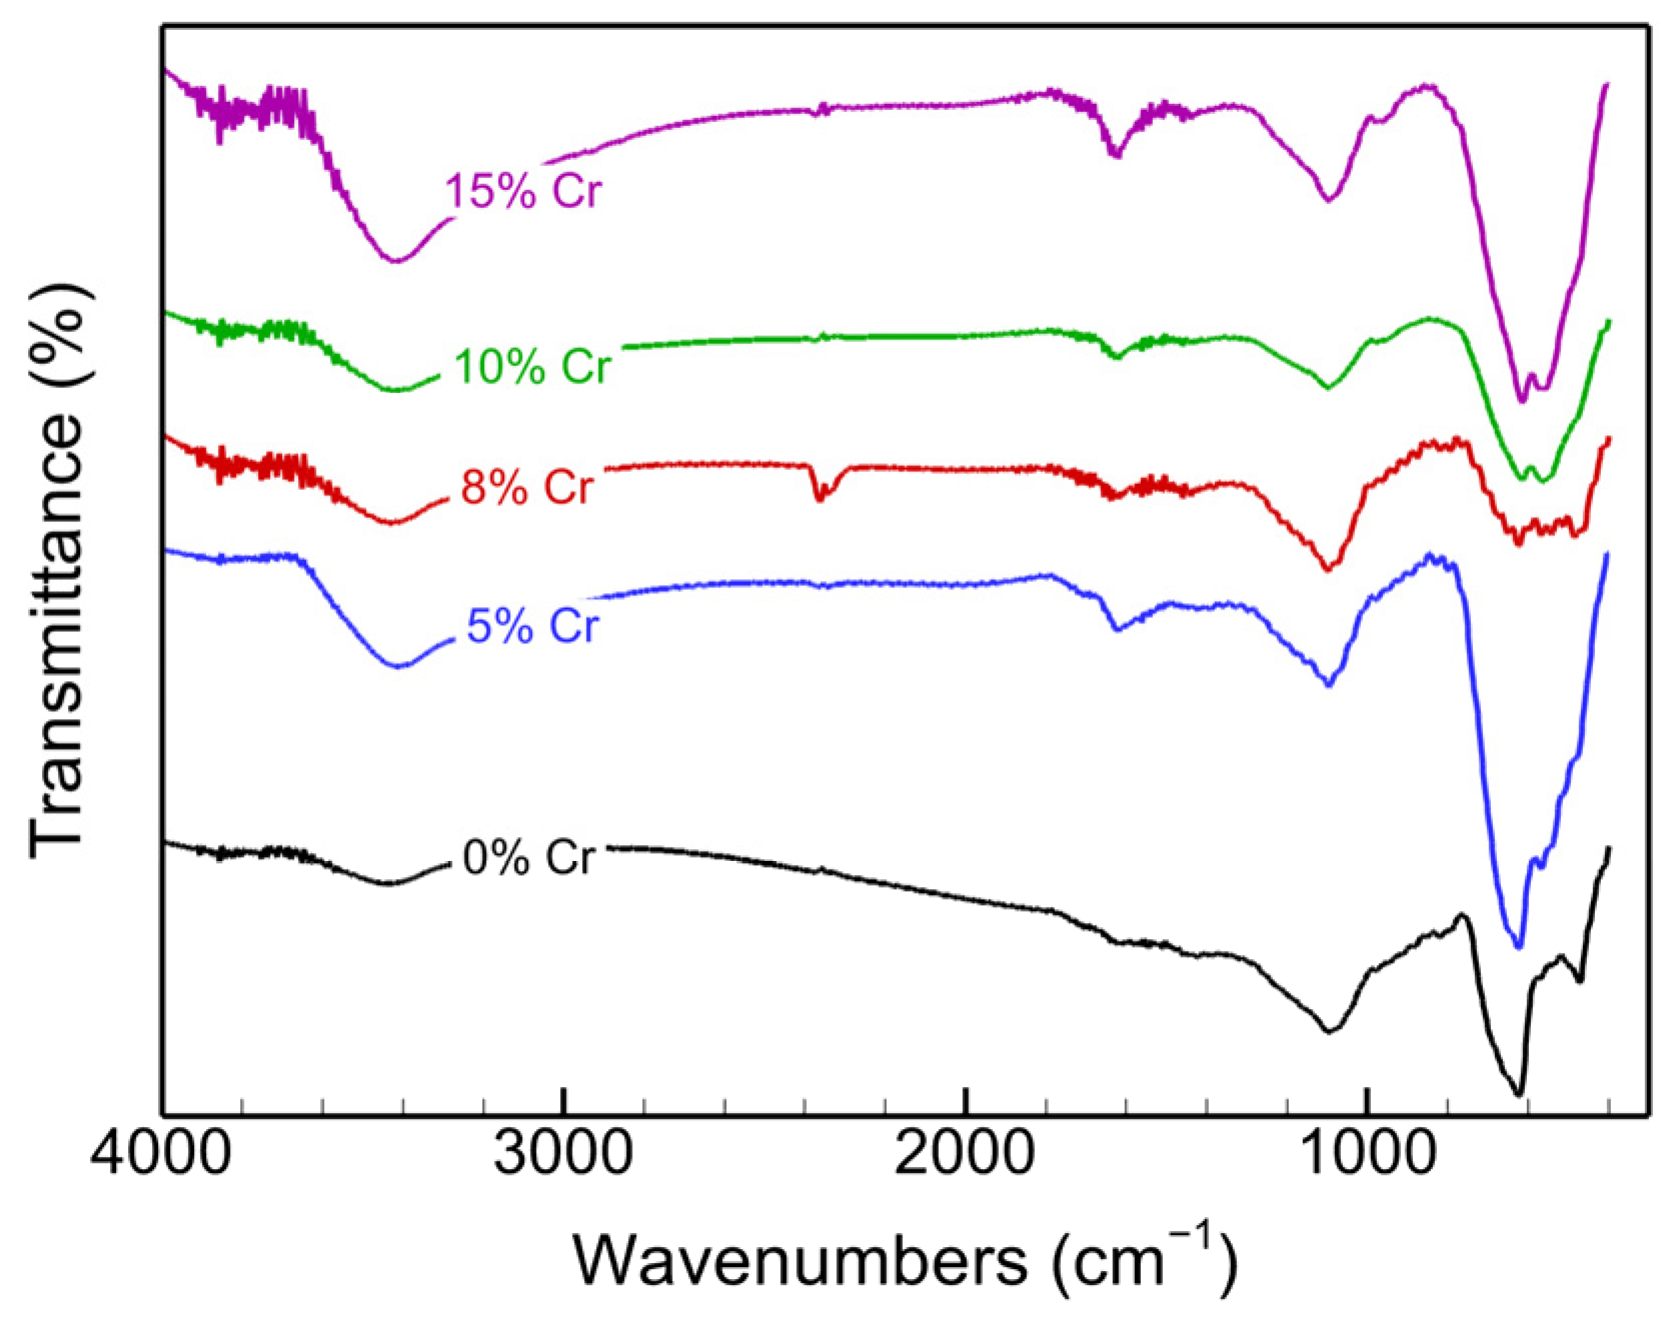
Figure 10 shows the TEM micrograph of the Cr-doped SnO2 nanoparticles with different doping concentrations. The distribution of the prepared nanoparticles is in the order of crystallite sizes, ranging from 10 to 32 nm. Moreover, the nanoparticles present in the pure sample exhibit a uniform distribution of size and shape, with comparatively smaller sizes. However, with increasing Cr doping, the average particle size increases, which is consistent with the XRD analysis results. For low contents of Cr doping, the strain in the lattice decreases, allowing the particles to grow. At higher contents of Cr doping, up to 15%, the strain in the lattice increases. However, it seems that the occupation of interstitial sites by Cr ions compensates for the effect of lattice strain, thereby leading to the growth of nanoparticles. Therefore, regardless of how much impurity is induced in the SnO2 lattice, the Cr-doped nanoparticles are larger than the pure ones.

3.2.4. FTIR Study

Figure 11 displays the FTIR spectra of SnO2 nanoparticles doped with different Cr concentrations. The functional group region of the spectra, similar to Figure 2, indicates the low amounts of organic materials in the samples. The peaks below 1000 cm−1, referred to different modes of Sn–O and Cr–O. There are two large absorptive peaks near 623 and 470 cm−1, which correspond to the stretching modes of Sn=O and Sn–O, respectively [30]. Weak bands observed in the region 622–482 cm−1 may be attributed to vibrations of νCr−O [31]. The spectra depicted in Figure 11 show that as the impurity content increases up to 5%, the two predominant peaks (623 and 470 cm−1) broaden and merge, accompanied by an increase in their intensity. This broadening and increase in peak intensity can be attributed to the entry of bands of νCr−O at 640 and 581 cm−1, as well as their merging with the stretching modes of Sn=O and Sn–O. When the impurity content is increased up to 8%, the intensity of the broad peak declines, and some tiny peaks emerge. As the intensity is associated with the molecular bonds, it can be said that adding Cr content up to 8% reduces the molecular bonds, leading to different peaks of Sn=O, Sn–O and emergence of νCr−O. This reduction occurs due to an increase in the substitution of Sn4+ with a less charged Cr3+ ion. As the Cr content is further increased, the two primary peaks begin to reappear. This suggests that adding more Cr content leads to interstitial residing and an increase in the molecular bonds of Sn–O and Sn=O. The FTIR spectra confirm that there are two different mechanisms in Cr doping which are governed by the amount of Cr concentration.

4. Conclusions

The effect of chromium impurities on the crystal structure and lattice microstrains of tin oxide nanoparticles was investigated using XRD analysis. Cr-doped SnO2 nanoparticles were synthesized using the sol–gel method followed by calcination at 550 °C. The XRD peak broadening of all samples was analyzed using the Williamson–Hall models and the Halder–Wagner method to investigate the contributions of lattice strain and crystallite size. The XRD patterns showed the formation of pure SnO2 with a rutile structure, and no impurity phases were detected. Our findings revealed that the impurity concentration has a dual effect on nanoparticle sizes. Specifically, an increase in chromium impurity up to 8% resulted in elevated compressive stress due to the substitution of Sn ions with Cr ions in the rutile crystal structure. However, when the impurities increased further, to 15%, Cr ions may prefer to occupy interstitial sites in SnO2 lattice, resulting in a switch to tensile strain and an increase in the crystallite size. The morphological characterization using TEM indicated that the nanoparticles have diameters ranging from 10 to 32 nm. The FTIR spectra confirmed the dual behavior observed by doping SnO2 nanoparticles, with a critical chromium concentration of 8%.

Author Contributions

Conceptualization, L.M. and M.T.; methodology, L.M.; software, M.T.; validation, L.M. and M.T.; formal analysis, M.T.; investigation, L.M.; resources, L.M.; data curation, M.T.; writing—original draft preparation, L.M.; writing—review and editing, L.M. and M.T.; visualization, L.M. All authors have read and agreed to the published version of the manuscript.

Funding

This research received no external funding.

Data Availability Statement

Data available on request due to restrictions, e.g., privacy.

Conflicts of Interest

The authors declare no conflict of interest.

References

  1. Dolatyari, M.; Jafari, A.; Rostami, A.; Klein, A. Transparent Display using a quasi-array of Si-SiO2 Core-Shell Nanoparticles. Sci. Rep. 2019, 9, 2293. [Google Scholar] [CrossRef] [Green Version]
  2. Kumar, R.; Mamta; Kumari, R.; Singh, V.N. SnO2-based NO2 gas sensor with outstanding sensing performance at room temperature. Micromachines 2023, 14, 728. [Google Scholar] [CrossRef]
  3. Lisnic, P.; Hrostea, L.; Leonti, L.; Girtan, M. Fluorine-doped SnO2 thin films in solar cell applications. Morphological, optical and electrical properties. Arch. Metall. Mater. 2023, 68, 8. [Google Scholar]
  4. Rangraz, Y.; Vahdat, S.M.; Khaksar, S. SnO2 nanoparticles: A recyclable and heterogeneous catalyst for Pechmann condensation of coumarins and Knoevenagel condensation–Michael addition of biscoumarins. Heliyon 2023, 9, e15135. [Google Scholar] [CrossRef]
  5. Ye, Q.; Zhang, X.; Yao, R.; Luo, D.; Liu, X.; Zou, W.; Guo, C.; Xu, Z.; Ning, H.; Peng, J. Research and progress of transparent, flexible tin oxide ultraviolet photodetector. Crystals 2021, 11, 1479. [Google Scholar] [CrossRef]
  6. Park, J.-S.; Oh, Y.J.; Kim, J.H.; Kang, Y.C. Porous nanofibers comprised of hollow SnO2 nanoplate building blocks for high-performance lithium ion battery anode. Mater. Charact. 2020, 161, 110099. [Google Scholar] [CrossRef]
  7. Din, S.U.; Kiani, S.H.; Haq, S.; Ahmad, P.; Khandaker, M.U.; Faruque, M.R.I.; Idris, A.M.; Sayyed, M.I. Bio-synthesized tin oxide nanoparticles: Structural, optical, and biological studies. Crystals 2022, 12, 614. [Google Scholar] [CrossRef]
  8. Drzymała, E.; Gruzeł, G.; Depciuch, J.; Budziak, A.; Kowal, A.; Parlinska-Wojtan, M. Structural, chemical and optical properties of SnO2 NPs obtained by three different synthesis routes. J. Phys. Chem. Solids 2017, 107, 100–107. [Google Scholar] [CrossRef]
  9. Feng, C.; Li, X.; Wang, C.; Sun, Y.; Zheng, J.; Lu, G. Facile synthesis benzene sensor based on V2O5-doped SnO2 nanofibers. RSC Adv. 2014, 4, 47549–47555. [Google Scholar] [CrossRef]
  10. Ghodsi, F.E.; Mazloom, J. Optical, electrical and morphological properties of p-type Mn-doped SnO2 nanostructured thin films prepared by sol–gel process. Appl. Phys. A 2012, 108, 693–700. [Google Scholar] [CrossRef]
  11. Mazloom, J.; Ghodsi, F.E. Spectroscopic, microscopic, and electrical characterization of nanostructured SnO2:Co thin films prepared by sol–gel spin coating technique. Mater. Res. Bull. 2013, 48, 1468–1476. [Google Scholar] [CrossRef]
  12. Chen, D.; Huang, S.; Huang, R.; Zhang, Q.; Le, T.-T.; Cheng, E.; Hu, Z.; Chen, Z. Convenient fabrication of Ni-doped SnO2 quantum dots with improved photodegradation performance for Rhodamine B. J. Alloys Compd. 2019, 788, 929–935. [Google Scholar] [CrossRef]
  13. Ali Baig, A.B.; Rathinam, V.; Ramya, V. Synthesis and Investigation of Fe doped SnO2 Nanoparticles for Improved Photocatalytic Activity under Visible Light and Antibacterial performances. Mater. Technol. 2021, 36, 623–635. [Google Scholar] [CrossRef]
  14. Ching-Prado, E.; Watson, A.; Miranda, H. Optical and electrical properties of fluorine doped tin oxide thin film. J. Mater. Sci. Mater. Electron. 2018, 29, 15299–15306. [Google Scholar] [CrossRef]
  15. Li, W.; Ding, C.; Li, J.; Ren, Q.; Bai, G.; Xu, J. Sensing mechanism of Sb, S doped SnO2 (1 1 0) surface for CO. Appl. Surf. Sci. 2020, 502, 144140. [Google Scholar] [CrossRef]
  16. Yu, J.; Wang, Y.; Huang, Y.; Wang, X.; Guo, J.; Yang, J.; Zhao, H. Structural and electronic properties of SnO2 doped with non-metal elements. Beilstein J. Nanotechnol. 2020, 11, 1321–1328. [Google Scholar] [CrossRef]
  17. Bose, A.C.; Kalpana, D.; Thangadurai, P.; Ramasamy, S. Synthesis and characterization of nanocrystalline SnO2 and fabrication of lithium cell using nano-SnO2. J. Power Sources 2002, 107, 138–141. [Google Scholar] [CrossRef]
  18. Divya, J.; Pramothkumar, A.; Joshua Gnanamuthu, S.; Bernice Victoria, D.C.; Jobe Prabakar, P.C. Structural, optical, electrical and magnetic properties of Cu and Ni doped SnO2 nanoparticles prepared via Co-precipitation approach. Physica B 2020, 588, 412169. [Google Scholar] [CrossRef]
  19. Soo, M.T.; Kawamura, G.; Muto, H.; Matsuda, A.; Lockman, Z.; Cheong, K.Y. Design of hierarchically meso–macroporous tetragonal ZrO2 thin films with tunable thickness by spin-coating via sol–gel template route. Microporous Mesoporous Mater. 2013, 167, 198–206. [Google Scholar] [CrossRef]
  20. Motevalizadeh, L.; Heidary, Z.; Abrishami, M.E. Facile template-free hydrothermal synthesis and microstrain measurement of ZnO nanorods. Bull. Mater. Sci. 2014, 37, 397–405. [Google Scholar] [CrossRef]
  21. Vallejos, S.; Selina, S.; Annanouch, F.E.; Gràcia, I.; Llobet, E.; Blackman, C. Aerosol assisted chemical vapour deposition of gas sensitive SnO2 and Au-functionalised SnO2 nanorods via a non-catalysed vapour solid (VS) mechanism. Sci. Rep. 2016, 6, 28464. [Google Scholar] [CrossRef] [Green Version]
  22. Xie, H.; Yin, X.; Chen, P.; Liu, J.; Yang, C.; Que, W.; Wang, G. Solvothermal synthesis of highly crystalline SnO2 nanoparticles for flexible perovskite solar cells application. Mater. Lett. 2019, 234, 311–314. [Google Scholar] [CrossRef]
  23. Mustapha, S.; Ndamitso, M.M.; Abdulkareem, A.S.; Tijani, J.O.; Shuaib, D.T.; Mohammed, A.K.; Sumaila, A. Comparative study of crystallite size using Williamson-Hall and Debye-Scherrer plots for ZnO nanoparticles. Adv. Nat. Sci. Nanosci. Nanotechnol. 2019, 10, 045013. [Google Scholar] [CrossRef]
  24. Tan, W.K.; Muto, H.; Kawamura, G.; Lockman, Z.; Matsuda, A. Nanomaterial fabrication through the modification of sol–gel derived coatings. Nanomaterials 2021, 11, 181. [Google Scholar] [CrossRef]
  25. Muhammed Shafi, P.; Chandra Bose, A. Impact of crystalline defects and size on X-ray line broadening: A phenomenological approach for tetragonal SnO2 nanocrystals. AIP Adv. 2015, 5, 057137. [Google Scholar] [CrossRef]
  26. Mote, V.D.; Purushotham, Y.; Dole, B.N. Williamson-Hall analysis in estimation of lattice strain in nanometer-sized ZnO particles. J. Theor. Appl. Phy. 2012, 6, 6. [Google Scholar] [CrossRef] [Green Version]
  27. Bindu, P.; Thomas, S. Estimation of lattice strain in ZnO nanoparticles: X-ray peak profile analysis. J. Theor. Appl. Phy. 2014, 8, 123–134. [Google Scholar] [CrossRef] [Green Version]
  28. Al-Shomar, S.M.; Akl, A.A.; Mansour, D.; Hedhili, F.; Aslam, A.; Shaaban, E.R.; Mahmoud, S.A. Influence of Mo+2 ion concentration on crystallization, microstructure, crystal imperfection and morphology of WO3 sprayed thin films. Mater. Res. Express 2022, 9, 096404. [Google Scholar] [CrossRef]
  29. Khorsand Zak, A.; Abd Majid, W.H.; Abrishami, M.E.; Yousefi, R. X-ray analysis of ZnO nanoparticles by Williamson–Hall and size–strain plot methods. Solid State Sci. 2011, 13, 251–256. [Google Scholar] [CrossRef]
  30. Abruzzi, R.C.; Dedavid, B.A.; Pires, M.J.R. Characterization of tin dioxide nanoparticles synthesized by oxidation. Cerâmica 2015, 61, 328–333. [Google Scholar] [CrossRef] [Green Version]
  31. Bumajdad, A.; Al-Ghareeb, S.; Madkour, M.; Sagheer, F.A. Non-noble, efficient catalyst of unsupported α-Cr2O3 nanoparticles for low temperature CO Oxidation. Sci. Rep. 2017, 7, 14788. [Google Scholar] [CrossRef] [Green Version]
Figure 1. The X-ray diffraction patterns analysis of tin oxide nanoparticles at different calcination temperatures of 350, 450 and 550 °C.
Crystals 13 00919 g001
Figure 2. The FTIR spectra of SnO2 nanoparticles calcined at different temperatures.
Crystals 13 00919 g002
Figure 3. XRD patterns of Cr-doped SnO2 nanoparticles with different Cr concentrations.
Crystals 13 00919 g003
Figure 4. The fitted line using the Scherrer method for Cr-doped SnO2 nanoparticles with (a) 0%, (b) 5%, (c) 8%, (d) 10% and (e) 15% Cr concentrations.
Crystals 13 00919 g004
Figure 5. The fitted line using the UDM method for SnO2 nanoparticles doped with (a) 0%, (b) 5%, (c) 8%, (d) 10% and (e) 15% Cr concentrations.
Crystals 13 00919 g005
Figure 6. The fitted line using the USDM method for SnO2 nanoparticles doped with (a) 0%, (b) 5%, (c) 8%, (d) 10% and (e) 15% Cr concentrations.
Crystals 13 00919 g006
Figure 7. The fitted line using the UDEDM method for SnO2 nanoparticles doped with (a) 0%, (b) 5%, (c) 8%, (d) 10% and (e) 15% Cr concentrations.
Crystals 13 00919 g007
Figure 8. The fitted line using the Halder–Wagner method for Cr-doped SnO2 nanoparticles with (a) 0%, (b) 5%, (c) 8%, (d) 10% and (e) 15% Cr concentrations.
Crystals 13 00919 g008
Figure 9. A visual representation depicting the atomic modification of the SnO2 lattice by Cr doping, including both substitutional and interstitial sites. (a) SnO2 lattice, (b) substitutional doping and (c) interstitial doping.
Crystals 13 00919 g009
Figure 10. TEM of Cr-doped SnO2 nanoparticles. (a) 0%, (b) 5% and (c) 15% Cr concentration.
Crystals 13 00919 g010
Figure 11. The FTIR spectra of SnO2 nanoparticles doped with various Cr concentrations.
Crystals 13 00919 g011
Table 1. The results of weighing SnO2 powders before and after calcination at different temperatures for 1.5 h. The initial mass before heating was 4 g.
Calcination Temperature (°C)Mass after Heating
(g)
Relative Mass Reduction
(%)
3503.1122.25
4502.8329.25
5502.5735.75
Table 2. Geometric parameters of chromium-doped tin oxide nanoparticles at various Cr concentrations.
CompoundScherrer
D (nm)
Williamson–Hall MethodHalder–Wagner Method
UDMUSDMUDEDM
D
(nm)
ε × 10−3D
(nm)
ε × 10−3σ
(MPa)
D
(nm)
ε × 10−3σ
(MPa)
u
(kJ.m3)
D
(nm)
ε × 10−3
SnO2:Cr 0%26.7531.370.6631.370.7385.9031.370.6678.0625.7632.206.0
SnO2:Cr 5%28.8533.650.5933.690.5969.4733.690.5969.5020.4569.334.9
SnO2:Cr 8%28.2222.78−0.9222.78−0.92−108.222.78−0.92−108.5649.5728.25−2.8
SnO2:Cr 10%33.6826.45−0.8626.45−0.86−101.826.45−0.86−101.7943.8932.92−2.8
SnO2:Cr 15%31.8833.590.1933.590.1921.8833.590.1921.952.0335.042.8
Disclaimer/Publisher’s Note: The statements, opinions and data contained in all publications are solely those of the individual author(s) and contributor(s) and not of MDPI and/or the editor(s). MDPI and/or the editor(s) disclaim responsibility for any injury to people or property resulting from any ideas, methods, instructions or products referred to in the content.

