Article

In Situ Liquid-Phase AFM Observation of the Molecular Step Spiral Generation on the (101) Surface of Calcium Oxalate Monohydrate Crystal

1
Department of Energy Engineering/KENTECH Institute for Environmental and Climate Technology, Korea Institute of Energy Technology (KENTECH), Naju 58330, Republic of Korea
2
Physical and Life Sciences Directorate, Lawrence Livermore National Laboratory, Livermore, CA 94550, USA
Crystals 2023, 13(6), 889; https://doi.org/10.3390/cryst13060889
Submission received: 28 April 2023 / Revised: 24 May 2023 / Accepted: 27 May 2023 / Published: 28 May 2023
(This article belongs to the Topic In-Situ Study of Mineralogy, Gemology and Progress in Gemology)
(This article belongs to the Section Mineralogical Crystallography and Biomineralization)

Abstract

:
Calcium oxalate monohydrate (COM) crystal is the major crystalline component of human kidney stones. Its growth event at the nanometer and micrometer scales, i.e., the growth of the COM molecular steps generated from the dislocation outcrop on the crystal surface and its inhibition by associated acidic organic molecules such as citrate, is now well understood by studies conducted using in situ liquid-phase atomic force microscopy (AFM). Yet, the detailed assessment of the evolution of the COM molecular steps at the dislocation outcrop has been poorly conducted. Herein, in situ liquid-phase AFM was used to primarily investigate how those COM molecular steps are generated on a COM broadest crystal surface ( 1 01) and influenced by a model acidic peptide, L-aspartic acid 6mer (L-Asp6) adsorbed onto the emerging steps and terraces on the surface. Like many other mineral crystals, a segment of the pseudo-triangle-shaped step spiral, in the process of its birth from the dislocation outcrop, starts to move after reaching the critical step length. When the budding step spiral got adsorption of L-Asp6 to it, it appeared rather with ellipse-like hexagonal morphology—which is reflected in the bulk crystal morphology—implying changes in orientation-dependent step edge energy and much-delayed spiral generation time.

1. Introduction

Kidney stone disease is a disease caused by the formation of stones in the kidney or urinary tract [1,2,3,4]. It is a very common disease affecting about 12% of the world’s population [2]. Calcium stones account for more than 80% of the stones, and calcium oxalate monohydrate (COM; CaC2O4·H2O) is the most representative calcium phase in calcium stones [2]. In addition to the crystalline phase, the stones include organic substances such as glycosaminoglycans, carbohydrates, lipids, low-molecular-weight organic molecules, and proteins, which account for the largest amount among the organic substances [1,2]. The formation of calcium stones proceeds through crystal nucleation, growth and agglomeration processes which are affected by the composition (e.g., levels of calcium oxalate) of the urine and the organic substances in them [5].
Many studies on COM crystals, the main mineral crystal composing the calcium stones, employing isotopic methods [6] and tools like scanning electron microscopy [7,8], fluorescence microscopy [8,9], and in situ liquid-phase atomic force microscopy (AFM) [10,11,12,13,14,15,16,17,18,19,20,21], have been conducted to understand the effect of associate ion, Mg2+ [6,19] and biomolecules (or artificial agents [16,17,19,20]) such as citric acid [11,13,14,22] and osteopontin [11,23] on the COM formation at various supersaturation and suggested the inhibitory mechanisms such as chelation of oxalate ions leading to increased solubility of calcium oxalate [6] and face-specific binding of the biomolecules (or artificial agents) to the growing molecular steps on crystal faces [11,12,13,14,15,16,17,18,19,20,21].
In particular, studies with in situ liquid-phase AFM, which enables one to follow nanoscale events occurring on the specific face of the COM crystals in the solution directly, have advanced our understanding of the inhibitory mechanism of those biomolecules (or artificial agents) greatly based on the visual data of the interaction between those additives and molecular steps. They showed that the growth of the molecular steps is mainly inhibited by the binding of the biomolecules or synthetic peptides to the step kinks, which frustrates the incorporation of calcium and oxalate ions into the kinks [11,13,14,17]. It was found that the acidic functional group (COOH) of molecules is needed for them to bind to the molecular steps. Thus, organic acids, peptides and proteins rich in carboxylic moieties such as aspartic acid and glutamic acid have been informed to play a pivotal role in inhibiting COM crystal growth [7,11,14,17].
However, studies focusing on the generation of these molecular steps at the dislocation outcrop on the COM surface have been poorly conducted, although the growth and inhibition of the generated molecular steps by the aforementioned molecules have been revealed in detail. Here, using in situ liquid-phase AFM, the generation of the molecular steps at the dislocation outcrop on the COM ( 1 01) surface, which is the crystal’s broadest face, has been primarily investigated both in a supersaturated pure solution and solution containing a model peptide, L-aspartic acid 6mer (L-Asp6). As a purpose of letting readers have an understanding of the effect of the event of the molecular step generation and subsequent growth occurring at the nanoscale at the big picture, the COM crystal morphologies synthesized in a pure supersaturated solution and the same solution but containing L-Asp6 are presented first at the beginning of the Results and Discussion section.

2. Materials and Methods

2.1. Materials

Calcium chloride dihydrate or anhydrous (99.99%, Sigma-Aldrich, St. Louis, MO, USA), potassium oxalate monohydrate (99.99%, Sigma-Aldrich, St. Louis, MO, USA or Acros Organics, Geel, Belgium), potassium chloride (99.99%, Sigma-Aldrich, St. Louis, MO, USA), L-Asp6 over the purity of 98% based on HPLC analysis (Anygen, Gwangju, Republic of Korea and PEPTIDE 2.0, Chantilly, VA, USA) which was stored at −20 °C before use, and calcium oxalate monohydrate seed crystal for in situ liquid-phase AFM study, grown by a gel method, were used. Details of the synthesis method of the seed crystal are described in ref. [24].

2.2. Bulk COM Crystallization

For COM crystallization in the pure solution, 10 mL of the solution containing 1.4 mM CaCl2 and 46.6 mM KCl in deionized water were mixed with 10 mL of the solution containing 1.4 mM K2C2O4 and 46.6 mM KCl in deionized water to produce 20 mL of the synthesis solution (0.7 mM CaCl2, 0.7 mM K2C2O4, and 46.6 mM KCl). A piece of the clean glass slide was placed at the bottom of a beaker containing the solution to easily collect the COM crystals after crystallization. The crystallization proceeded at room temperature for 44 h. (However, it was found that there was no difference in the crystal morphology in the samples from both pure and 20 μM L-Asp6-containing solutions whether they were incubated for 24 h or 44 h. This suggested that the crystallization already reached the reaction equilibrium within 24 h). Then, the glass slide was taken out of the beaker and the residual solution on the glass slide was immediately removed by the absorption paper and subsequently air-dried for the SEM observation. For COM crystallization in the solution containing 20 μM L-Asp6, 20 mL synthesis solutions of the same ionic compositions as in the pure solution but containing 20 μM L-Asp6 were prepared by mixing CaCl2 solution with 40 μM L-Asp6-containing K2C2O4 solution at equal volumes. Then the same crystallization conditions as in the pure solution were applied.

2.3. Scanning Electron Microscopy (SEM) Imaging

Imaging was performed using a Jeol field emission scanning electron microscope (JSM-7600F) at a typical accelerating voltage of 5 kV. COM crystals on the glass slide were transferred to the carbon tape attached to an SEM holder by gently pressing the slide to the carbon tape. Then the holder was placed within the chamber of a sputter coater (Cressington 108auto), and the crystals on the carbon tape were coated with platinum for 45 s to reduce the charging effect—using the platinum sputter target—under a representative starting condition of 35 mA and 0.1 mbar for the SEM observation.

2.4. In Situ Liquid-Phase Atomic Force Microscopy (AFM) Imaging

The procedure for the in situ liquid-phase AFM imaging of the COM crystal growth is also available in the ref. [15,16,20]. A COM seed crystal with its ( 1 01) surface exposed was glued with inert polyurethane (HARDMAN DOUBLE/BUBBLE 4022, green) onto a plastic coverslip which was already glued to an AFM specimen disk (Ted Pella Inc., Redding, CA, USA) with a diameter of 15 mm. Then it was placed inside the O-ring of an AFM fluid cell (MTFML, Bruker, Camarillo, CA, USA) installed in an atomic force microscope (Nanoscope IIIa from Digital Instruments, Santa Barbara, CA, USA). The spiral generation and its subsequent growth on the COM ( 1 01) surface were observed in situ in contact mode using SiN cantilevers (NP-S, Bruker) with a force constant of 0.12 N/m or 0.06 N/m while a supersaturated calcium/oxalate solution at pH 7 with specific composition was flowing through the fluid cell at 2 mL/min with the help of a peristaltic pump. To observe the effect of L-Asp6 on the generation of the molecular step spiral and its subsequent growth on the ( 1 01) surface, the supersaturated pure calcium/oxalate solution first flowing into the AFM fluid cell was changed with the L-Asp6-containing calcium/oxalate solution at the same supersaturation and the effect was monitored in situ. All images were collected with 256 fast scan lines and a scan rate of 14 Hz, except for Figure 1c, which was obtained with a scan rate of 4 Hz while the solution was flowing.
Supersaturation ( σ ) was given by the following formula, which was defined with respect to either calcium or oxalate ion rather than one calcium oxalate monohydrate molecule [15,16,20]:
σ = 1 2 l n ( a C a 2 + a O x 2 a C a e 2 + a O x e 2 )
where a C a 2 + and a O x 2 are the calcium and oxalate activities in the solution and a C a e 2 + and a O x e 2 are the equilibrium calcium and oxalate activities. The water activity is not expressed in the supersaturation equation since it can be taken as 1 due to its mole fraction being nearly 1 in the solution. The ion activities in the solution were obtained by using the multi-component speciation program Visual Minteq [25], which uses the Davies equation to calculate the ion activity coefficient.

3. Results and Discussion

3.1. Shape of Bulk COM Crystals Formed in the Supersaturated Pure Solution and Solution Containing L-Aspartic Acid 6mer (L-Asp6)

The COM crystal has a monoclinic crystal system with unit cell parameters of a = 9.976 Å, b = 14.588 Å, c = 6.291 Å, and β = 107.05° [26]. It typically forms with a hexagonal crystal morphology in the pure supersaturated solution, although the shape can be somewhat different depending on the synthesis conditions, such as ionic strength, pH, temperature, etc. [16,24]. Figure 1a shows a COM crystal with a hexagonal crystal morphology, synthesized in a pure calcium oxalate solution (0.7 mM CaCl2, 0.7 mM K2C2O4, 46.6 mM KCl), with its broadest face, ( 1 01) placed on the carbon tape of the substrate.
As seen, the COM crystal is the twin crystal (indicated by Crystal 1 and Crystal 2, and also another, Crystal 3, is seen), and all or nearly all of the observed crystals had this characteristic in this synthesis condition. As already reported in previous papers, the broadest COM face ( 1 01) is known to have many growth hillocks, as shown in Figure 1c, resembling the triangle morphology during their growth. These hillocks consist of many spiral turns with molecular steps (indicated by a dashed white arrow in Figure 1c) 0.57 nm high [16,17], of which generation from the screw dislocation outcrop is the main topic of this paper. The shape of the growth hillocks and location on the ( 1 01) where they were frequently found during in situ liquid-phase AFM observation is indicated by placing a schematic (called Hillock A) on that location which is the left side of the crystal shown in Figure 1a. In this orientation of the placement of the crystal, the hillocks (called Hillock B), which had mirror-symmetrical relationships, were frequently observed in the places close to the right side of the whole crystal (or Crystal 2) seen by a schematic placed on that location due to the twin structure of the bulk crystal.
When the synthesis solution included 20 μM L-aspartic acid 6mer (Asp6)—a model peptide—which mimics the acidic functional group (COOH) of molecules regulating the COM formation, the synthesized crystals had such morphologies as one seen in Figure 1b. This morphology is similar to those synthesized in the solution containing citrate with carboxylic moieties, a regulating peptide for the COM crystal formation [13]. A comparison of the crystal morphologies formed from the pure solution and solution containing 20 μM L-Asp6 shows that growth along the direction of length (L) was inhibited relatively more to the direction of width (W), given by the value of W/L = 0.38 for the pure solution (Figure 1a) versus W/L = 0.55 for the solution containing 20 μM L-Asp6 (Figure 1b).
As seen in the results of in situ liquid-phase AFM investigation of the effect of citrate on the growth of the hillocks, which explained the shape modification of COM crystals [11,13], the AFM observation of the effect of L-Asp6 on the growth of the hillocks can account for the morphological modification seen in Figure 1b. This will be dealt with later while the effect of L-Asp6 on the step generation from the screw dislocation outcrop on the ( 1 01) surface is explained.

3.2. Spiral Generation from the Screw Dislocation Outcrop at the ( 1 01) Crystal Surface in the Supersaturated Pure Solution

The COM crystal grows by the growth of molecular steps generated from the screw dislocation outcrop [27] at the crystal surface in the solution at low to moderate supersaturations like many other crystals, such as calcite [28,29,30] and brushite [31]. The inset of Figure 2b shows an AFM tip scanning on the growing ( 1 01) surface of a COM crystal grown by the gel method [24]—much larger than that in Figure 1a—in a supersaturated pure calcium/oxalate solution. During this in situ observation of the growing ( 1 01) surface, molecular steps generated from the aforementioned screw dislocation outcrops were seen to grow and form the growth hillock such as one shown in Figure 1c [16,17,19,20].
Consecutive in situ liquid-phase AFM images (Figure 2) capturing the growth events occurring in a location as an area within a dashed white box in Figure 1c show how a molecular step spiral at the screw dislocation outcrop on the ( 1 01) surface was generated and subsequently how the growth hillock could form. In Figure 2a, the location of a screw dislocation outcrop is indicated by a dashed white arrow and is seen in more detail in Figure 2e, which is a magnified view of a white box in Figure 2a. In Figure 2e, not yet a new spiral did form and propagate because a step segment (named L [ 1 0 1 ] ) with a length of L, ~26 nm, which would propagate along [ 1 0 1 ] direction at exceeding a critical Lc did not reach a critical Lc; the step segment starts to advance when its length L exceeds Lc because, then, the volume-free energy release accompanied by the step movement, i.e., solid formation begins to be larger than the step edge energy created by the creation of the step edges at both ends of the step line. See ref. [29] for a more detailed explanation of this.
In Figure 2b, still, a new spiral did not form and propagate, meaning a step segment, L [ 1 0 1 ] did not reach Lc. However, as seen in Figure 2f, which is a magnified view of a white box in Figure 2b, steps grew along [1 2 0] and [120] a little bit, as shown by a comparison of them with those in Figure 2e; the [1 2 0] and [120] steps in Figure 2f are shown to have moved to the left a little compared to those in Figure 2e due to their growth. At this time, L [ 1 0 1 ] was accordingly also slightly lengthened by the growth of those steps along [1 2 0] and [120]; L [ 1 0 1 ] = ~29 nm in Figure 2f versus ~26 nm in Figure 2e. Then, in an image corrected in 18 s, as seen in Figure 2c, a new spiral was seen to have been generated and grown. This suggests that the step segment with L [ 1 0 1 ] in Figure 2f almost reached Lc. (Note that the captured morphology of the [ 1 0 1 ] step line during the upward scanning in Figure 2c is slanted clockwise, although the true orientation of the [ 1 0 1 ] step line is (almost) vertical, as represented by a schematic located in the left corner of the bottom of the figure. The so-called step orientation distortion in the in situ AFM images recording moving steps occurs with its magnitude proportional to the step-growth speed for a given scan rate because the whole parts of the steps are imaged serially from top to bottom (down scan) or from bottom to top (up scan) at a finite scan rate, rather than imaged at once for AFM [19,32] (especially see Supplementary Material of ref. [19] for detailed explanation)). In Figure 2d, the spiral seen in Figure 2c had grown further, and the [ 1 0 1 ] step line was slanted counter-clockwise because it was captured by the down scan.
As is known now, the process seen in Figure 2a–d is repeated (a generation or one full rotation time (tr) of this spiral shown in the figure was 69 ± 2 s), and this process leads to the formation of the growth hillock seen in Figure 1c.
The results of the generation of the molecular step spiral are schematically summarized in Figure 2g. At Stage 1, a step segment has a length, L [ 1 0 1 ] smaller than Lc. Then, as the [120] and [1 2 0] steps grow, the step segment accordingly lengthens and becomes to have L [ 1 0 1 ] reach Lc (Stage 2). From this time, as seen in Stage 3, the segment starts to advance toward the [ 1 0 1 ] direction, and in the meantime, other steps move along their respective directions to be a new spiral. Although little expressed, [ 1 20] and [ 1 2 0] steps are observed in the spiral [19]. While the new spiral grows, the step segment S connected to the emergence point of the screw dislocation at the crystal surface is turning around the point; thus, its orientation varies while the spiral grows, as is seen by looking at the orientation of segment S at Stage 4 in comparison to it at Stage 3. As the spiral grows further, the turning step segment S becomes one with L [ 1 0 1 ] reaching Lc (Stage 5), completing one full rotation. Then, it starts to advance, and in the meantime, the already-formed spiral continues to grow (Stage 6). Again, although little expressed, the components of the mirror-symmetry related [ 1 20]/[ 1 2 0] steps and [010]/[0 1 0] steps are observed in the spiral (at Stages 5 and 6).
As now understood by the schematic (Figure 2g), one full spiral rotation time, tr, is influenced by the growth rate (VS) of step segments around the emergence point of the screw dislocation, or V of large steps (i.e., L >> Lc), with a relationship of tr  1/V, because VS is proportional to V [29]. Thus, one full spiral rotation time is affected by supersaturation (σ) and temperature, which determines V, like the bulk nucleation process [33]. As previously reported in the calcite system [29], Lc is inversely proportional to σ, and V is proportional to σ at a given temperature, and consequently, this relationship of tr  1/V 1/σ exists.

3.3. Effect of L-Asp6 on the Birth and Growth of the Step Spiral on the ( 1 01) Face

Citrate [11,13,14,18,22] and aspartic acid 6mer (L-Asp6) [17,19] with the functional group of carboxylic acids had the strongest inhibitory effect on the growth of the molecular step spiral on the broadest ( 1 01) face of the COM crystal, as shown in Figure 1a. For example, citrate changed the step spiral resembling a triangle shape into a round disk-shaped one by adsorbing to and roughening the growing steps of the spiral, especially with dropping the fastest growing [ 1 0 1 ] step speed by a factor of 25 at a supersaturation (σ) of 0.7, which led to similar growth speed over all the growth directions of the step spiral. Although those studies well demonstrated the effect of those molecules on the spiral growth in terms of morphological and step speed changes, that is, the inhibition of the step-growth, they lacked in demonstrating in detail how they affect the birth of a new spiral and its subsequent temporal growth compared to those occurring in the pure solution.
Figure 3 shows how the generation of a new step spiral at the dislocation outcrop on the ( 1 01) face and its subsequent temporal growth were affected when the step spirals growing in the pure solution were exposed to the solution containing 2 µM L-Asp6 at σ 0.93.
Figure 3a shows a triangle-resembling topmost molecular step spiral with its [ 1 0 1 ] step growing at a growth rate of 27 nm/s in the pure calcium/oxalate solution at σ = 0.93. (As already explained in dealing with Figure 2, the true orientation of the [ 1 0 1 ] step line is (almost) vertical as expressed in the schematic of Figure 2c, although it appears slanted counter-clockwise.) Figure 3b shows the morphology of the step spirals shown in Figure 3a when they had grown in the supersaturated calcium/oxalate solution (σ 0.93) containing 2 µM L-Asp6 for about 4 min and 30 s; this image of Figure 3b was collected by the down scan with an acquisition time of 18 s; thus, the top and bottom of the image are arbitrarily set to 0 s and 18 s, and subsequent images (Figure 3c–e) have times marked accordingly.
Compared to the step spirals growing in the pure solution at σ = 0.93, the [120] and [1 2 0] step lines became rough, as seen simply by a comparison of the step lines within yellow boxes in Figure 3b with those in Figure 3a, and cusps in the [ 1 0 1 ] step line developed. This suggests that L-Asp6 was bound to the step lines. At this moment, the [ 1 0 1 ] step speed was dramatically decreased to ~0.8 nm/s, indicating that the additive adsorbed to the step line exerted a great effect on inhibiting the step growth. Also, note that unlike the fast-growing [ 1 0 1 ] step appearing slanted, that is, appearing with the step line orientation distorted in the pure supersaturated solution shown in Figure 3a, the step orientations along all the directions in Figure 3b represent almost true ones because the speed of steps was so slow with ~0.8 nm that the orientation distortion in the captured moving steps was minimal.
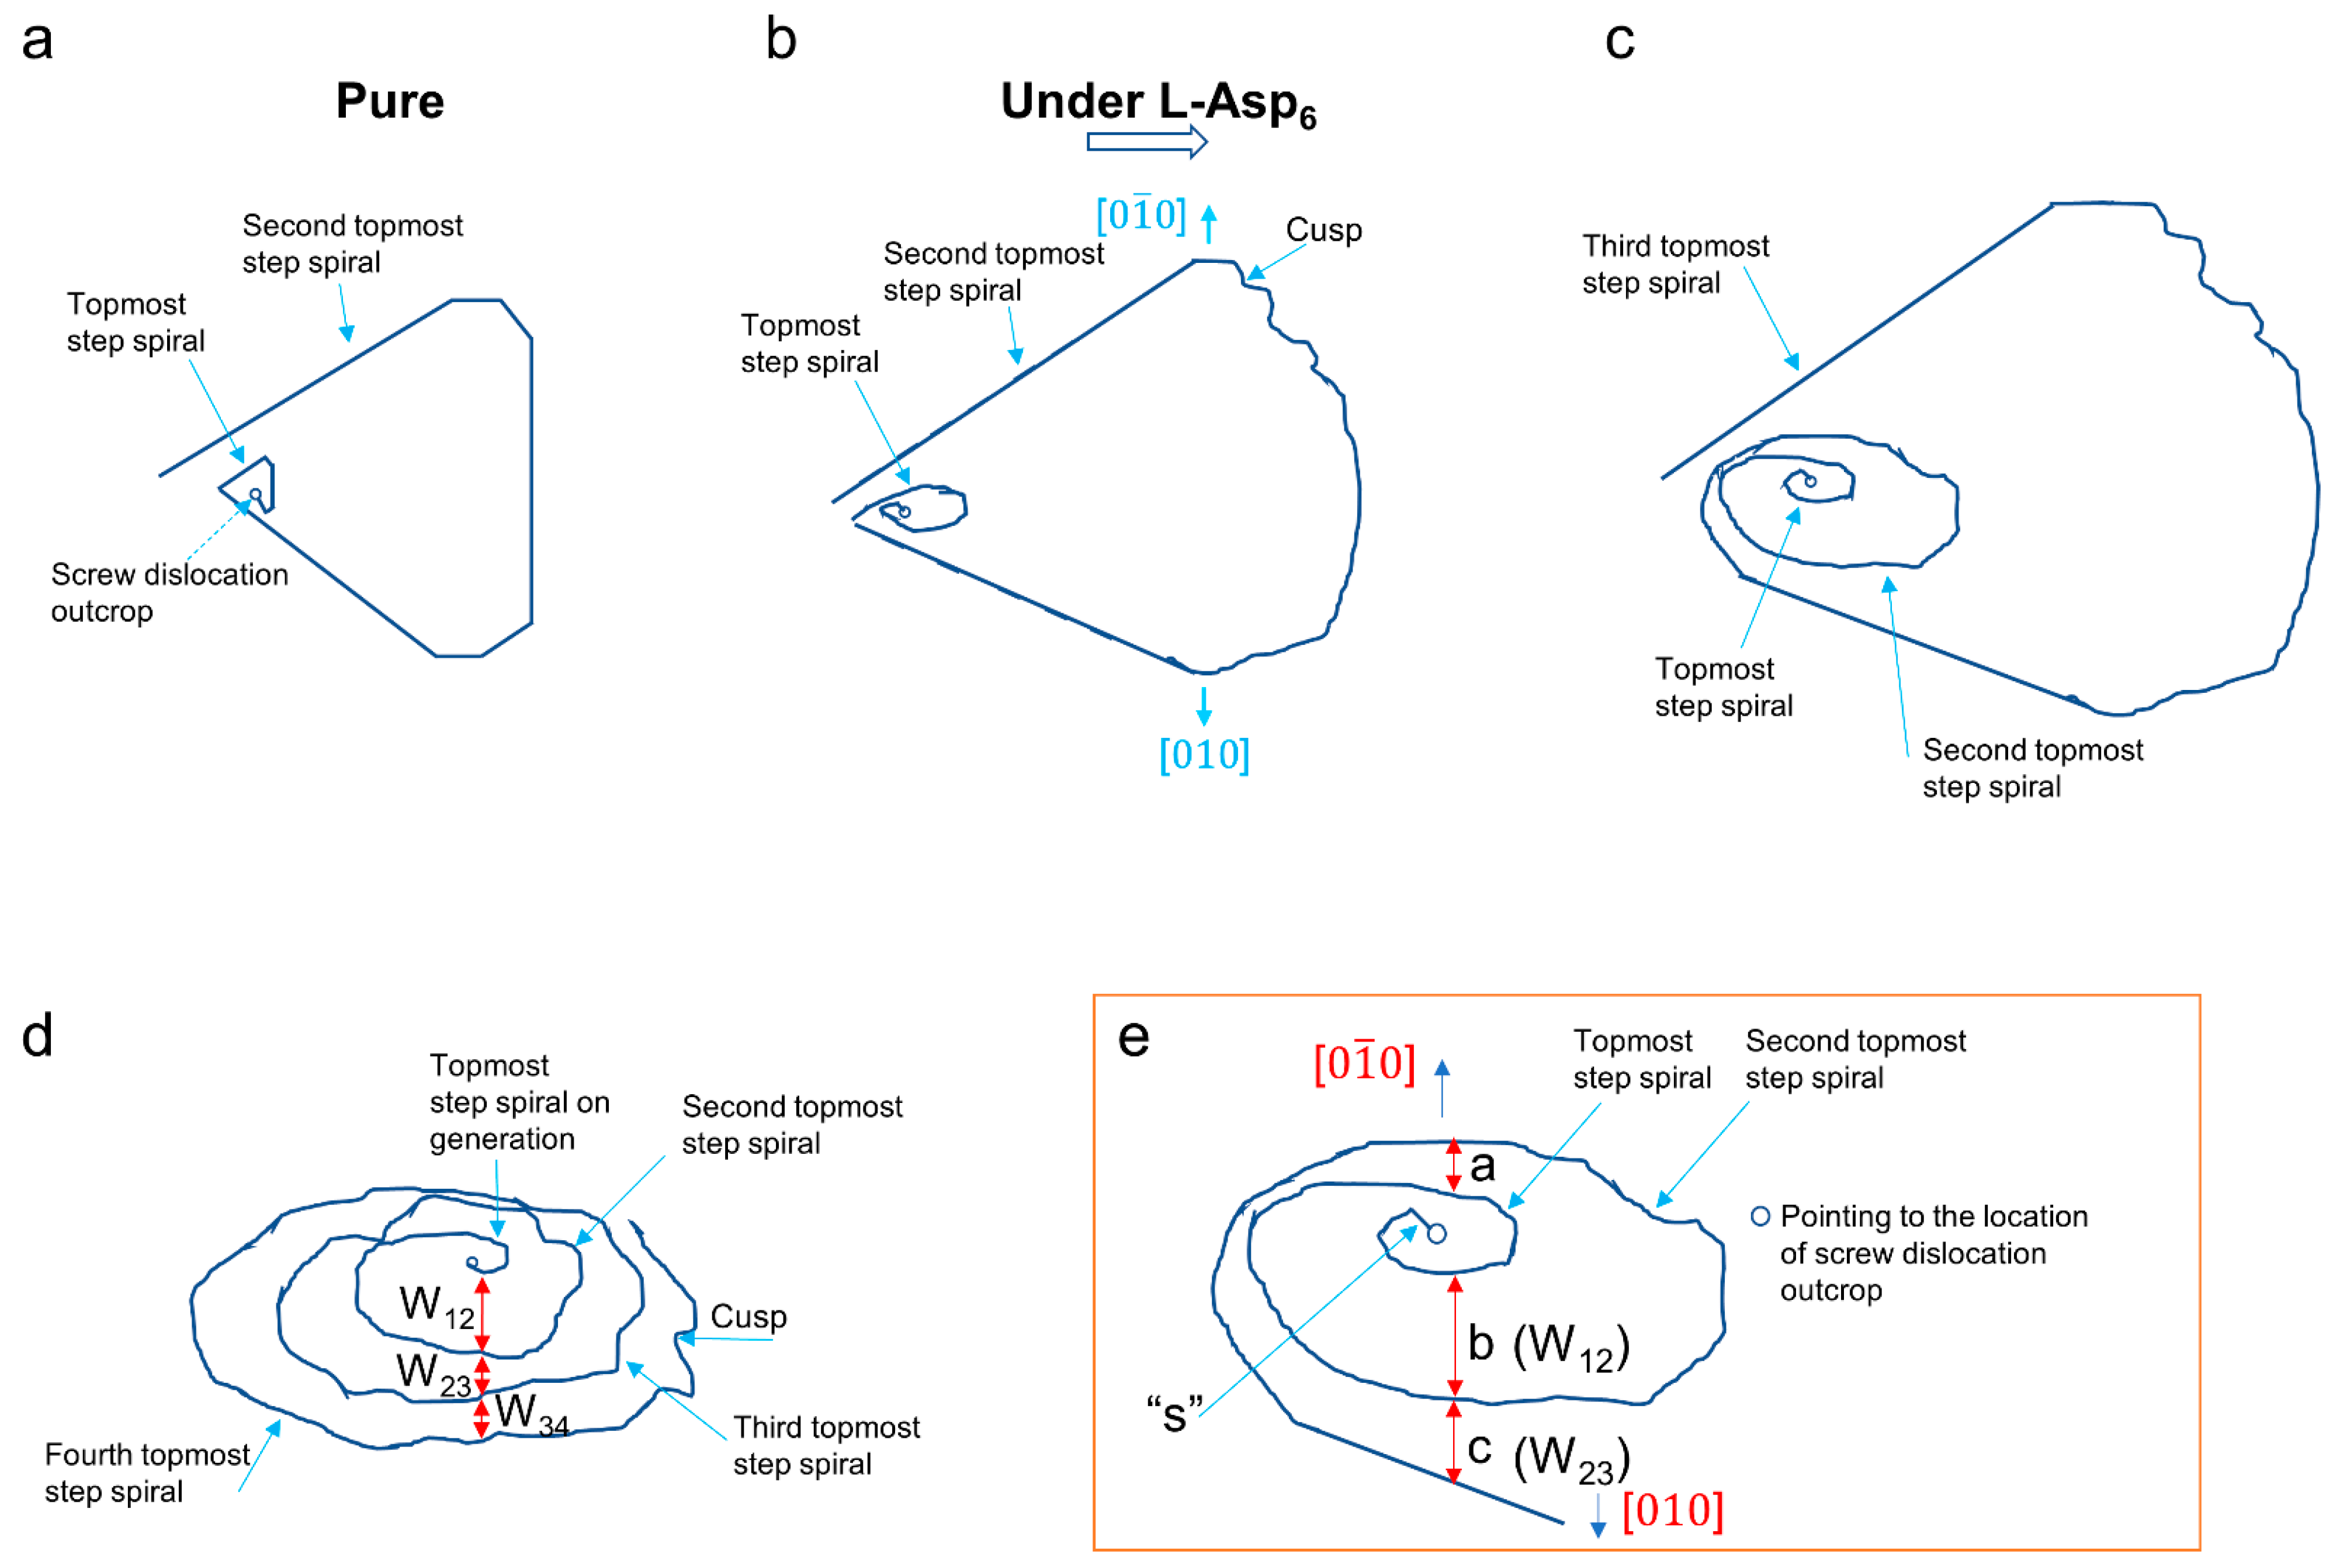
To help explain the effect of L-Asp6 on the birth of a new spiral and temporal growth of the topmost and second topmost spirals, their morphologies are shown in Figure 3b is drawn schematically in Figure 4b, together with those in the pure solution without L-Asp6 such as one expressed in Figure 4a.
Although the cusps developed due to the adsorption of L-Asp6 to the step lines of the second topmost spiral, as seen in Figure 4b, the overall morphology of this second topmost spiral is still similar to the triangle-resembling morphology of the spiral from the pure solution seen in Figure 4a at this moment. This happens because the second topmost spiral resembling triangle morphology was first generated from the pure solution before the introduction of 2 µM L-Asp6-containing solution and got the adsorption of L-Asp6 on the way of its propagation (see Materials and Methods for details on the AFM imaging).
Unlike this morphology of the second topmost spiral, a newly-born topmost spiral does not have a pseudo-triangle shape, which is the morphology achieved when a spiral newly forms in the pure supersaturated solution; rather, it has a morphology similar to the hexagonal bulk crystal. This indicates that the adsorption of L-Asp6 to step segments just emanating from the dislocation outcrop has a dramatic effect on the step growth orientation and, subsequently, the spiral morphology from the time of generation of a new spiral. Since the birth of new step segments with the critical step lengths and the orientation of the segments at the dislocation outcrop are controlled by the step edge free energy rather than the kinetic factor, the adsorption of L-Asp6 to the step segments emanating from the dislocation outcrop is considered to have induced new equilibrium step directions like the case of step spirals of calcite emanating from the dislocation outcrop with adsorption of aspartic acid to them [29].
Figure 3c shows the morphological evolution of molecular steps at the dislocation hillock shown in Figure 3b, captured 367 s later. Again, for an easier explanation of the effect of adsorbed L-Asp6 on the spiral generation and growth for this time interval, the morphologies of the first to third topmost spirals shown in Figure 3c are expressed schematically in Figure 4c, and the morphologies of those first and second topmost spirals in Figure 4c are magnified in Figure 4e. As seen in Figure 4e, the step width (W12) along [0 1 0] direction between the topmost and second topmost spiral (i.e., the distance of “a”: 62 nm for Figure 3c) is smaller than W12 along [010] direction (i.e., the distance of “b”: 112 nm for Figure 3c). Since the step speed (V) is proportional to the distance of the movement for a given time, the [0 1 0] step had about twice smaller V than the [010] step, indicating L-Asp6 had about twice the stronger inhibition effect on the growth of the [0 1 0] over [010] step. This kind of characteristic of chiral aspartic acid 6mers inhibiting one of two symmetrical steps of the COM step spiral preferentially and of aspartic acid doing on calcite, which induced chiral morphology of the step spirals was already reported [16,20,34].
Now let us see the characteristic of the step generation under the adsorbed L-Asp6 further beyond the morphological changes from the pseudo triangle to hexagon-like morphology, compared to the case from the pure solution. For the pure solution (see Figure 3a), once a new step spiral resembling a triangle was generated from the dislocation outcrop in the dislocation hillock, as reported recently by Cho et al. [20], the symmetrical [120] and [1 2 0] steps (<120> steps) of the topmost spiral, such as one indicated by a yellow arrow, which had a wider step width (with respect to the second topmost [120] step) than those already formed <120> steps such as the second topmost <120> step and <120> steps indicated by a circle in the periphery of the hillock, for a brief moment, moved faster than them. As a result, the <120> steps of the newly born topmost spiral caught up with the second topmost <120> step and then moved at the same speed, keeping the same or similar step widths, all together with the <120> steps indicated by a white circle in the periphery afterward; the [120] step of the topmost spiral with the step width (W12) between the topmost and second topmost [120] step of 82.1 ± 6.0 nm grew at 6.7 ± 0.8 nm/s and caught up with the [120] step of the second topmost spiral with a step width (W23) of 38.9 ± 6.0 nm respect to the [120] step of the third topmost spiral (see ref. [20] for details). The strong dependence of V of the topmost <120> step on W until it reached those in the periphery happened because calcium and oxalate ions over the terrace between the topmost and second topmost <120> step were the main supply source, which had a much smaller ion concentration than bulk solution volume facing the terrace, for the growth of the newly born topmost <120> step; in other words, the step grew by the so-called surface diffusion growth mechanism [20,28].
When the topmost spiral in Figure 3b grew for about 367 s, it became the second topmost spiral shown in Figure 3c, and a new spiral, i.e., the topmost spiral, just formed. The spiral generation was greatly delayed with a generation time (tr) of about 7 min at this moment, compared to tr of 69 ± 2 s in the pure solution; later, when exposed to the solution for a longer time, tr was around 13 min. This is natural because a new spiral is generated once a step segment (marked as “S” in Figure 4e) originating from the point of the screw dislocation outcrop at the crystal surface makes one complete turn around the point, and the speed of this movement is in the similar order of the step-growth rate of the topmost spiral in a direction such as [ 1 0 1 ], 0.4 nm/s, given that the ellipse-like hexagonal morphology of the topmost spiral has small anisotropy in the dependence of the growth rate on the step propagation directions. At this moment, b, i.e., W12 along [010], is larger than c, i.e., W23 in Figure 4e.
Figure 3d shows the morphology of the spirals shown in Figure 3c after 36 s. Due to so slow growth rate of the spirals, little morphological changes happened during this interval. Then, after relatively sufficient time passed, several spirals were seen to have developed from the origin of the dislocation outcrop, as seen in Figure 3e, which was collected 659 s after Figure 3d. Several spirals from the screw dislocation outcrop shown in Figure 3e are magnified in Figure 3f. Like before, a schematic (Figure 4d) of the spirals is drawn to explain the character of the step generation under the adsorbed L-Asp6 at this stage effectively. As seen, Figure 4d expresses four spiral turns of Figure 3e from the topmost to the fourth topmost spirals. The step width (W12) between the topmost and second topmost spirals is larger than the subsequent step widths, W23 and W34. That W12 is larger than the subsequent ones is a phenomenon that is also seen in Figure 3c (or Figure 4e). Given that the current topmost and second topmost spirals in Figure 4d become the third and fourth topmost spirals, respectively, when new topmost and second topmost spirals form, this suggests that the step width (W12) decreases while the topmost and second topmost spirals grow. This is achieved because the topmost spiral grows faster than the second topmost spiral when W12 is larger than W23 and then moves at the same or similar speed as the second topmost spiral after reaching the same or similar step width as W23. Thus, this indicates that the steps of the spirals grow predominantly by incorporating calcium and oxalate ions diffusing over the terrace, with the same growth mechanism via surface diffusion-controlled growth as in the pure supersaturated solution [20], while their growth is highly inhibited by L-Asp6 adsorbed to the terraces and steps.
The ellipse-like hexagonal morphology of the step spirals developed under L-Asp6 in Figure 3e (or Figure 3f) parallels the bulk COM crystal morphology produced in the supersaturated solution containing L-Asp6 shown in Figure 1b. This result indicates that the modified morphology of the molecular step spirals on the broadest COM crystal face ( 1 01) is mainly transferred to the bulk crystal morphology, as in the case of COM crystal growth in the solution containing citrate [11,13]. It is natural because the COM crystal grows by the growth of molecular spirals on its faces, and the morphological modification of the broadest face plays the most important role in shaping the bulk crystal morphology.

4. Conclusions

A comprehensive understanding of the molecular step generation from the screw dislocation outcrop on the broadest face ( 1 01) of calcium oxalate monohydrate (COM) crystal, the most common crystalline component of human kidney stones, has been achieved by in situ liquid-phase atomic force microscopy (AFM) investigation. The direct observation of the growing ( 1 01) surface showed that the step segment on the birth from the screw dislocation outcrop started to move after reaching the critical step length (Lc), like many other molecular step spiral growth of minerals in the solution at low to moderate supersaturation. Once this step segment made one complete turn around the point of the screw dislocation outcrop, a new molecular step spiral resembling a triangle was generated and kept this morphology during its growth.
When the ( 1 01) surface was exposed to the supersaturated solution containing a model acidic peptide, L-aspartic acid 6mer (L-Asp6), regulating COM crystal growth, L-Asp6 adsorbed onto the terraces and molecular steps on the surface, resulting in the substantial retardation of the step growth. When the budding step spiral at the dislocation outcrop had adsorption of L-Asp6 to it, it appeared rather with ellipse-like hexagonal morphology, implying changes in step edge energy with respect to orientations. The spiral generation was also greatly delayed because the speed of the step segment turning around the point of the screw dislocation outcrop scaling with the speed of large steps (i.e., L >> Lc) was substantially retarded. The morphological modification of the molecular step spirals on the broadest ( 1 01) face was reflected in the bulk COM crystal morphology. This study demonstrates in situ liquid-phase AFM imaging is an invaluable tool for the study of finding the growth mechanism of minerals at the nanoscale.

Supplementary Materials

The following supporting information can be downloaded at: https://www.mdpi.com/article/10.3390/cryst13060889/s1, Figure S1: AFM height image of Figure 1c. Figure S2: AFM height images of Figure 2a–d. Figure S3: AFM height images of Figure 3.

Funding

This research was supported by Student Employee Graduate Research Fellowship from Lawrence Livermore National Laboratory and by Basic Science Research Program through the National Research Foundation of Korea (NRF) funded by the Ministry of Education (2021R1I1A1A01051035).

Data Availability Statement

Data generated and supporting the findings of this article are available from the corresponding author upon reasonable request.

Acknowledgments

The author is grateful to Dayoung Kwon for the help with SEM imaging, Mee Kyung Song for drawing the L-Asp6 structure, and YoungSeok Son for the help with reference formatting.

Conflicts of Interest

The author declares no conflict of interest.

References

  1. Ryall, R.L. Glycosaminoglycans, proteins, and stone formation: Adult themes and child’s play. Pediatr. Nephrol. 1996, 10, 656–666. [Google Scholar] [CrossRef]
  2. Alelign, T.; Petros, B. Kidney stone disease: An update on current concepts. Adv. Urol. 2018, 2018, 3068365. [Google Scholar] [CrossRef] [PubMed]
  3. Petrovic, A.; Kizivat, T.; Curcic, I.B.; Smolic, R.; Smolic, M. In vitro cell culture models of hyperoxaluric states: Calcium oxalate and renal epithelial cell interactions. Crystals. 2021, 11, 735. [Google Scholar] [CrossRef]
  4. Tian, Y.; Han, G.; Qu, R.; Xiao, C. Major and Trace Elements in Human Kidney Stones: A Preliminary Investigation in Beijing, China. Minerals. 2022, 12, 512. [Google Scholar] [CrossRef]
  5. Kok, D.J.; Papapoulos, S.E.; Bijvoet, O.L.M. Crystal agglomeration is a major element in calcium oxalate urinary stone formation. Kidney Int. 1990, 37, 51–56. [Google Scholar] [CrossRef] [Green Version]
  6. Hallson, P.C.; Rose, G.A.; Sulaiman, S. Magnesium reduces calcium oxalate crystal formation in human whole urine. Clin. Sci. 1982, 62, 17–19. [Google Scholar] [CrossRef] [PubMed] [Green Version]
  7. Farmanesh, S.; Chung, J.; Sosa, R.D.; Kwak, J.H.; Karande, P.; Rimer, J.D. Specificity of growth inhibitors and their cooperative effects in calcium oxalate monohydrate crystallization. J. Am. Chem. Soc. 2014, 136, 367–376. [Google Scholar] [CrossRef] [PubMed]
  8. Taller, A.; Grohe, B.; Rogers, K.A.; Goldberg, H.A.; Hunter, G.K. Specific adsorption of osteopontin and synthetic polypeptides to calcium oxalate monohydrate crystals. Biophys. J. 2007, 93, 1768–1777. [Google Scholar] [CrossRef] [Green Version]
  9. Cook, A.F.; Grover, P.K.; Ryall, R.L. Face-specific binding of prothrombin fragment 1 and human serum albumin to inorganic and urinary calcium oxalate monohydrate crystals. BJU Int. 2009, 103, 826–835. [Google Scholar] [CrossRef] [Green Version]
  10. Guo, S.; Ward, M.D.; Wesson, J.A. Direct visualization of calcium oxalate monohydrate crystallization and dissolution with atomic force microscopy and the role of polymeric additives. Langmuir 2002, 18, 4284–4291. [Google Scholar] [CrossRef]
  11. Qiu, S.R.; Wierzbicki, A.; Orme, C.A.; Cody, A.M.; Hoyer, J.R.; Nancollas, G.H.; Zepeda, S.; De Yoreo, J.J. Molecular modulation of calcium oxalate crystallization by osteopontin and citrate. Proc. Natl. Acad. Sci. USA 2004, 101, 1811–1815. [Google Scholar] [CrossRef] [Green Version]
  12. Jung, T.; Sheng, X.; Choi, C.K.; Kim, W. −S.; Wesson, J.A.; Ward, M.D. Probing crystallization of calcium oxalate monohydrate and the role of macromolecule additives with in situ atomic force microscopy. Langmuir 2004, 20, 8587–8596. [Google Scholar] [CrossRef] [PubMed]
  13. Qiu, S.R.; Wierzbicki, A.; Salter, E.A.; Zepeda, S.; Orme, C.A.; Hoyer, J.R.; Nancollas, G.H.; Cody, A.M.; De Yoreo, J.J. Modulation of calcium oxalate monohydrate crystallization by citrate through selective binding to atomic steps. J. Am. Chem. Soc. 2005, 127, 9036–9044. [Google Scholar] [CrossRef] [Green Version]
  14. Weaver, M.L.; Qiu, S.R.; Hoyer, J.R.; Casey, W.H.; Nancollas, G.H.; De Yoreo, J.J. Inhibition of calcium oxalate monohydrate growth by citrate and the effect of the background electrolyte. J. Cryst. Growth. 2007, 306, 135–145. [Google Scholar] [CrossRef]
  15. Friddle, R.W.; Weaver, M.L.; Qiu, S.R.; Wierzbickid, A.; Casey, W.H.; De Yoreo, J.J. Subnanometer atomic force microscopy of peptide–mineral interactions links clustering and competition to acceleration and catastrophe. Proc. Natl. Acad. Sci. USA 2010, 107, 11–15. [Google Scholar] [CrossRef] [Green Version]
  16. Cho, K.R.; Salter, E.A.; De Yoreo, J.J.; Wierzbicki, A.; Elhadj, S.; Huang, Y.; Qiu, S.R. Impact of chiral molecules on the formation of biominerals: A calcium oxalate monohydrate example. Cryst. Growth Des. 2012, 12, 5939–5947. [Google Scholar] [CrossRef]
  17. Cho, K.R.; Salter, E.A.; De Yoreo, J.J.; Wierzbicki, A.; Elhadj, S.; Huang, Y.; Qiu, S.R. Growth inhibition of calcium oxalate monohydrate crystal by linear aspartic acid enantiomers investigated by in situ atomic force microscopy. CrystEngComm 2013, 15, 54–64. [Google Scholar] [CrossRef]
  18. Chung, J.; Granja, I.; Taylor, M.G.; Mpourmpakis, G.; Asplin, J.R.; Rimer, J.D. Molecular modifiers reveal a mechanism of pathological crystal growth inhibition. Nature 2016, 536, 446–450. [Google Scholar] [CrossRef] [PubMed]
  19. Cho, K.R.; Kulshreshtha, P.; Wu, K.J.J.; Seto, J.; Qiu, S.R.; De Yoreo, J.J. The effects of different types of additives on growth of biomineral phases were investigated by in situ atomic force microscopy. J. Cryst. Growth. 2019, 509, 8–16. [Google Scholar] [CrossRef]
  20. Cho, K.R.; Lee, J.-H.; Seo, H.-S.; Ji, Y.; Park, J.H.; Lee, S.E.; Kim, H.-W.; Wu, K.J.J.; Kulshreshtha, P. Mechanistic pathways for the molecular step growth of calcium oxalate monohydrate crystal revealed by in situ liquid-phase atomic force microscopy. ACS Appl. Mater. Interfaces 2021, 13, 37873–37882. [Google Scholar] [CrossRef]
  21. Kang, X.; Li, S.; Li, M.; Li, J.; Han, D.; Gong, J. Natural inhibitors from earthworms for the crystallization of calcium oxalate monohydrate. CrystEngComm 2022, 24, 5597–5604. [Google Scholar] [CrossRef]
  22. Li, S.; Tang, W.; Li, M.; Wang, L.; Yang, Y.; Gong, J. Understanding the role of citric acid on the crystallization pathways of calcium oxalate hydrates. Cryst. Growth Des. 2019, 19, 3139–3147. [Google Scholar] [CrossRef]
  23. Shiraga, H.; Min, W.; VanDusen, W.J.; Clayman, M.D.; Miner, D.; Terrell, C.H.; Sherbotie, J.R.; Foreman, J.W.; Przysiecki, C.; Neilson, E.G.; et al. Inhibition of calcium oxalate crystal growth in vitro by uropontin: Another member of the aspartic acid-rich protein superfamily. Proc. Natl. Acad. Sci. USA 1992, 89, 426–430. [Google Scholar] [CrossRef] [PubMed] [Green Version]
  24. Cody, A.M.; Horner, H.T.; Cody, R.D. SEM study of the fine surface features of synthetic calcium oxalate monohydrate crystals. Scanning Electron Microsc. 1982, 1, 185–197. [Google Scholar]
  25. Gustaffson, J.P. Visual MINTEQ version 2.30; Department of Land and Water Resources Engineering: Stockholm, Sweden, 2004. [Google Scholar]
  26. Deganello, S.; Piro, O.E. The crystal structure of calcium oxalate monohydrate (whewellite). N. Jb. Miner. Mh. 1981, H2, 81–88. [Google Scholar]
  27. Frank, F.C. The influence of dislocations on crystal growth. Disc. Faraday Soc. 1949, 5, 48–54. [Google Scholar] [CrossRef]
  28. Gratz, A.J.; Hillner, P.E.; Hansma, P.K. Step dynamics and spiral growth on calcite. Geochim. Cosmochim. Acta. 1993, 57, 491–495. [Google Scholar] [CrossRef]
  29. Teng, H.H.; Dove, P.M.; Orme, C.A.; De Yoreo, J.J. Thermodynamics of calcite growth: Baseline for understanding biomineral formation. Science 1998, 282, 724–727. [Google Scholar] [CrossRef]
  30. Cho, K.R.; Kim, Y.-Y.; Yang, P.; Cai, W.; Pan, H.; Kulak, A.N.; Lau, J.L.; Kulshreshtha, P.; Armes, S.P.; Meldrum, F.C.; et al. Direct observation of mineral-organic composite formation reveals occlusion mechanism. Nat. Commun. 2016, 7, 10187. [Google Scholar]
  31. Tang, R.; Darragh, M.; Orme, C.A.; Guan, X.; Hoyer, J.R.; Nancollas, G.H. Control of biomineralization dynamics by interfacial energies. Angew. Chem. Int. Ed. 2005, 44, 3698–3702. [Google Scholar] [CrossRef]
  32. Land, T.A.; De Yoreo, J.J.; Lee, J.D. An in-situ AFM investigation of canavalin crystallization kinetics. Surf. Sci. 1997, 384, 136–155. [Google Scholar] [CrossRef]
  33. Lancia, A.; Musmarra, D.; Prisciandaro, M. Measuring induction period for calcium sulfate dihydrate precipitation. AIChE J. 1999, 45, 390–397. [Google Scholar] [CrossRef]
  34. Orme, C.A.; Noy, A.; Wierzbicki, A.; McBride, M.T.; Grantham, M.; Teng, H.H.; Dove, P.M.; De Yoreo, J.J. Formation of chiral morphologies through selective binding of amino acids to calcite surface steps. Nature 2001, 411, 775–779. [Google Scholar] [CrossRef] [PubMed]
Figure 1. Morphology of calcium oxalate monohydrate (COM; CaC2O4·H2O) crystals and of growth hillocks on the ( 1 01) face. (a,b) SEM images of COM crystals synthesized in (a) a pure calcium/oxalate solution (0.7 mM CaCl2, 0.7 mM K2C2O4, 46.6 mM KCl) and (b) a solution of the same condition as in (a), but containing 20 μM L-aspartic acid 6mer (L-Asp6). (c) AFM deflection image of growth hillocks composed of molecular steps, one of which is indicated by a dashed white arrow on the ( 1 01) face (see Figure S1 for the height image of (c)). The color bar shows the data contrast scale.
Crystals 13 00889 g001
Figure 2. Molecular step spiral generation from a screw dislocation outcrop on the COM ( 1 01) surface captured by in situ liquid-phase AFM. (ad) Consecutive in situ liquid-phase AFM deflection images showing the molecular step spiral generation and subsequent growth in the pure calcium/oxalate solution at a supersaturation of 0.93. The times (t) at which the bottom and top of the images were collected are marked in the lower and upper corners of the images, respectively, where the bottom of (a) is arbitrarily set to 0 s. See Figure S2 for the height images of (ad). (e,f) Magnified view of areas within white boxes in (a,b). (g) Schematic explaining the mechanism of a molecular step spiral generation on the COM ( 1 01) surface. The color bar shows the data contrast scale.
Crystals 13 00889 g002
Figure 3. Molecular step spiral generation and evolution from a screw dislocation outcrop on the COM ( 1 01) surface in the solution with L-Asp6 captured by in situ liquid-phase AFM. (a) Control. (be) Molecular step spiral generation and subsequent growth when the hillock in (a) was exposed to calcium/oxalate solution containing 2 µM L-Asp6 at σ 0.93. The time sequence is marked in the upper and lower right corners of images, starting from (b). (f) Magnified view of an area within a dashed box in (e). All images are AFM deflection images, and their height images are displayed in Figure S3. The color bar shows the data contrast scale.
Crystals 13 00889 g003
Figure 4. Schematic explaining the effect of L-Asp6 on the birth of the molecular step spiral and its subsequent temporal growth. (a) Step spirals growing in the pure solution. (b,c) Morphologies of the few topmost spirals shown in Figure 3b,c. A newly born topmost spiral in the presence of L-Asp6 in (b) has a morphology similar to the hexagonal bulk crystal. (d) Morphology of a few topmost spirals in Figure 3e. They have an ellipse-like hexagonal morphology. (e) Magnified view of spirals around the dislocation outcrop shown in (c).
Crystals 13 00889 g004
Disclaimer/Publisher’s Note: The statements, opinions and data contained in all publications are solely those of the individual author(s) and contributor(s) and not of MDPI and/or the editor(s). MDPI and/or the editor(s) disclaim responsibility for any injury to people or property resulting from any ideas, methods, instructions or products referred to in the content.

