Article

Oxidation and Electrical Property Studies on Ferritic Steels as Potential Interconnects in Electrochemical Devices for Energy Conversion

Faculty of Materials Science and Ceramics, AGH University of Krakow, Al. Mickiewicza 30, 30-059 Krakow, Poland
*
Author to whom correspondence should be addressed.
Crystals 2023, 13(6), 862; https://doi.org/10.3390/cryst13060862
Submission received: 24 April 2023 / Revised: 18 May 2023 / Accepted: 19 May 2023 / Published: 24 May 2023
(This article belongs to the Special Issue Hot Corrosion and Oxidation of Alloys)

Abstract

:
This work presents the results of oxidation studies on commercially available Nirosta 4016/1.4016 ferritic steel, which contains 16.3 wt.% chromium, as well as the electrical properties of steel/scale layer systems in order to determine the usefulness of this steel for constructing metallic interconnects in solid oxide fuel cell (SOFC) and solid oxide electrolyzer cell (SOEC) stacks. The E-Brite ferritic steel, consisting of up to 26 wt.% chromium, was chosen as a reference material. High-temperature isothermal oxidation kinetics studies were carried out on both steels at 1073 K for 255, 505, 760 and 1010 h in air atmosphere. These conditions are representative of those present in the cathode compartment of a SOFC and the anode compartment of a SOEC. Area specific resistance (ASR) measurements were performed on steel/scale layer systems, obtained after the previous oxidation of both steels in the above-mentioned conditions, in the air in the temperature range of 573–1073 K using the pseudo-DC four-probe method. On the basis of these studies, complemented by morphology observations, as well as chemical and phase composition analysis of the oxidation products, the usefulness of Nirosta 4016/1.4016 ferritic steel for manufacturing interconnects in energy conversion electrochemical devices operating at 1073 K was confirmed.

1. Introduction

Increasing interest in the development of novel technologies for the application of renewable energy sources, such as wind, water and solar energy, has been observed for several decades. Taking into account unstable atmospheric conditions, there is a serious problem concerning the non-uniform distribution of electrical energy produced from renewable sources. Therefore, it is necessary to develop new electrochemical devices that guarantee, on one hand, electrical energy production and on the other hand, storage of excess content. In this aspect, the most perspective technologies seem to be solid oxide fuel cells (SOFCs) and solid oxide electrolyzer cells (SOECs) [1,2]. In the former, direct chemical to electrical energy conversion takes place using fuel in the form of, e.g., hydrogen as the energy source and the only product of the controlled reaction between hydrogen and oxygen is environmentally safe water vapour. Conversely, in the second device, due to the electrolysis phenomenon, excess electricity transforms into fuel. One of the carriers of renewable energy can be so-called “green hydrogen”, i.e., hydrogen produced in an electrolysis process powered by energy originating from renewable energy sources. Energy conversion in SOFCs and SOECs proceeds with high energy efficiency, above 70%, and only has a slight negative impact on the environment. Another attribute of these electrochemical devices is their ability to also use synthetic or natural fuels, resulting in the emission of non-toxic exhaust. A SOEC is basically an inversely functioning SOFC and the same materials are used for the construction of both devices.
A mutual element of SOFC and SOEC (SOFC/SOEC) stacks is the interconnect, also called a bipolar plate. This element enables the perpendicular connection of individual fuel/electrolytic cells in a stack. Furthermore, it provides rigidity to the entire construction and the canals located on both sides of each interconnect to allow for the gaseous reactants to be transported to the electrodes [3,4,5].
Interconnects designed for use in the construction of SOFC/SOEC stacks, designated for operation at temperatures up to 800 °C, are usually created from ferritic stainless steels, because those steels (e.g., Crofer 22APU grade steel) exhibit a thermal expansion coefficient (11.8 × 10⁻⁶ K−1) similar to that of the ceramic SOFC/SOEC elements, i.e., the anode (e.g., YSZ-Ni—11.9 × 10⁻⁶ K−1), cathode (e.g., LSM—12.2 × 10⁻⁶ K−1) and electrolyte (YSZ—10.5 × 10⁻⁶ K−1). The downside of steel interconnects is their susceptibility to corrosion in reactive gas conditions. A protective Cr2O3 scale grows on the surface of ferritic steels, the thickness of which gradually increases along with the operating time of a given cell [3,4,5,6,7,8]. This phenomenon leads to a continuous increase in the area specific resistance (ASR) of the interconnect. After SOFC/SOEC devices work for a long period of time, the electrical resistance becomes too high, significantly limiting the electrical current flow at the electrode/interconnect interface, which is equivalent to a decrease in power for the entire SOFC/SOEC stack. Another undesired phenomenon associated with Cr2O3 scale formation is its tendency to react with oxygen and water vapour, resulting in volatile chromium oxides and oxyhydroxides. These compounds can subsequently react with the anode and cathode materials, thereby degrading their catalytic properties [9,10]. A decrease in SOFC/SOEC stack power as a consequence of changes in the electrode material phase composition has been named in the literature on the subject of the “electrode poisoning” effect.
Significant advances in developing new ferritic steels for application as interconnects in SOFCs and SOECs designated for operation at 800 °C took place due to the creation of a steel with the trade name Crofer 22 APU, produced by German alloy material company Thyssen Krupp VDM. The studies of Quadakkers et al. [11], the originators of this steel, demonstrated that a two-layer scale grows on steel containing up to 23 wt.% chromium and minor amounts of La, Mn and Ti. Around 0.08 wt.% lanthanum addition significantly improves the oxidation resistance of this steel. On the other hand, the presence of manganese and titanium in amounts equal to 0.5 and 0.07 wt.%, respectively, leads to the growth of an external MnCr2O4 manganese-chromium spinel layer on the scale mainly built of Cr2O3. The spinel layer limits the creation of volatile chromium oxides and oxyhydroxides. Additionally, during the process of internal titanium oxidation, precipitates form in the metallic phase, the presence of which increases scale adherence to the substrate as a result of the TiO2 phase mechanically “binding” it with the metallic core. Thus, the scale demonstrates greater resistance against thermal and mechanical shocks, consequently enabling it to provide better protective properties. The electrical resistance of Crofer 22 APU steel designed in this manner remains at a low level of 0.01 Ω·cm2 for about 580 h of oxidation in atmospheres containing both air, as well as a mixture of hydrogen and water vapour [3]. Performance tests carried out on cell stacks with an interconnect built of Crofer 22 APU steel demonstrated a 1% decrease in electrical resistance after 1000 h of cell operation, thereby confirming its usefulness for constructing bipolar plates in SOFCs [12].
In the coming years, more widespread commercialization of the discussed electrochemical devices will be limited due to the high costs of Crofer 22 APU grade steel in global markets. The production costs of this steel exceed the price of the remaining elements constituting SOFCs and SOECs, i.e., the electrolyte and electrodes, many times over. A solution to this problem is to replace currently used Crofer 22 APU steel with less expensive substitutes in the form of commercially available ferritic steels. In this respect, the application of low-chromium ferritic steel, with chromium concentration slightly above 16 wt.%, is taken into account.
A fundamental problem with constructing SOFC/SOEC stacks using a steel interconnect is selecting the appropriate type of ferritic steel. On the basis of several high-temperature oxidation kinetics and mechanism investigations performed on different ferritic steels, it has been determined that the chromium content in the steel should be between 16 and 30 wt.% in order to ensure the growth of a continuous Cr2O3 protective layer on its surface. Conversely, the acceptable level of aluminium should not exceed 3 wt.%, because otherwise, a continuous Al2O3 layer will form on the surface of the “alumina former” steel, the electrical conductivity of which is around six orders of magnitude lower than that of Cr2O3 at 800 °C [13]. The same takes place in the case of silicon addition to ferritic steel [13]. In spite of the much better protective properties provided by Al2O3 and SiO2 scales, their insufficient electrical conductivity excludes this group of steels from potential interconnect materials.
The inadequate level of knowledge pertaining to the practical use of commercially available low-chromium (around 16 wt.%) ferritic steels for SOFC/SOEC interconnect design makes it necessary to carry out further studies on their oxidation resistance and ability to conduct an electrical current.
Therefore, it appears advisable to investigate the oxidation kinetics of commercially available Nirosta 4016/1.4016 grade ferritic steel, containing 16.3 wt.% chromium, in isothermal conditions and perform electrical resistance measurements on the resulting steel/scale layer system. E-Brite steel, containing up to 26 wt.% chromium, was chosen as a reference material, as its cost is comparable to that of the above-mentioned low-chromium steel. This work concentrates on high-temperature oxidation studies carried out in air atmosphere, i.e., in conditions that simulate SOFC operation in the cathode compartment and SOEC operation in the anode compartment.

2. Materials and Methods

2.1. Material Preparation

Two commercially available stainless ferritic steels were selected for studies. The first is a low-chromium grade steel called Nirosta 4016/1.4016 (Krupp Thyssen Nirosta, Düsseldorf, Germany). The second is a high-chromium reference steel named E-Brite (Allegheny Technologies Incorporated, Dallas, TX, USA). The chemical compositions of both previously mentioned steels are provided in Table 1.
The chromium content in the Nirosta 4016/1.4016 steel is slightly above 16%, whereas the E-Brite steel contains 26%. At such Cr concentrations a scale mainly consisting of Cr2O3 will form on both steels and the transport processes that occur inside this oxide will determine the oxidation rate of each material at high temperatures. The manganese concentration in the first steel is significant and will undoubtedly influence the thickness of the manganese-chromium spinel layer that grows on the chromium (III) oxide surface. On the other hand, the concentration of this element is very minor in the second steel (0.05 wt.%). Furthermore, the E-Brite steel additionally contains molybdenum.
In order to perform oxidation experiments on the steels, rectangular samples cut from plates with 10 × 20 × 0.1 cm dimensions were used. The sample surfaces were ground on SiC sandpaper with gradations ranging from 100 to 1500 and then polished to mirror finish in an aqueous Al2O3 slurry (Struers, Copenhagen, Denmark) with 1 µm gradation. Afterwards, the sample surfaces were washed in water containing a detergent and degreased in acetone with the help of an ultrasonic cleaner.

2.2. Oxidation Kinetics Measurements

The oxidation process was carried out at 800 °C in a horizontal tube furnace, into which a quartz boat was inserted along with samples of two grades of steel—Nirosta 4016/1.4016 and E-Brite—located in alumina crucibles.
The samples were subjected to oxidation under isothermal conditions in a laboratory air atmosphere at 800 °C for 255, 505, 760 and 1010 h. Oxidation kinetics measurements were performed using the gravimetric method, which consisted of identifying sample mass gains after a given oxidation process was completed.
In order to determine the mass changes of the studied steels during oxidation, samples were removed from the furnace after specific oxidation durations and then, after cooling to room temperature, were weighed with 1.0 × 10⁻⁵ g precision using an analytical scale (Radwag XA 210 model from RADWAG company, Radom, Poland).

2.3. Equipment for Electrical Resistance Measurements

Electrical resistance measurements were performed on the ferritic steels by means of a pseudo-DC four-probe method using a system with an external current source. A schematic diagram of the measuring system is illustrated in Figure 1.
Steel/scale layer systems samples were chosen for these measurements after previous oxidation of both grades of steel at 800 °C for 255, 505, 760 and 1010 h in air. The electrical resistance of samples was measured as a function of temperature in the range of 323 to 800 °C in laboratory air conditions while applying a 300 mA current.
The samples were heated to 800 °C, then after cooling to the desired temperatures differing from one another by 50 °C, they were maintained in those conditions for 20 min. This allowed for the reading from the multimeter to stabilize as a consequence of obtaining thermodynamic equilibrium, resulting in constant values of measured electrical resistance within a margin of error. The measurements were performed until 323 °C temperature was achieved.
The measurement equipment consisted of two main parts: the measuring probe and the electrical system (power adapter, digital millivoltmeter HP 34401A, multiplexer MUX 8-2/B—a switching system with 8 inputs and 2 information outputs). The probe of the measuring system was located in a CARBOLITE furnace.
In order to perform electrical resistance measurements on the samples in the form of steel/scale layer systems studied in this work, the platinum electrodes were deposited on each side of their surface. While using the platinum paste, probes in the form of rings 5 mm in diameter were applied to the samples. For this purpose, the hand screen printing method was used. Thermal treatment of the deposited pastes after initial drying at 80 °C for 1 h was performed at 750 °C for 5 min. The thickness of the conductive layer is around 10 μm.
A given sample with electrodes deposited on its surface was placed between flat platinum electrodes and voltage decrease was measured under a 300 mA steady current (and polarity reversal) with the help of a power adapter. After factoring in the platinum electrode surfaces (0.5 cm diameter), the electrical current value becomes 1.5 A/cm2. Voltage decrease in a sample was measured using a digital millivoltmeter with 0.3% accuracy.
Assuming the sample-electrode junctions are ohmic, sample resistance was calculated as follows:
R = U dc I test I dc
where: Udc—voltage measured by the digital millivoltmeter (V), Itest—measurement current set using the fixed resistor Rn (A) and Idc—current flowing through the millivoltmeter (A).
The electrical resistance of an oxidized sample is usually measured in terms of its area specific resistance, which is defined as the product of resistance and the nominal contact surface area between the oxide and the steel. Due to the symmetrical design of the sample, the area specific resistance of the samples was calculated based on the obtained resistance values using the following formula:
ASR = R   ·   P 2
where: R—electrical resistance of the steel/scale system (Ω) and P—surface area of the Pt layer (cm2). The surface area is additionally divided by two because the platinum paste was deposited on both sides of each sample.

2.4. Phase and Chemical Composition Studies and Morphological Observations

Crystalline structure studies were carried out via the X-ray diffraction (XRD) method. For this purpose, a PANalytical X’Pert Pro PW 3710 X’Celerator diffractometer was used to apply monochromatic radiation CuKα under 50 kV voltage and a 30 mA anode current. Phase composition identification was performed with the help of the computer program “High ScorePlus”, which cooperates with the diffractometer software using the Inorganic Crystal Structure Database. Rietveld refinement was used to determine the mass fractions of the corrosion products.
Morphological studies on the materials along with chemical composition analysis on selected areas of the researched samples were carried out via scanning electron microscopy (SEM) accompanied by X-ray microanalysis (EDS) using a FEI Nova NanoSEM 200 electron microscope (FEJ Europe Company, Hillsboro, OR, USA), equipped with a Genesis Spectrum system for performing energy dispersive X-ray spectroscopy (EDAX).

3. Results and Discussion

3.1. Ferritic Steel Oxidation Kinetics

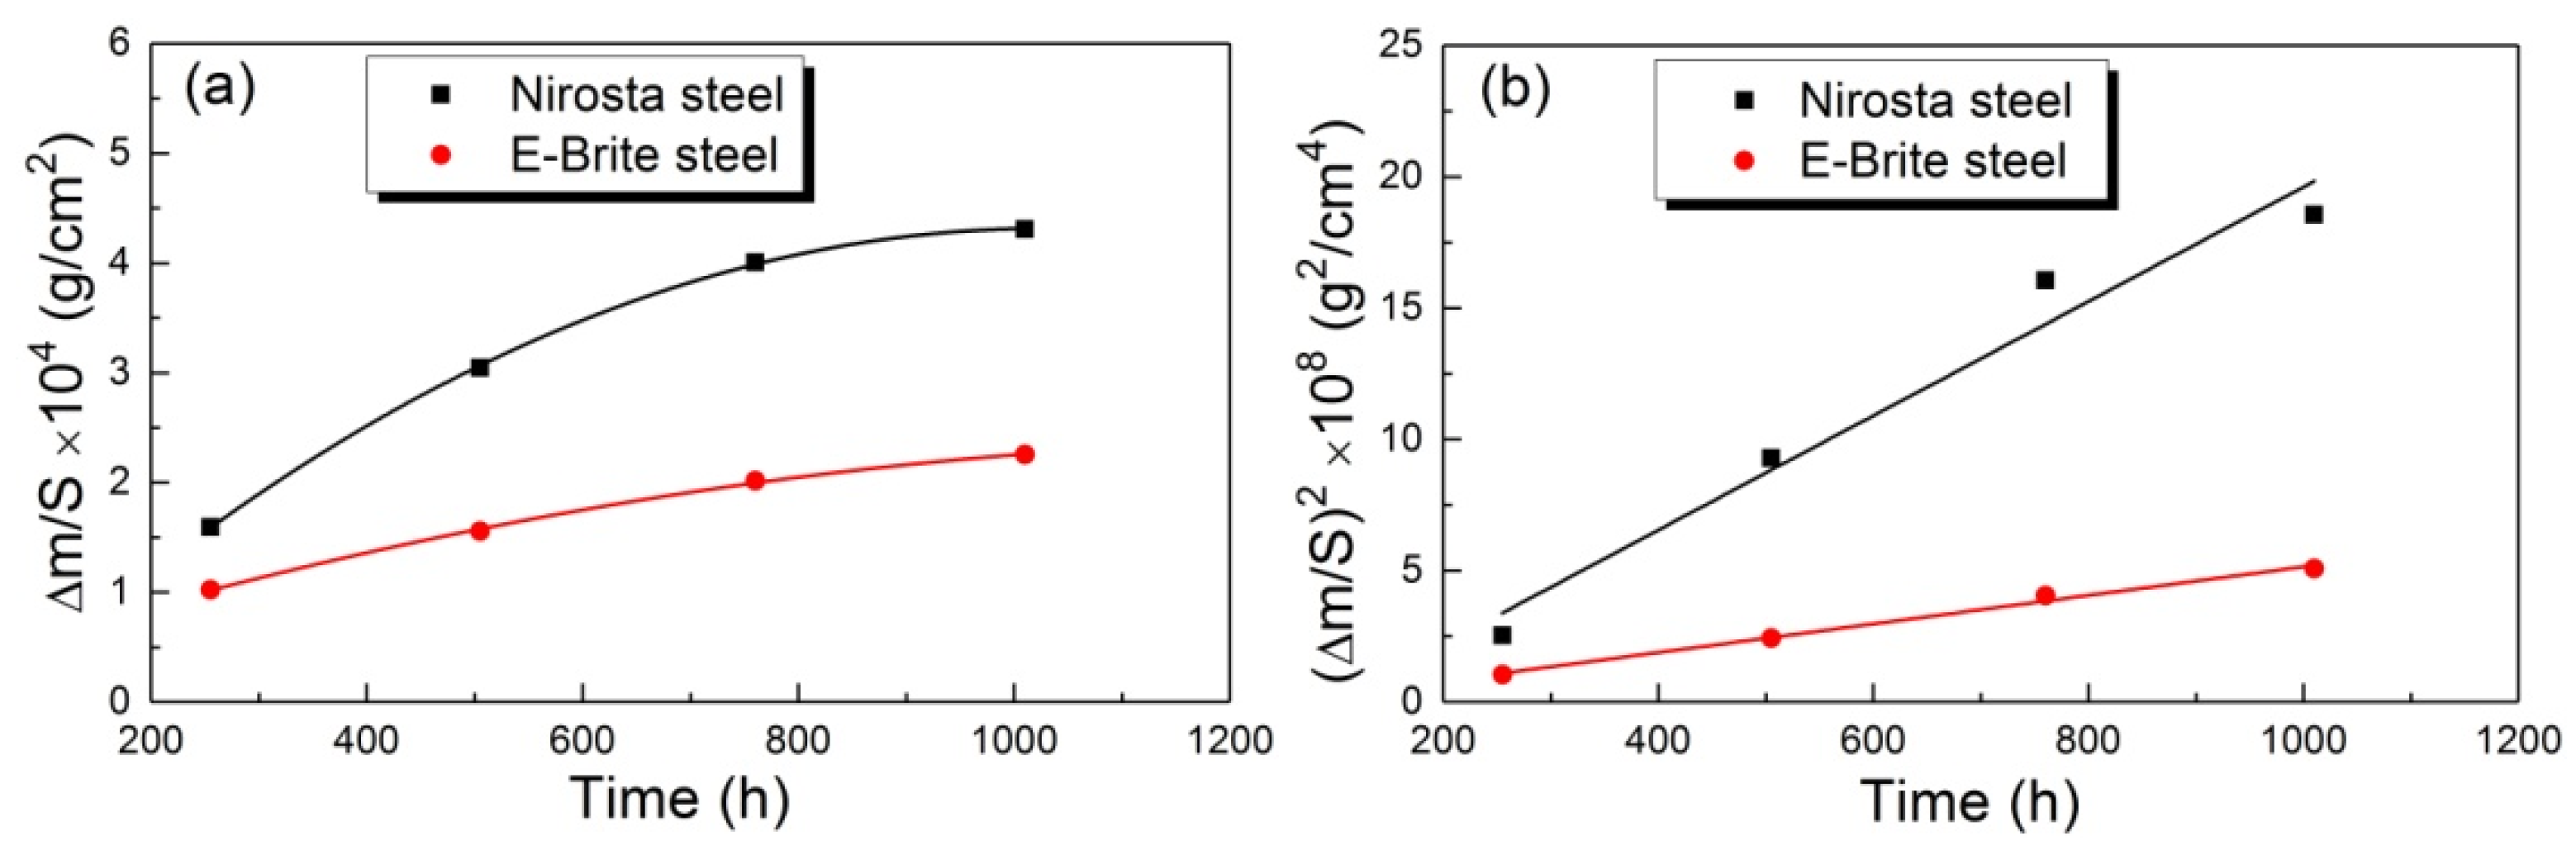
Oxidation kinetics studies of two grades of ferritic steel: Nirosta 4016/1.4016 and E-Brite were performed at 800 °C for 255, 505, 760 and 1010 h in laboratory air. The oxidation kinetics measurements were carried out on the samples by means of the gravimetric method, which consists of determining sample mass increases per unit area after completing a given oxidation process.
Figure 2 presents the oxidation kinetics of the studied ferritic steels in a linear (Figure 2a) and parabolic (Figure 2b) system of coordinates.
It should be noted that the illustrated curves do not take into account corrections associated with the formation of volatile chromium compounds. As a rule, the relative error does not take this effect under consideration for durations shorter than 1200 h and is below 3% [14].
From the plots presented in Figure 2 it follows that the oxidation kinetics of the studied steels can be described with good approximation by the parabolic rate law in the form of the Pilling–Bedworth correlation [15]:
Δ m A 2 = k p t + C
where: Δm—sample mass increase (g), A—sample surface (cm2) and kp—parabolic rate constant (g2·cm−4·s−1).
This means that the slowest partial process that determines the corrosion rate is the diffusion of the reactants in the oxidation product.
Taking into account the presence of several alloy additives in the studied ferritic steels (Table 1), their oxidation can lead to the formation of a multiphase scale on their surface, which is usually a mixture of compounds due to certain alloy components reacting with the oxidant. Assuming that the growth of such a scale on the metallic substrate approximately proceeds according to the parabolic rate law, kp in Equation (3) can be replaced by the so-called “effective parabolic rate constant” of oxidation expressed as kp,ef [16].
Calculating the effective parabolic oxidation rate constant can be helpful when determining the approximate thickness of scales mainly built of Cr2O3, which usually grow on the surface of studied ferritic steels during their long-term oxidation in SOFC and SOEC operating conditions. For this purpose, the following Wagner correlation should be used [16]:
x z 2 = 2 k p , ef t
where: kp,ef—“effective parabolic rate constant” of the oxidation process [16], while simultaneously using the following correlation between Cr2O3 scale thickness (xz) and sample mass change (Δm) determined from thermogravimetric measurements:
Δ m = x z A ρ Cr 2 O 3 3 / 2 M O 2 M Cr 2 O 3
where: ρCr2O3—Cr2O3 density (g/cm3), MCr2O3—molecular weight of the Cr2O3 scale (g/mol), MO2—molecular weight of oxygen (g/mol) and A—sample surface (cm2).
For the purpose of calculations, chromium oxide density was assumed as 5.225 g/cm3 [17]. Furthermore, it was assumed that the scale mainly consists of Cr2O3, which in reality is in accordance with the X-ray diffraction results presented in Section 3.2. The results of these calculations along with the average scale thicknesses estimated from metallographic cross-sections (Section 3.3) on the basis of morphological SEM observations are compiled in Table 2.
From these data, it can be concluded that the thicknesses of the scales grown on the surfaces of Nirosta 4016/1.4016 and E-Brite grade ferritic steels, estimated on the basis of morphological observations remained in approximate agreement with the scale thicknesses determined from gravimetric measurements. The greatest relative error is 17%.
Table 3 lists the parabolic oxidation rate constants of Nirosta 4016/1.4016 and E-Brite ferritic steels determined using the graphic method based on the Pilling–Bedworth equation (Equation (3)) and the Wagner equation (Equation (4)), kp and kp,ef, respectively.
From the data in Table 3 and Figure 2, it follows that the parabolic oxidation rate constant of Nirosta 4016/1.4016 steel is more than half an order of magnitude greater than the corrosion rate constant of E-Brite steel. This means that the E-Brite steel exhibits greater resistance against oxygen corrosion compared to the Nirosta steel. It should also be highlighted that the parabolic rate constants of the ferritic steels studied in this work are in the range of kp values obtained in kinetics studies of “chromia former” type steels and alloys, which are used for the construction of metallic interconnects for SOFCs and SOECs [6,13].

3.2. Phase Composition Studies of the Ferritic Steel Oxidation Products
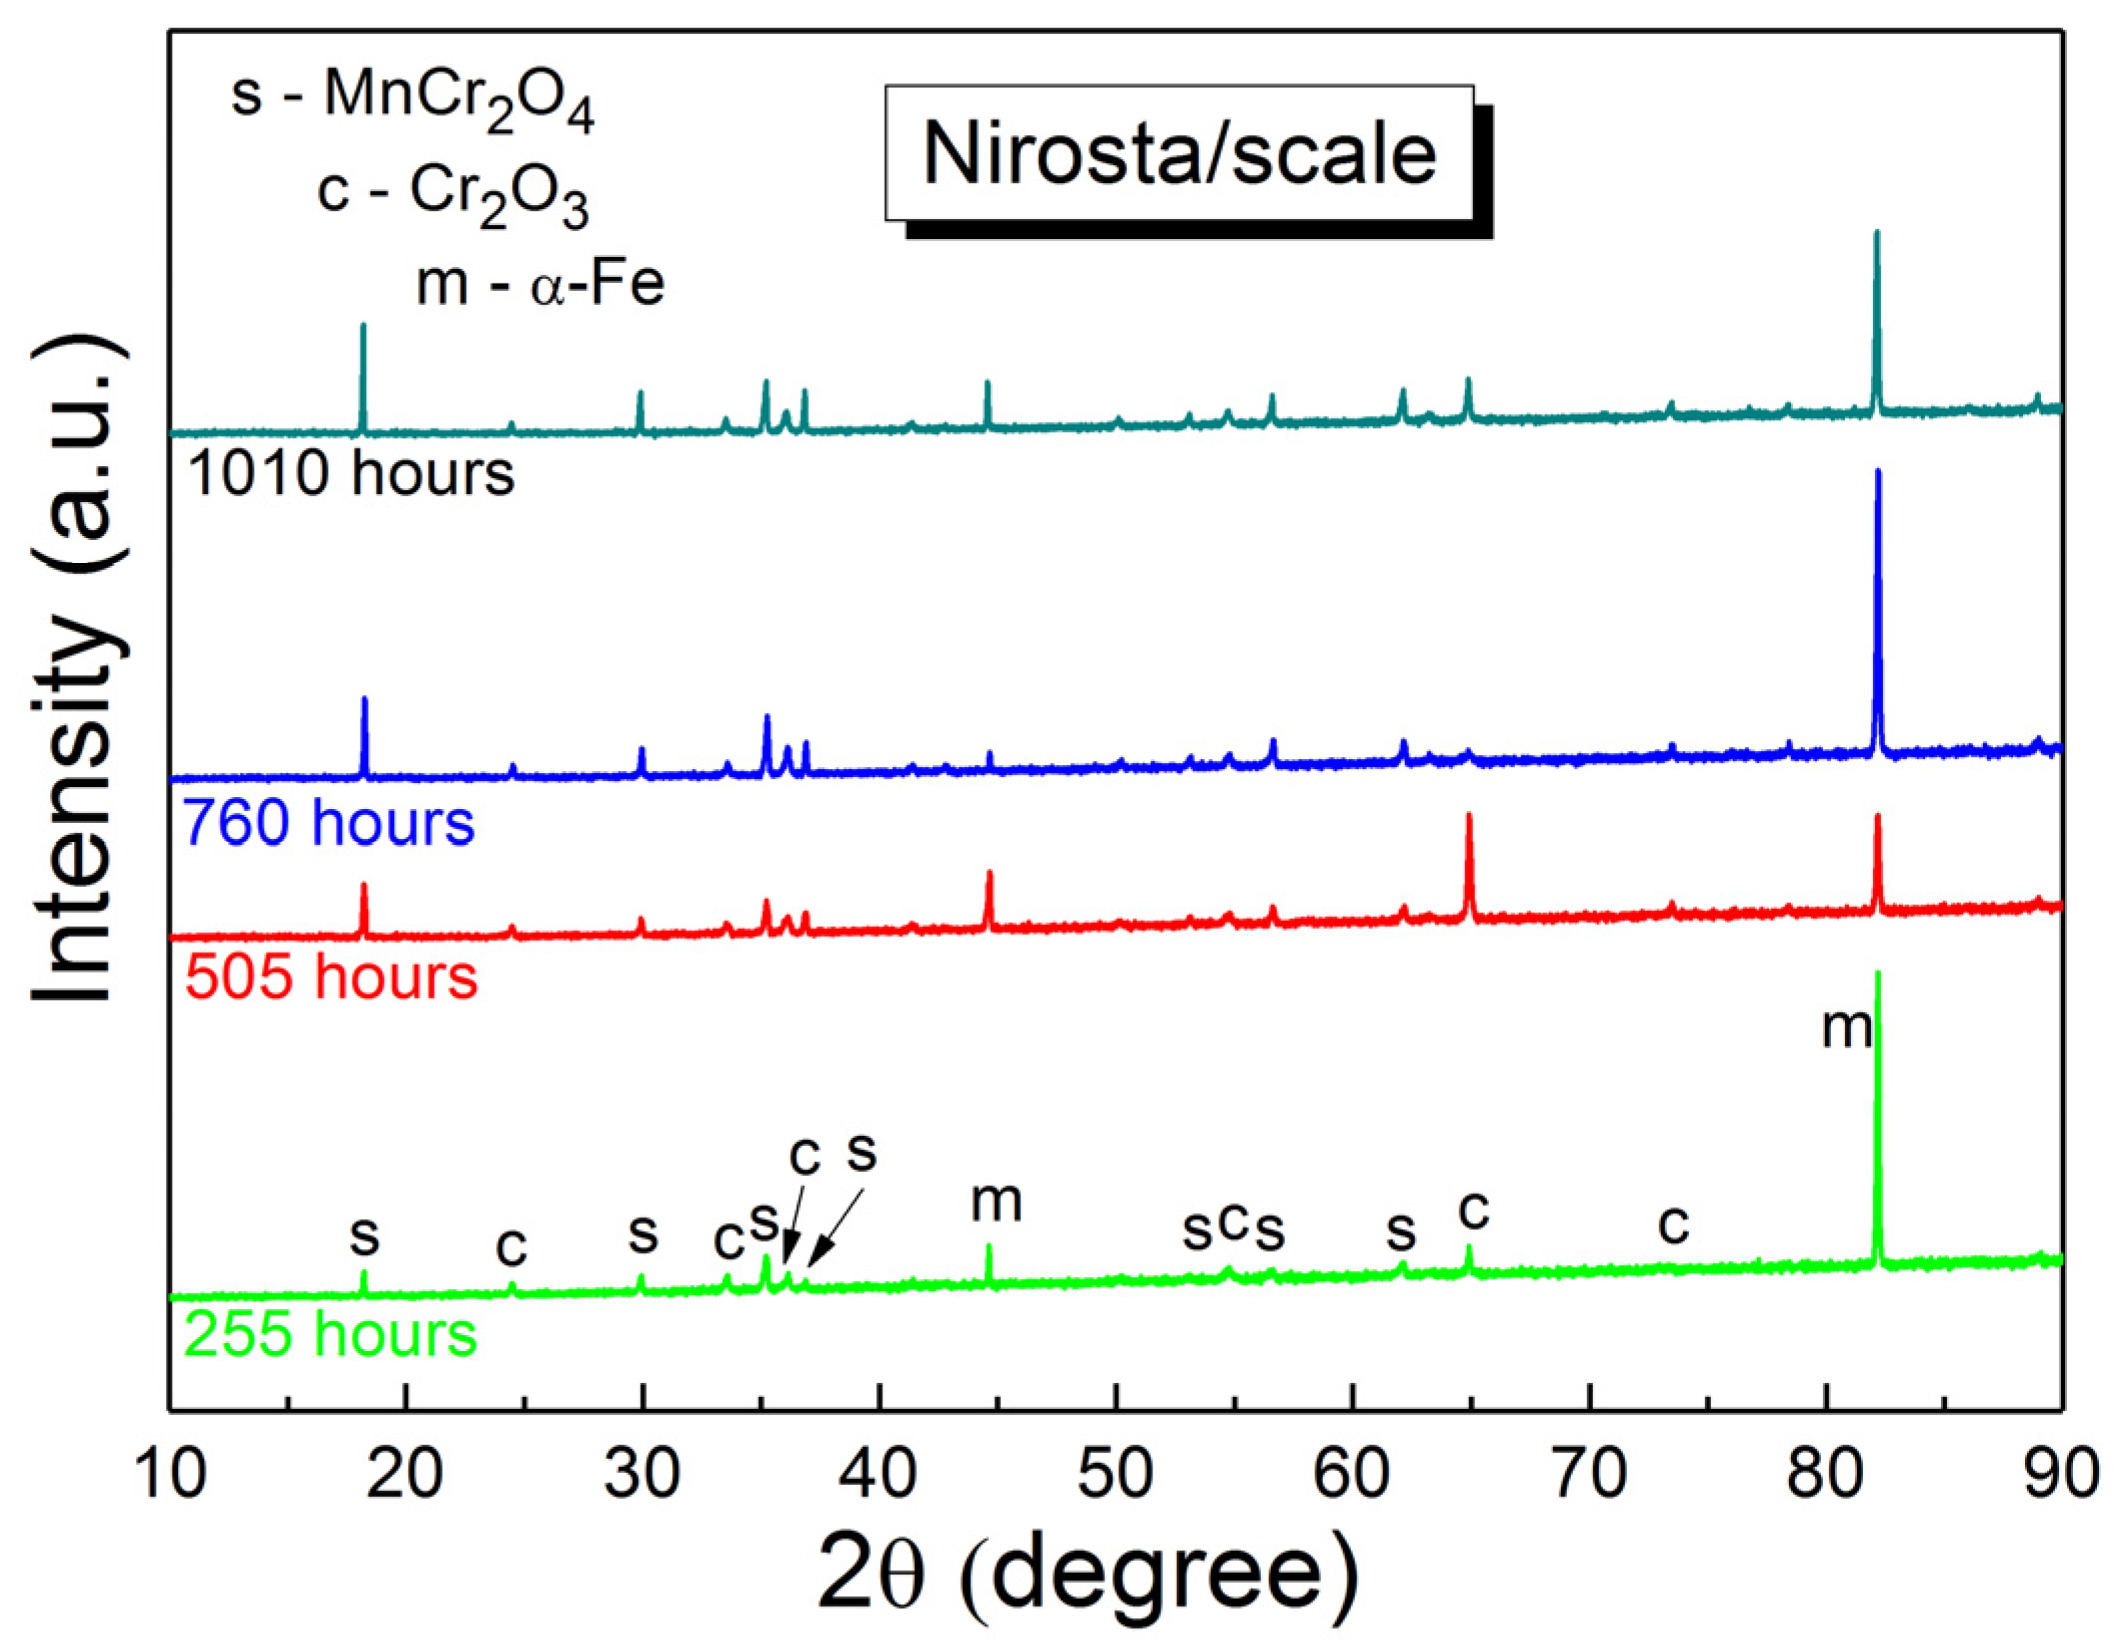
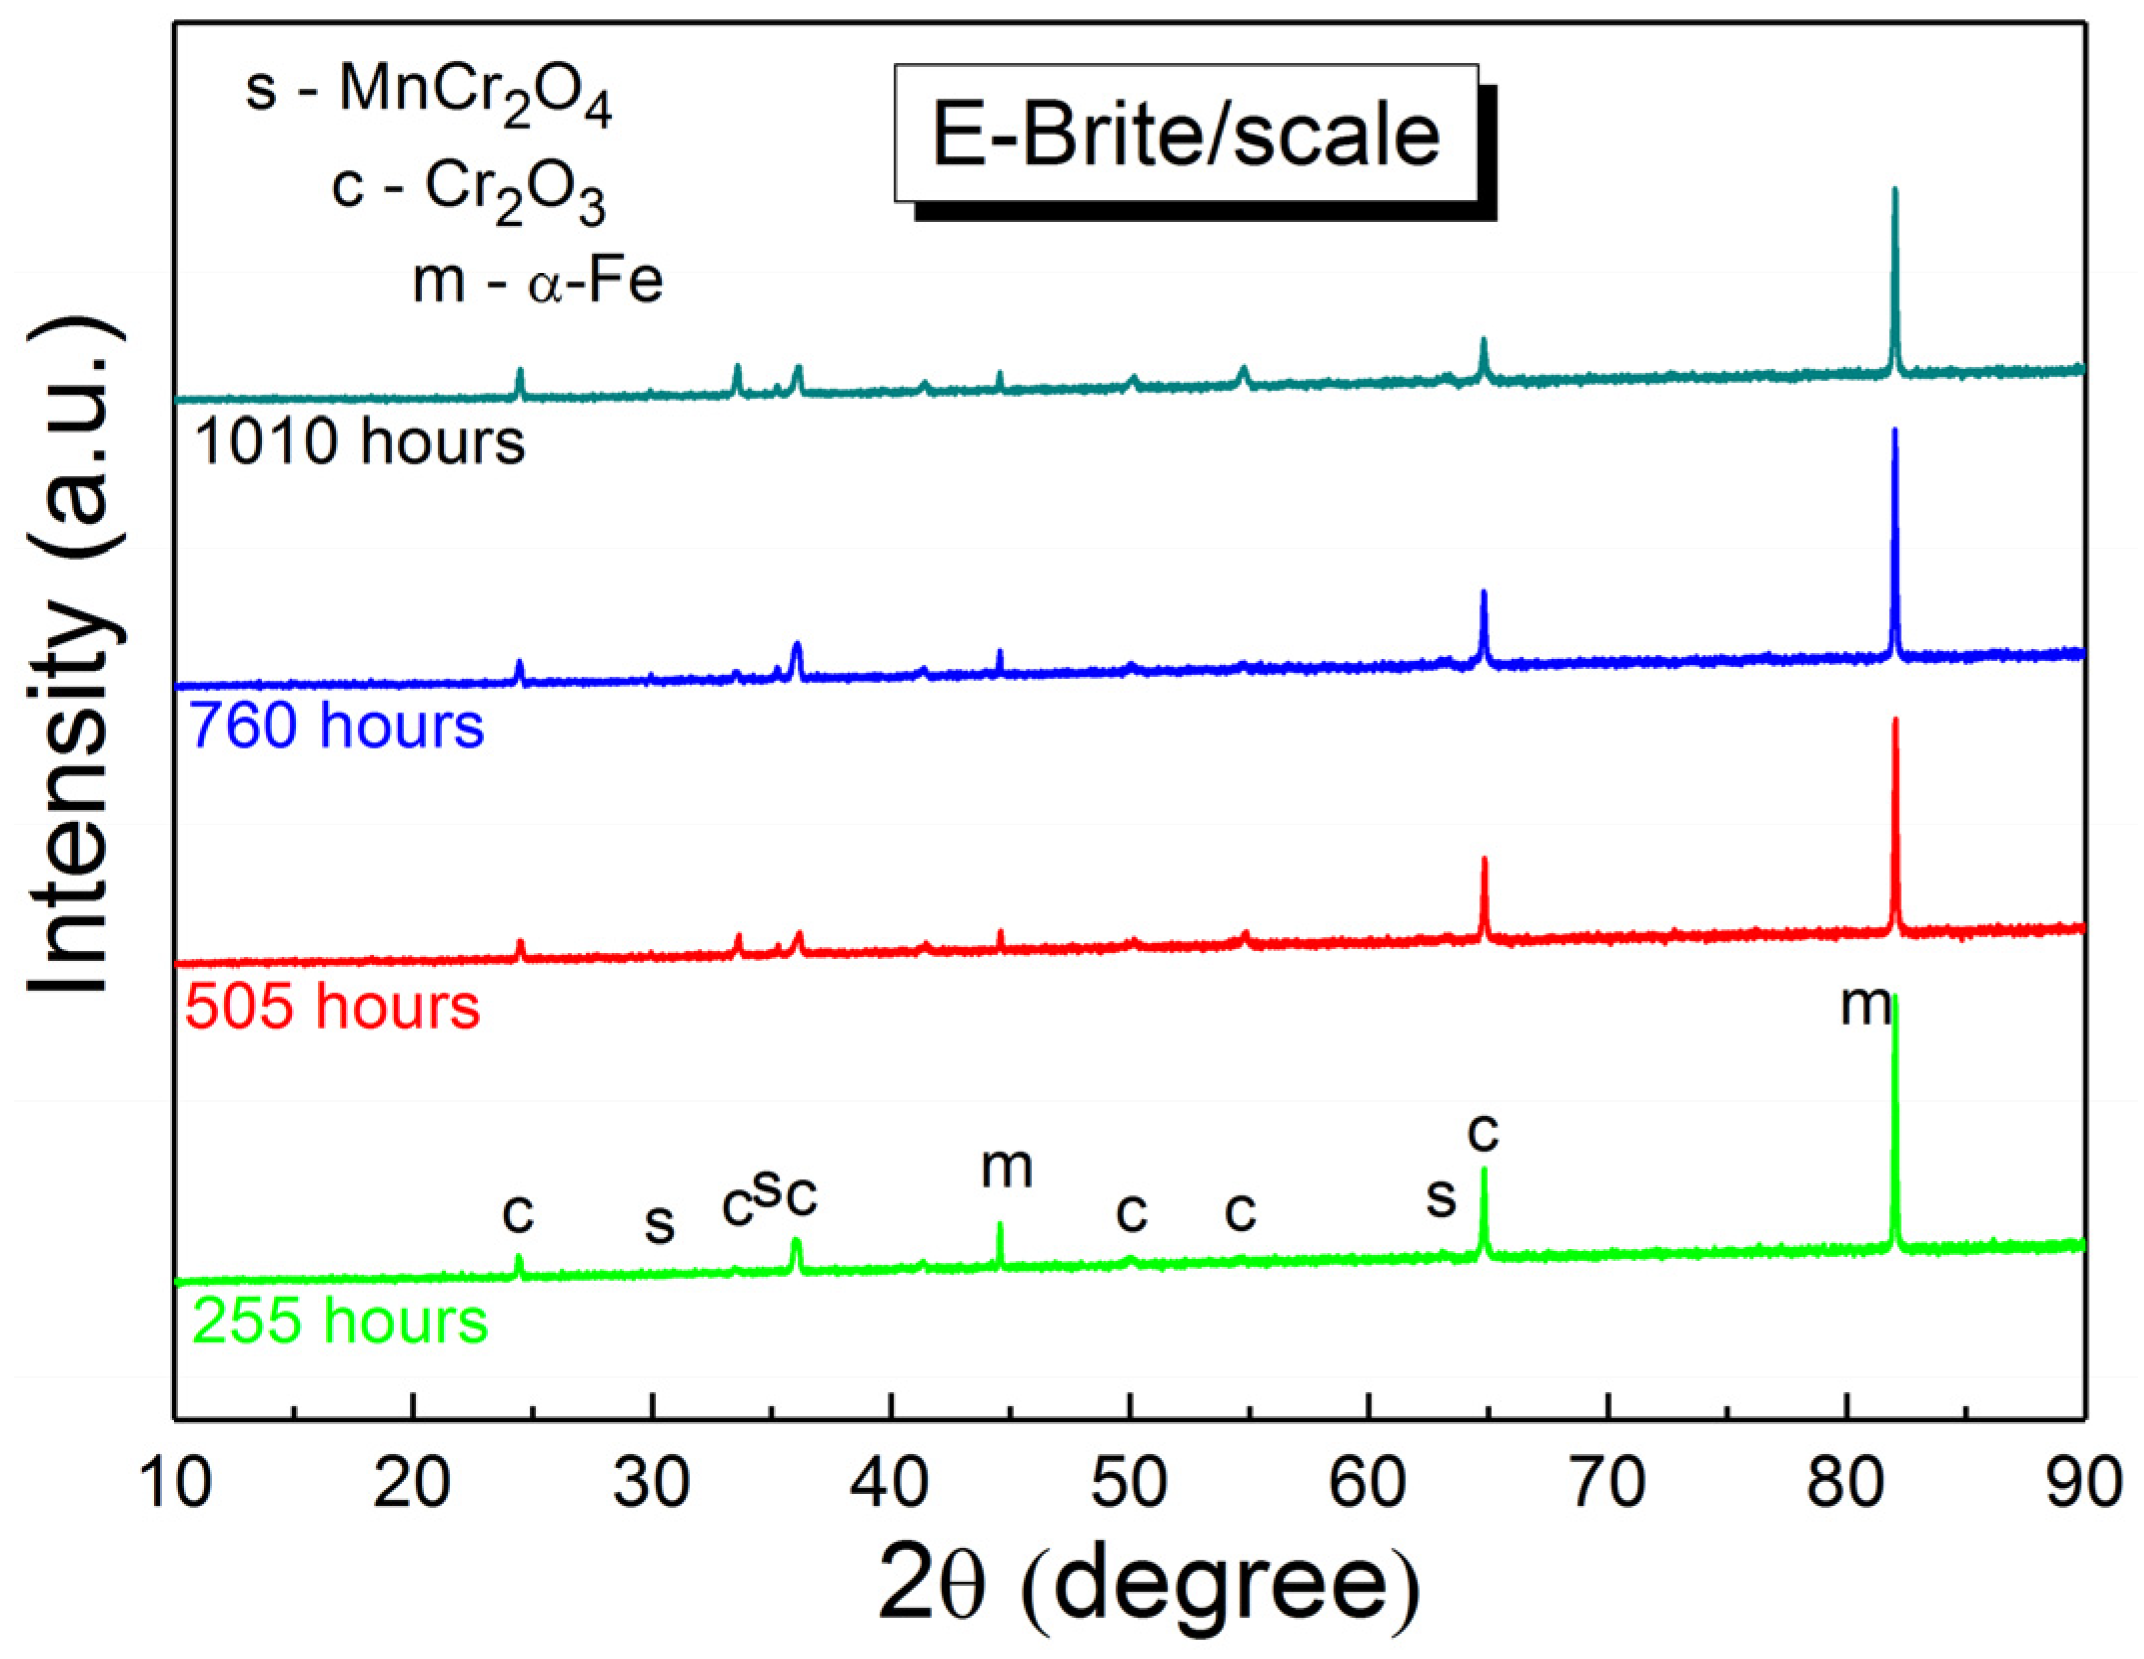
Figure 3 and Figure 4 present X-ray diffractograms of the products grown on the two ferritic steels, i.e., Nirosta 4016/1.4016 and E-Brite after their oxidation at 800 °C for 255, 505, 760 and 1010 h in air.
From these studies, it was determined that the main phases constituting the scale formed on the Nirosta 4016/1.4016 steel are Cr2O3 and MnCr2O4 manganese-chromium spinel (Figure 3). On the other hand, the scale grown on the surface of the E-Brite steel after oxidation for 255 h consists only of Cr2O3 (Figure 4), whereas the presence of MnCr2O4 was also detected along with Cr2O3 after longer oxidation durations. The increase in α-Fe reflex intensity originating from the metallic substrate as the oxidation times of the studied steels decreased should also be noted. This is associated with scale thickness, which is the lowest after the shortest oxidation duration.
Table 4 lists the relative mass fractions of the products grown due to oxidation of the Nirosta 4016/1.4016 and E-Brite grade steels at 800 °C for 255, 505, 760 and 1010 h in air.
From these data, it can be concluded that the mass fractions of the detected phases in the scale grown on the E-Brite steel are around 97% for Cr2O3 and about 3% for MnCr2O4, and are practically independent of the oxidation duration. However, in the case of the Nirosta 4016/1.4016 steel, a systematic increase in the MnCr2O4 relative mass fraction along with a simultaneous decrease in Cr2O3 contribution in the scale is observed as the oxidation time of this steel increases.

3.3. Morphological Observations and Chemical Composition Studies of the Ferritic Steel Oxidation Products

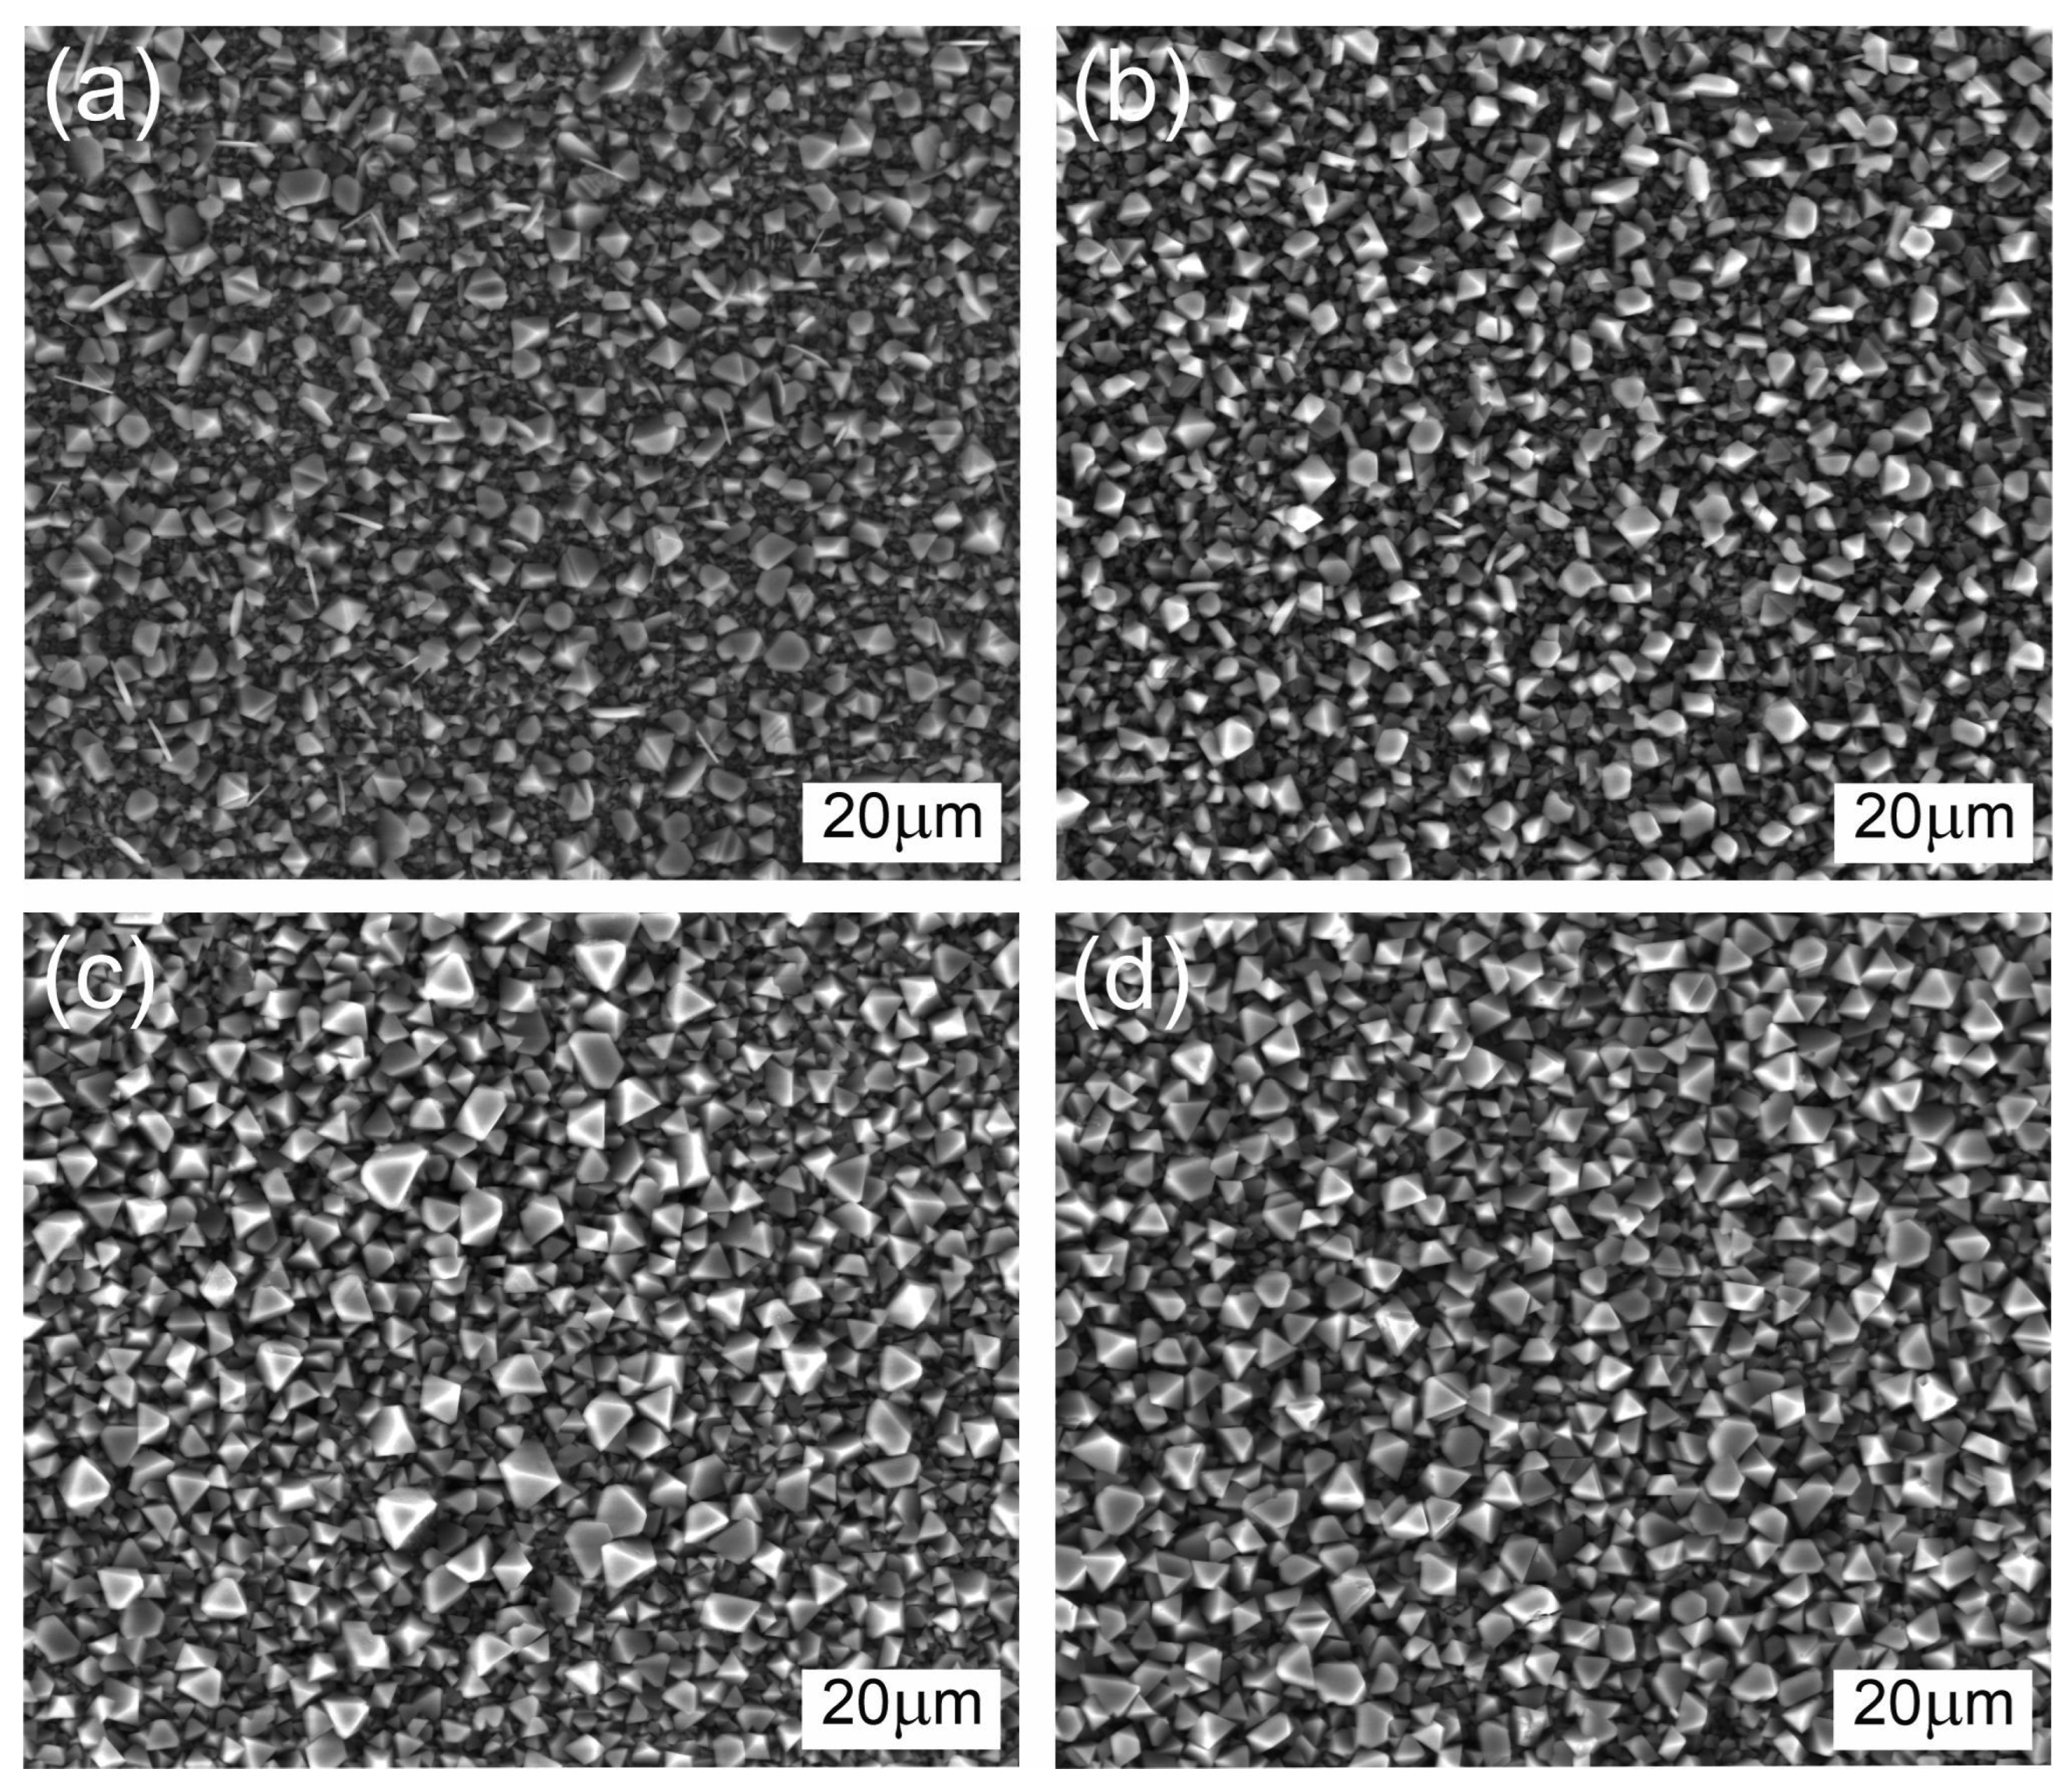
Figure 5 illustrates the surface morphologies of the scales grown on the Nirosta 4016/1.4016 ferritic steel after oxidation in air at 800 °C for 255 h (Figure 5a), 505 h (Figure 5b), 760 h (Figure 5c) and 1010 h (Figure 5d).
Microscopic observations of the scale surface revealed the presence of developed crystalline forms consisting of manganese-chromium spinel crystallites with a regular structure. Between the spinel grains these plates built of Cr2O3 are sporadically visible, the amounts of which successively decrease as oxidation time increases. It should be noted that significant changes in the cross-sections and spinel grain sizes were not observed after longer oxidation durations. After 225 h oxidation, the spinel grain sizes were in the range of 0.5 μm to 4 μm (Figure 5a), whereas after 1010 h the spinel grains manifested between the sizes of 1 μm and 5 μm (Figure 5d).
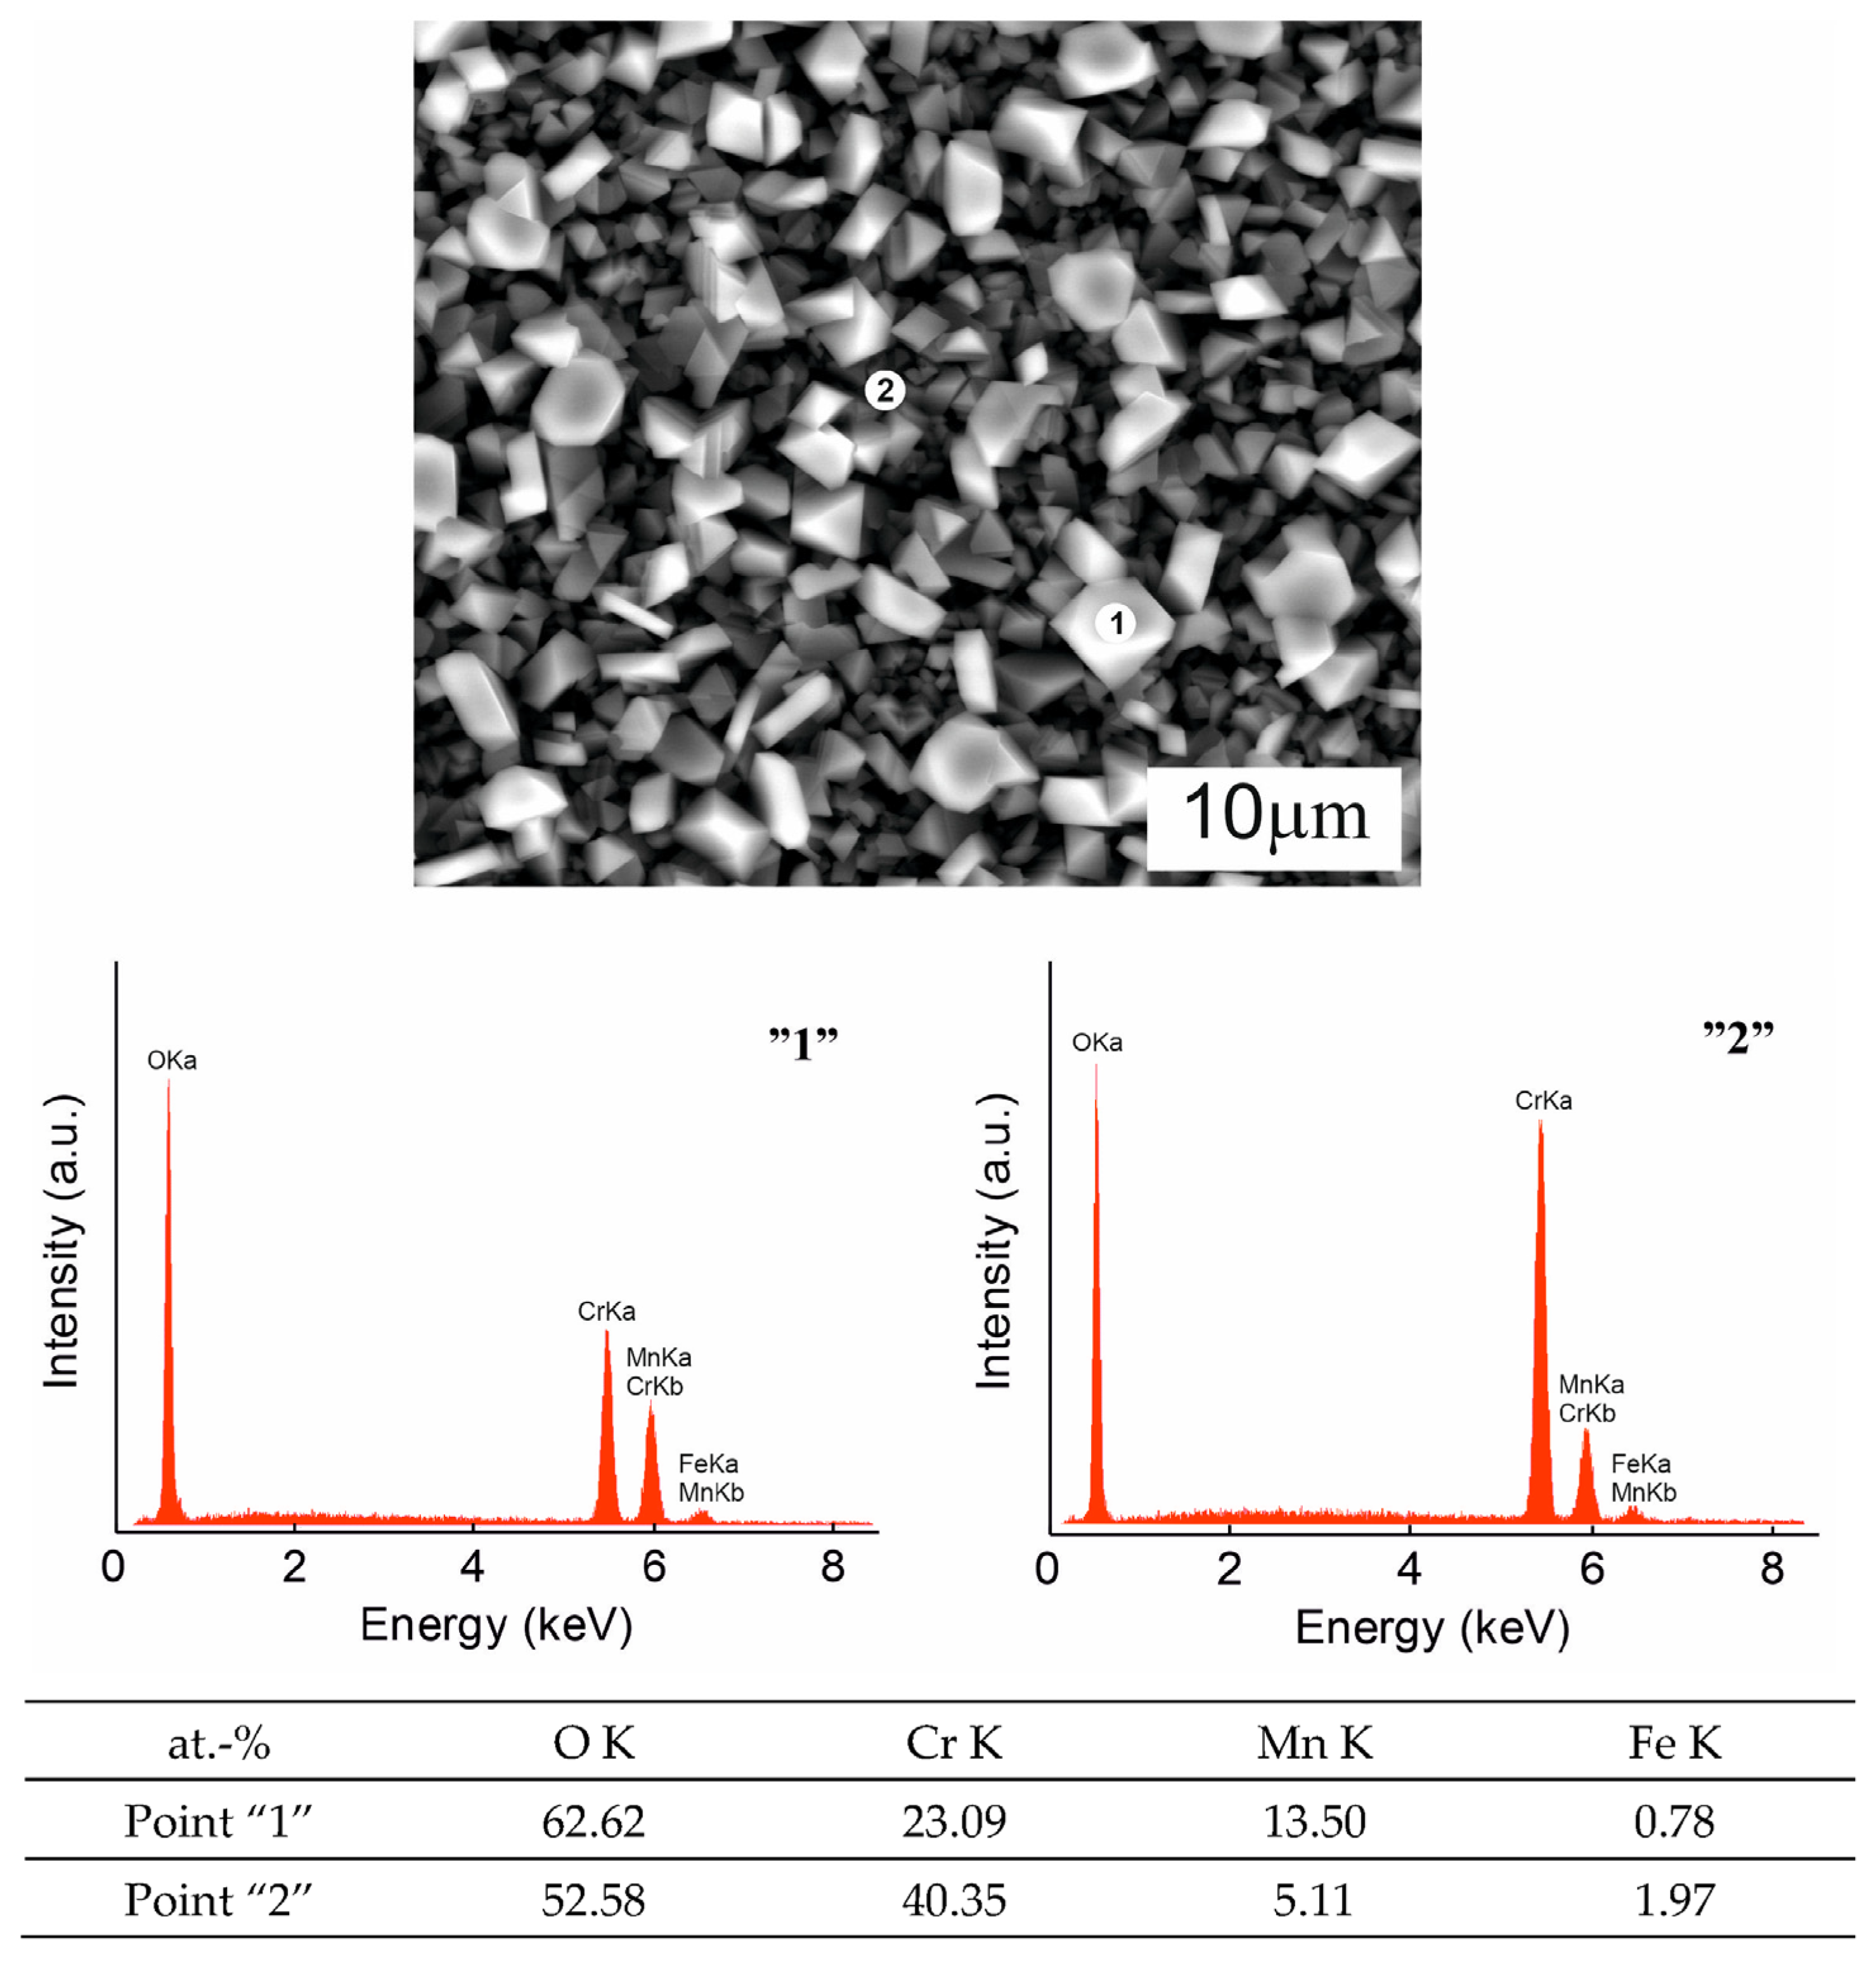
Chemical composition studies of the outermost scale layer by means of SEM/EDS revealed the presence of Cr2O3 grains under a layer consisting of spinel phase grains. As an example, in Figure 6, the morphology of an enlarged fragment of the scale formed on the Nirosta 4016/1.4016 steel after 505 h of oxidation is illustrated along with spectra of EDS point analysis from locations designated with symbols “1” and “2”.
EDS point analysis of the chemical composition in the lower part of the layer (Figure 6—point “2”) showed significant Cr and O concentrations along with a certain amount of Mn, indicating the presence of Cr2O3 in the studied scale as a result of selective chromium oxidation. On the other hand, the decrease in Cr concentration in the outer part of the layer along with a simultaneous increase in the amount of Mn can be associated with a continuous MnCr2O4 spinel layer, the existence of which is indicated in the EDS point analysis (Figure 6—point “1”). Confirmation of these analyses can be found in the X-ray diffraction results (Figure 3).
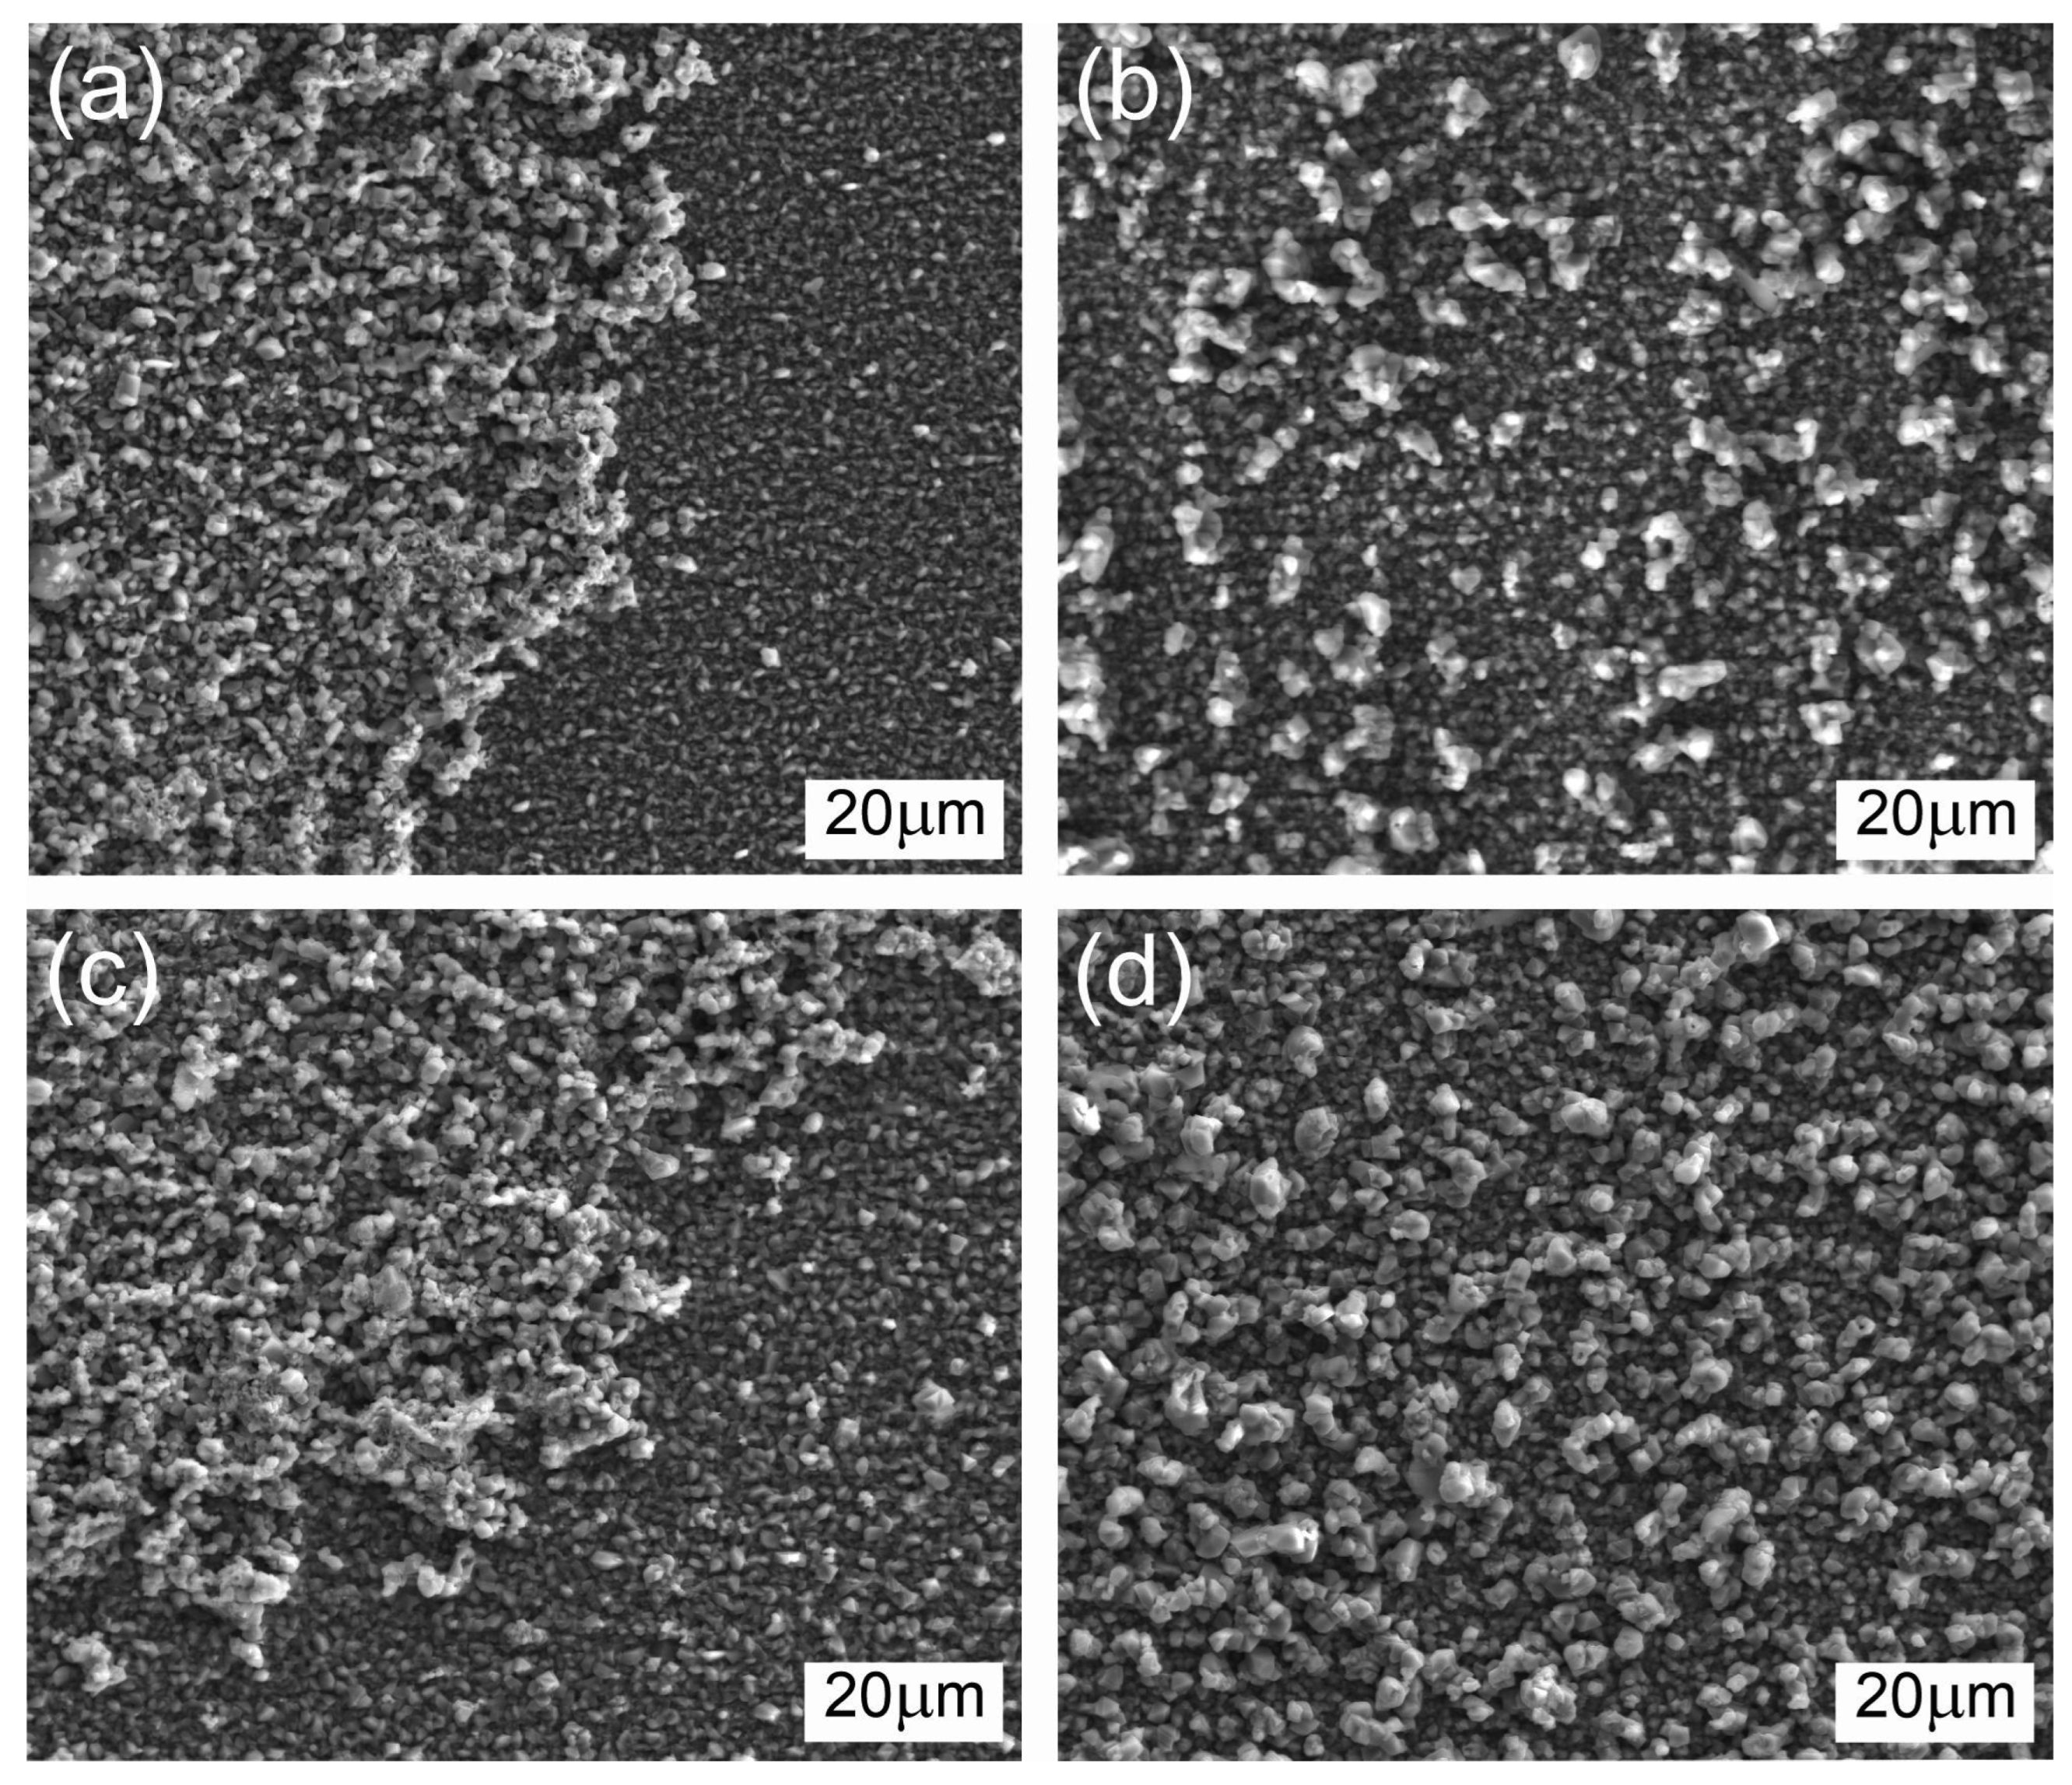
In the subsequent figure, Figure 7, surface morphologies of scales formed on the E-Brite ferritic steel were presented after oxidation in air at 800 °C for 255 h (Figure 7a), 505 h (Figure 7b), 760 h (Figure 7c) and 1010 h (Figure 7d).
In this case, the surface of the corrosion product mainly consists of fine Cr2O3 grains, between which a minor number of precipitates in the form of “islets” built of well-defined MnCr2O4 spinel grains was observed.
The lack of a clearly defined external spinel layer is due to the very low manganese concentration in this steel, i.e., 0.05 wt.% (Table 1). The aforementioned precipitates grow on a fine-grained layer built of chromium (III) oxide. The grain sizes of this fundamental layer of the scale grown on the E-Brite steel after oxidation for 255 h are between 0.5 μm and 1 μm, whereas the size of the discussed precipitates is in the range of 1–3.5 μm (Figure 7a). As the oxidation time of the studied steel increases, the grains constituting the above-mentioned “islets” assume clearly defined crystalline forms (Figure 7b,c). The spinel grains achieve sizes up to 8 μm. The scale surface visible in Figure 7d grown on the steel after 1010 h oxidation still consists of a continuous fine-crystalline Cr2O3 layer, on which crystallized spinel grains with sizes ranging between 1.5 μm and 10 μm grow.
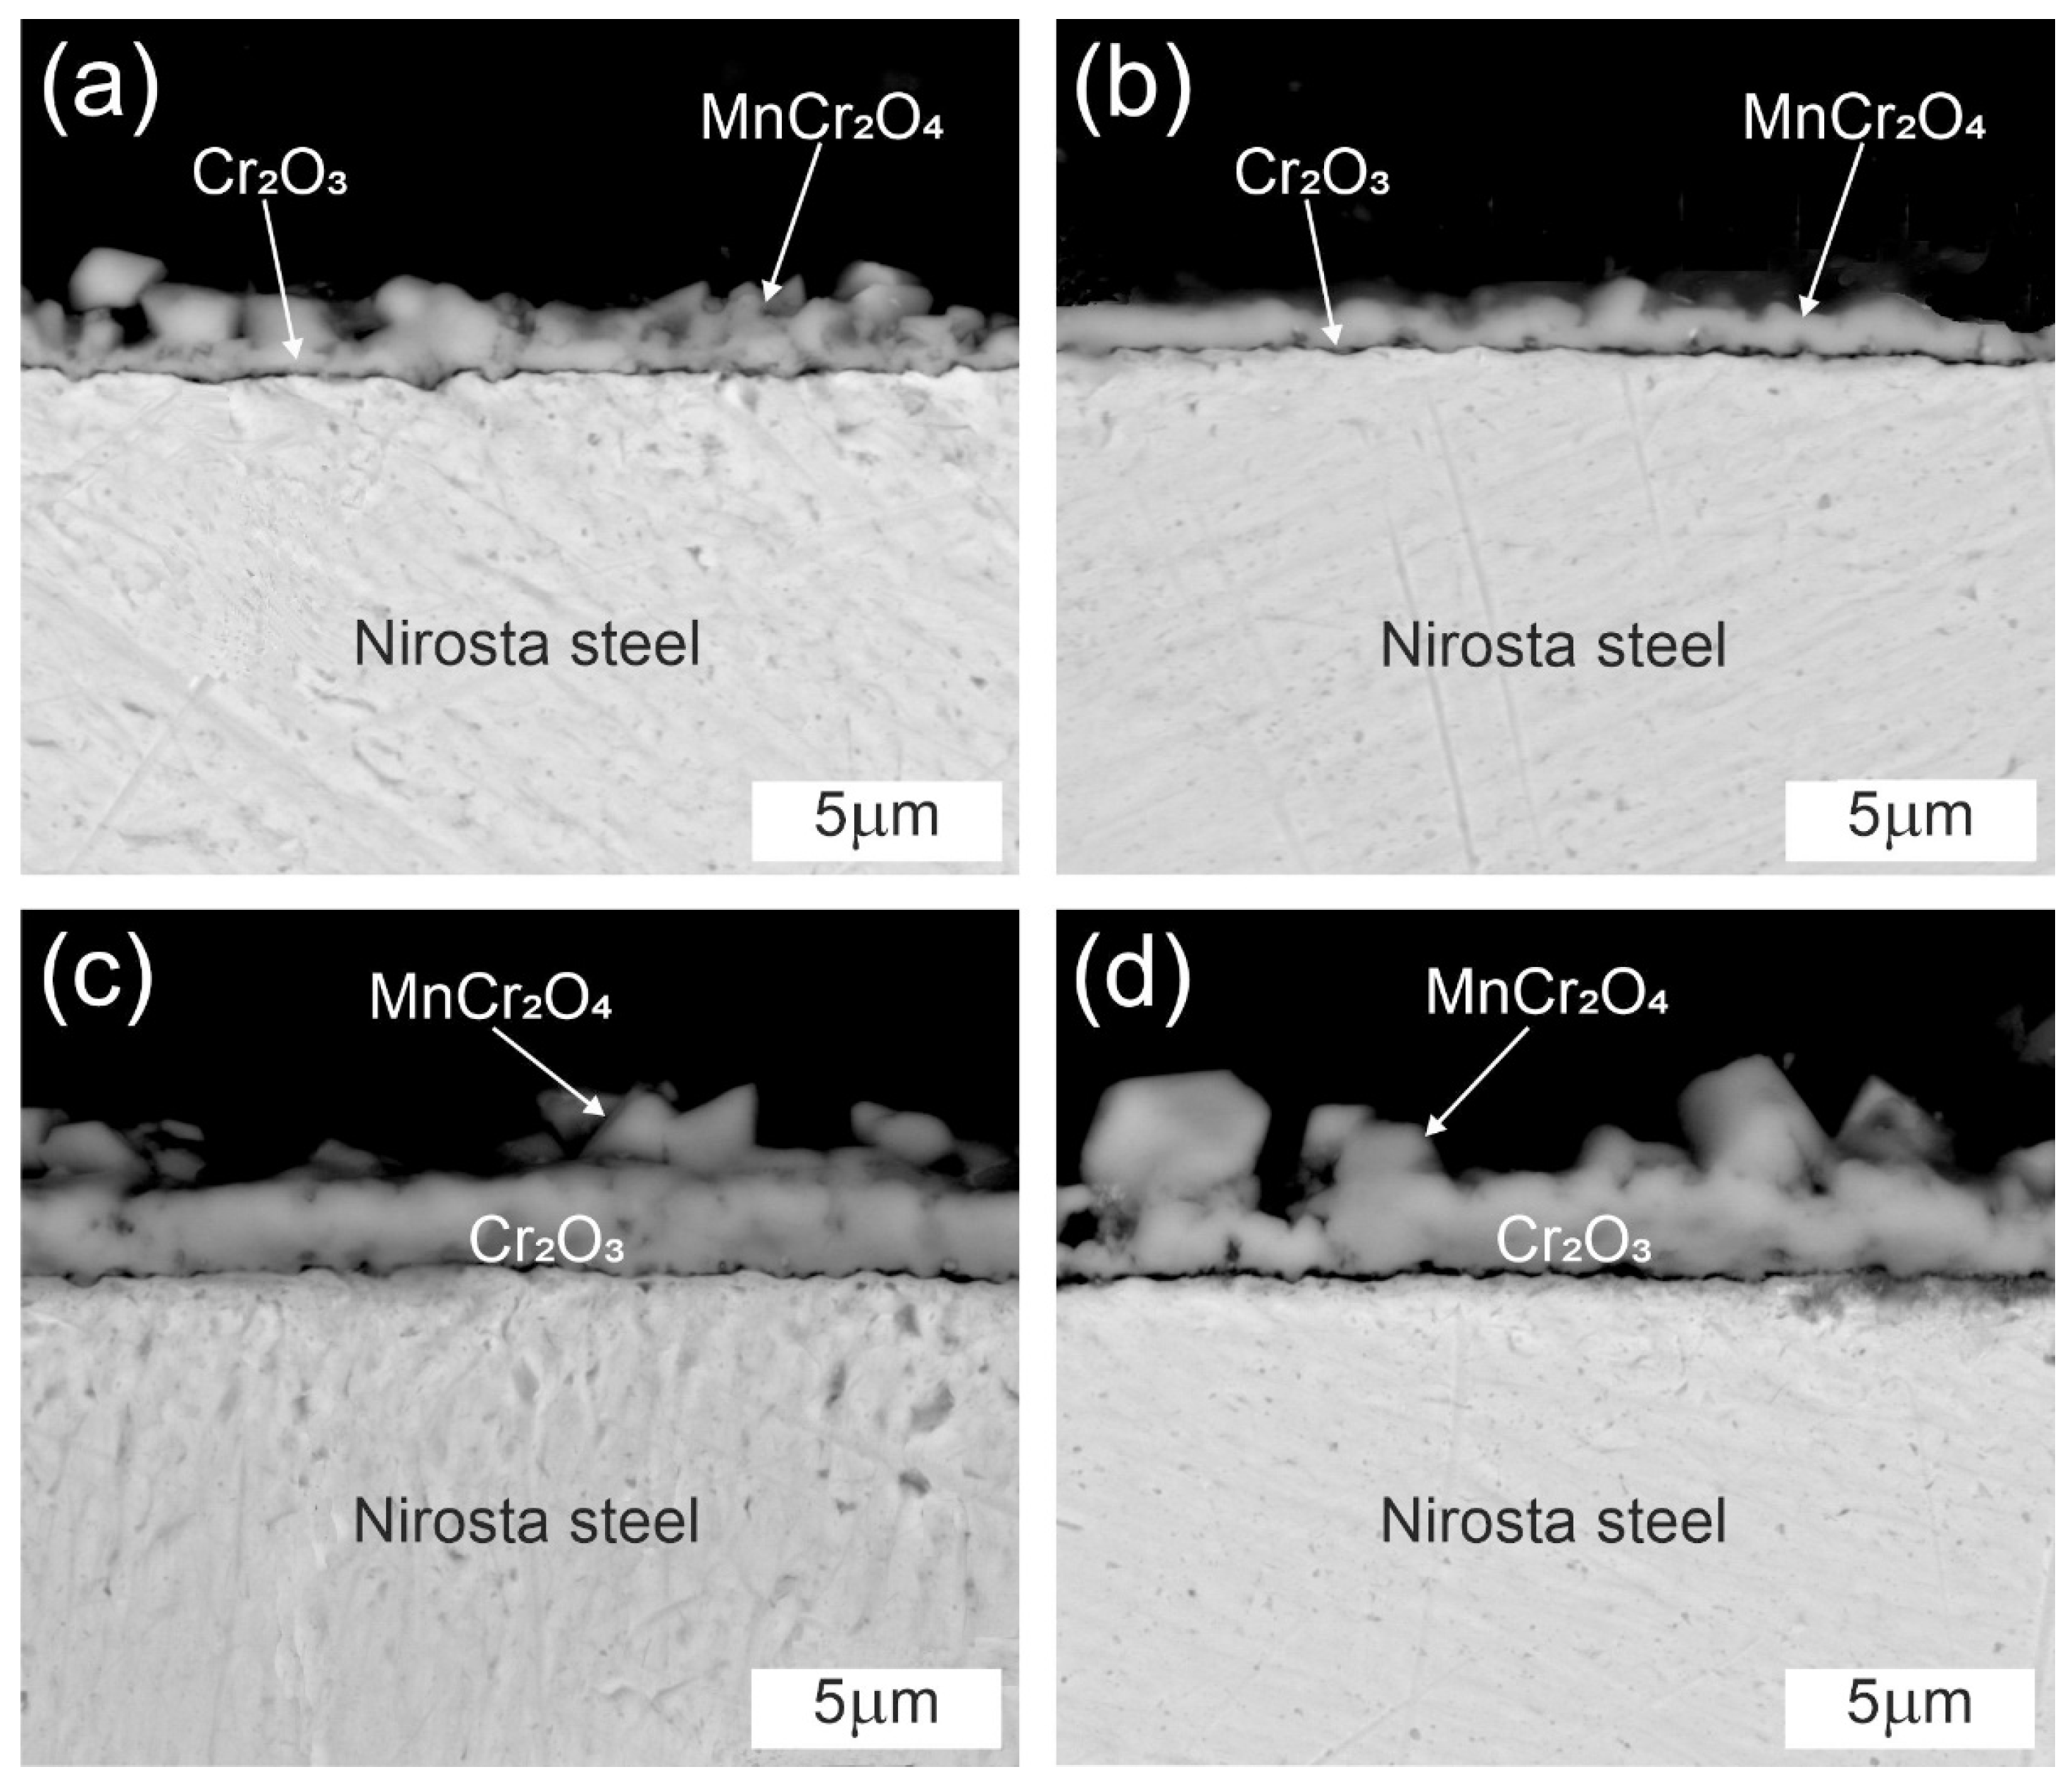
Figure 8 illustrates SEM cross-section microphotographs of scales formed on the Nirosta 4016/1.4016 ferritic steel after oxidation in air at 800 °C for 255 h (Figure 8a), 505 h (Figure 8b), 760 h (Figure 8c) and 1010 h (Figure 8d).
From these observations, it can be seen that the obtained scales consist of two layers: a thin external MnCr2O4 spinel layer and a thick internal layer built of Cr2O3, which is the main oxidation product of the studied steel. Spinel formation at the external part of the scale is due to its high thermodynamic stability at 800 °C, since at that temperature MnO precipitates, the free enthalpy of which is lower than that of Cr2O3. Under these conditions, manganese dissolves in the Cr2O3 lattice and then diffuses into the external part of the scale because the manganese diffusion coefficient in a Cr2O3 crystalline lattice is much higher than that of the remaining ferritic steel components, i.e., Fe and Cr in the following order DMn > DFe > DCr [18]. As a result, of the solid-state reaction between manganese and chromium oxide, a stable manganese-chromium spinel forms.
In spite of the negative manganese influence on the scaling resistance of ferritic steels, the formation of MnCr2O4 is beneficial due to its electrical conductivity being higher than that of Cr2O3 [19]. In addition, the spinel layer significantly limits chromium evaporation, which usually results in “electrode poisoning” [20].
All discussed scales are compact and well-adherent to the metallic core, however, the adherence of the outer spinel layer to the Cr2O3 layer is not entirely satisfactory due to the differences between the thermal expansion of Cr2O3 and MnCr2O4. The thickness of the fundamental fine-crystalline Cr2O3 layer is different depending on the duration of the oxidation process. As the oxidation time increases, so does the thickness of the layer formed on the Nirosta 4016/1.4016 ferritic steel. From the data compiled in Table 2, it follows that the average total thickness of the scale grown on the studied steel after 1010 h, which contains two oxide layers, is around 2.8 μm. However, the spinel layer exhibits 0.8 μm thickness. One more detail concerning the microstructure of the studied scale cross-sections should be taken into consideration: the presence of SiO2 precipitates was determined at the steel/scale interface region inside each of the discussed samples.
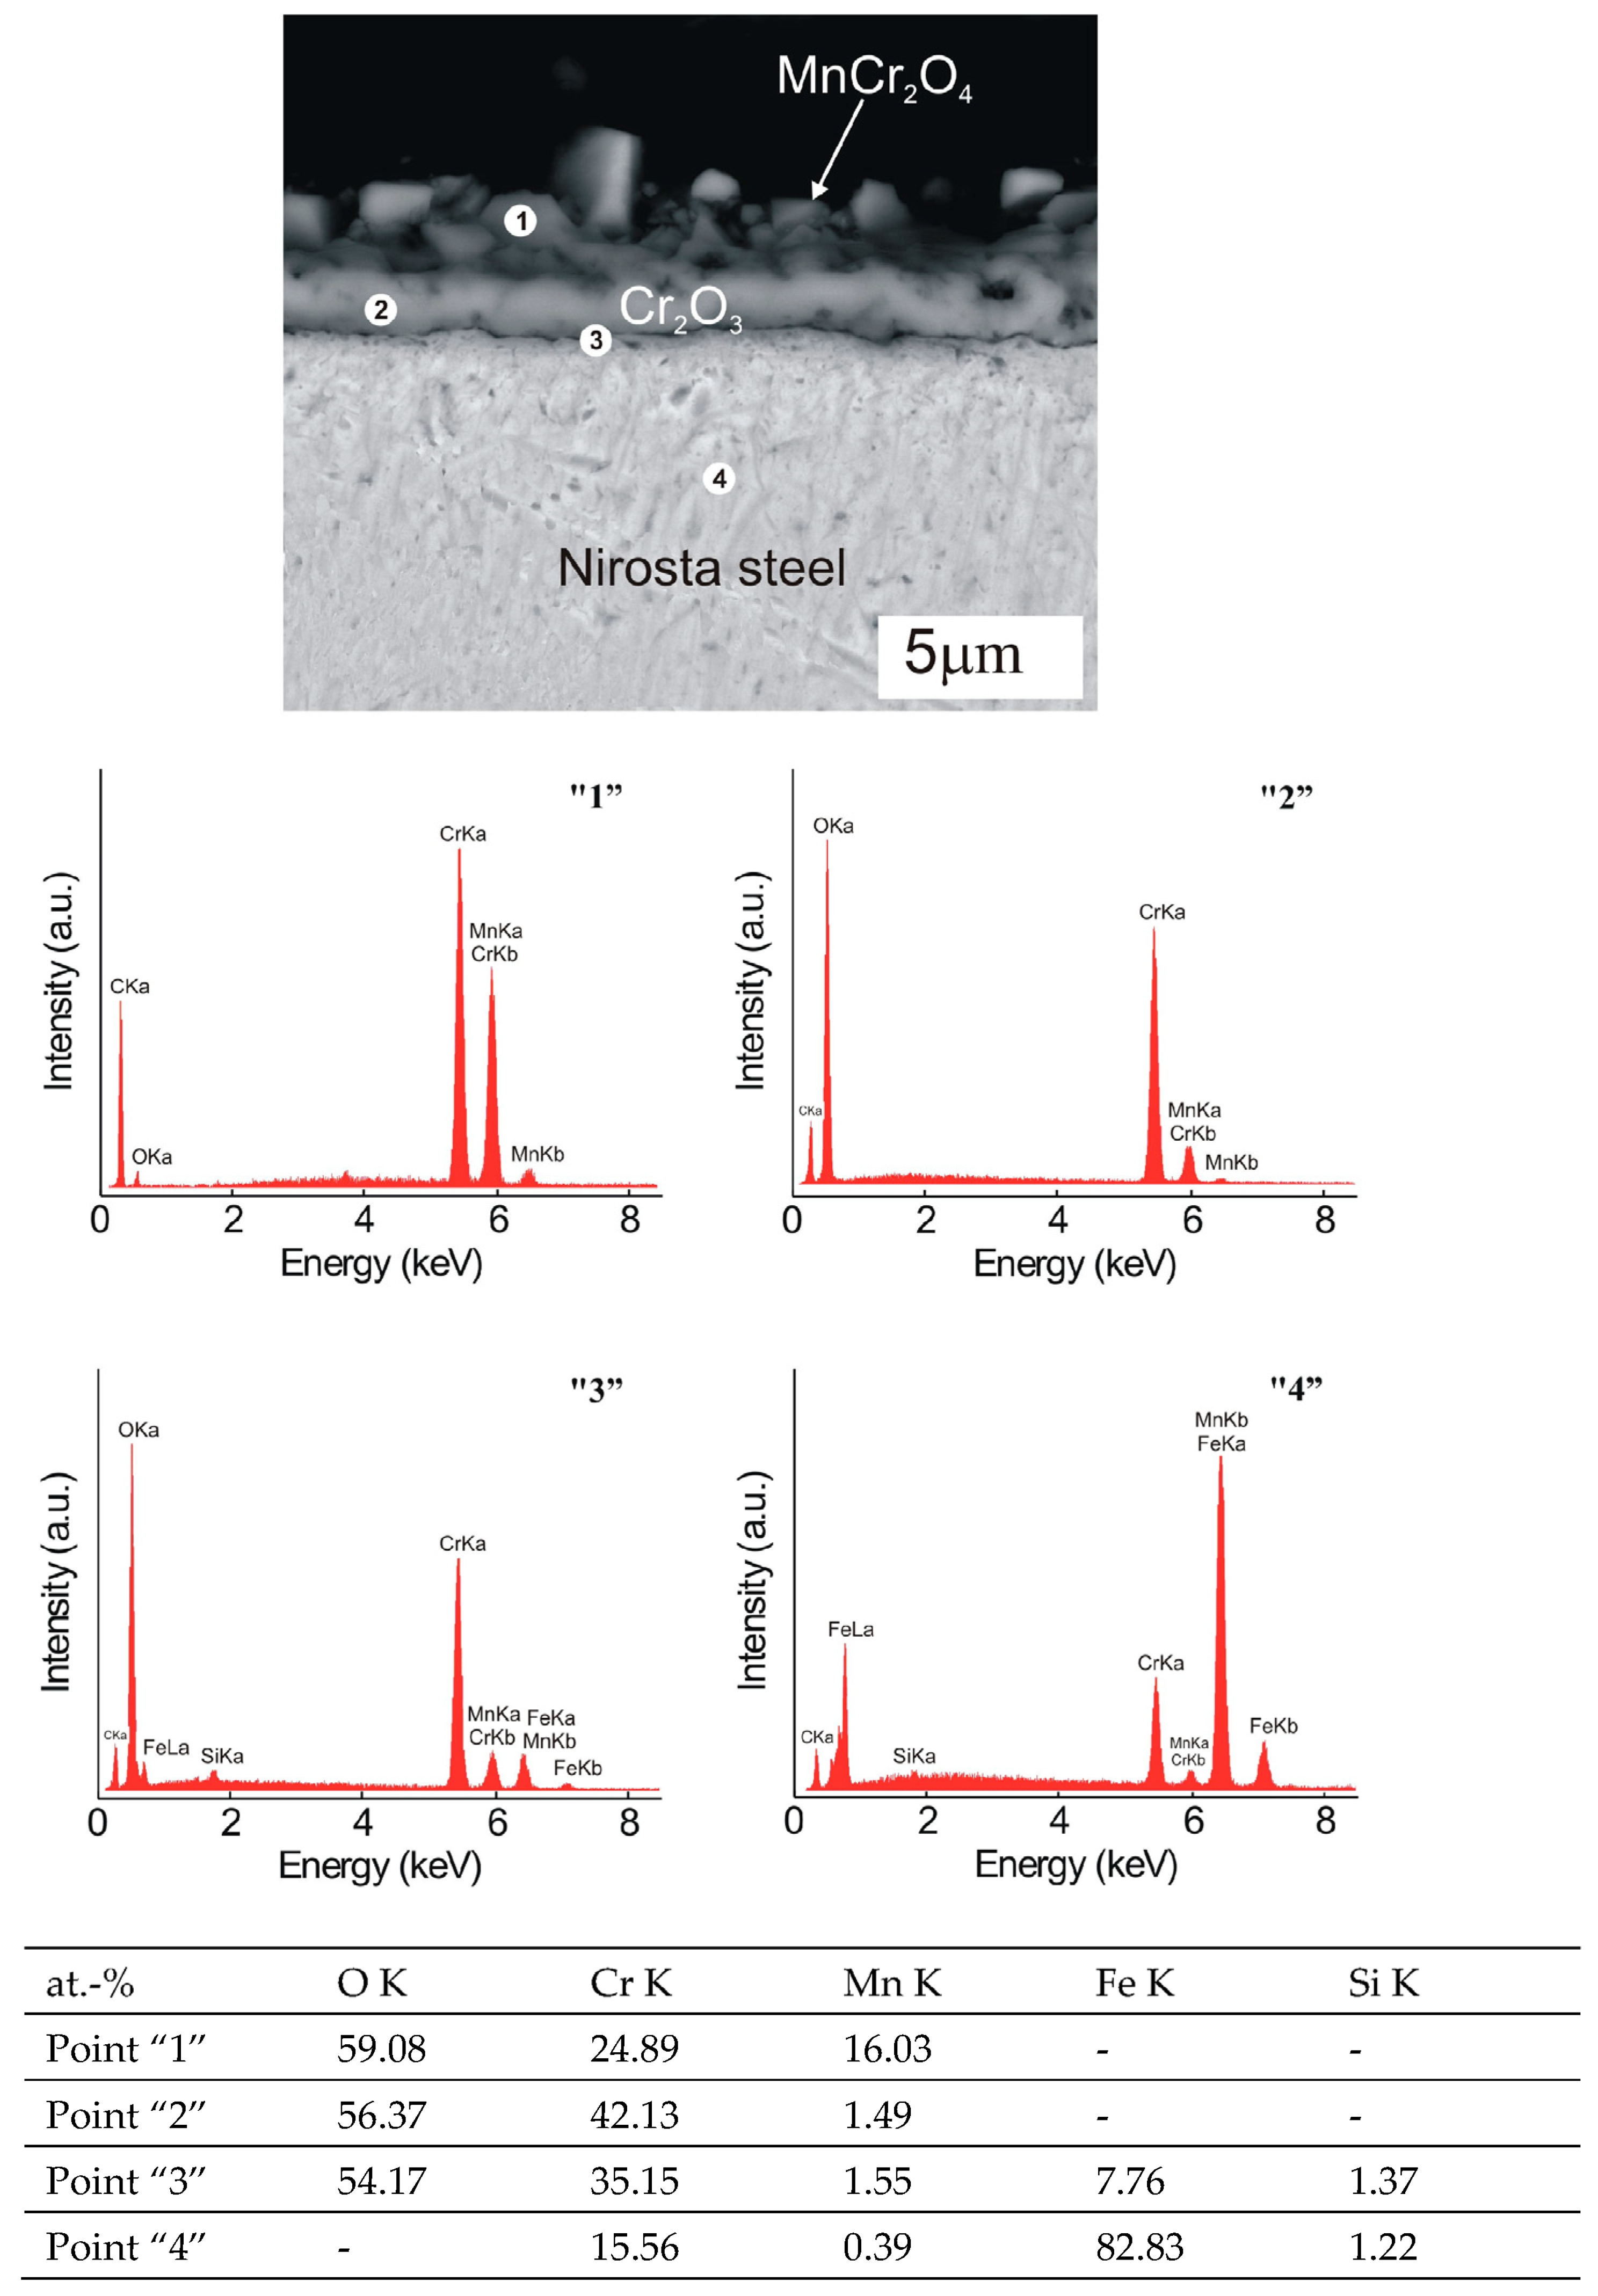
Figure 9 presents, as an example, the cross-section of the scale grown on the Nirosta 4016/1.4016 steel after oxidation in air at 800 °C for 760 h and EDS point analysis spectra from locations “1”, “2”, “3” and “4”.
From the picture, it follows that the grown scale has two layers: a thick internal layer built of chromium oxide (Figure 9—point “2”) and a thinner external manganese-chromium spinel layer, the existence of which is also indicated by the EDS point analysis (Figure 9—point “1”). Furthermore, the EDS point analysis confirmed the presence of several SiO2 precipitates beneath the Cr2O3 layer at the steel/scale interface (Figure 9—point “3”). Silicon exhibits higher chemical affinity to oxygen compared to chromium. The activity of oxygen beneath the scale is sufficient for silicon to internally oxidize, resulting in precipitates which, by accumulating in grain boundary regions inside the steel, can significantly hinder chromium diffusion in the direction of the scale/gas interface and simultaneously retard the corrosion rate of the discussed ferritic steel.
In Figure 10 cross-section morphologies of scales formed on E-Brite grade ferritic steel were presented after oxidation in air at 800 °C for 255 h (Figure 10a), 505 h (Figure 10b), 760 h (Figure 10c) and 1010 h (Figure 10d).
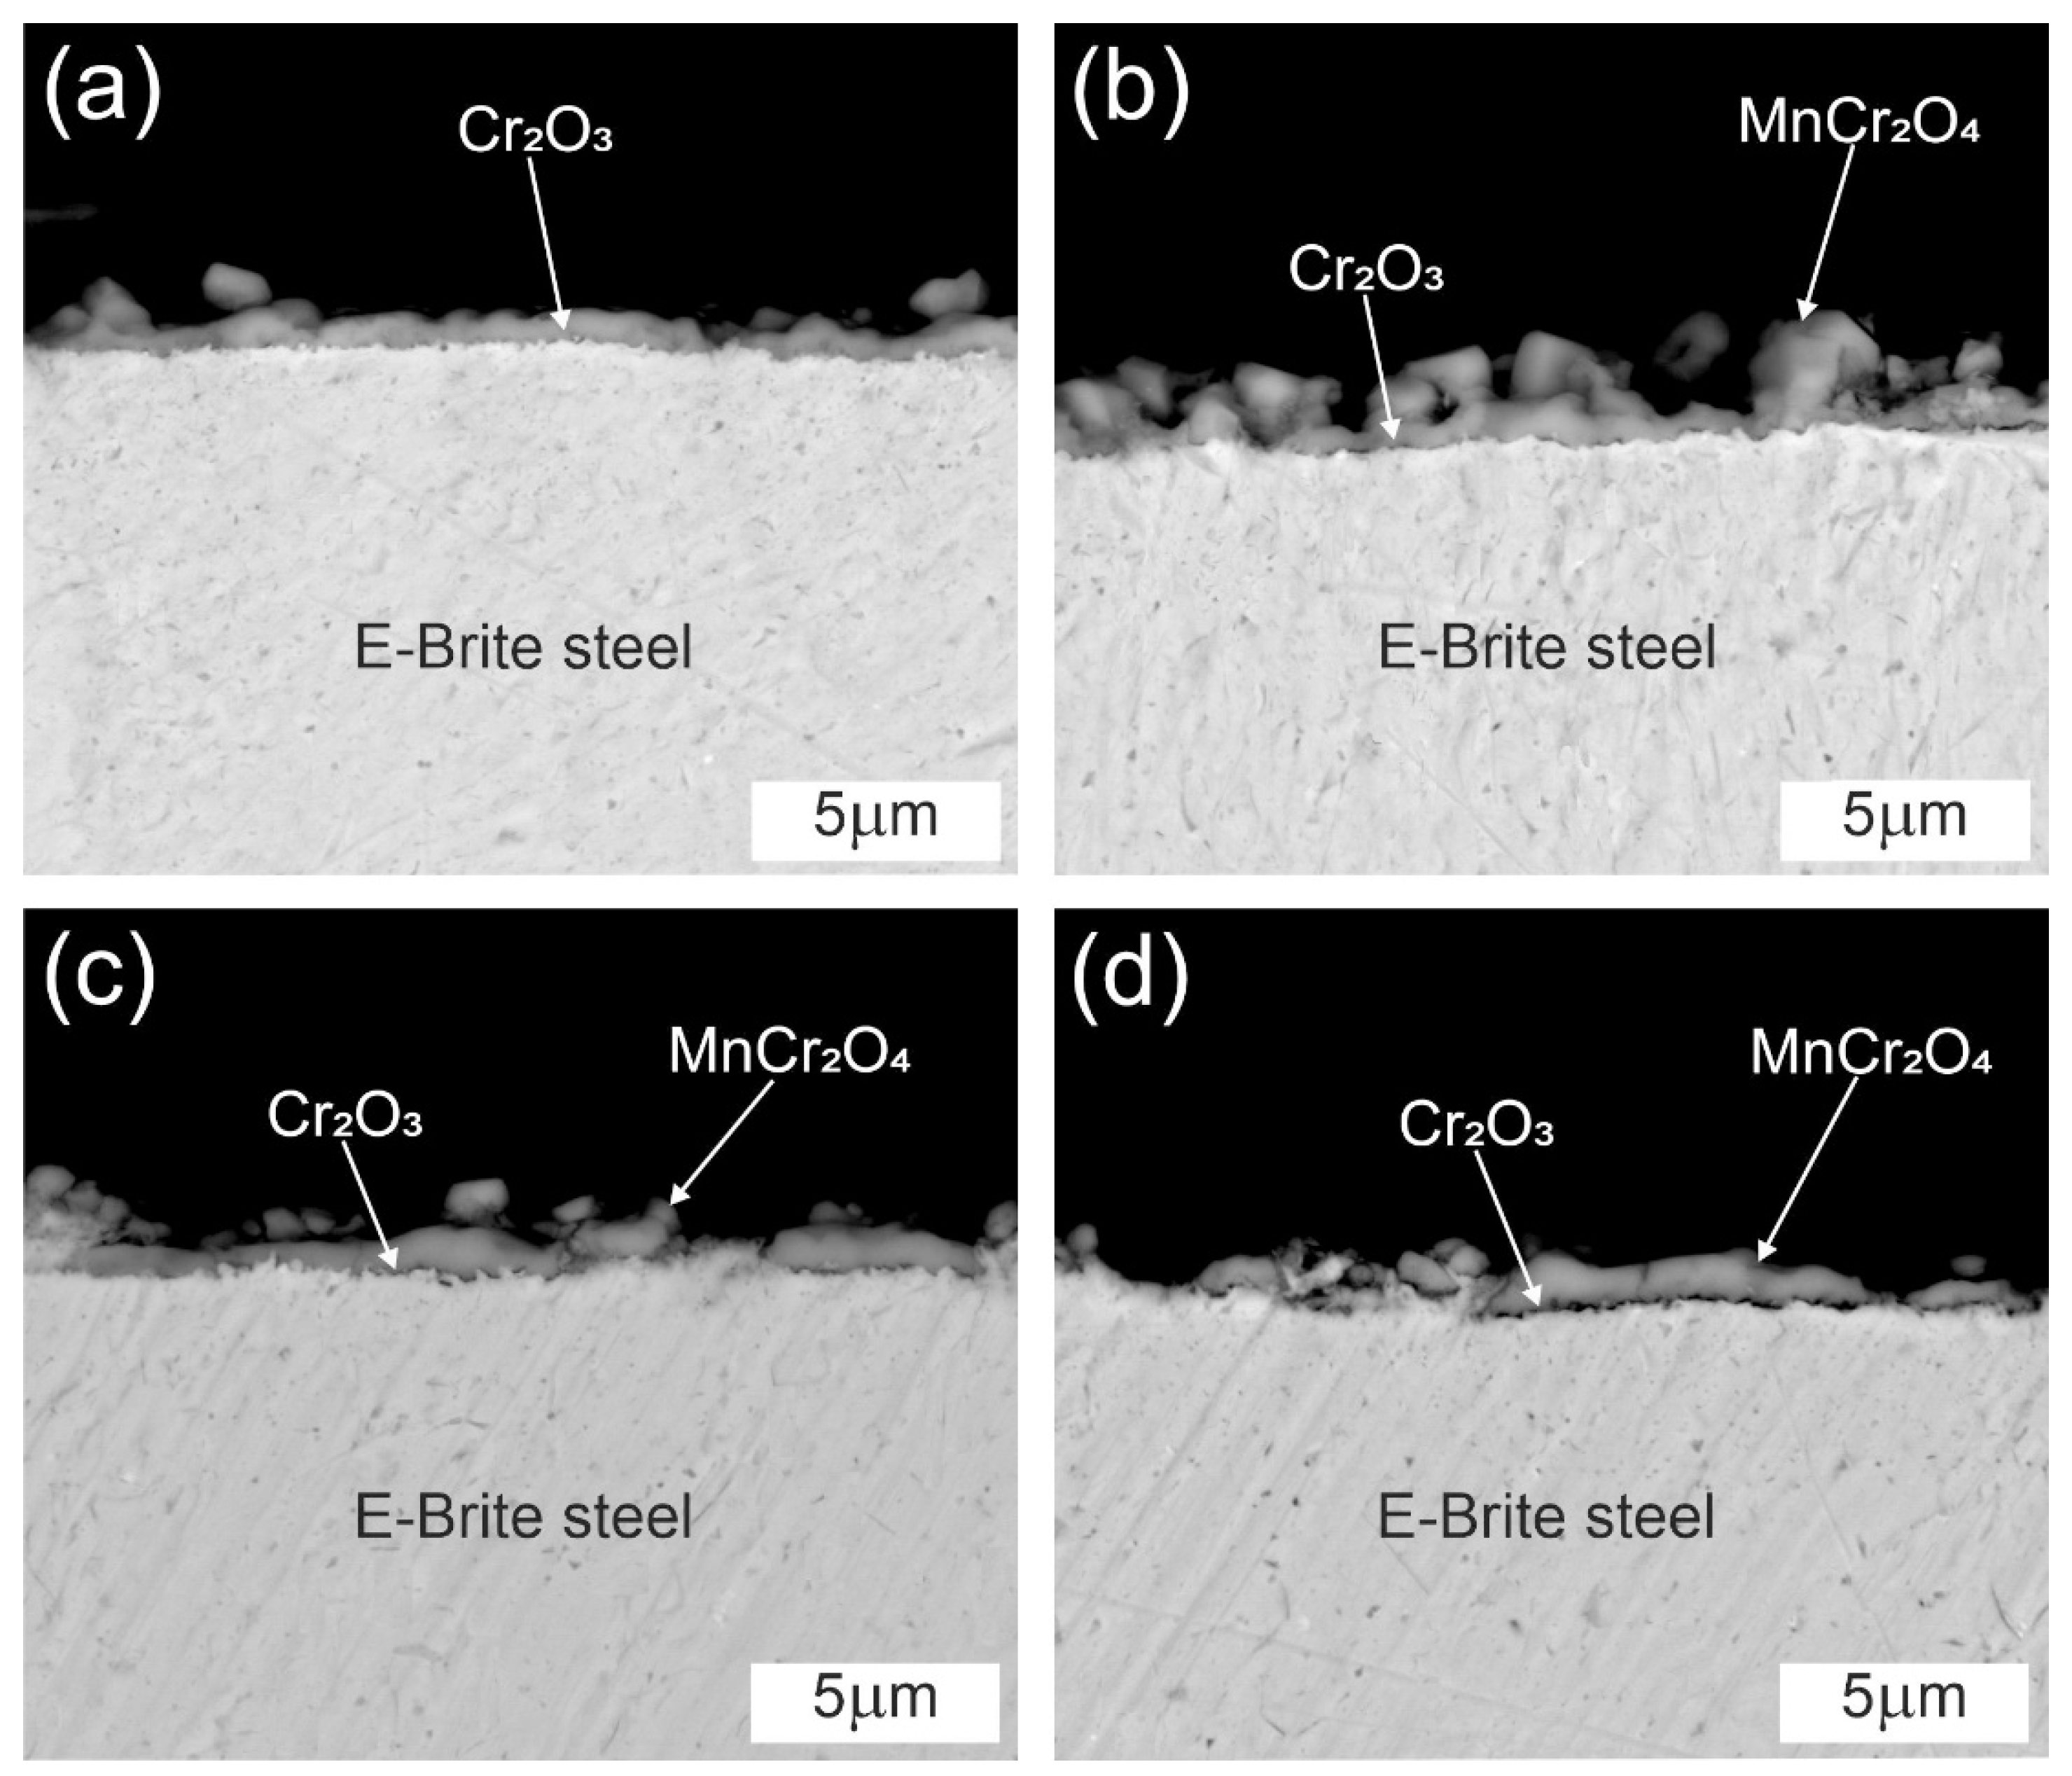
From the cross-section images obtained after steel oxidation for 255 h, it follows that the grown scale consists of one layer and is well-adherent to the metallic substrate (Figure 10a). The thickness of this scale is 0.6 μm. X-ray diffraction results (Figure 4) showed that one-layer scales also form on this steel after oxidation for 505, 760 and 1010 h. However, on the surface of the layer located near the metallic core, which consists of fine Cr2O3 grains, clusters of large MnCr2O4 spinel crystallites can be observed (Figure 10b–d). The lack of a clearly developed spinel layer is the result of very low manganese concentration inside this steel (0.05 wt.%). It should be highlighted that the discussed scales are rather well-adherent to the metallic substrate.
In summary, it can be stated that manganese addition, present in the Nirosta 4016/1.4016 steel in the amount of 0.34 wt.%, facilitates the creation of a continuous external manganese-chromium layer, the thickness of which depends on the initial concentration of that element in the steel. A layer of the aforementioned spinel limits the formation of volatile oxides and oxyhydroxides and thus inhibits the “electrode poisoning” effect. An exception to this is the E-Brite steel, on the surface of which a continuous spinel layer was not determined. It deserves to be highlighted that the scale thickness calculated on the basis of mass gains from correlation (4) remains in good accordance with the average scale thicknesses estimated from the metallographic cross-sections (Table 2).

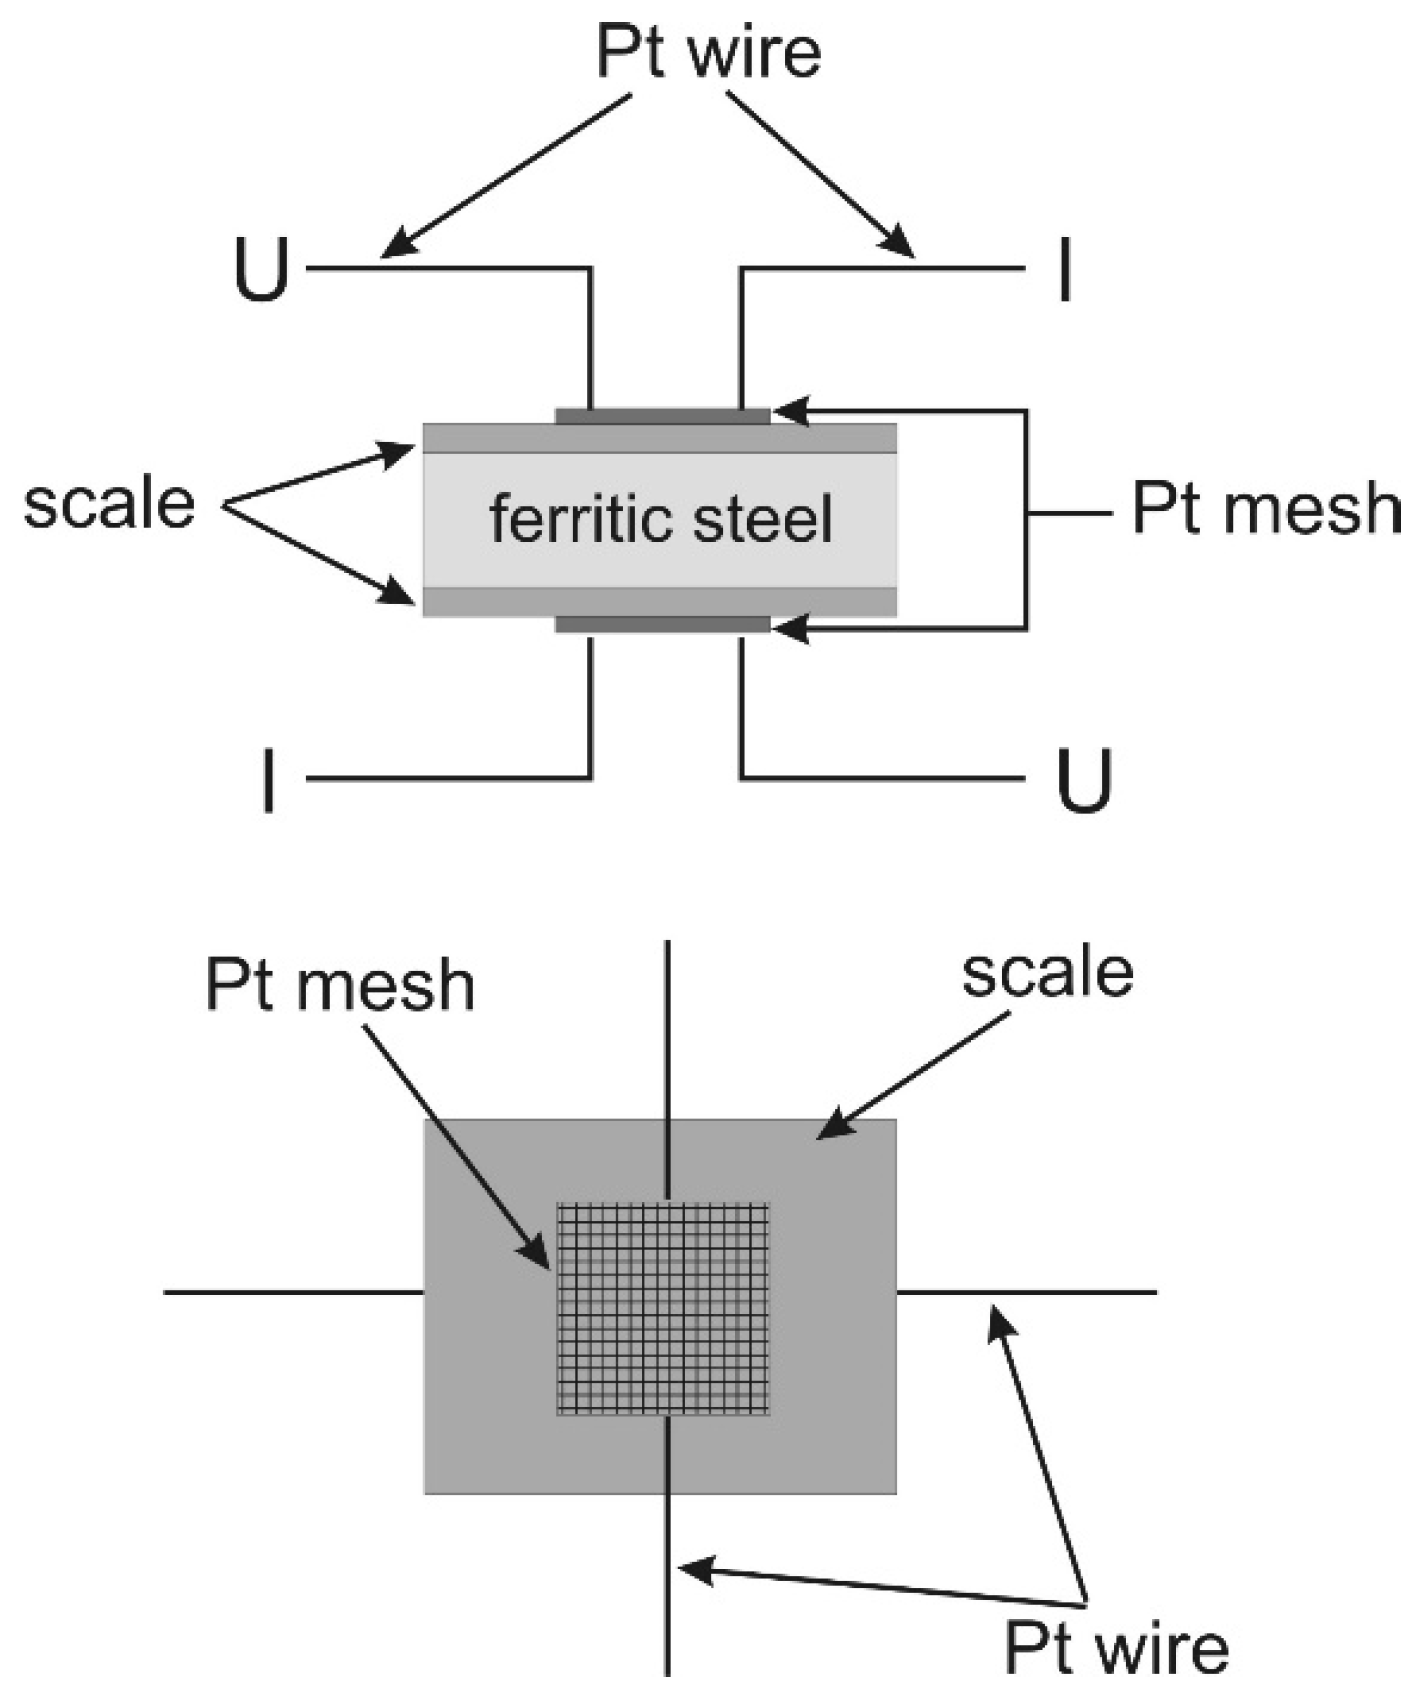
3.4. Electrical Resistance Measurements of the Steel/Scale System after Ferritic Steel Oxidation

In this subsection the results of area specific resistance measurements performed on Nirosta 4016/1.4016 and E-Brite grade ferritic steels after previous isothermal oxidation in air at 800 °C for 255, 505, 760 and 1010 h are presented. Electrical resistance measurements on steel/scale systems were carried out as a function of temperature in the 800–323 °C range in air using the four-probe method.
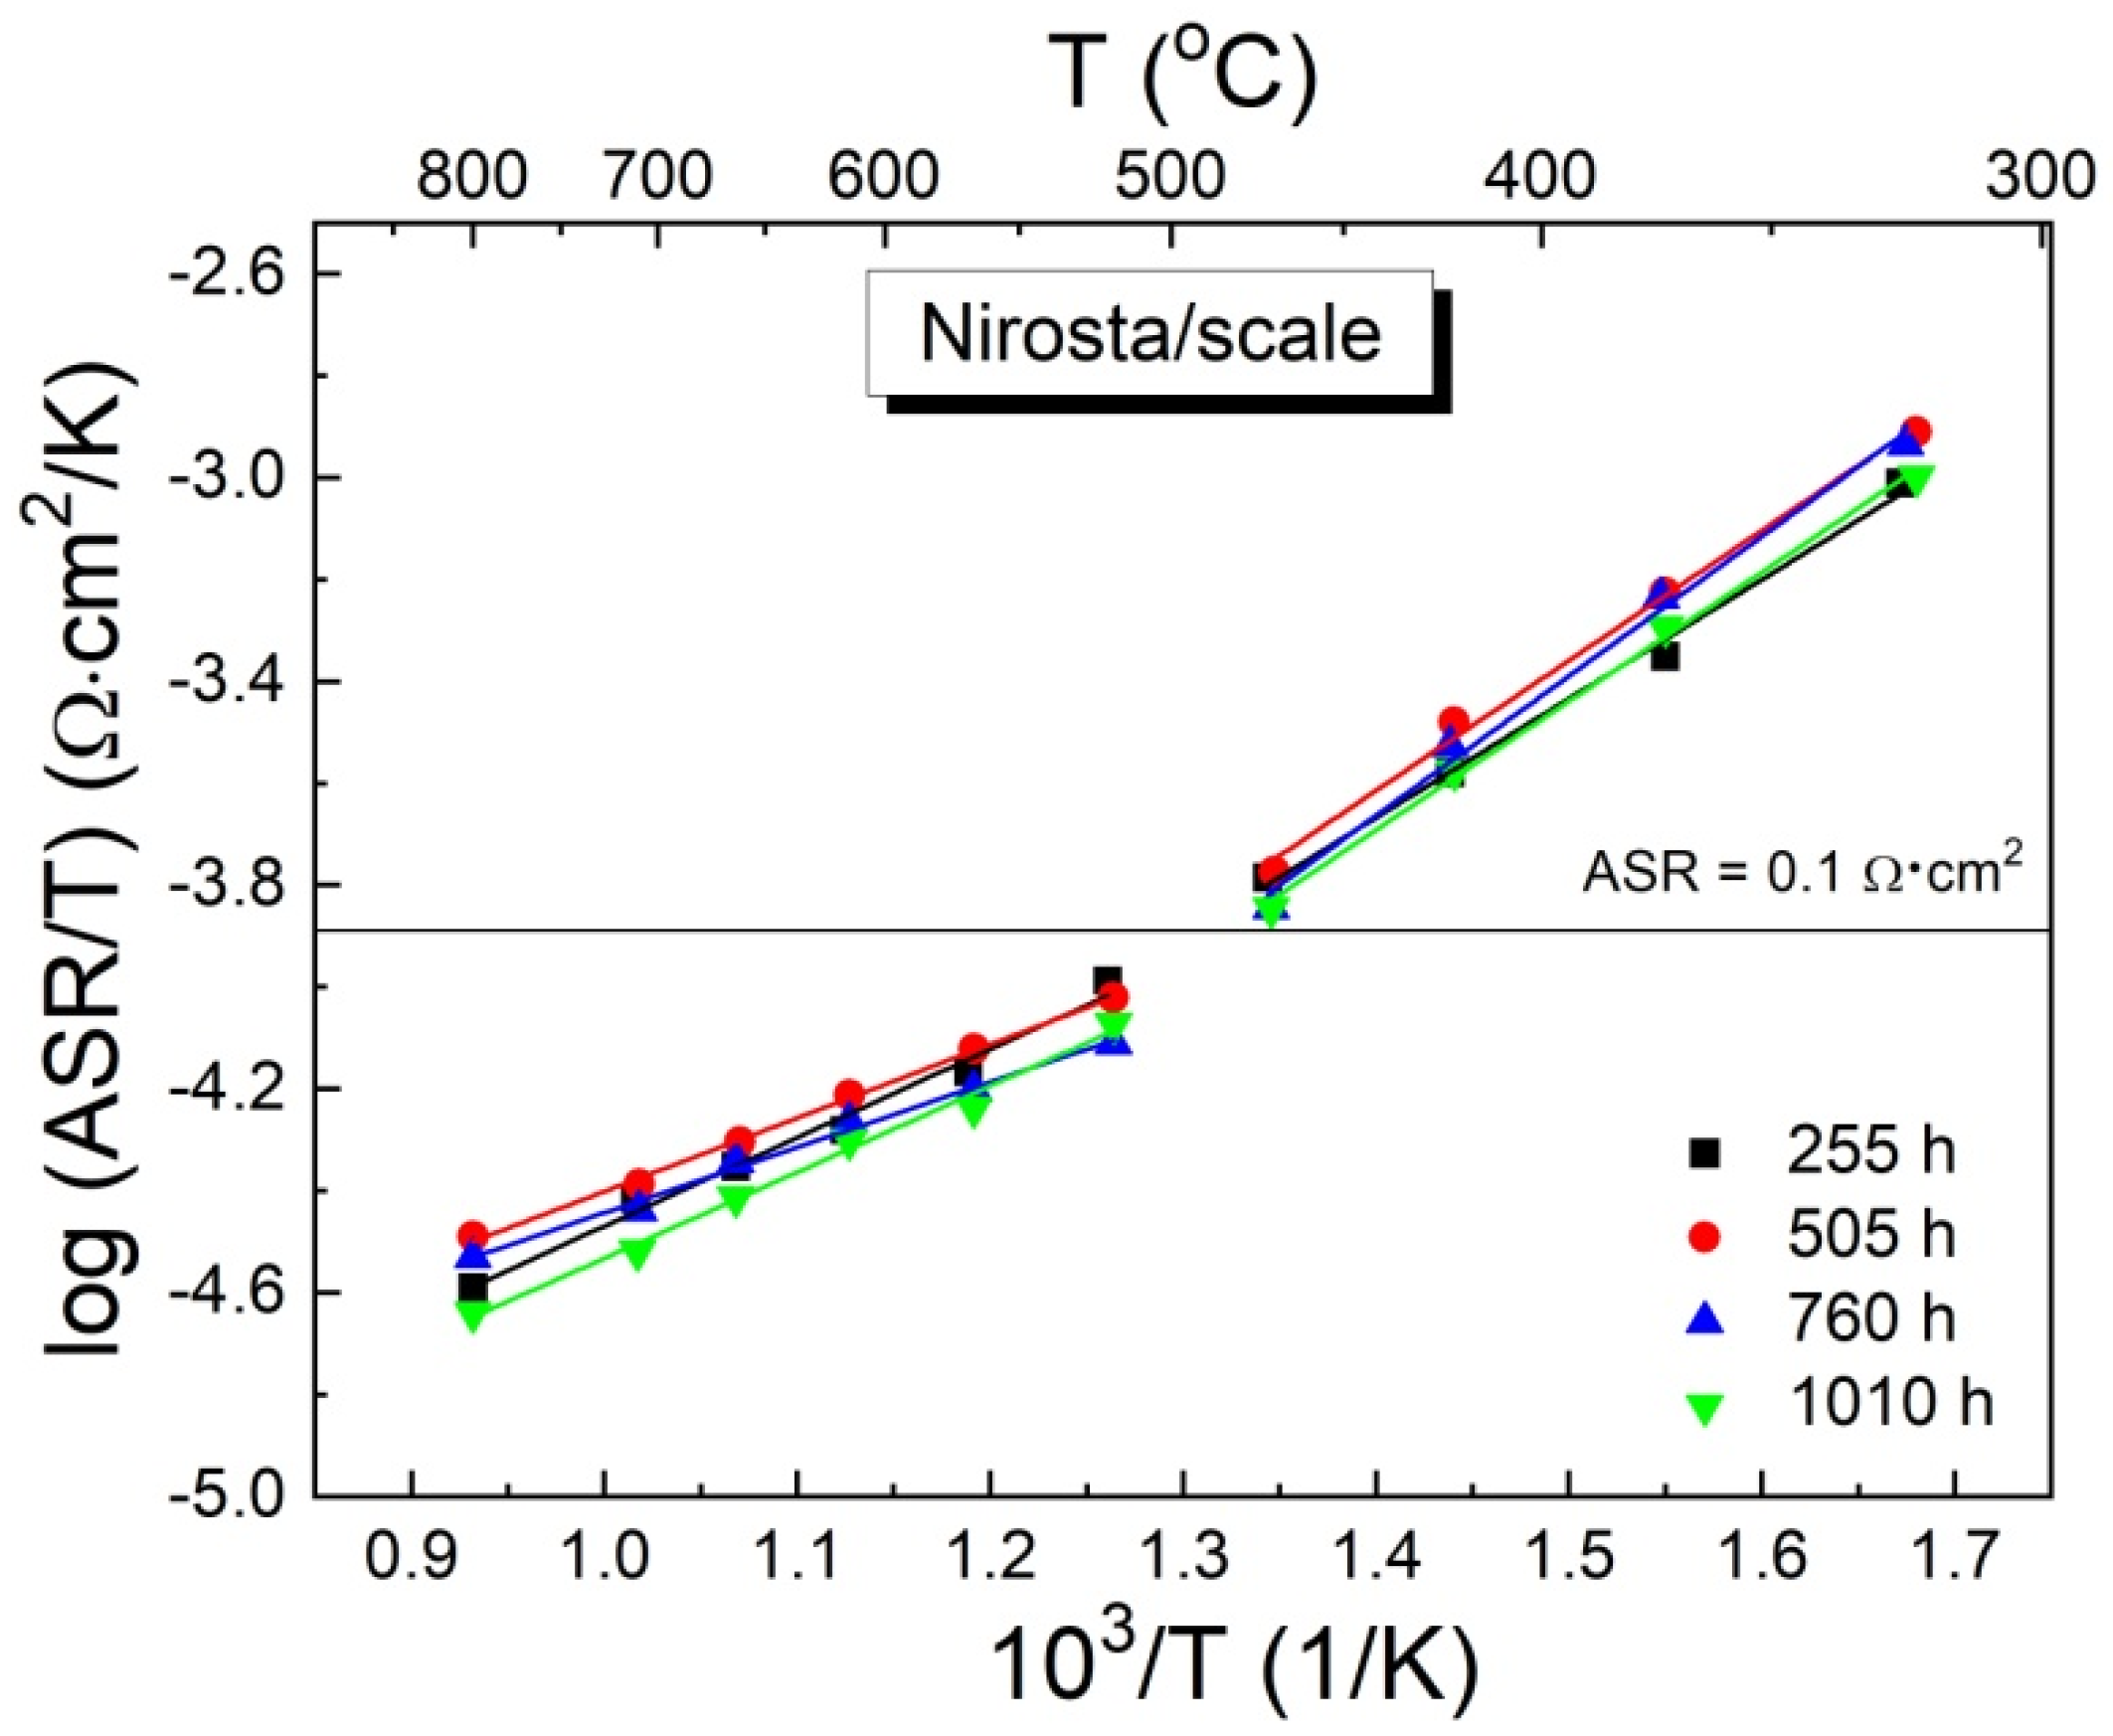
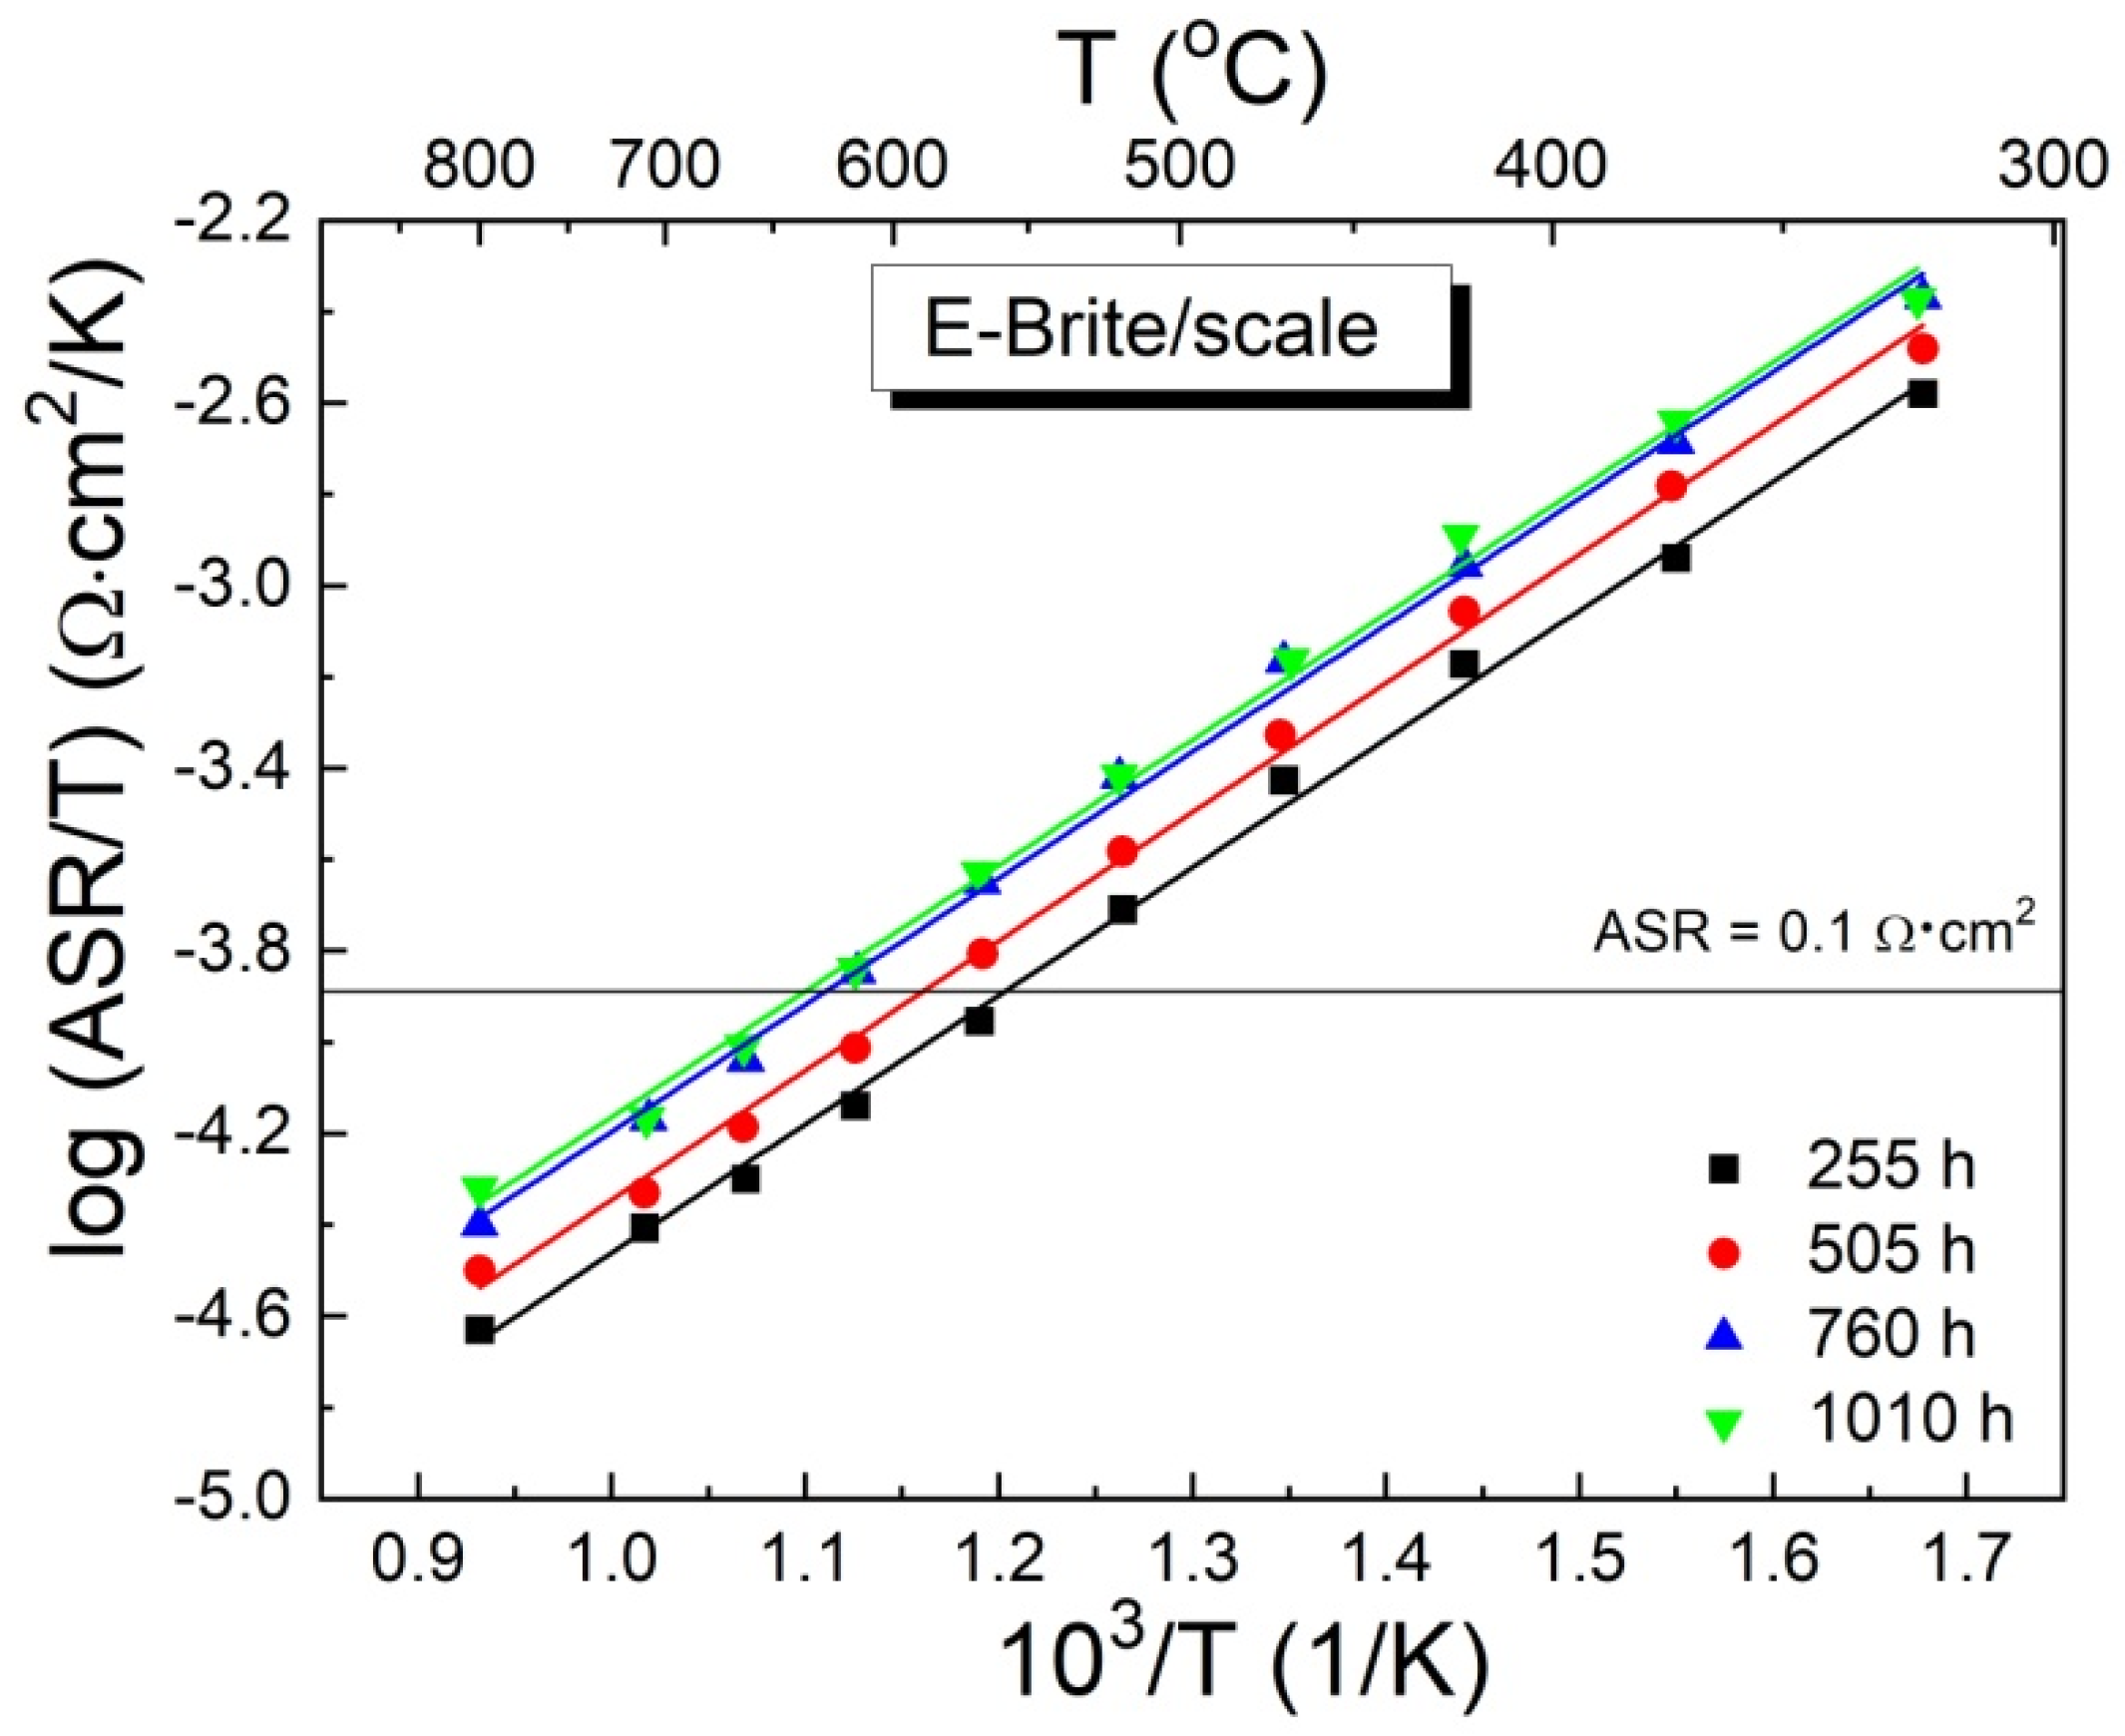
Figure 11 and Figure 12 illustrate, the temperature dependences of area specific resistance for Nirosta steel/scale and E-Brite steel/scale systems.
From both plots, a linear increase in area specific resistance along with temperature can be noticed.
Thus, the studied systems exhibit semiconductor characteristics. Assuming the mechanism of small polaron movement in the analysed steel/scale systems, their area specific resistance can be expressed in the following form:
ASR T = A   ·   exp E c kT
where: A—preexponential factor (Ω·cm2/·K), Ec—activation energy for the movement of small polarons (eV), k—Boltzmann’s constant (eV/K) and T—absolute temperature (K).
In the case of the Nirosta steel/scale layer system, a break in the log(ASR/T) = f(1/T) curves at 520 °C is observed, most likely caused by a change in the electrical conduction mechanism due to the double layer morphological build of the scales grown on the aforementioned steel during the high-temperature oxidation process. The minor differences in ASR course changes in the studied samples can be explained by the similar microstructure of the oxide scales. On the other hand, the layer system consisting of the E-Brite steel and its scale demonstrates a linear dependence throughout the entire temperature range in which studies were performed. The differences in ASR values primarily result from changes in the thickness of the layer built of Cr2O3 with a comparably minor spinel phase contribution under the assumption that the adherence of all scales grown on the E-Brite steel after interrupting the oxidation process at different times is satisfactory.
In Table 5 the area specific resistance values obtained from the studied layer systems at 800 °C are compiled along with the electrical conductivity activation energy (Ec) values determined from the linear log(ASR/T) = f(1/T) correlations for different temperature ranges depending on the type of studied system.
The electrical conductivity activation energies of the Nirosta steel/scale system in the low-temperature range (T < 520 °C) are higher than those of the aforementioned system studied at higher temperatures (T ≥ 520 °C), which should presumably be associated with the transport of charge carriers along Cr2O3 grain boundaries. In the low-temperature range, the highest activation energy was achieved by the steel/scale layer system obtained after oxidation for 760 h, whereas the lowest was after 255 h oxidation. Conversely, in the high-temperature range the previously mentioned changes in activation energy values were observed for samples oxidized for 255 and 760 h, respectively. In the case of the E-Brite steel/scale system, the conduction activation energy values are practically at a comparable level. This highlights the fact that the higher the activation energy value, the lower the area specific resistance of the E-Brite steel/scale system.
From the data, it can furthermore be concluded that the area specific resistance values for the Nirosta steel/scale system at 800 °C are at a similar level, whereas in the case of the E-Brite steel/scale system—they slightly increase along with the oxidation time of the studied steel. It should also be mentioned that the ASR value of the E-Brite steel/scale layer system obtained after 1010 h oxidation remains in good agreement with the data presented in [13], from which it follows that the E-Brite steel exhibits an ASR level below 50 mA/cm2 after 1200 h oxidation in air.
In the case of the investigated the Nirosta steel/scale layer systems, which were first subjected to oxidation for different periods of time, the ASR values obtained above 520 °C do not exceed the resistance level of ASR < 0.1 Ω·cm2 required for interconnect materials when constructing SOFC and SOEC stacks [4]. On the other hand, the ASR values measured for the E-Brite steel/scale systems did not exceed the previously mentioned level in the temperature range of 567–661 °C depending on the duration of their previous oxidation.
In order to emphasise the differences in electrical conductivity of both studied steel/scale layer systems, a plot of the ln (σz·T) = f(1/T) correlation was prepared based on the following equation:
σ z = σ 0 T   ·   exp E c kT
where: σz—scale conduction (1/Ω·cm), σo—preexponential factor (1/Ω·cm·K), Ec—activation energy for small polaron movement (polaron migration enthalpy) (eV).
For this purpose, the measurement data in the form of area specific resistance (Figure 11 and Figure 12) was converted into electrical conductivity expressed in S·(K/cm), while using knowledge of the scale thicknesses determined by means of the metallographic method listed in Table 2. This value is called “apparent electrical conductivity” because the obtained scale is multi-phase systems.
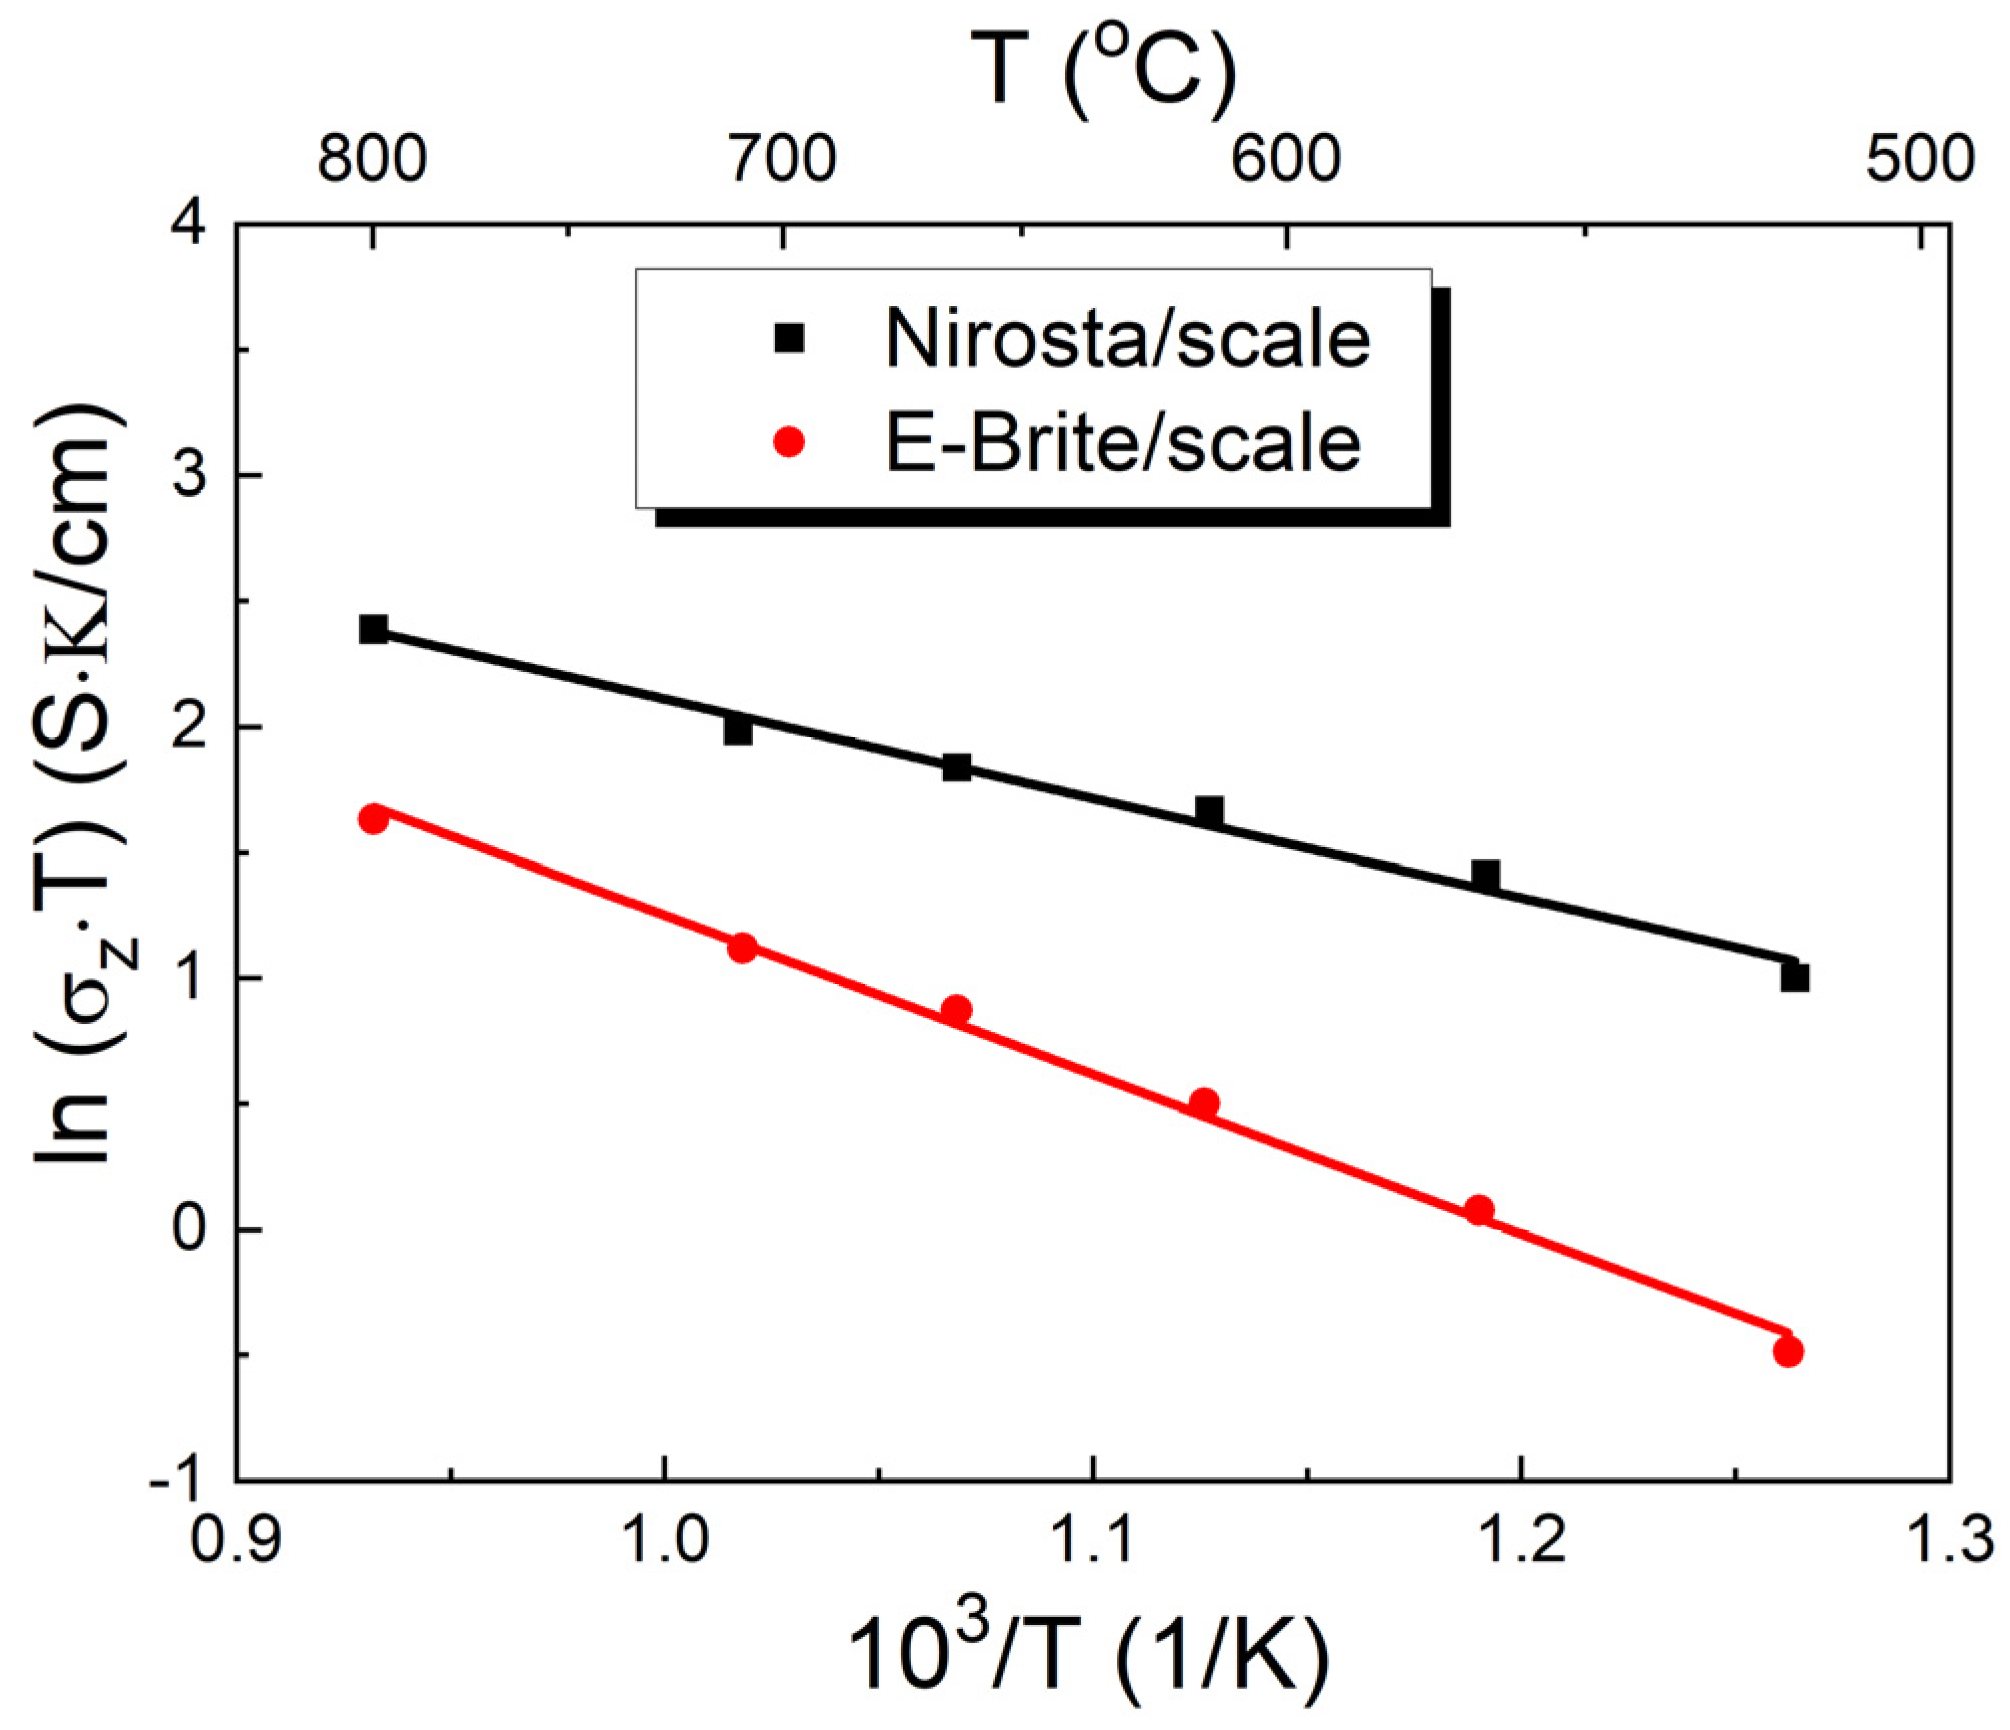
Figure 13 presents electrical conductivity (σz·T) changes in an Arrhenius system as a function of temperature for Nirosta steel/scale and E-Brite steel/scale systems in the air in the temperature range 520–800 °C.
In order to prepare this plot, ASR measurement data from the 520–800 °C range exclusively was used for steel/scale systems oxidized at 800 °C for 1010 h in air. The temperature dependence of “apparent electrical conductivity” for the studied systems is linear. This indicates that electrical current conduction in steel/scale systems occurs in accordance with the assumed model of small polaron movement in a chromium (III) oxide crystalline lattice. The electrical conductivity activation energy of the Nirosta steel/scale system (Ec = 0.29 eV), determined on the basis of correlation (7), is lower than the Ec values for the E-Brite steel/scale system (Ec = 0.49 eV).
From the data presented in Figure 13, it follows that the scale grown on the Nirosta 4016/1.4016 steel exhibits higher electrical conductivity in the entire temperature range compared to the scale formed on E-Brite ferritic steel under the same oxidizing conditions. This effect can be explained by the conductivity of the manganese-chromium spinel, one of the components of the scale grown on the Nirosta steel, being reported as at least one order of magnitude higher than that of chromium oxide, which, in turn, is practically the only oxidation product on the E-Brite steel [20].
The results of these studies indicate the usefulness of the Nirosta 4016/1.4016 ferritic steel as a potential construction material for creating metallic interconnects in SOFCs or SOECs designated for operation at 800 °C.

4. Conclusions

  • On the basis of Nirosta 4016/1.4016 and E-Brite grade ferritic steel sample mass gains at 800 °C in the air after 255, 505, 760 and 1010 h, the kinetics of isothermal oxidation were identified. It was determined that scale growth on these steels proceeds according to the parabolic oxidation rate law. The scale increase on the Nirosta steel in the aforementioned conditions was faster compared to the E-Brite steel corrosion rate.
  • Morphological observations along with chemical and phase composition analysis of the products on the studied ferritic steels after their oxidation demonstrated that, in the case of the Nirosta steel, a dual-layer scale forms consisting of Cr2O3 and a MnCr2O4 spinel that constitutes the external layer. As the oxidation time of this steel increases, a systematic increase in the mass fraction of the spinel phase is observed. On the other hand, a practically one-layer scale built of Cr2O3 grows on the E-Brite steel. On the surface of this scale, the presence of manganese-chromium precipitates was determined. The adherence of the discussed scales to the metallic substrate is satisfactory. The presence of several SiO2 precipitates was also determined beneath the Cr2O3 layer at the steel/scale interface in the case of the Nirosta 4016/1.4016 steel.
  • Electrical resistance measurements performed on Nirosta steel/scale and E-Brite steel/scale layer systems in the temperature range 800–323 °C showed that the area specific resistance of the system consisting of the scale formed on the Nirosta steel is lower than that of the E-Brite steel/scale layer system, in spite of the fact that the thickness of the scale grown on the Nirosta steel exceeds that of Cr2O3 formed on the E-Brite steel. This is due to the higher electrical conductivity of MnCr2O4 compared to that of Cr2O3. On the basis of the above-presented experimental results the usefulness of the Nirosta 4016/1.4016 ferritic steel as a potential material for creating metallic interconnects for solid oxide fuel cells (SOFCs) or solid oxide electrolyzer cells (SOECs) designated for operation at 800 °C was determined.

Author Contributions

Conceptualization, T.B. and J.D.; methodology, M.P. and T.B.; software, J.D. and R.G.; validation, M.P., T.B. and J.D.; formal analysis, T.B. and J.D.; investigation, J.D. and R.G.; resources, J.D. and T.B.; data curation, J.D. and R.G.; writing-original draft preparation, R.G., T.B. and J.D.; writing—review and editing, T.B., J.D., M.P. and R.G.; visualization, M.P., J.D. and T.B.; supervision, R.G.; project administration, R.G. All authors have read and agreed to the published version of the manuscript.

Funding

This research received no external funding.

Data Availability Statement

Data available on request.

Acknowledgments

This work was supported from the subsidy of the Ministry of Education and Science for the AGH University of Science and Technology in Kraków (Project No 16.16.160.557).

Conflicts of Interest

The authors declare no conflict of interest.

References

  1. Sreedhar, I.; Agarwal, B.; Goyal, P.; Singh, S.A. Recent advances in material and performance aspects of solid oxide fuel cells. J. Electroanal. Chem. 2019, 848, 113315. [Google Scholar] [CrossRef]
  2. Nechache, A.; Hody, S. Alternative and innovative solid oxide electrolysis cell materials: A short review. Renew. Sustain. Energy Rev. 2021, 149, 111322. [Google Scholar] [CrossRef]
  3. Quadakkers, W.J.; Piron-Abellan, J.; Shemet, V.; Singheiser, L. Metallic interconnectors for solid oxide fuel cells—A review. Mater. High Temp. 2003, 20, 115–127. [Google Scholar]
  4. Zhu, W.Z.; Deevi, S.C. Development of interconnect materials for solid oxide fuel cells. Mater. Sci. Eng. A 2003, 348, 227–243. [Google Scholar] [CrossRef]
  5. Kendall, K.; Kendall, M. High-Temperature Solid Oxide Fuel Cells for the 21st Century; Elsevier: Amsterdam, The Netherlands, 2016. [Google Scholar]
  6. Niewolak, L.; Tietz, F.; Quadakkers, W.J. Interconnects. In High-Temperature Solid Oxide Fuel Cells for the 21st Century: Fundamentals, Design and Applications, 2nd ed.; Academic Press: New York, NY, USA, 2016; pp. 195–254. [Google Scholar]
  7. Fergus, J.; Hui, R.; Li, X.; Wilkinson, D.P.; Zhang, J. Interconnects. In Solid Oxide Fuel Cells—Materials Properties and Performance; CRC Press: Boca Raton, FL, USA, 2016; pp. 195–228. [Google Scholar]
  8. Brylewski, T.; Nanko, M.; Maruyama, T.; Przybylski, K. Application of Fe-16Cr ferritic alloy to interconnector for a solid oxide fuel cell. Solid State Ion. 2001, 143, 131–150. [Google Scholar] [CrossRef]
  9. Hilpert, K.; Das, D.; Miller, M.; Peck, D.H.; Weiss, R. Chromium Vapor Species over Solid Oxide Fuel Cell Interconnect Materials and Their Potential for Degradation Processes. J. Electrochem. Soc. 1996, 143, 3642–3647. [Google Scholar] [CrossRef]
  10. Jiang, S.P.; Chen, X. Chromium deposition and poisoning of cathodes of solid oxide fuel cells—A review. Int. J. Hydrogen Energy 2014, 39, 505–531. [Google Scholar] [CrossRef]
  11. Hojda, R.; Heimann, W.; Quadakkers, W.J. Production-capable materials concept for high-temperature fuel cells. ThyssenKrupp Techforum 2003, 20–23. [Google Scholar]
  12. Piron-Abellan, J.; Tietz, F.; Shemet, V.; Gil, A.; Ladwein, T.; Singheiser, L.; Quadakkers, W.J. Proceedings 5th European Solid Oxide Fuel Cell Forum, Lucerne, Switzerland, 1–5 July 2002; Huijsmans, J., Ed.; The European Fuel Cell Forum: Oberrohrdorf, Switzerland, 2002. [Google Scholar]
  13. Fergus, J.W. Metallic Interconnects for Solid Oxide Fuel Cells. Mater. Sci. Eng. A 2005, A397, 271–283. [Google Scholar] [CrossRef]
  14. Brylewski, T. Metallic Interconnects in a Metal/Ceramics System for Application in Solid Oxide Fuel Cells, Papers of the Commision on Ceramic Science Polish Ceramic Bulletin, Ceramics; Wydawnictwo Naukowe “Akapit”: Kraków, Poland, 2008; Volume 107. (In Polish) [Google Scholar]
  15. Mrowec, S. Zarys Teorii Utleniania Metali; Wydawnictwo Śląsk: Katowice, Poland, 1971. [Google Scholar]
  16. Chen, X.; Hou, P.Y.; Jacobson, C.P.; Visco, S.J.; Jonghe, L.C.D. Protective coating on stainless steel interconnect for SOFCs: Oxidation kinetics and electrical properties. Solid State Ion. 2005, 176, 425–433. [Google Scholar] [CrossRef]
  17. Available online: www.webelements.com (accessed on 17 May 2023).
  18. Cox, M.G.E.; McEnanay, B.; Scott, V.D. A chemical diffusion model for partitioning of transition elements in oxide scales on alloys. Philos. Mag. 1972, 26, 839–851. [Google Scholar] [CrossRef]
  19. Huang, K.; Hou, P.Y.; Goodenough, J.B. Reduced area specific resistance for iron-based metallic interconnects by surface oxide coatings. Mater. Res. Bull. 2001, 59, 81–95. [Google Scholar] [CrossRef]
  20. Stanislowski, M.; Froitzheim, J.; Niewolak, L.; Quadakkers, W.J.; Hilpert, K.; Markus, T.; Singheiseret, L. Reduction of chromium vaporization from SOFC interconnectors by highly effective coatings. J. Power Sources 2007, 164, 578–589. [Google Scholar] [CrossRef]
Figure 1. The idea behind measuring the area specific resistance of layer systems.
Crystals 13 00862 g001
Figure 2. Oxidation kinetics courses of Nirosta 4016/1.4016 and E-Brite grade ferritic steels at 800 °C in air for 1010 h in a: (a) linear and (b) parabolic system of coordinates.
Crystals 13 00862 g002
Figure 3. X-ray diffraction patterns of the products formed on Nirosta 4016/1.4016 ferritic steel after oxidation at 800 °C for 255, 505, 760 and 1010 h.
Crystals 13 00862 g003
Figure 4. X-ray diffraction patterns of the products formed on E-Brite ferritic steel after oxidation at 800 °C for 255, 505, 760 and 1010 h.
Crystals 13 00862 g004
Figure 5. SEM microphotographs of the scale surfaces grown on Nirosta 4016/1.4016 steel after oxidation at 800 °C for: (a) 255, (b) 505, (c) 760 and (d) 1010 h.
Crystals 13 00862 g005
Figure 6. SEM microphotograph of the surface of the scale grown on Nirosta 4016/1.4016 steel after oxidation at 800 °C for 505 h with EDS quantitative point analyses from areas “1” and “2”.
Crystals 13 00862 g006
Figure 7. SEM surface microphotographs of the scale surfaces grown on E-Brite steel after oxidation at 800 °C for: (a) 255, (b) 505, (c) 760 and (d) 1010 h.
Crystals 13 00862 g007
Figure 8. SEM cross-section microphotographs of the scales grown on Nirosta 4016/1.4016 steel after oxidation at 800 °C for: (a) 255, (b) 505, (c) 760 and (d) 1010 h.
Crystals 13 00862 g008
Figure 9. SEM cross-section microphotographs formed on Nirosta 4016/1.4016 steel after oxidation at 800 °C for 760 h with EDS quantitative point analyses from areas “1”, “2”, “3” and “4”.
Crystals 13 00862 g009
Figure 10. SEM cross-section microphotographs of scales grown on E-Brite steel after oxidation at 800 °C for: (a) 255, (b) 505, (c) 760 and (d) 1010 h.
Crystals 13 00862 g010
Figure 11. Temperature dependence of area specific resistance in an Arrhenius system for Nirosta steel/scale layer systems after oxidation at 800 °C in air for different durations of time.
Crystals 13 00862 g011
Figure 12. Temperature dependence of area specific resistance in an Arrhenius system for E-Brite steel/scale layer systems after oxidation at 800 °C in air for different durations of time.
Crystals 13 00862 g012
Figure 13. Temperature dependence of “apparent electrical conductivity” for the Nirosta/scale and E-Brite/scale systems in the range of 520–800 °C in air.
Crystals 13 00862 g013
Table 1. Chemical composition of the ferritic steels (wt.%).
CrMnSiNiMoCPN
Nirosta
4016/1.4016
16.2810.3390.3550.354-0.050.0180.036
E-Brite26.00.050.20.151.00.0020.01-
Table 2. Scale thicknesses of the samples estimated from gravimetric measurements and morphological observations.
Grade of SteelTime (h)Scale Thickness (μm)
Gravimetric MethodMetallographic Method
Nirosta
4016/1.4016
2551.41.4 ± 0.2
5052.01.7 ± 0.5
7602.52.3 ± 0.6
10102.92.8 ± 0.4
E-Brite2550.70.6 ± 0.2
5051.00.9 ± 0.3
7601.21.0 ± 0.5
10101.41.2 ± 0.5
Table 3. Parabolic rate constants of Nirosta 4016/1.4016 and E-Brite steels obtained from oxidation at 800 °C in air for 1010 h.
Grade of SteelParabolic Rate Constants
kp (g2/cm4·s)kp,ef (μm2/s)
Nirosta 4016/1.40166.05 × 10−141.12 × 10⁻⁶
E-Brite1.51 × 10−142.79 × 10⁻⁷
Table 4. Relative mass fraction of the Nirosta 4016/1.4016 and E-Brite steel products after oxidation at 800 °C in air for 255, 505, 760 and 1010 h.
Grade of SteelDuration (h)Phase Mass Fraction (%)
Cr2O3MnCr2O4
Nirosta
4016/1.4016
25570.528.5
50552.747.3
76039.760.3
101037.962.1
E-Brite255100-
50596.53.5
76096.23.8
101097.22.8
Table 5. ASR values at 800 °C and Ec of steel/scale layer systems after oxidation at 800 °C in air for different durations.
Type of Studied
Layer System
Oxidation Time (h)ASR
at 800 °C
(Ω·cm2)
Ec (eV)
T = 323–800 °CT ≥ 520 °CT < 520 °C
Nirosta/scale2550.028-0.347 ± 0.0190.462 ± 0.027
5050.035-0.290 ± 0.0070.510 ± 0.027
7600.032-0.258 ± 0.0090.557 ± 0.031
10100.025-0.340 ± 0.0150.507 ± 0.022
E-Brite/scale2550.0250.558 ± 0.010--
5050.0340.560 ± 0.011--
7600.0430.550 ± 0.011--
10100.0480.550 ± 0.012--
Disclaimer/Publisher’s Note: The statements, opinions and data contained in all publications are solely those of the individual author(s) and contributor(s) and not of MDPI and/or the editor(s). MDPI and/or the editor(s) disclaim responsibility for any injury to people or property resulting from any ideas, methods, instructions or products referred to in the content.

