

Effect of Liquid-Solid Volume Ratio and Surface Treatment on Microstructure and Properties of Cu/Al Bimetallic Composite

Abstract
:1. Introduction
2. Materials and Methods
3. Results and Discussion
3.1. Effect of Liquid–Solid Volume Ratio on the Microstructure and Properties of Cu/Al Bimetallic Composite
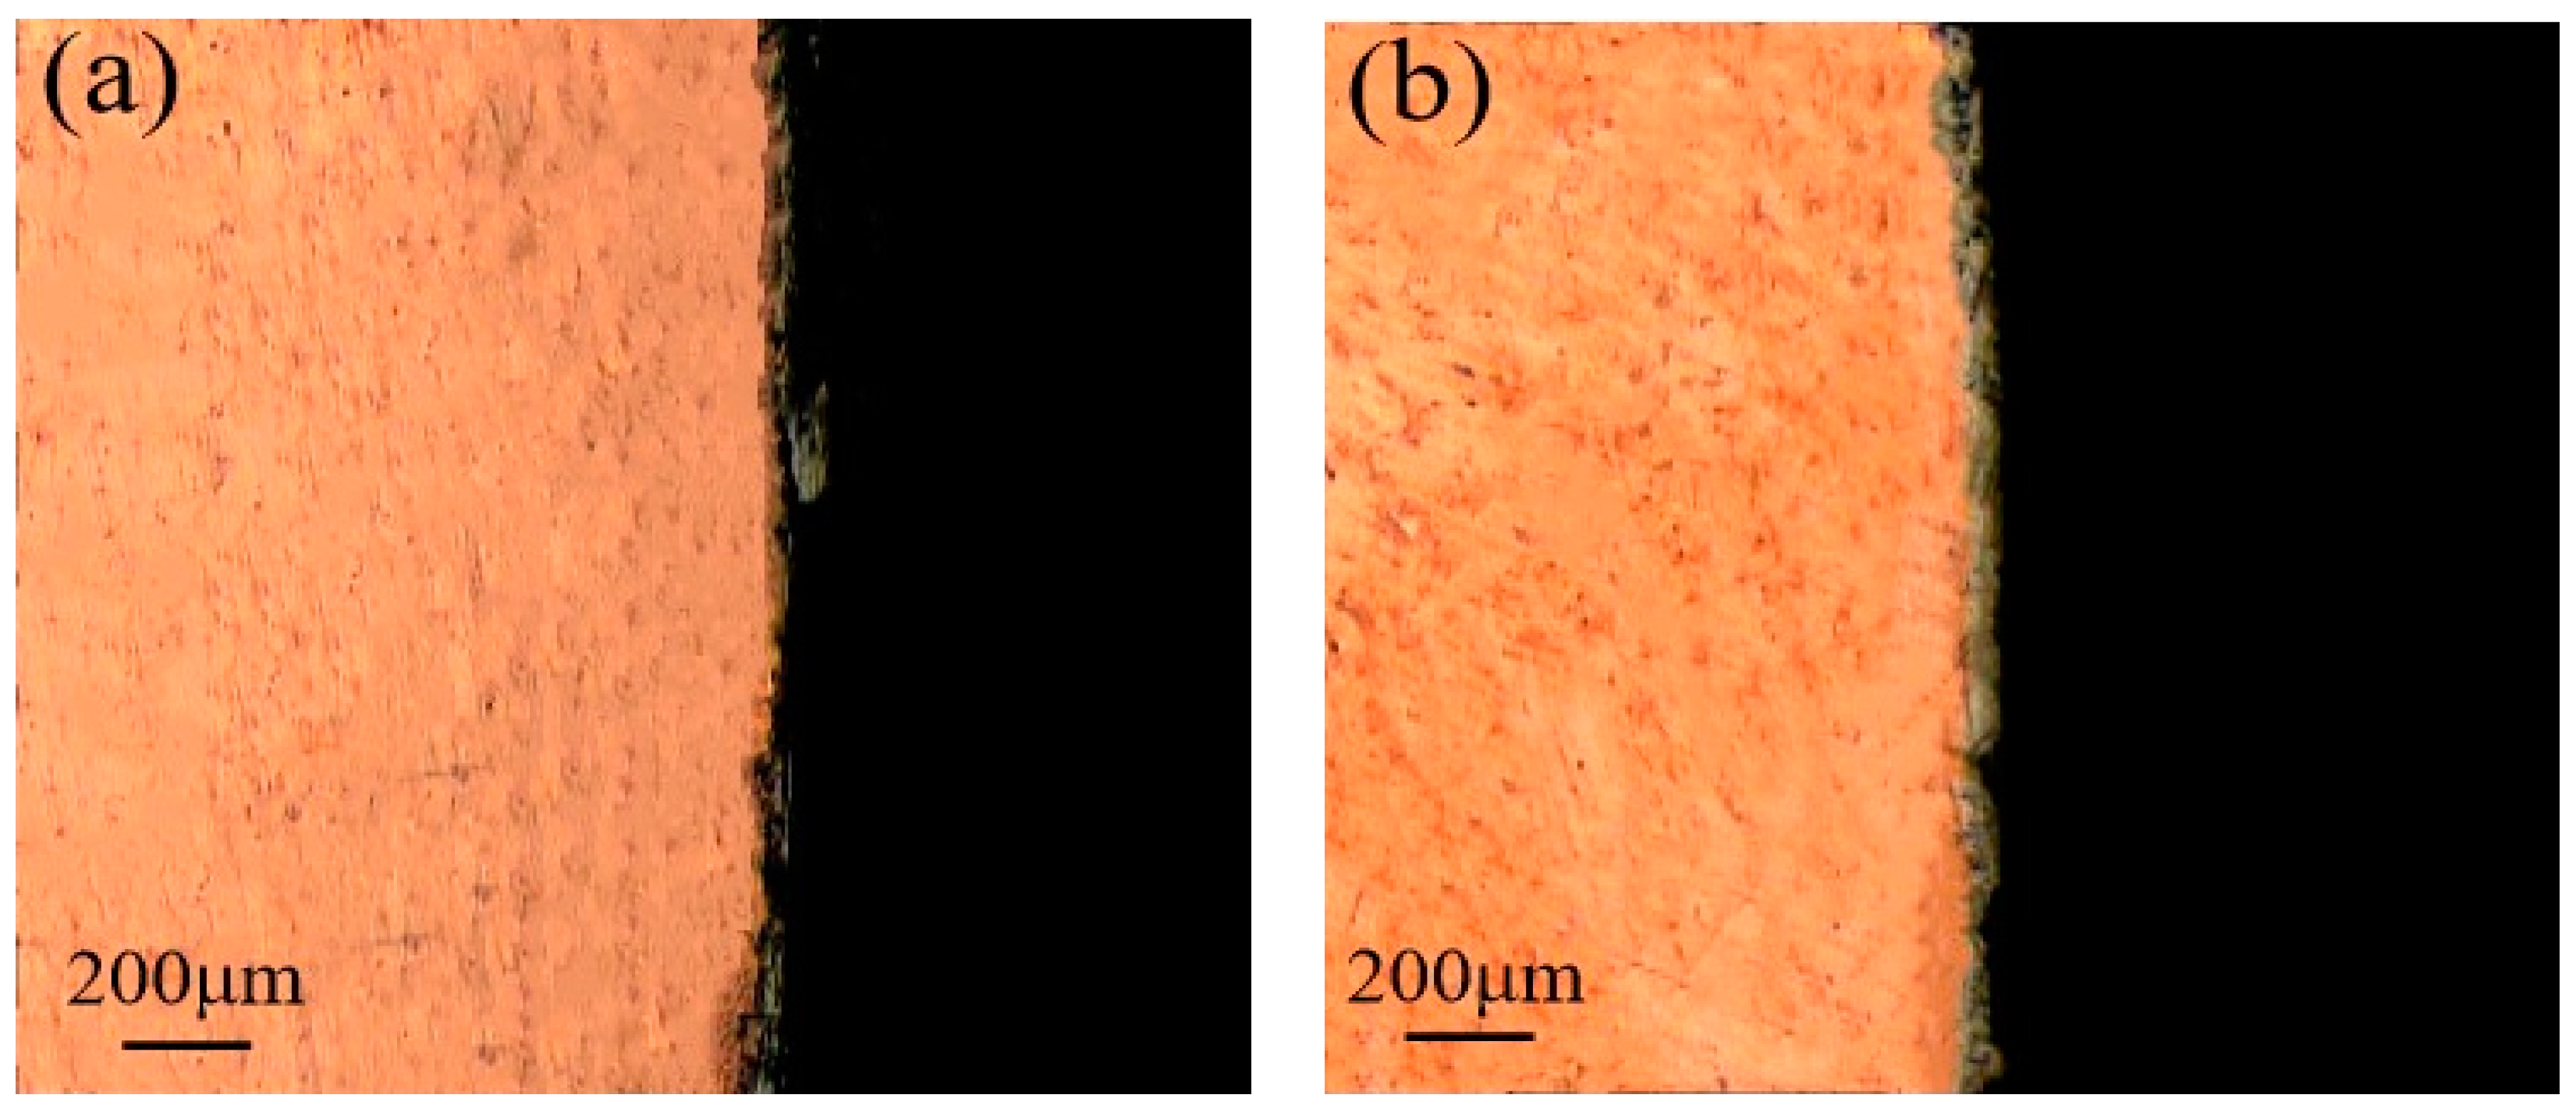
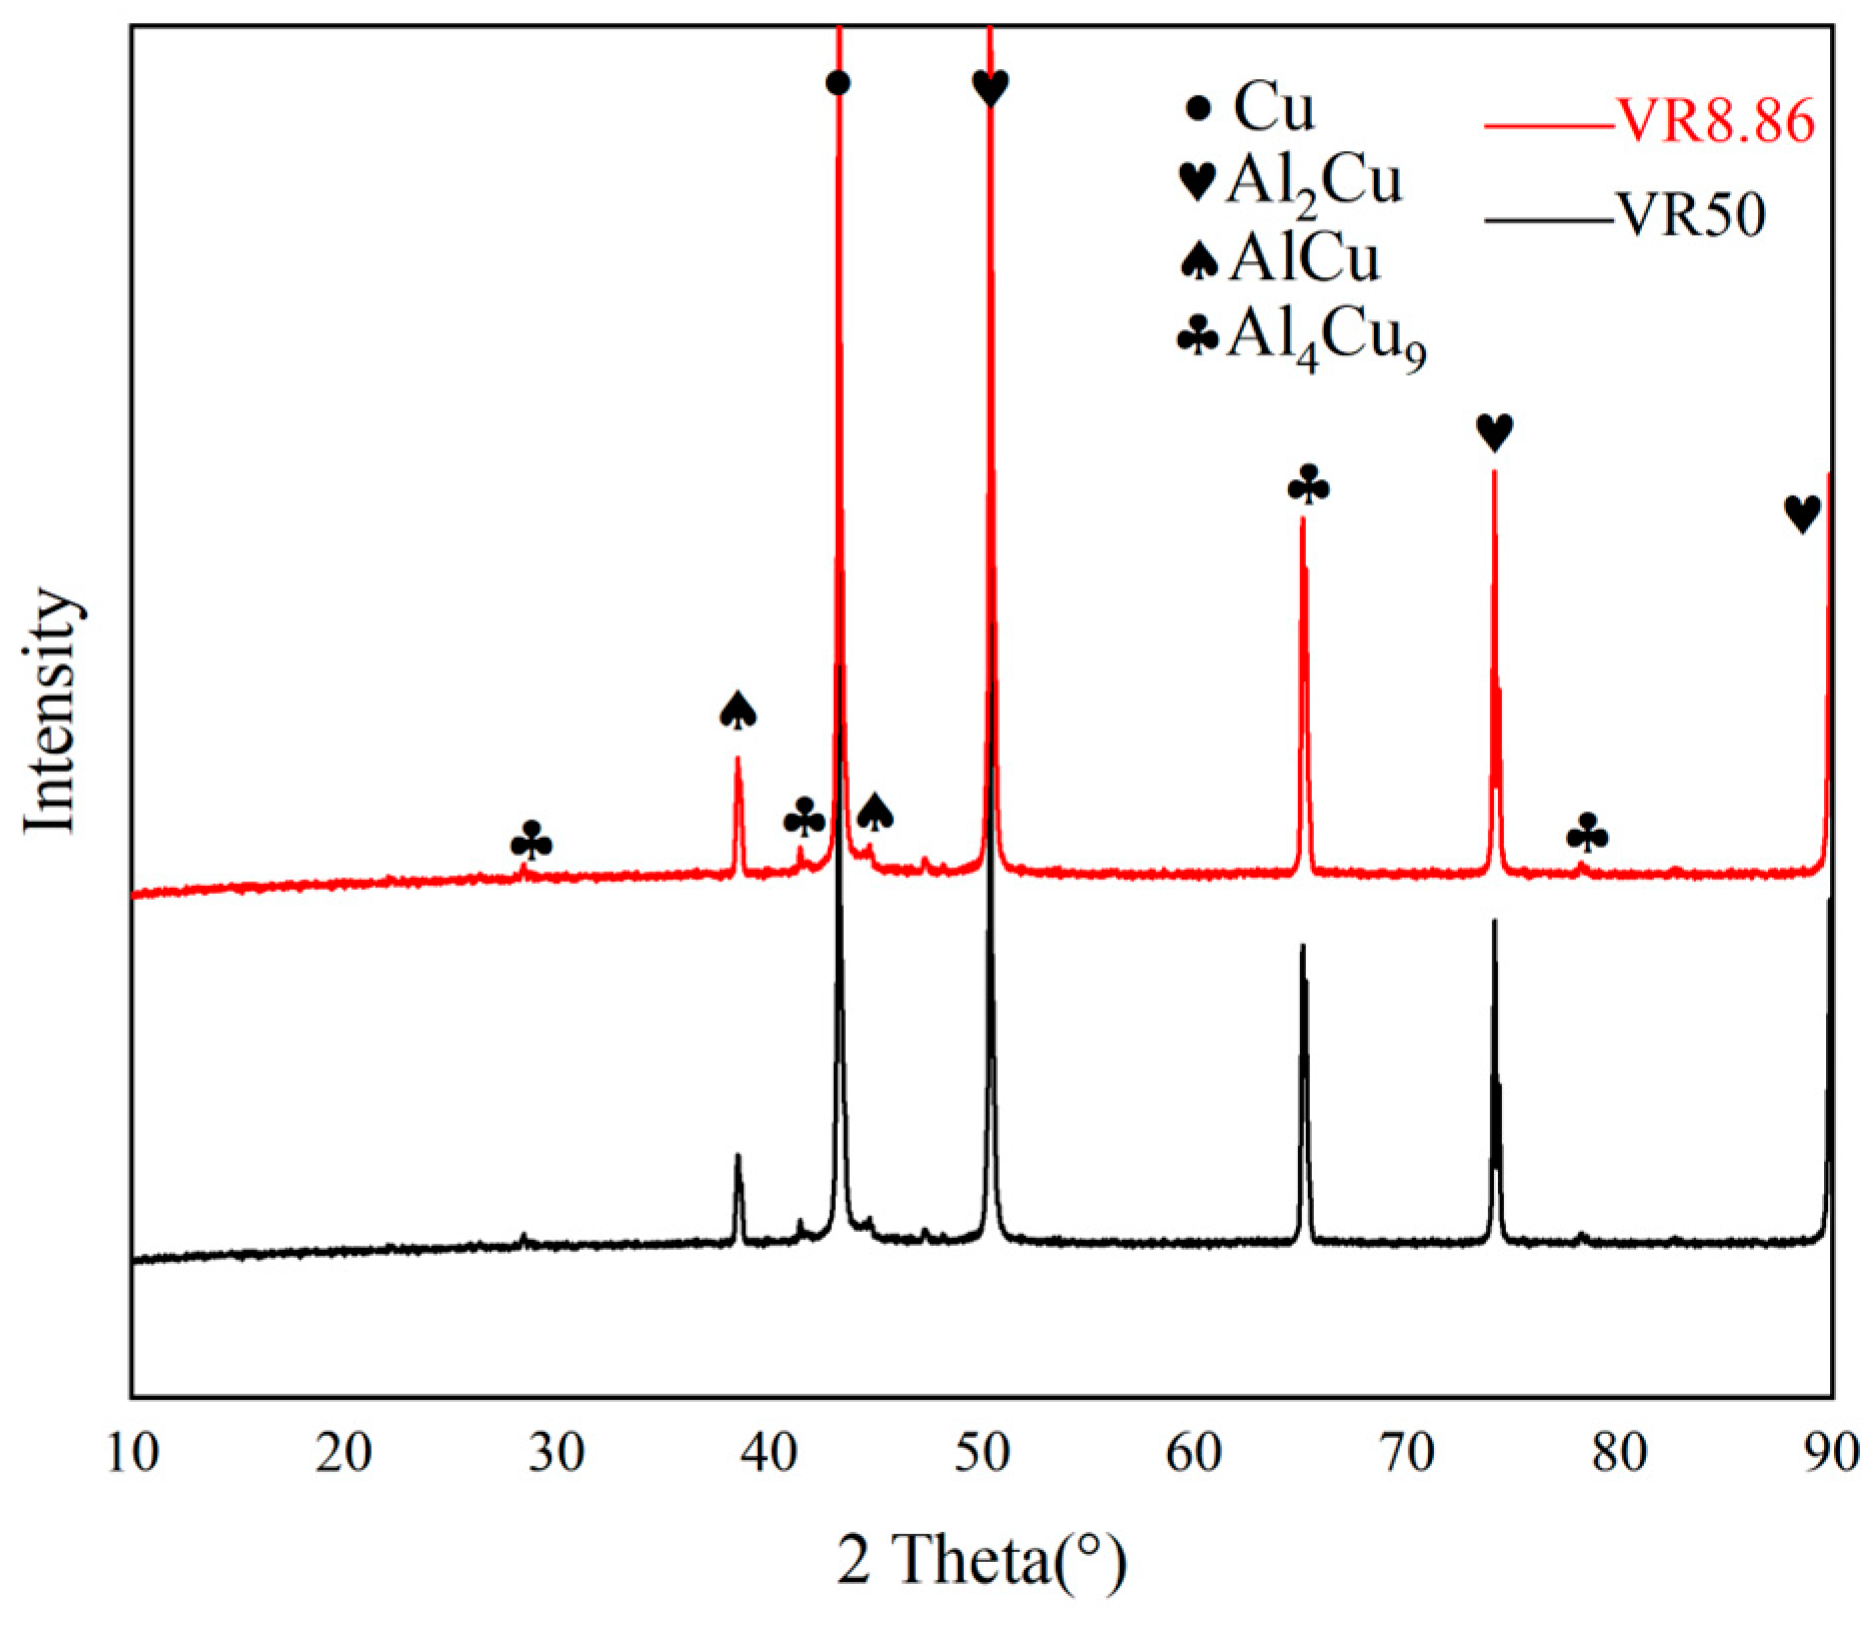
3.1.1. Effect of Liquid–Solid Volume Ratio on the Microstructure of Cu/Al Bimetallic Composite
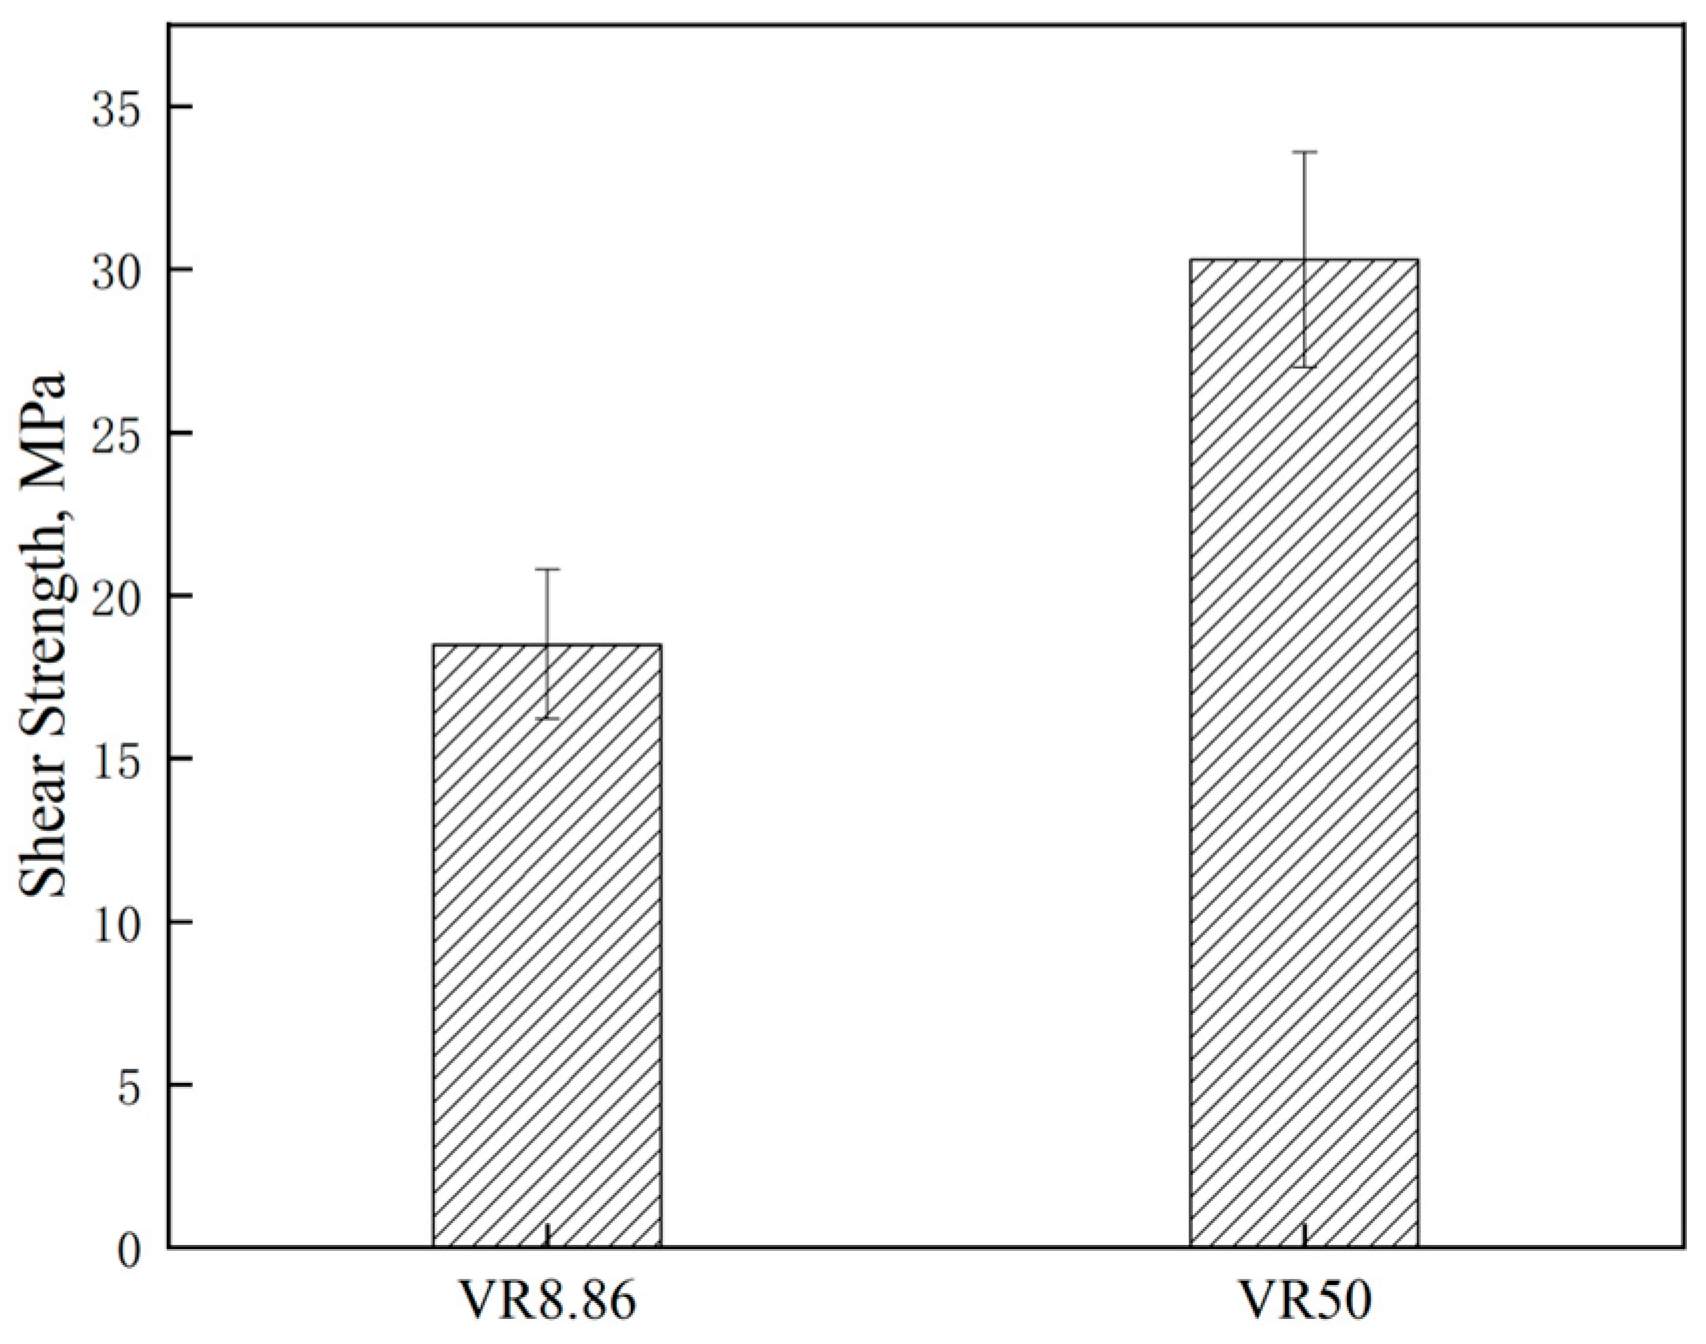
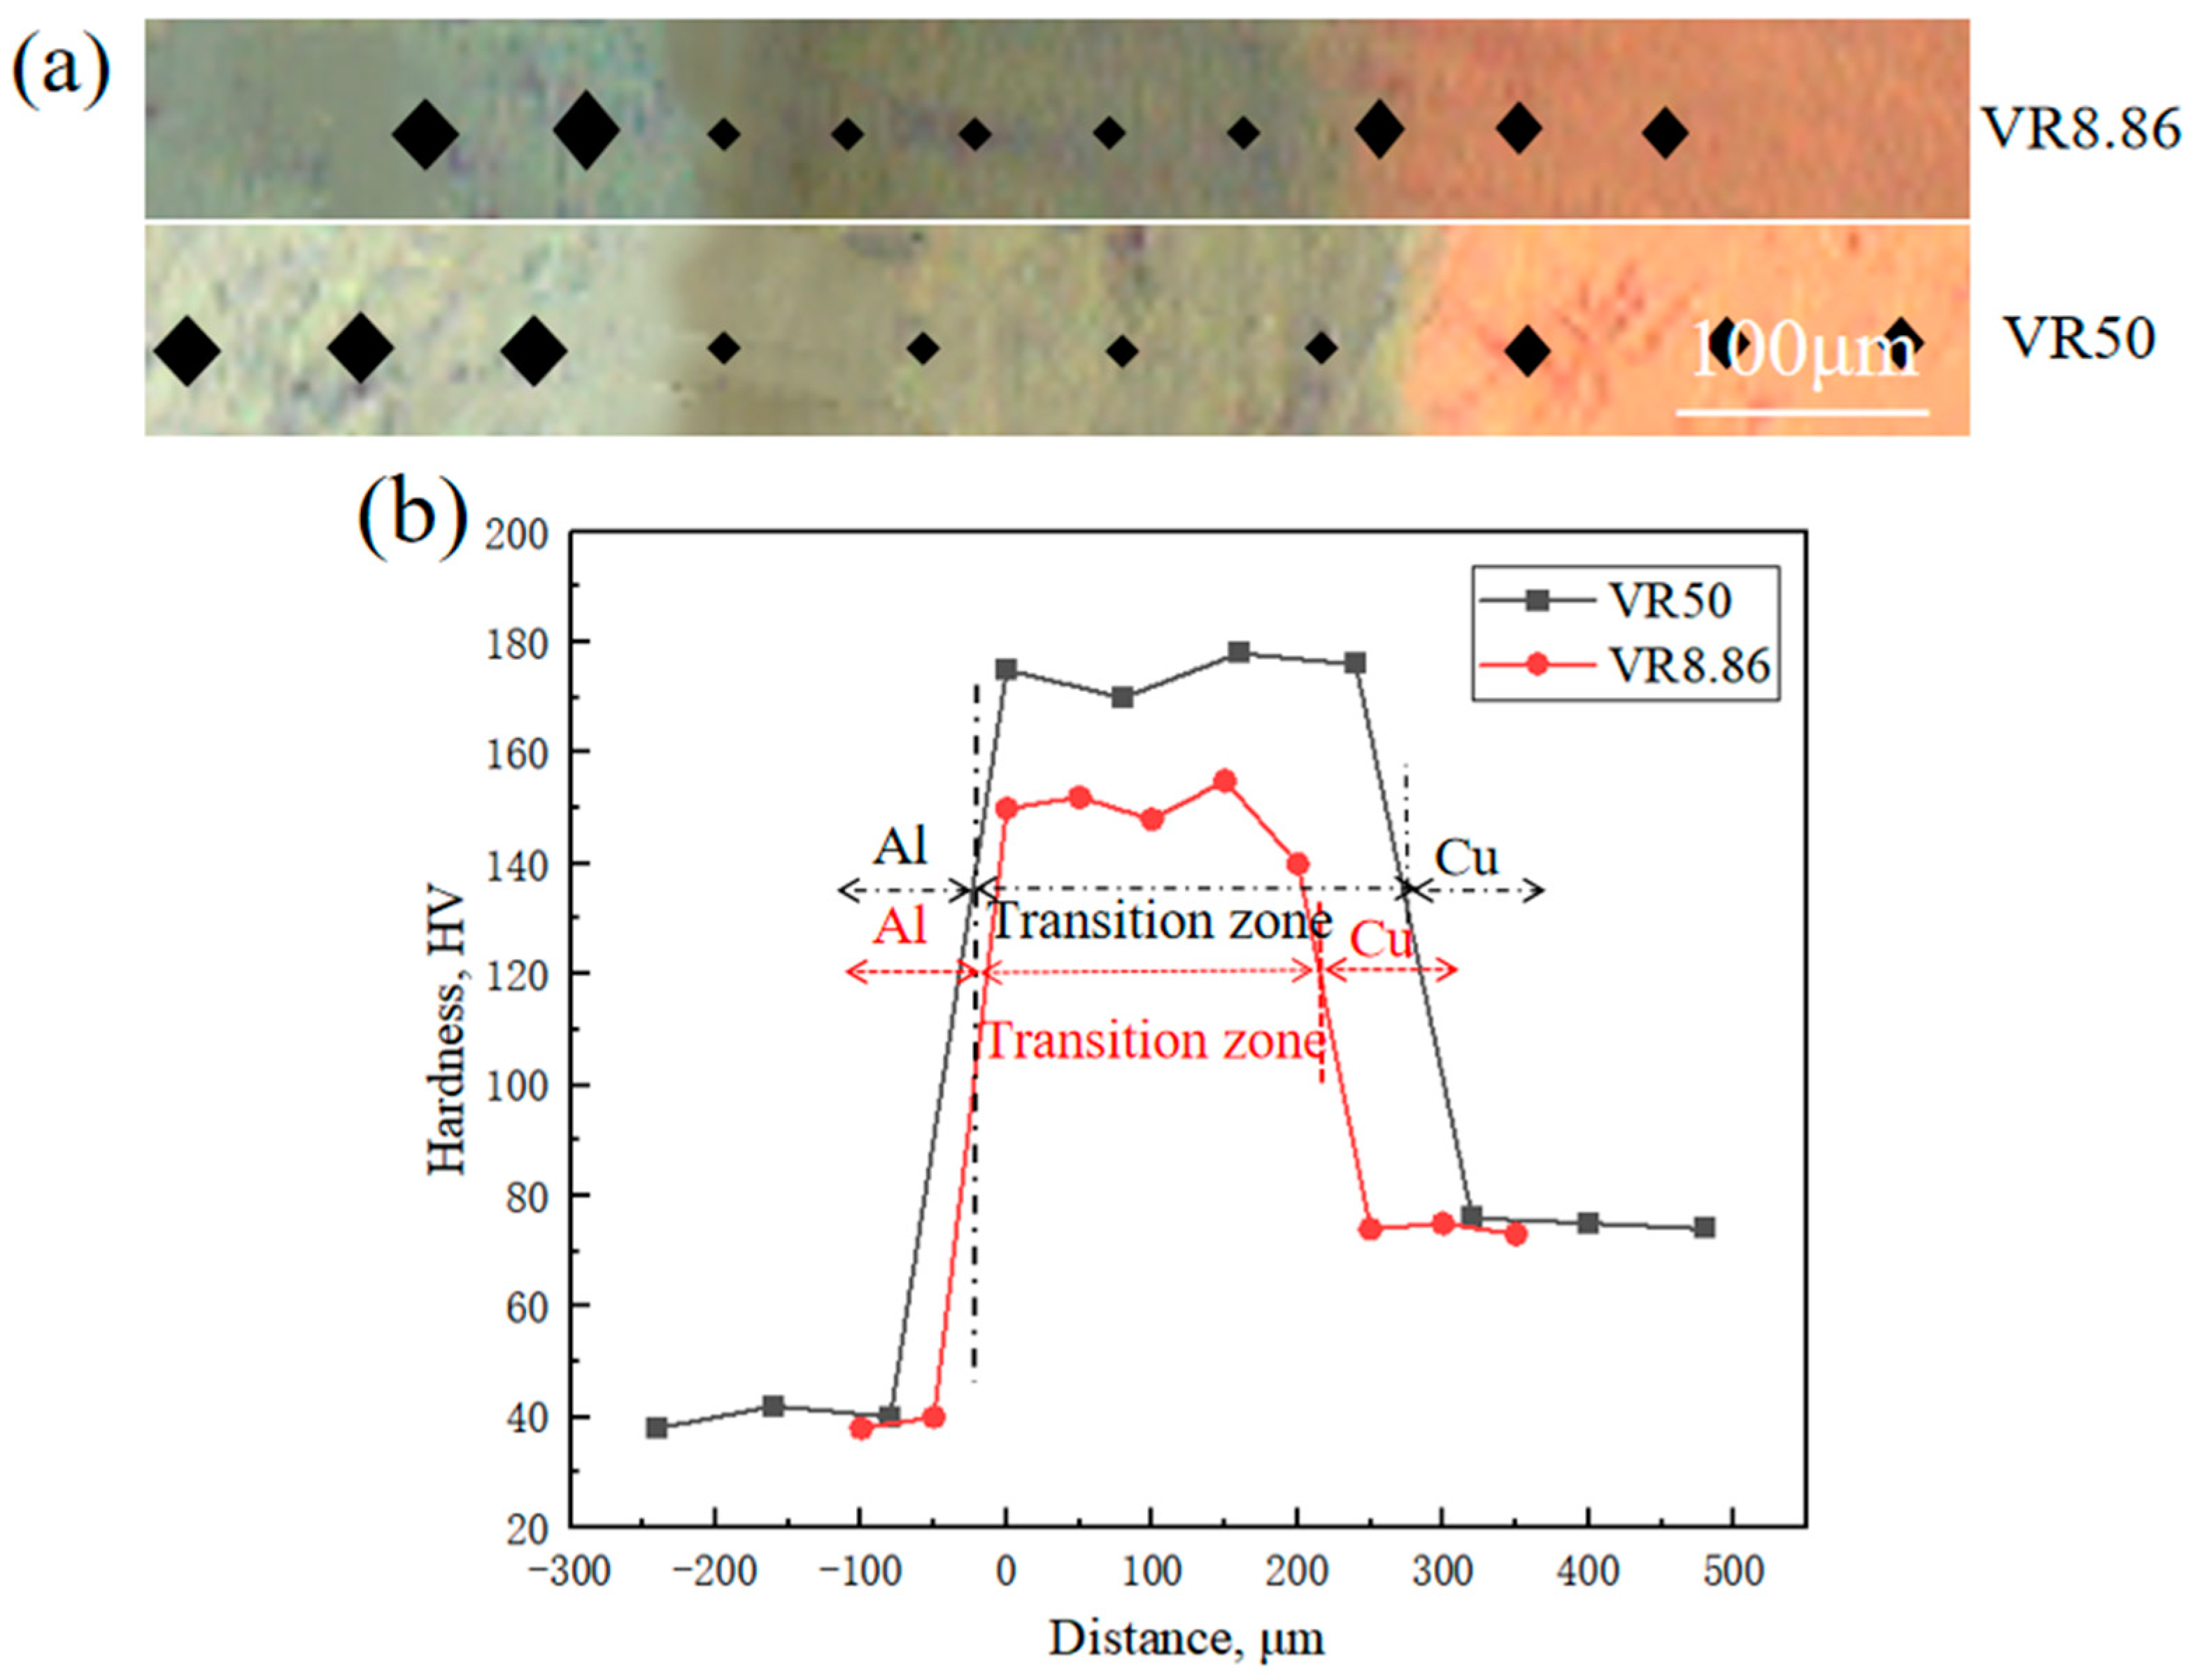
3.1.2. Effect of Liquid–Solid Volume Ratio on the Properties of Cu/Al Bimetallic Composite
- (1)
- Shear strength
- (2)
- Microhardness
3.2. Effect of Coating Thickness on the Microstructure and Properties of Cu/Al Bimetallic Composite
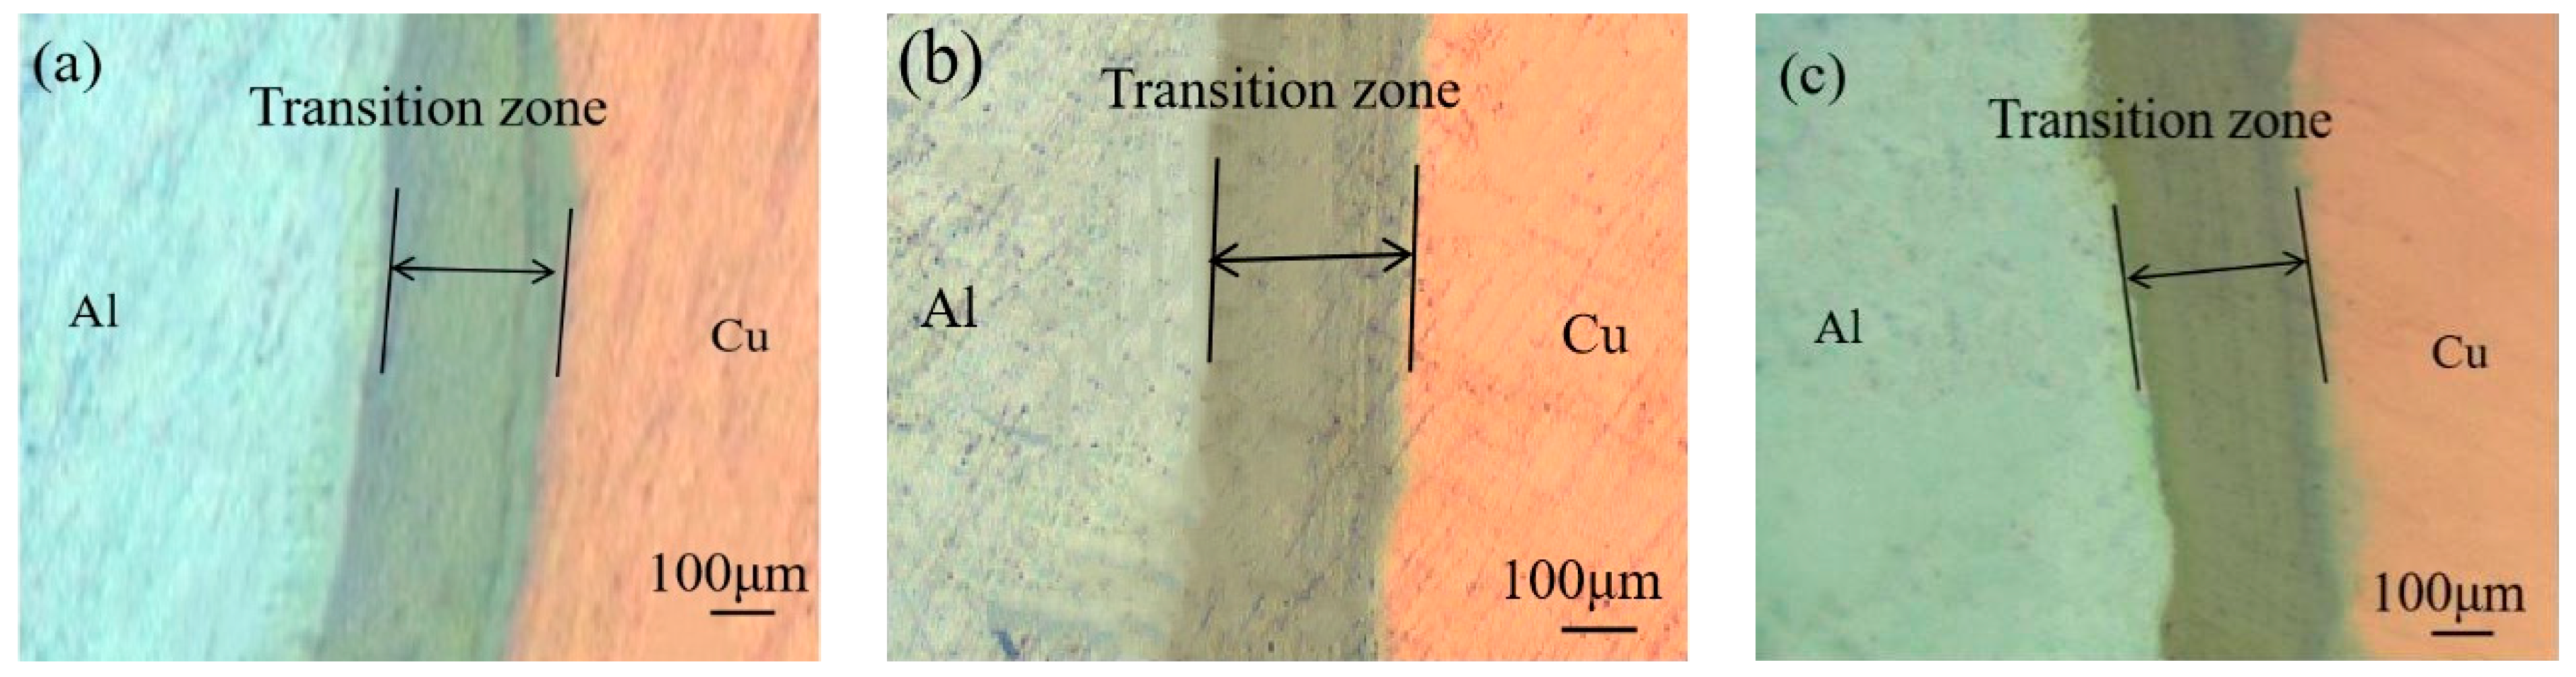
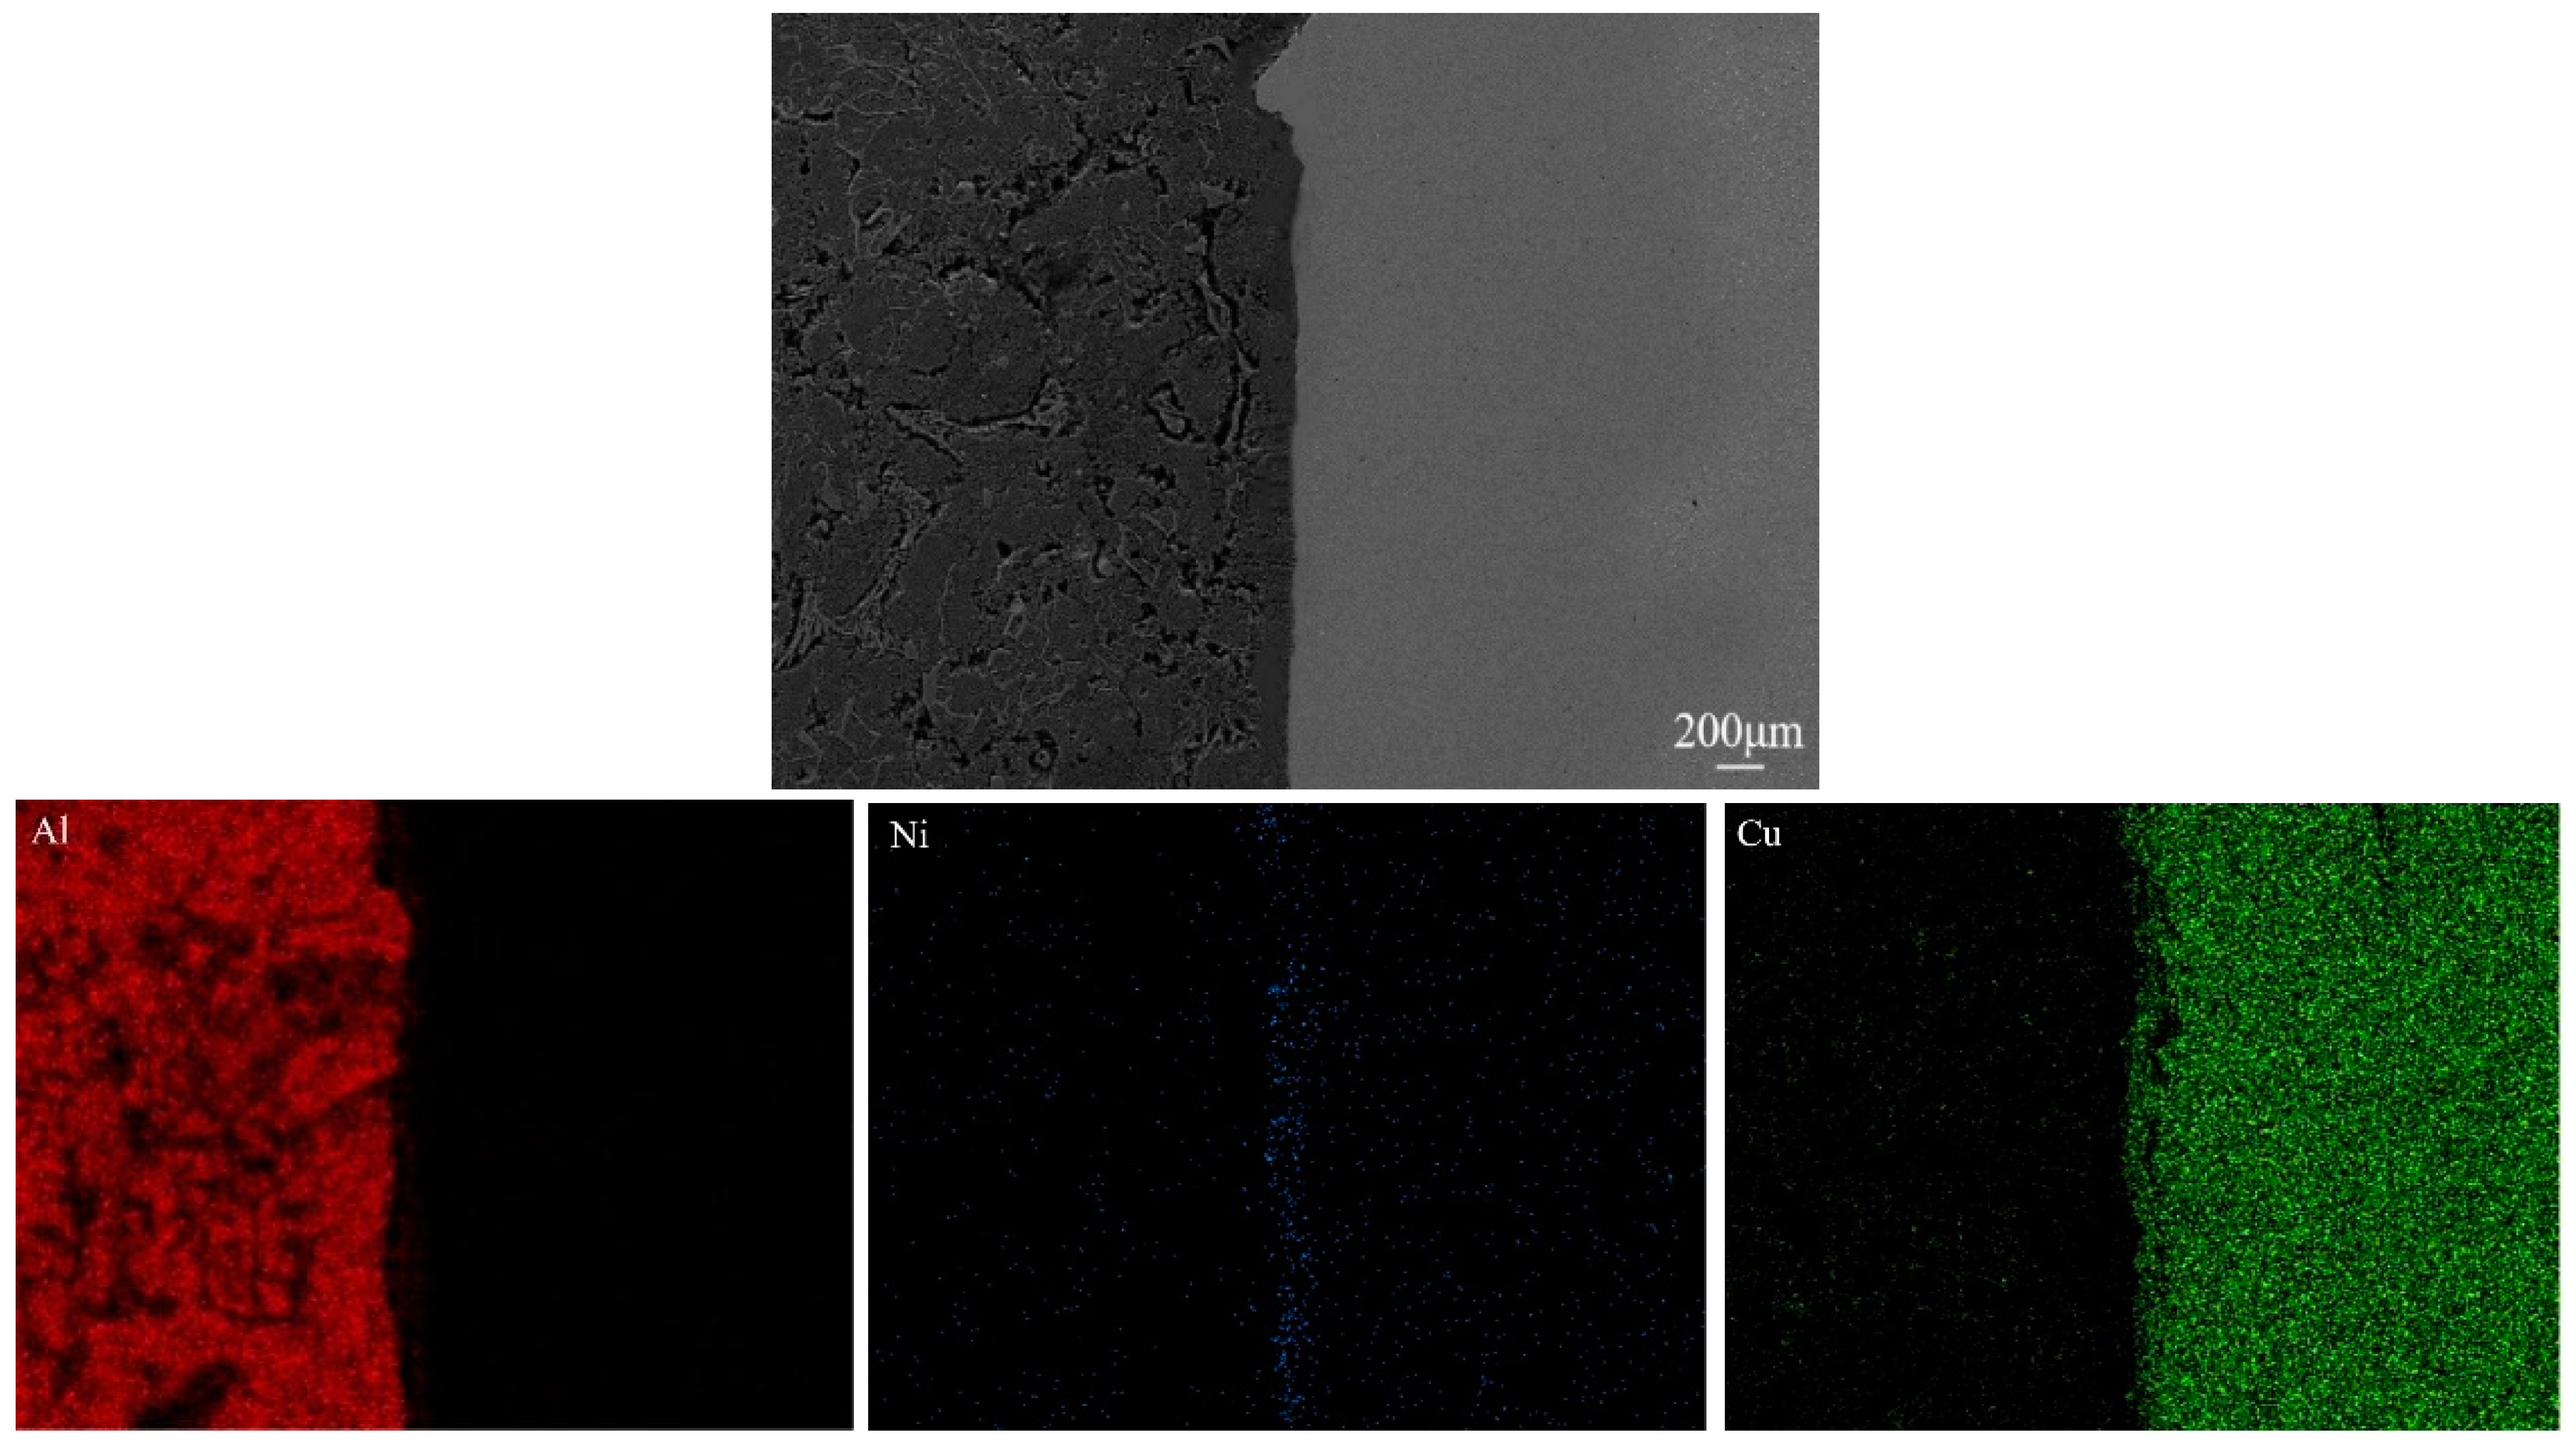
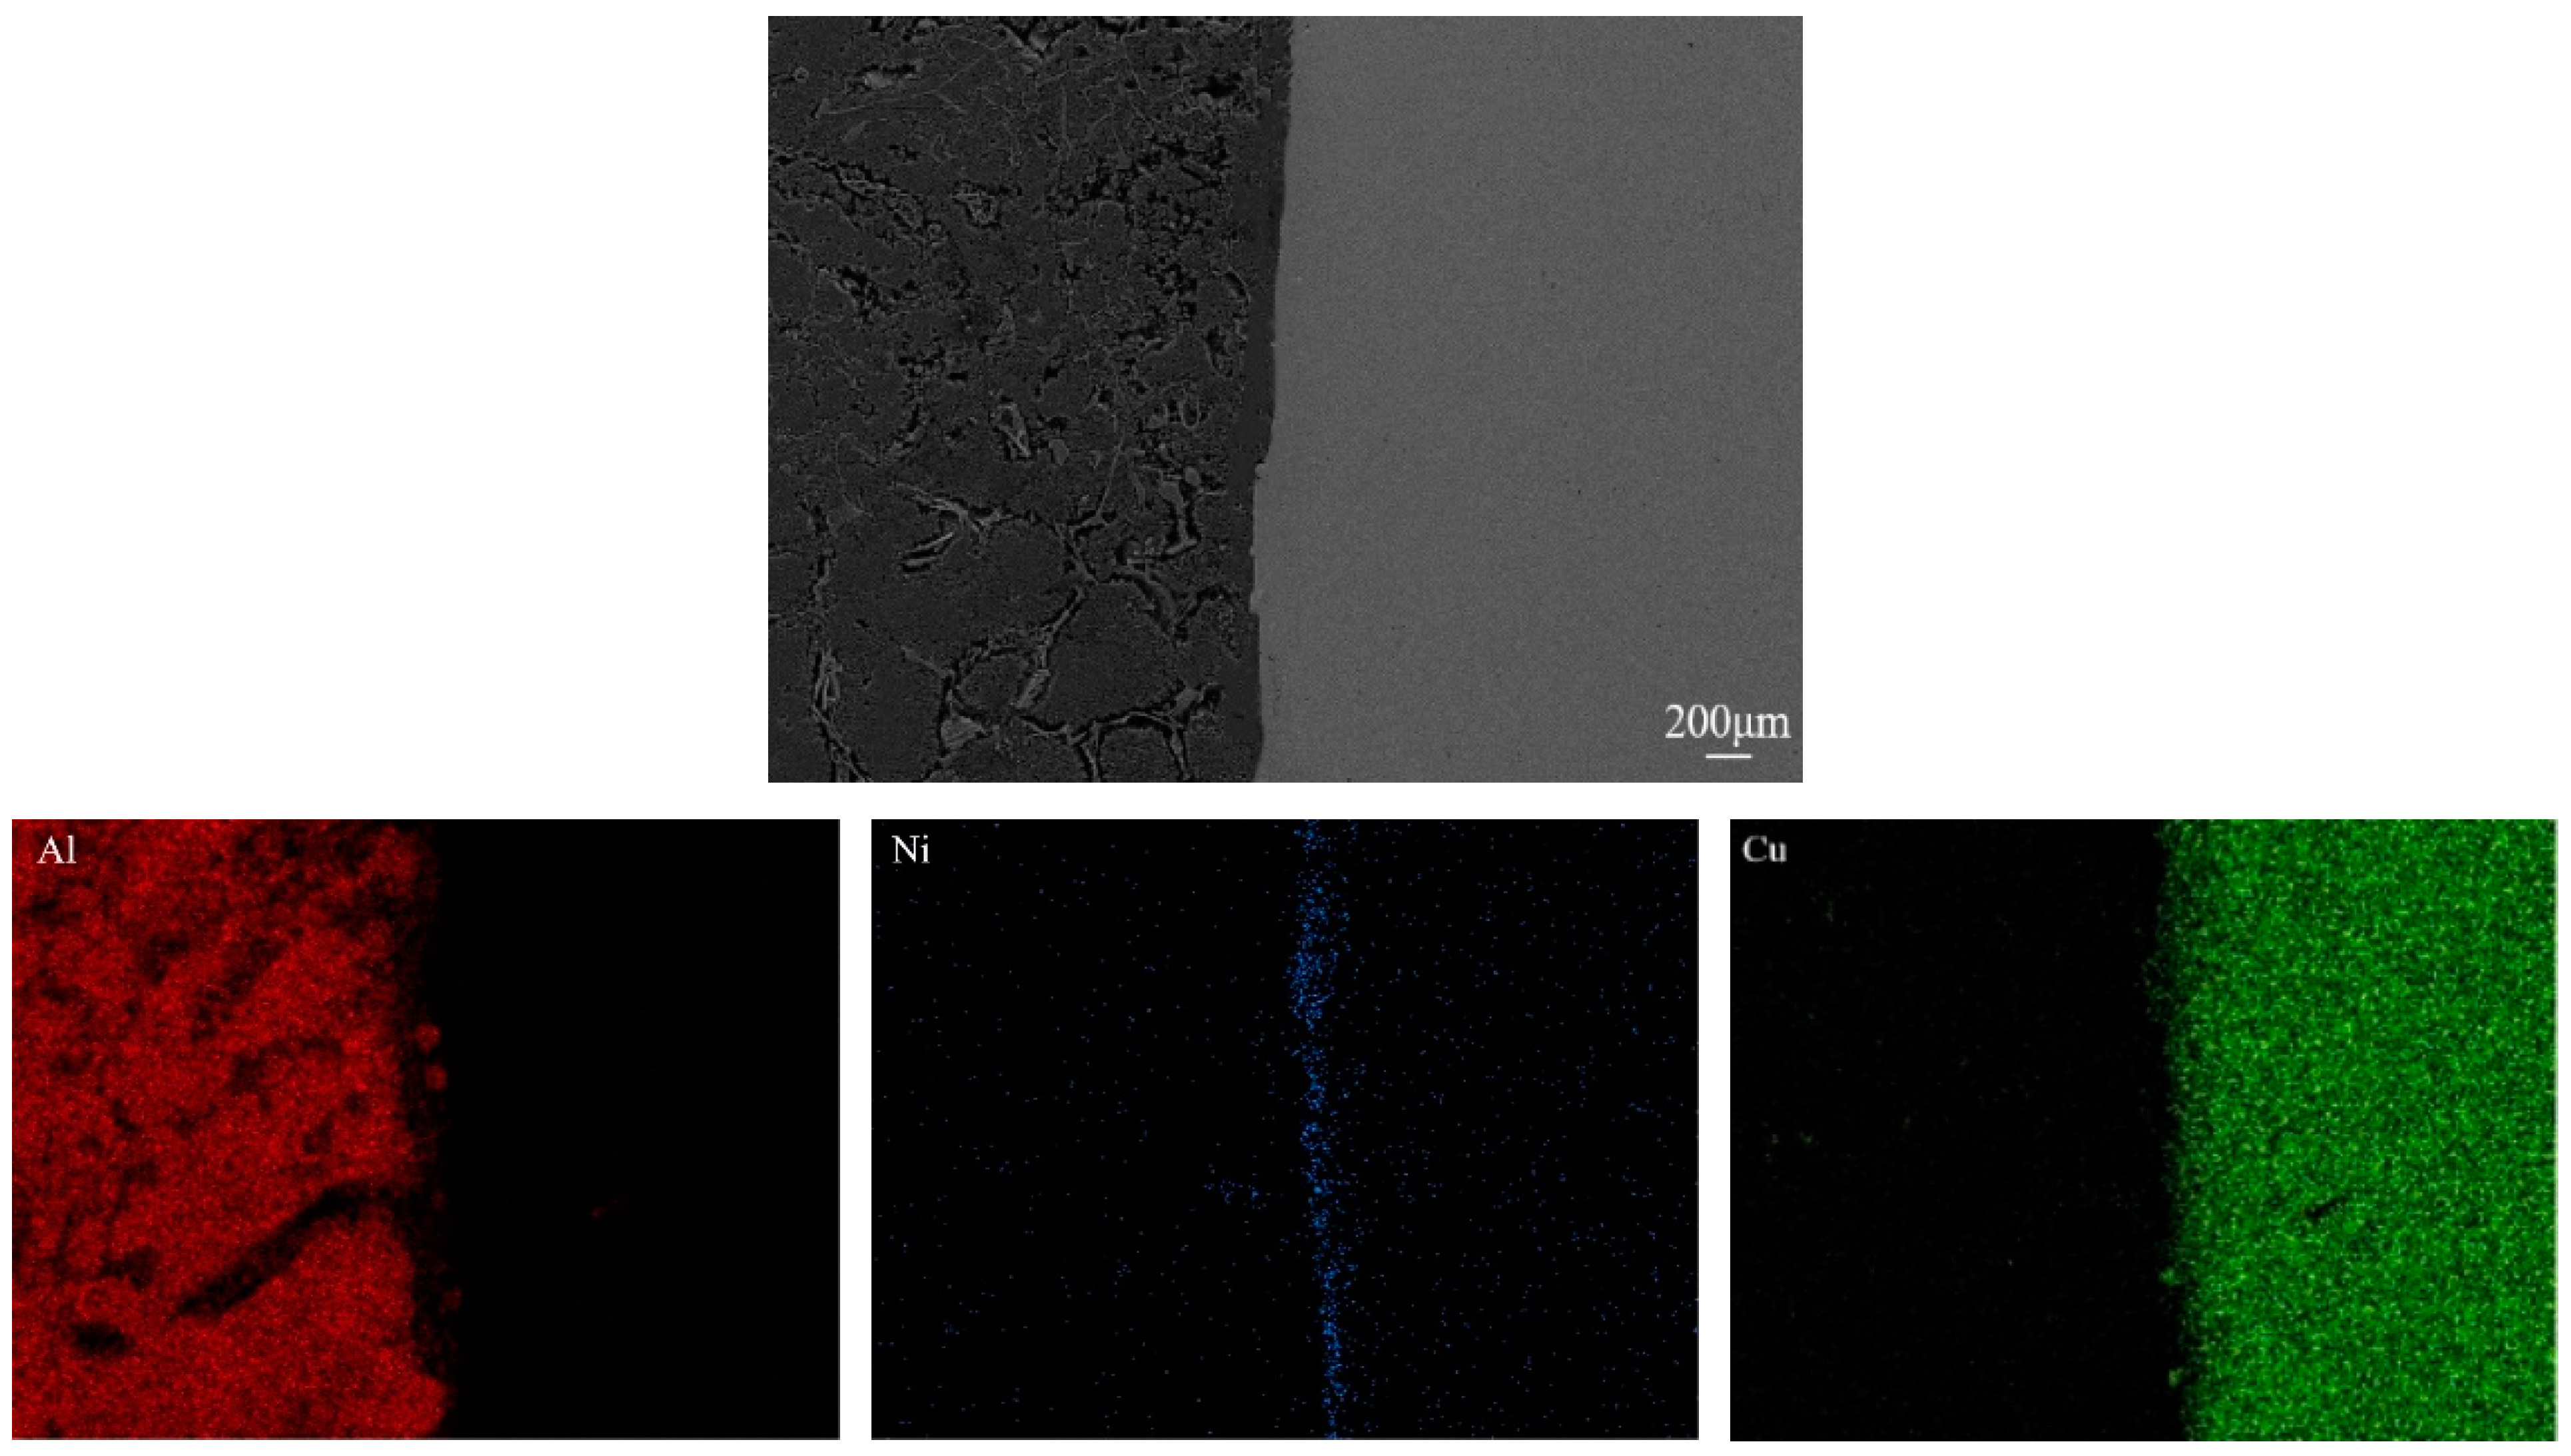
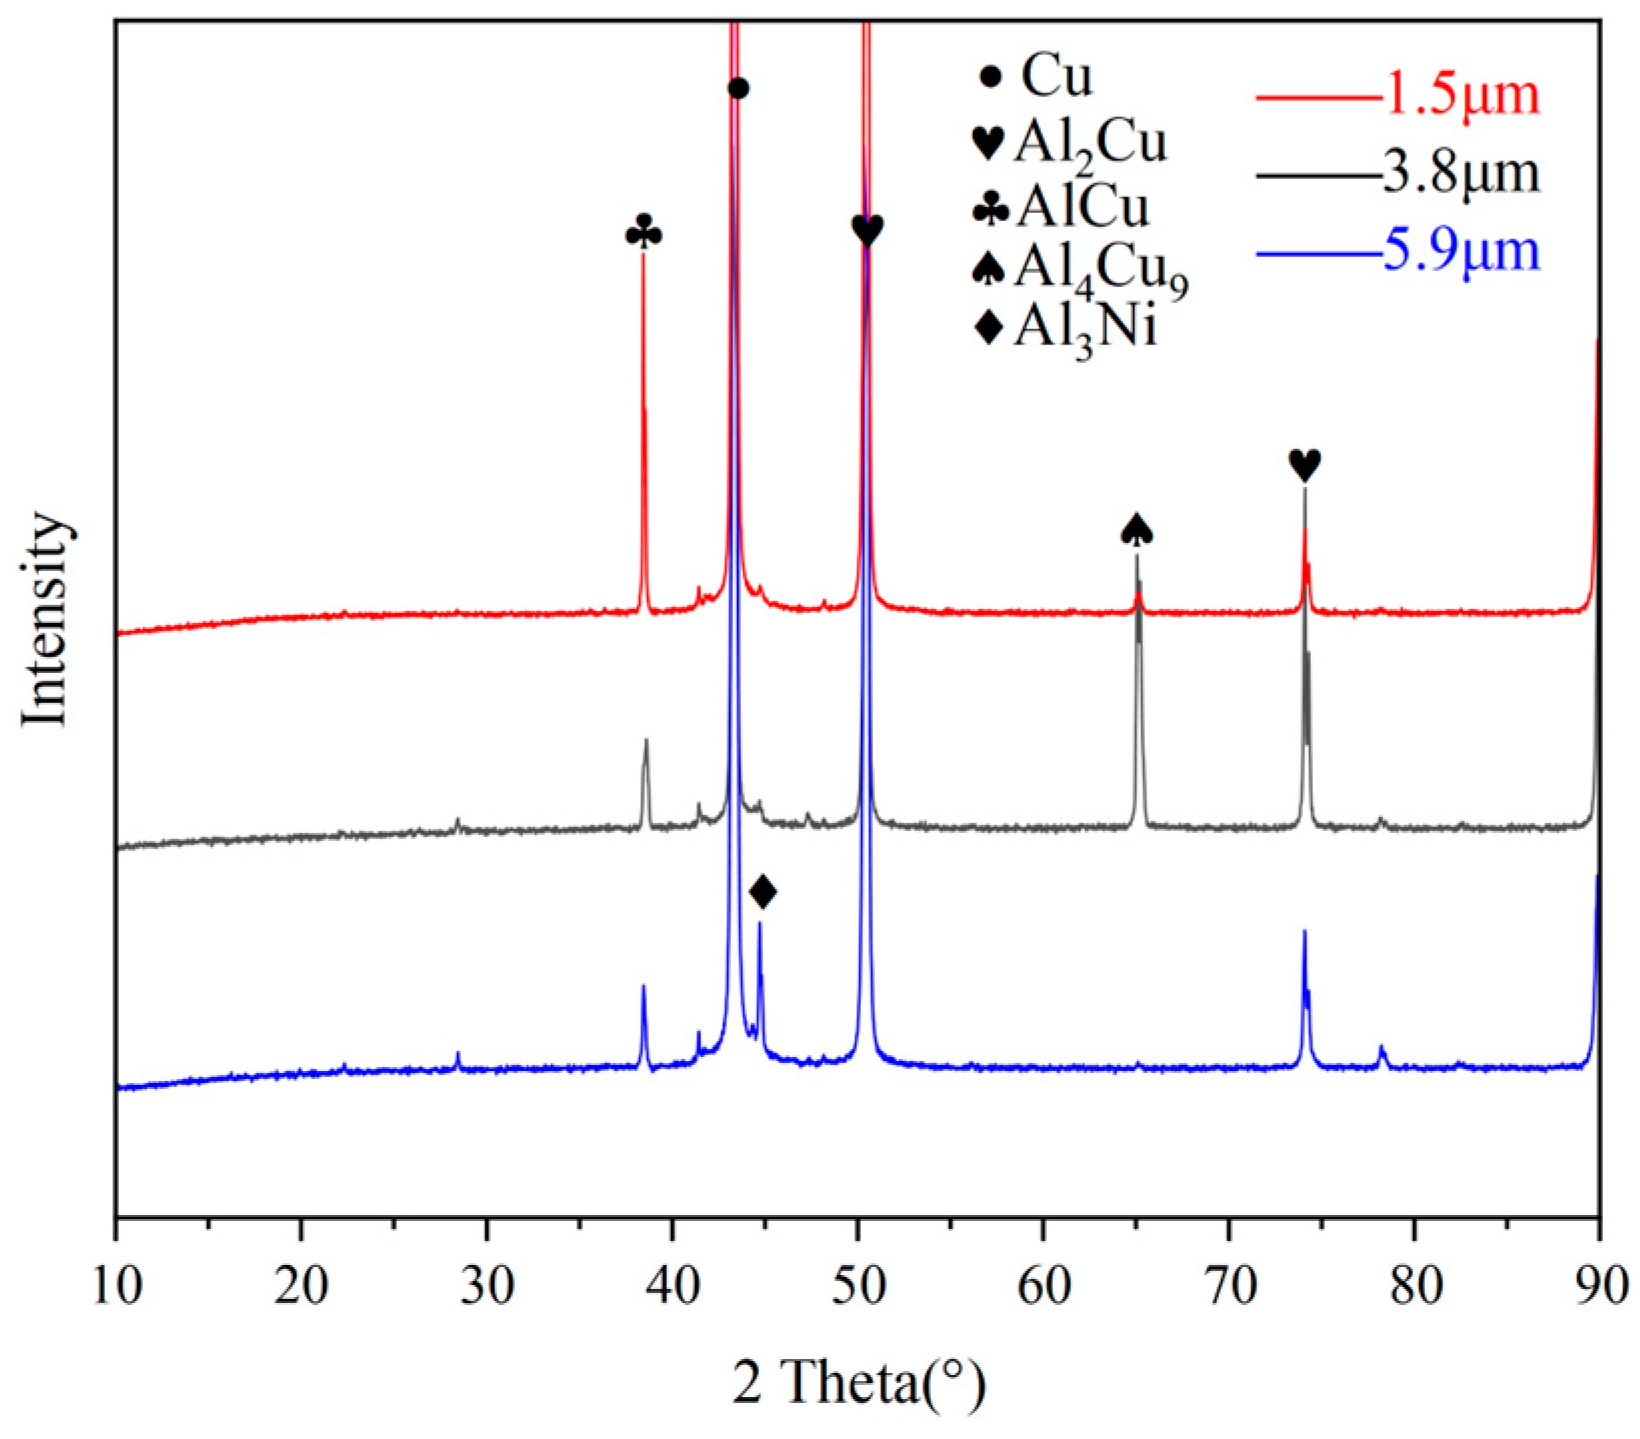
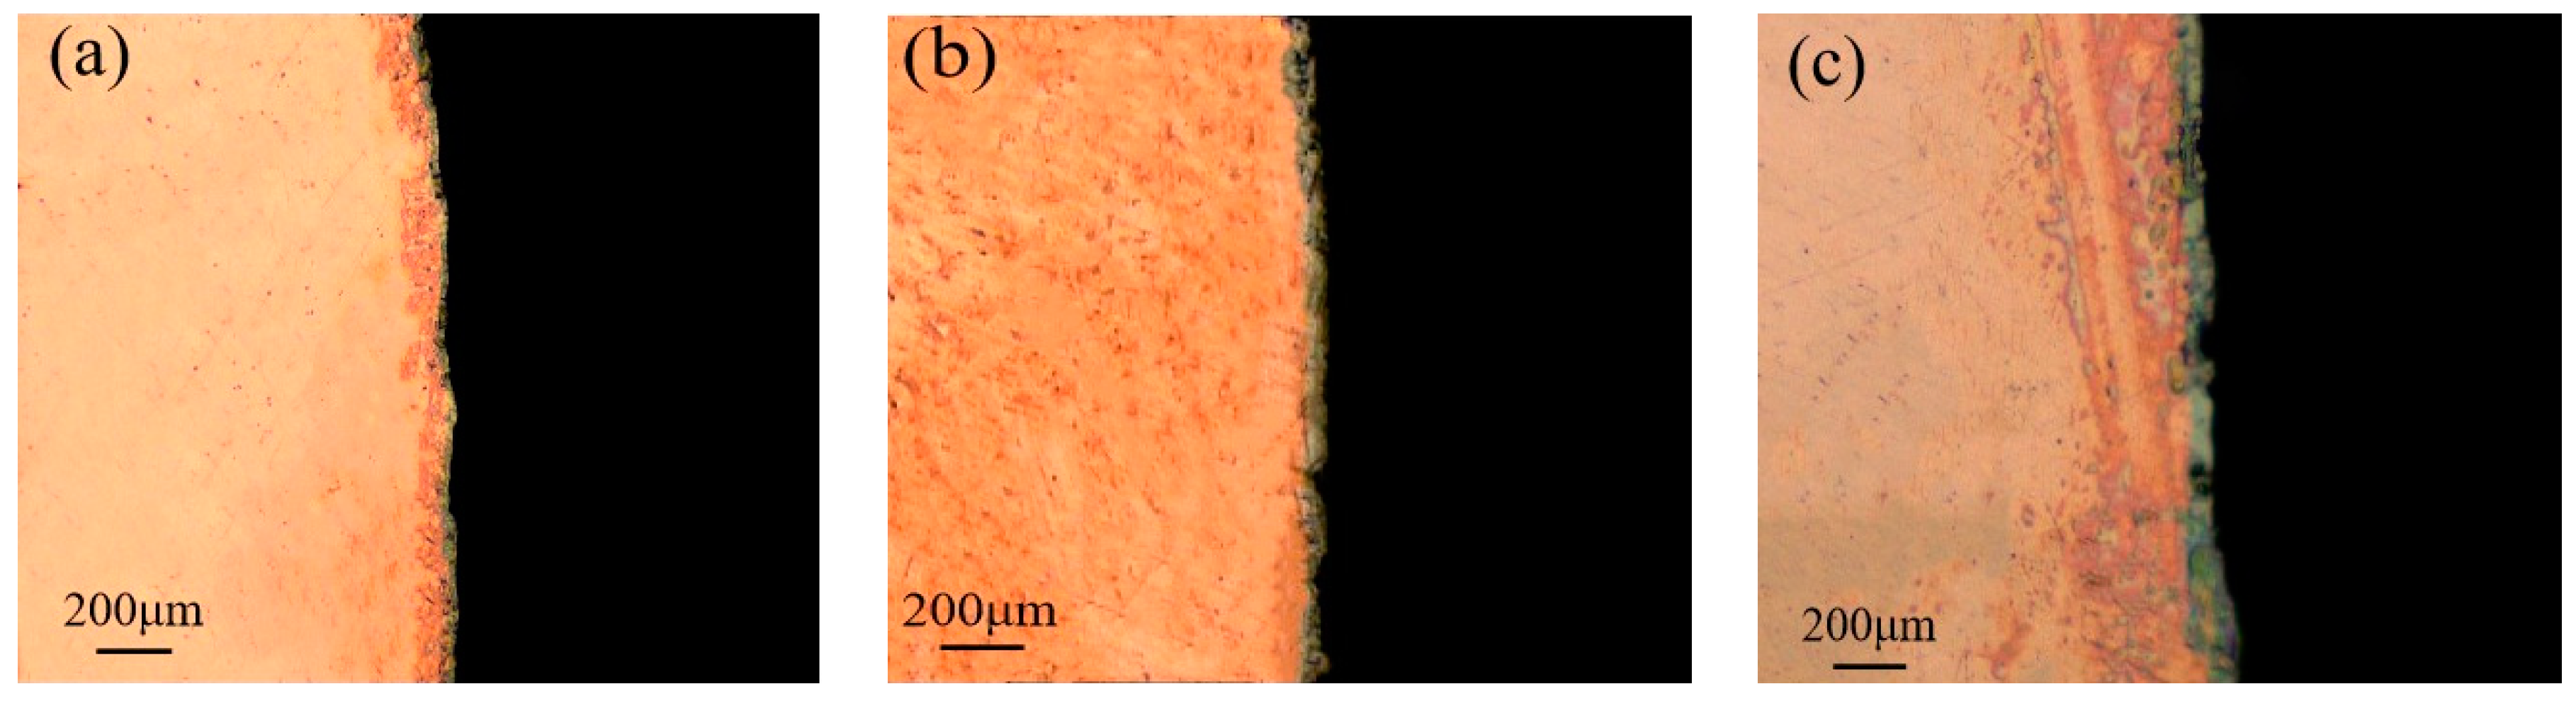
3.2.1. Effect of Coating Thickness on the Microstructure of Cu/Al Bimetallic Composite
3.2.2. Effect of Coating Thickness on the Properties of Cu/Al Bimetallic Composite
- (1)
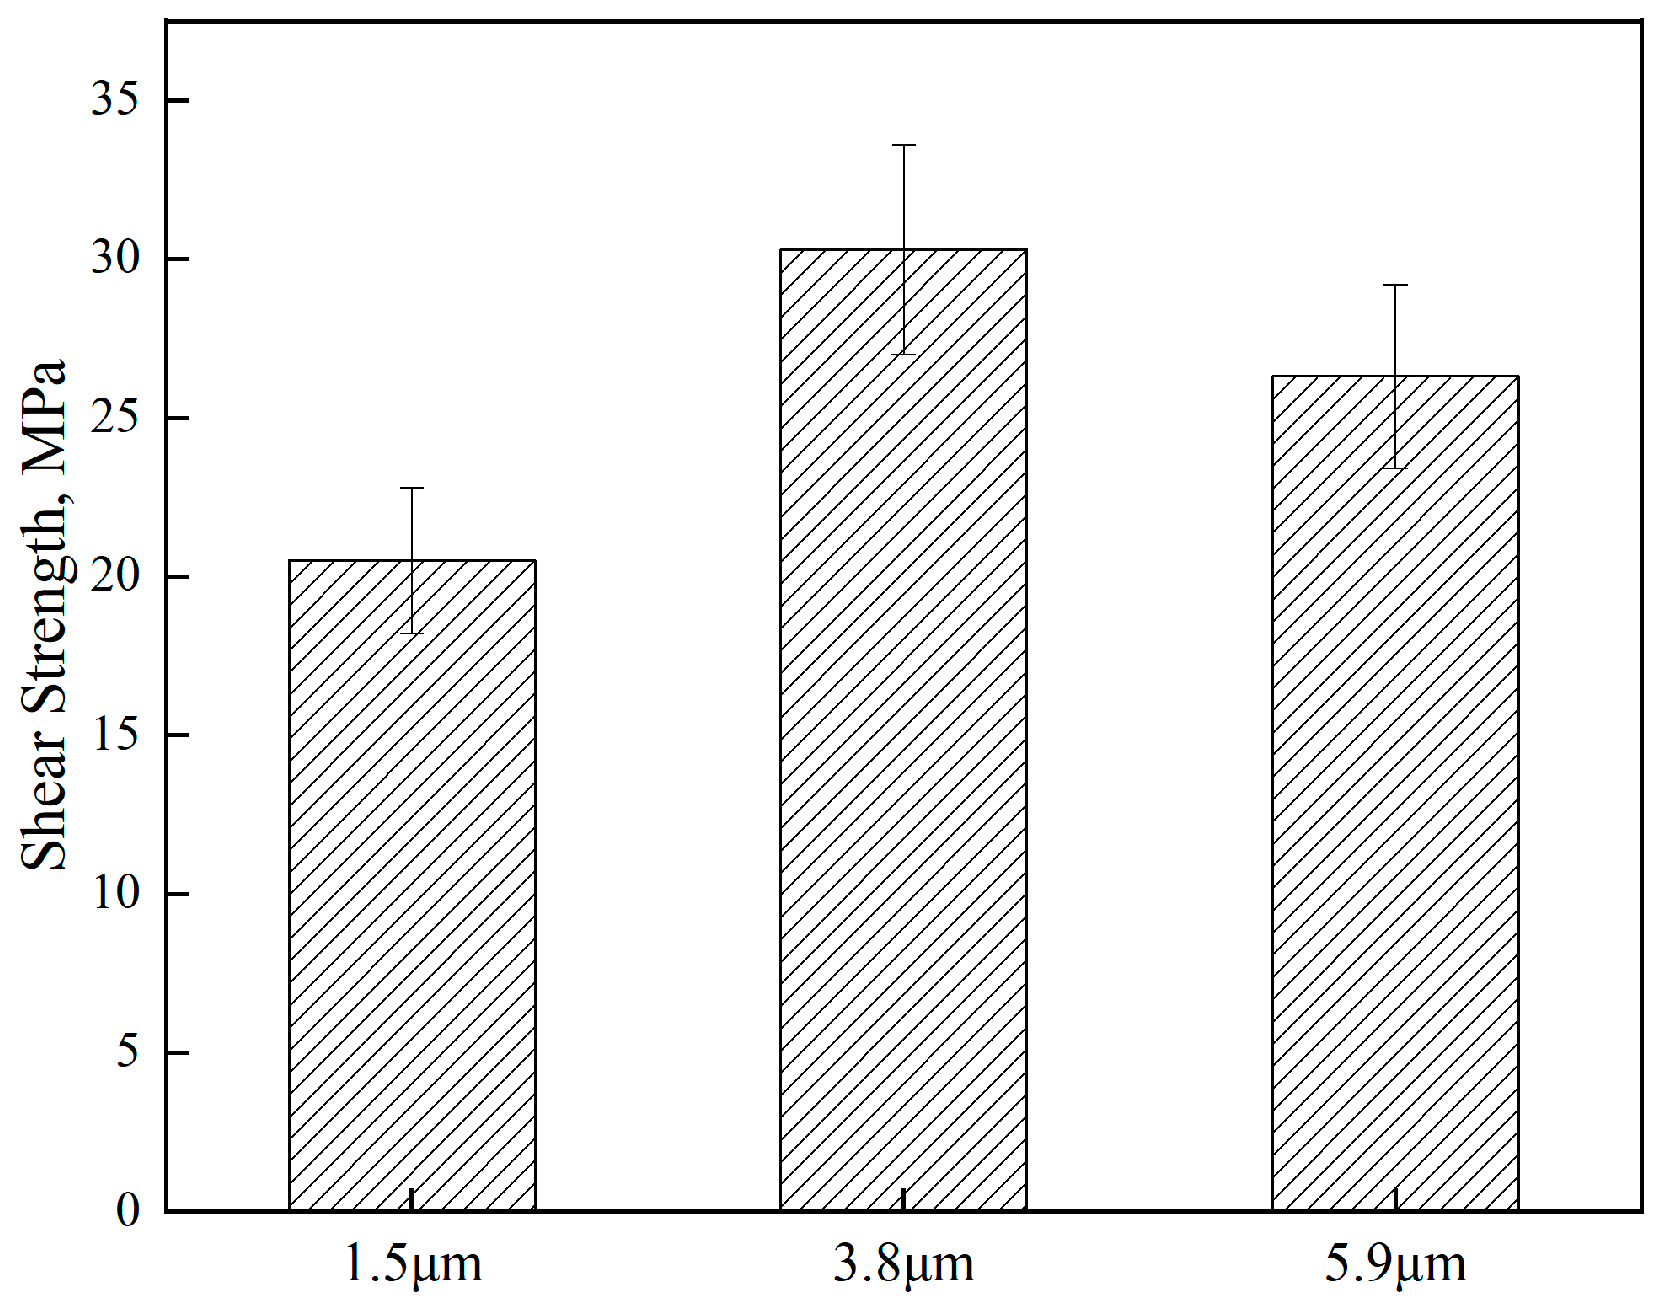
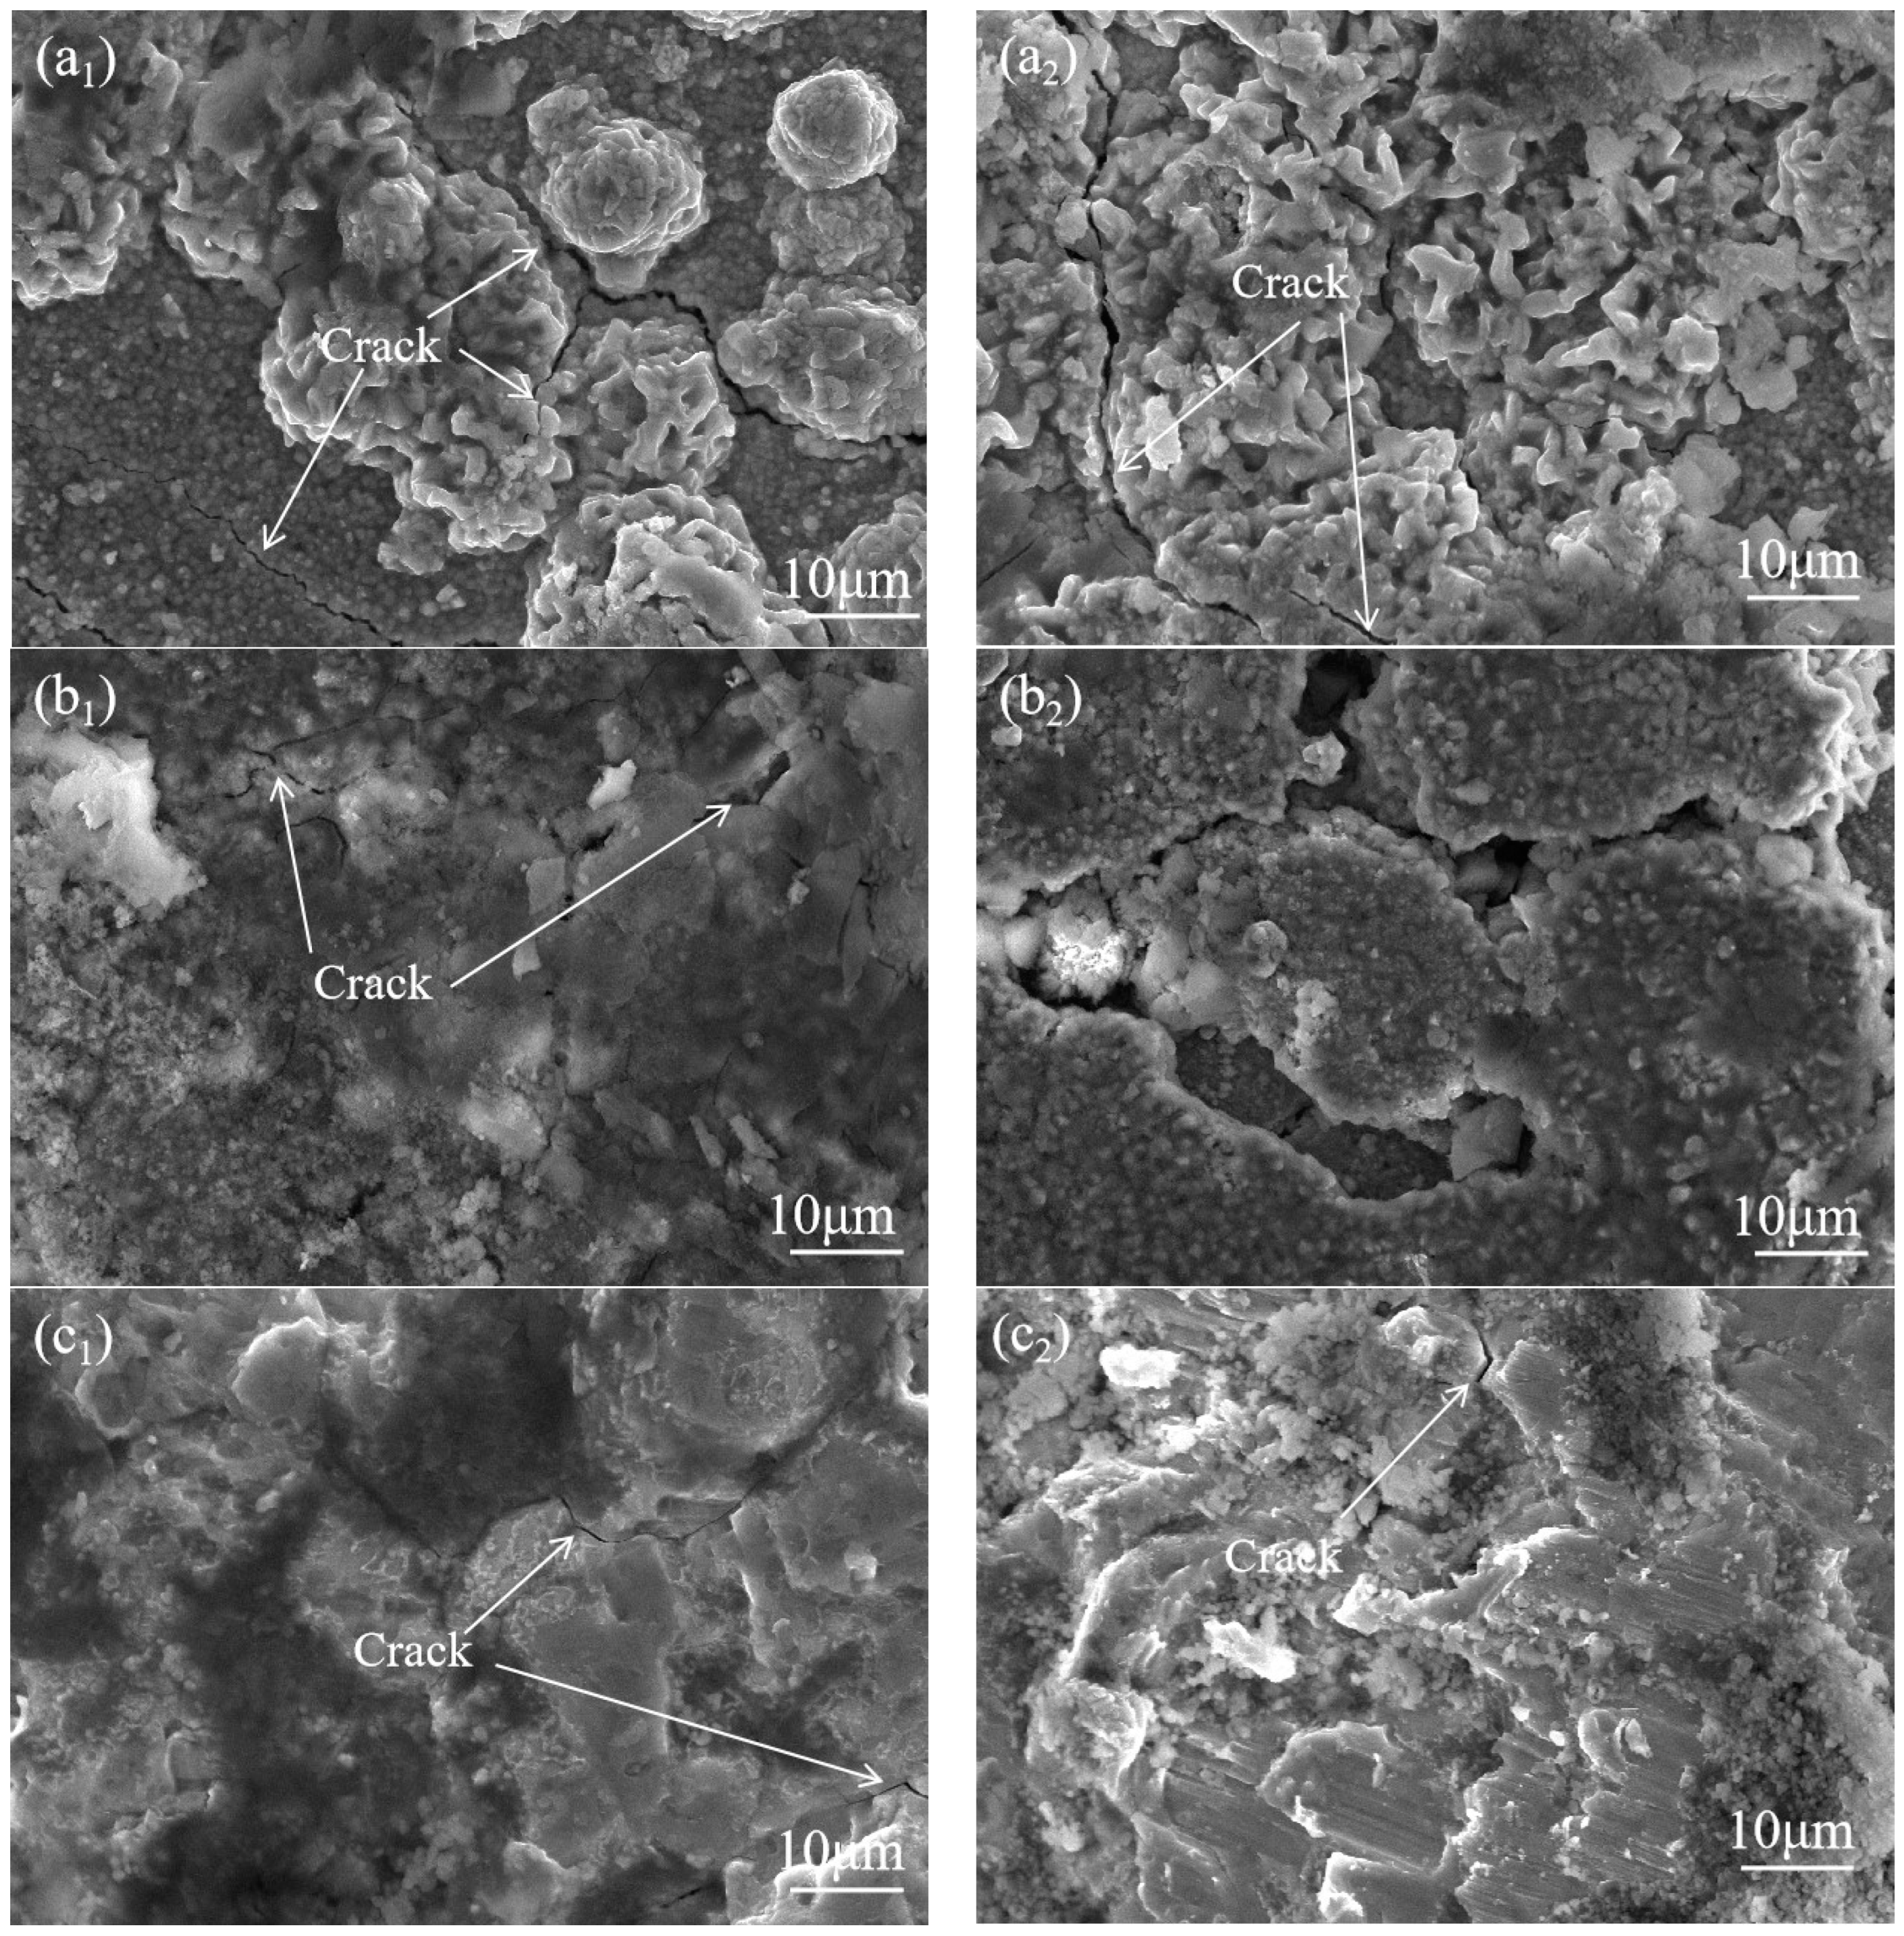
- Shear Strength
- (2)
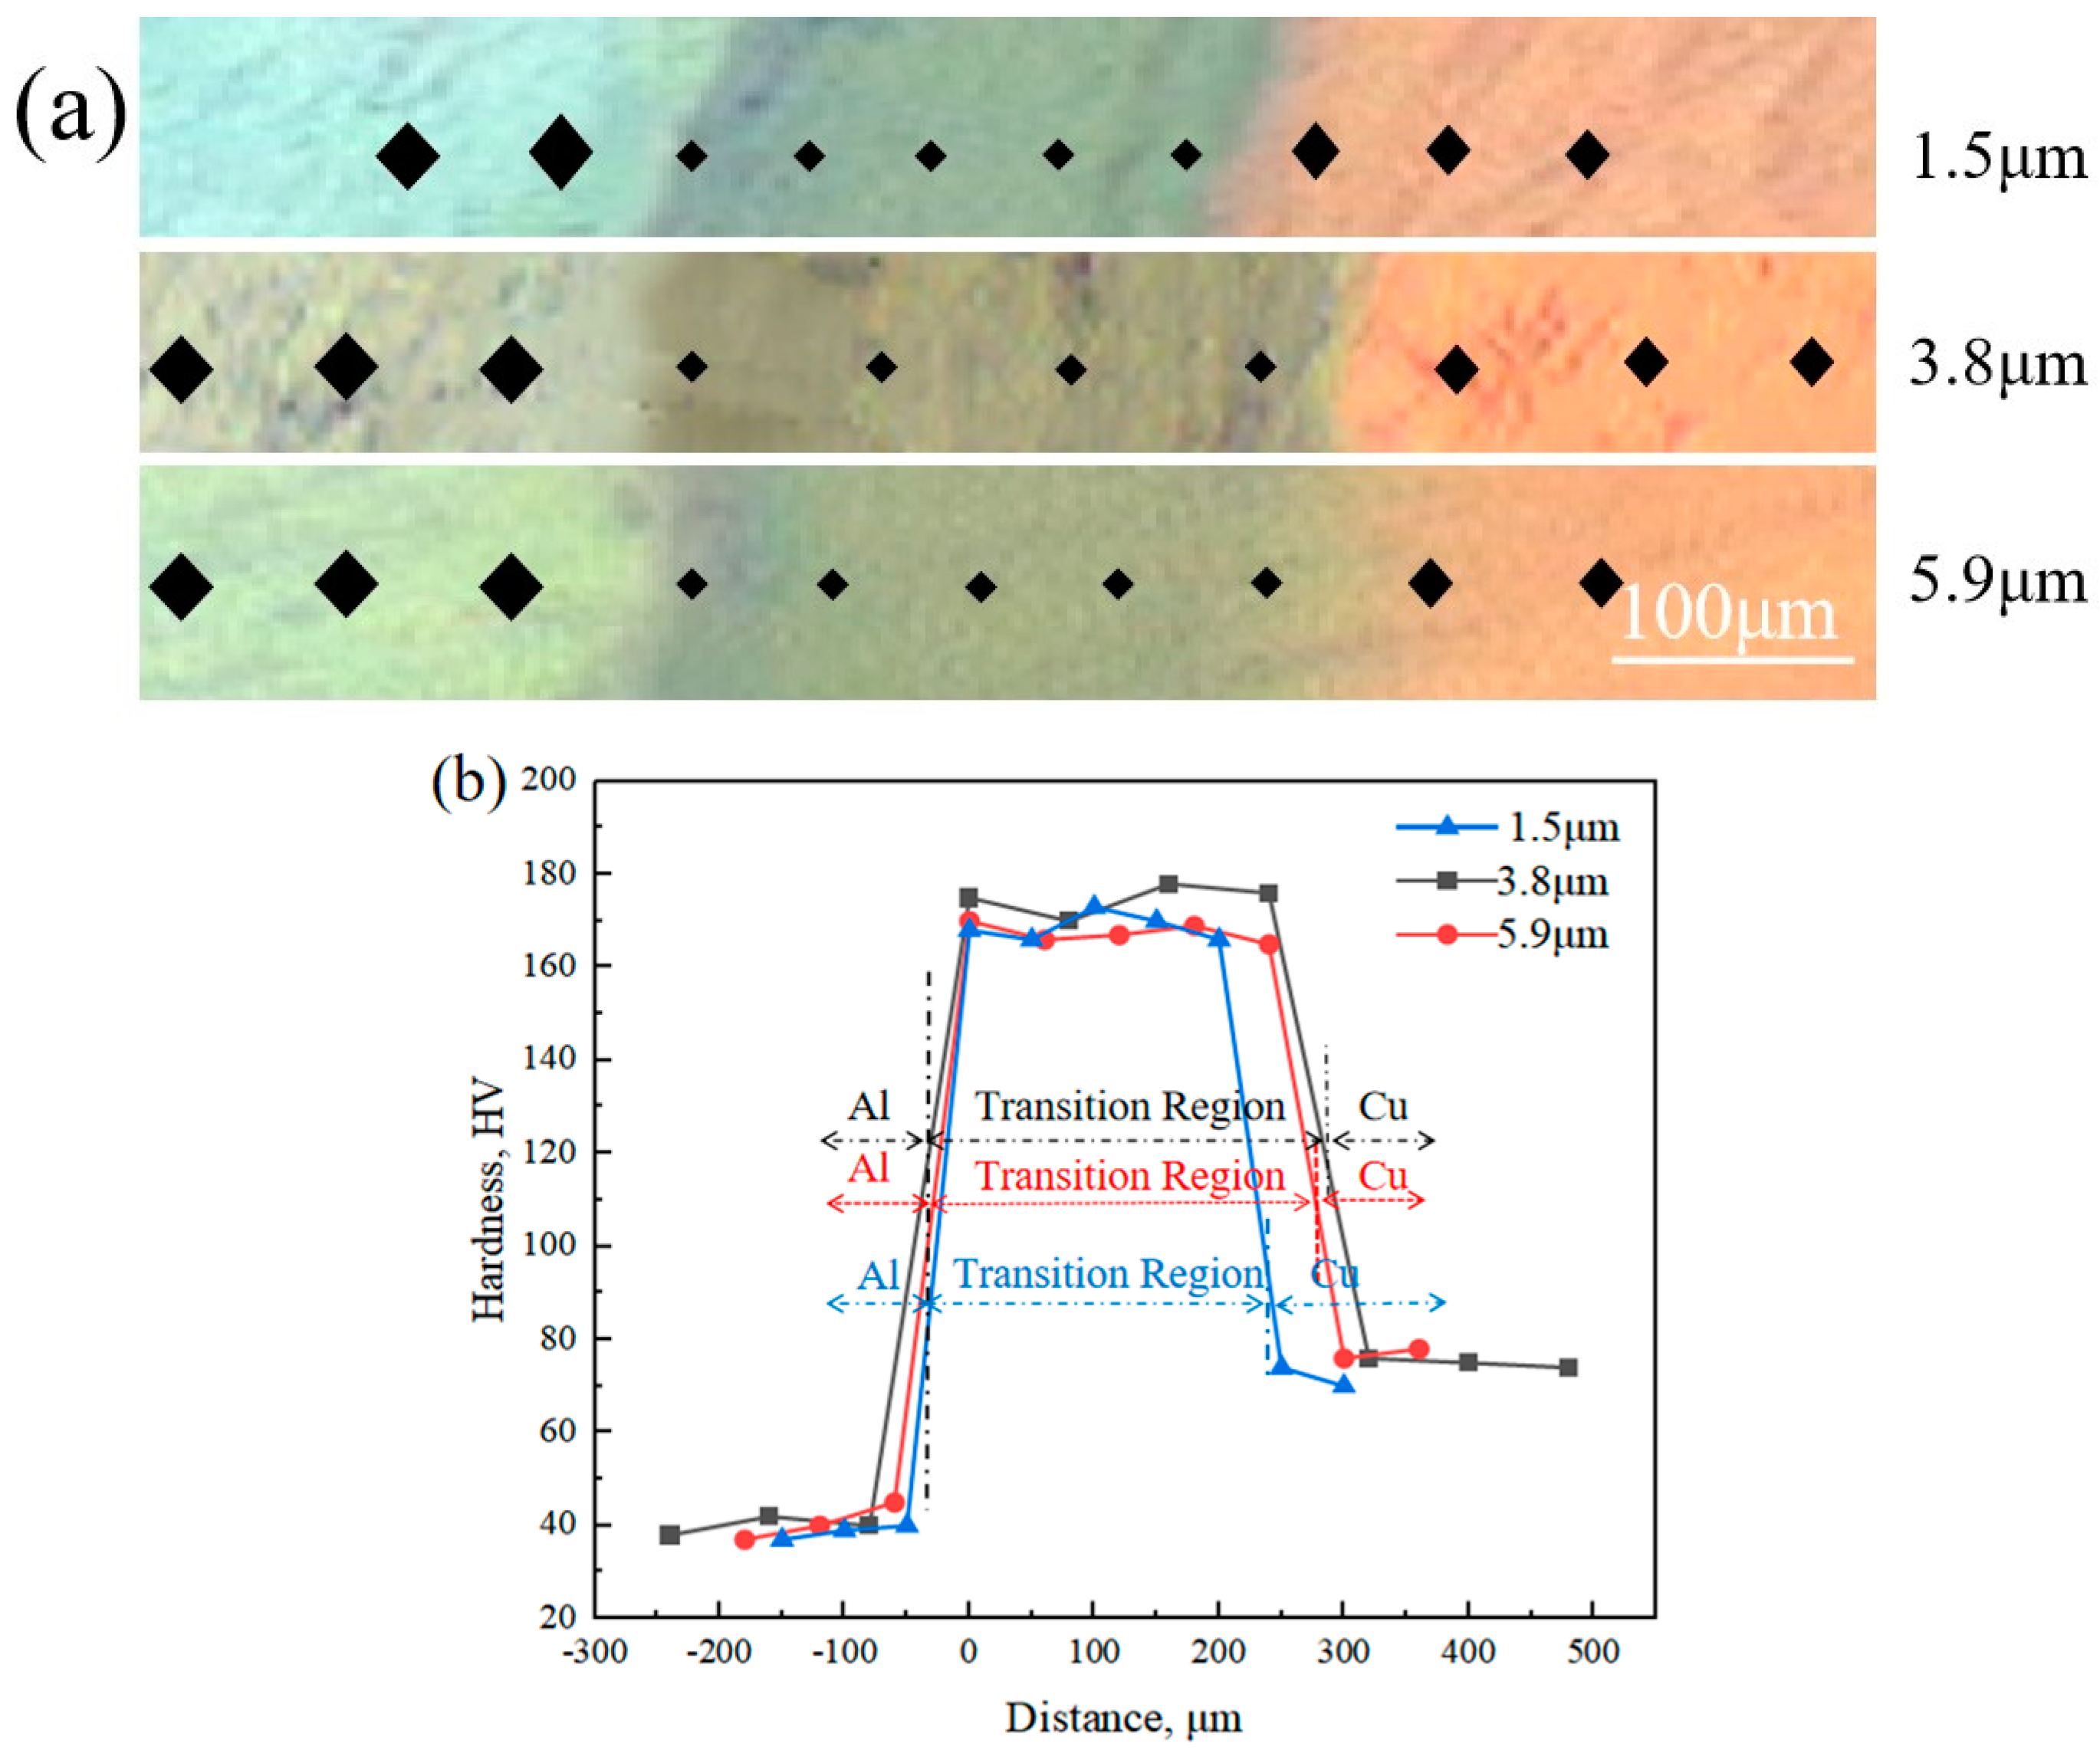
- Microhardness
4. Conclusions
- (1)
- The thickness of transition zone, shear strength, and microhardness of transition zone increased with increasing the liquid–solid volume ratio of Cu/Al bimetallic composite fabricated by gravity casting.
- (2)
- The thickness of transition zone and shear strength increased with the coating thickness of the Ni layer varied from 1.5 μm to 3.8 μm, due to the Ni layer effectively preventing oxidation on the surface of the Cu rod and promoting the metallurgical bonding of Cu/Al interface.
- (3)
- The thickness of the transition zone and shear strength decreased with increasing the coating thickness of Ni layer from 3.8 μm to 5.9 μm, due to the thick Ni layer limiting the diffusion of Cu and Al atoms.
- (4)
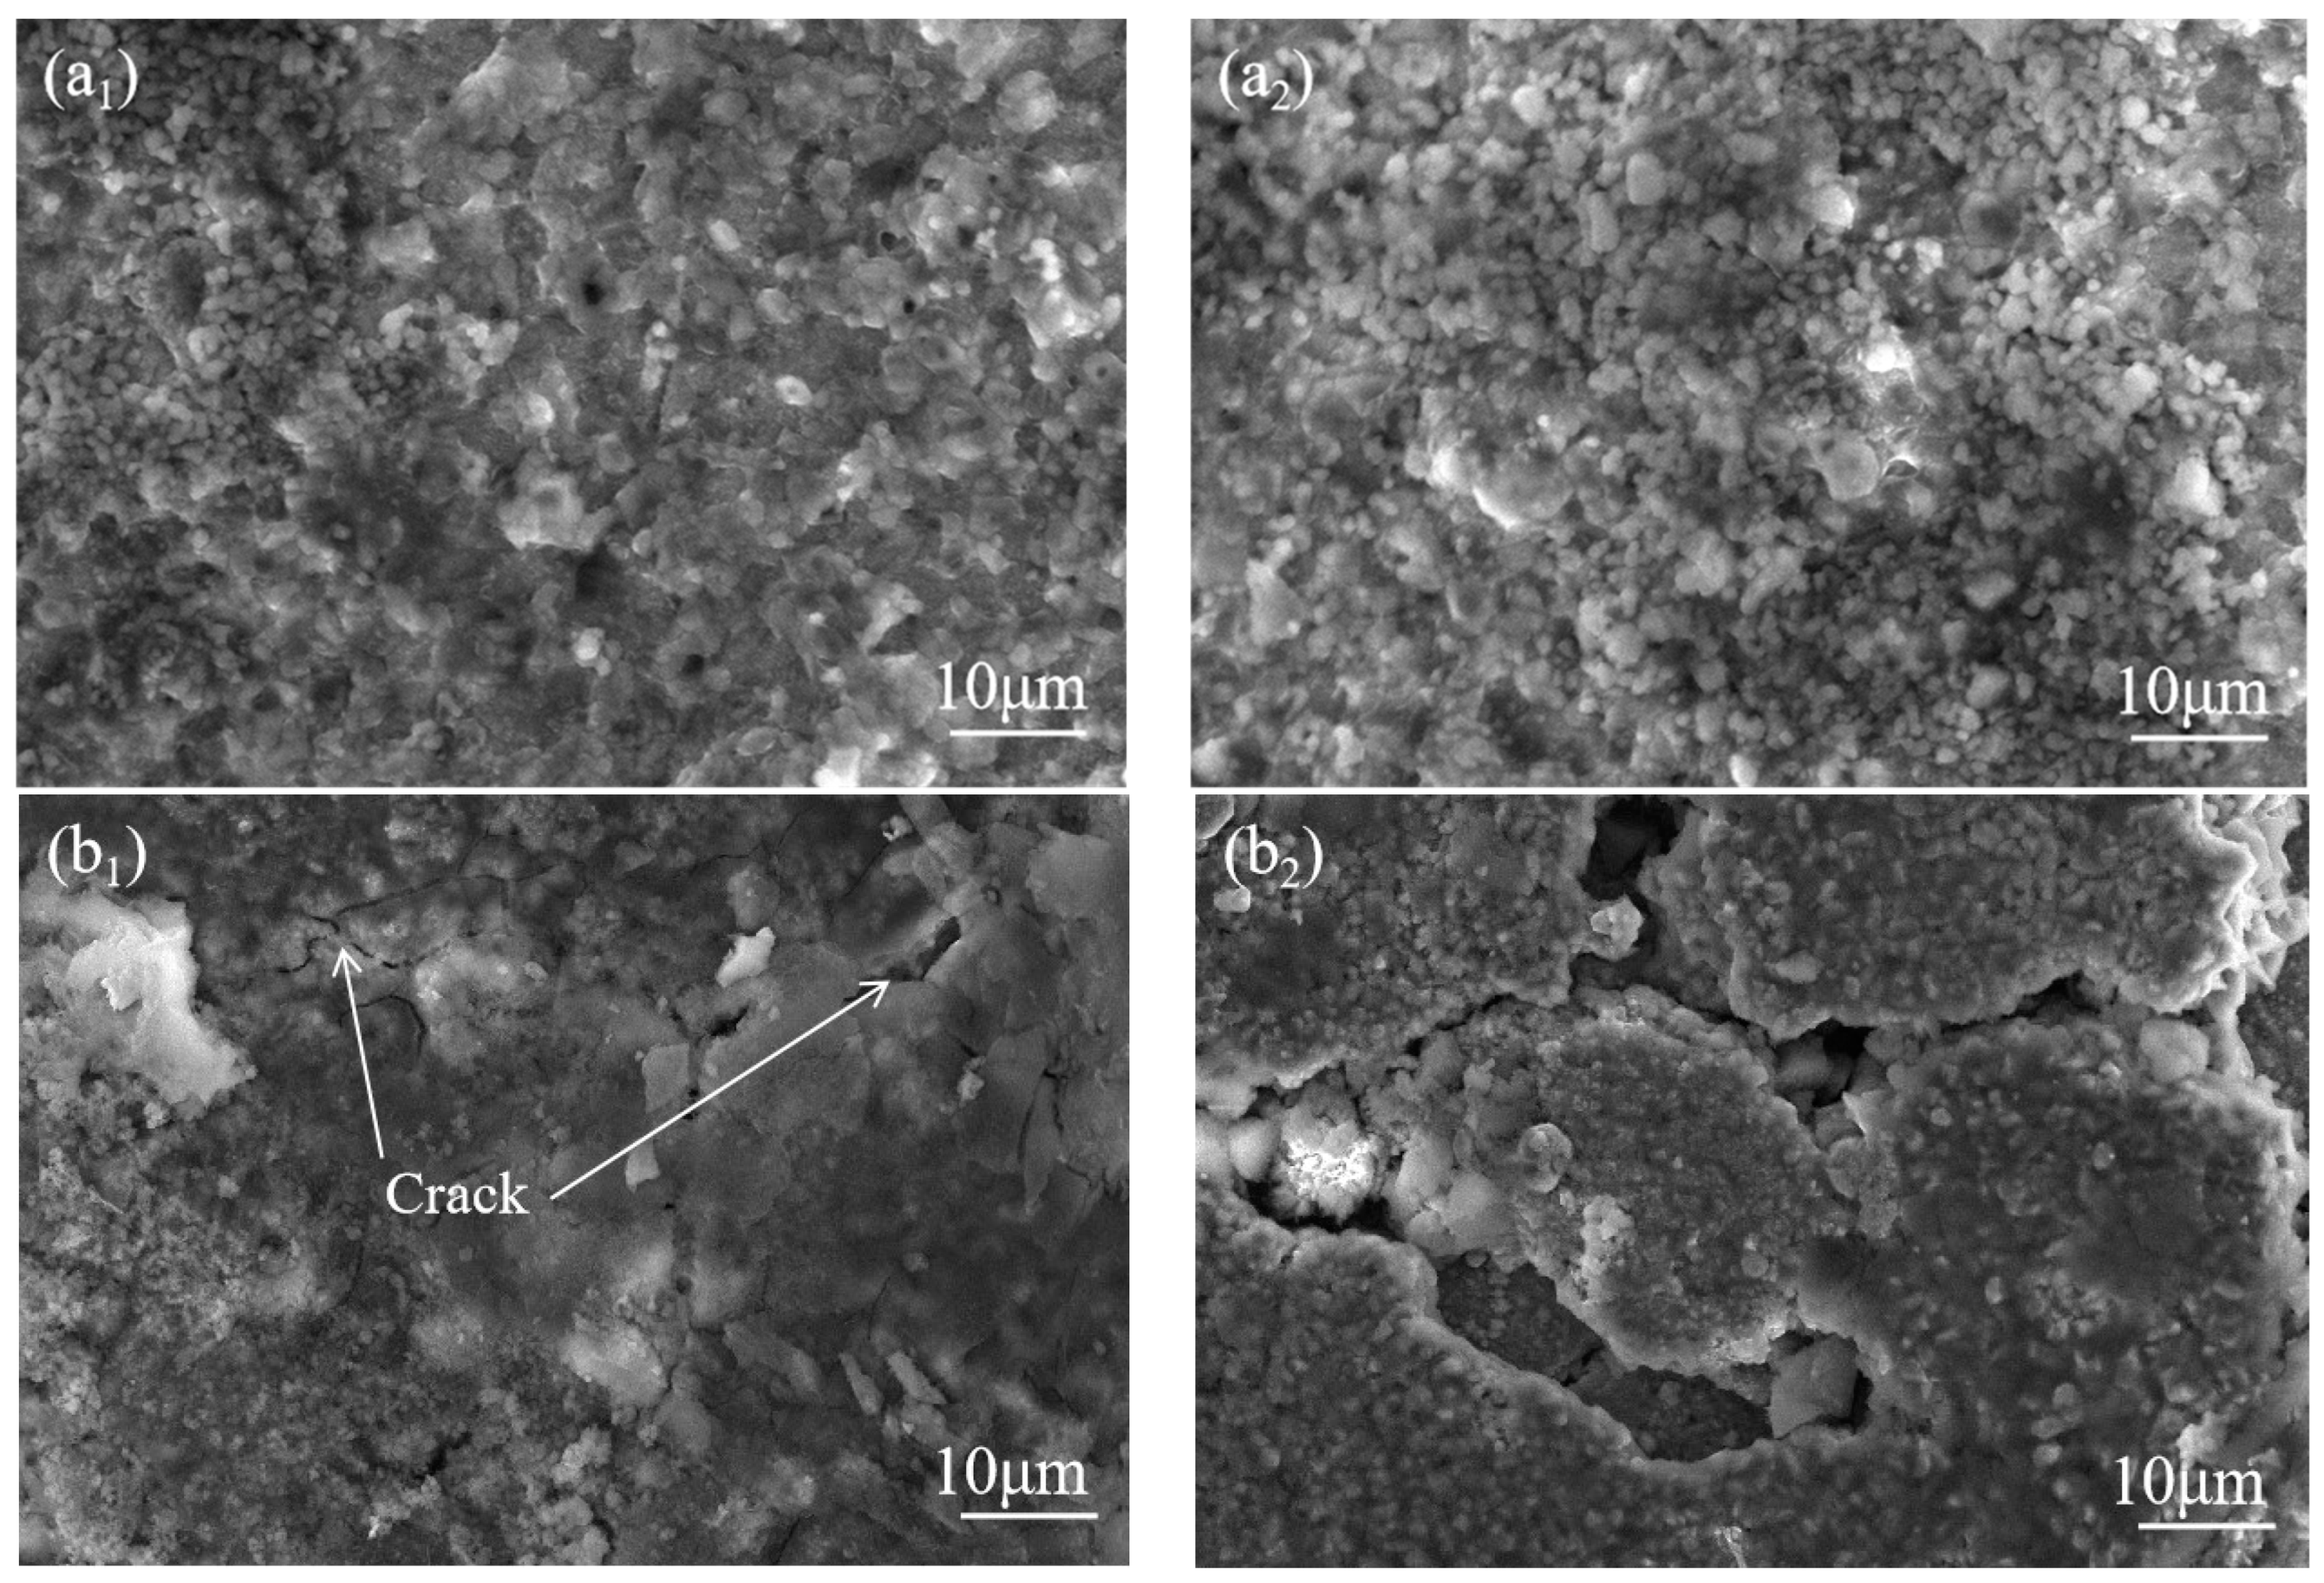
- The initiation and propagation of shear cracks occurred in the transition zone of Cu/Al bimetallic composite.
Author Contributions
Funding
Institutional Review Board Statement
Informed Consent Statement
Data Availability Statement
Conflicts of Interest
References
- Chandra, K.; Mahanti, A.; Singh, A.P.; Joshi, N.S.; Kain, V. Metallurgical Investigation on Embrittlement of Copper Cable of an Electric Motor. J. Fail. Anal. Prev. 2019, 19, 598–603. [Google Scholar]
- Zuo, L.; Ye, B.; Feng, J.; Kong, X.; Jiang, H.; Ding, W. Microstructure, tensile properties and creep behavior of Al-12Si-3.5Cu-2Ni-0.8Mg alloy produced by different casting technologies. J. Mater. Sci. Technol. 2018, 34, 1222–1228. [Google Scholar] [CrossRef]
- Zuo, L.; Ye, B.; Feng, J.; Xu, X.; Kong, X.; Jiang, H. Effect of δ-Al3CuNi phase and thermal exposure on microstructure and mechanical properties of Al-Si-Cu-Ni alloys. J. Alloys Compd. 2019, 791, 1015–1024. [Google Scholar] [CrossRef]
- Zhang, J.Y.; Zuo, L.J.; Jian, F.; Bing, Y.E.; Kong, X.Y.; Jiang, H.Y.; Ding, W.J. Effect of thermal exposure on microstructure and mechanical properties of Al–Si–Cu–Ni–Mg alloy produced by different casting technologies. Trans. Nonferr. Met. Soc. China 2020, 30, 1717–1730. [Google Scholar] [CrossRef]
- Zuo, L.; Ye, B.; Feng, J.; Zhang, H.; Kong, X.; Jiang, H. Effect of ε-Al3Ni phase on mechanical properties of Al–Si–Cu–Mg–Ni alloys at elevated temperature. Mater. Sci. Eng. A 2020, 772, 138794. [Google Scholar] [CrossRef]
- Vishnu, P.; Mohan, R.R.; Sangeethaa, E.K.; Raghuraman, S.; Venkatraman, R. A review on processing of aluminium and its alloys through Equal Channel Angular Pressing die. Mater. Today Proc. 2020, 21, 212–222. [Google Scholar] [CrossRef]
- Ghosh, A.; Ghosh, M.; Gudimetla, K.; Kalsar, R.; Kestens, L.A.I.; Kondaveeti, C.S.; Singh, P.B.; Ravisankar, B. Development of ultrafine grained Al–Zn–Mg–Cu alloy by equal channel angular pressing: Microstructure, texture and mechanical properties. Arch. Civ. Mech. Eng. 2020, 20, 7. [Google Scholar]
- Wang, T.; Li, S.; Ren, Z.; Han, J.; Huang, Q. A novel approach for preparing Cu/Al laminated composite based on corrugated roll. Mater. Lett. 2018, 234, 79–82. [Google Scholar] [CrossRef]
- Ye, Z.; Lv, Z.; Lu, M.; Jiang, H.; Li, S.; Li, Y.; Zhao, J.; He, J.; Zhang, L. Microstructure and properties of solid-liquid composite cast aluminum/copper bimetallic composite. Foundry Technol. 2022, 43, 176–179. [Google Scholar]
- Liu, G.; Wang, Q.; Jiang, H. New progress in research of copper/aluminum bimetallic composite. Mater. Guide 2020, 34, 7115–7122. [Google Scholar]
- Wang, J.; Lei, Y.; Liu, X.-H.; Xie, G.-L.; Jiang, Y.-Q.; Zhang, S. Microstructure and properties of horizontal continuous casting composite formed Cu/Al layered composite. J. Eng. Sci. 2020, 42, 216–224. [Google Scholar]
- Wang, B.; Huang, S.; Zhou, M.; Lei, Y.; Sun, S. 6061 aluminum alloy powder cold pressing forming constitutive model. Forg. Technol. 2018, 43, 56–61. [Google Scholar]
- Eivani, A.R.; Mirzakoochakshirazi, H.R.; Jafarian, H.R. Investigation of joint interface and cracking mechanism of thick cladding of copper on aluminum by equal channel angular pressing (ECAP). J. Mater. Res. Technol. 2020, 9, 3394–3405. [Google Scholar] [CrossRef]
- Vini, M.H.; Daneshmand, S.; Forooghi, M. Roll bonding properties of Al/Cu bimetallic laminates fabricated by the roll bonding technique. Technologies 2017, 5, 32. [Google Scholar] [CrossRef]
- Kouters, M.H.M.; Gubbels, G.H.M.; Dos Santos Ferreira, O. Characterization of intermetallic compounds in Cu-Al ball bonds: Mechanical properties, interface delamination and thermal conductivity. Microelectron. Reliab. 2013, 53, 1068–1075. [Google Scholar] [CrossRef]
- Wang, T.; Cao, F.; Zhou, P.; Kang, H.; Chen, Z.; Fu, Y.; Xiao, T.; Huang, W.; Yuan, Q. Study on diffusion behavior and microstructural evolution of Al/Cu bimetal interface by synchrotron X-ray radiography. J. Alloys Compd. 2014, 616, 550–555. [Google Scholar] [CrossRef]
- Zhao, K.N.; Liu, J.C.; Nie, X.Y.; Li, Y.; Li, H.X.; Du, Q.; Zhuang, L.Z.; Zhang, J.S. Interface formation in magnesium–magnesium bimetal composite fabricated by insert molding method. Mater. Des. 2016, 91, 122–131. [Google Scholar] [CrossRef]
- Xiong, B.; Cai, C.; Lu, B. Effect of volume ratio of liquid to solid on the interfacial microstructure and mechanical properties of high chromium cast iron and medium carbon steel bimetal. J. Alloys Compd. 2011, 509, 6700–6704. [Google Scholar] [CrossRef]
- Liu, G.; Wang, Q.; Zhang, L.; Ye, B.; Jiang, H.; Ding, W. Effect of Cooling Rate on the Microstructure and Mechanical Properties of Cu/Al Bimetal Fabricated by Compound Casting. Metall. Mater. Trans. 2018, 49, 661–672. [Google Scholar] [CrossRef]
- Tavassoli, S.; Abbasi, M.; Tahavvori, R. Controlling of IMCs layers formation sequence, bond strength and electrical resistance in Al-Cu bimetal compound casting process. Mater. Des. 2016, 108, 343–353. [Google Scholar] [CrossRef]
- Chen, S.; Chang, G.; Yue, X.; Li, Q. Solidification process and microstructure of transition layer of Cu–Al composite cast prepared by method of pouring molten aluminum. Trans. Nonferr. Met. Soc. China 2016, 26, 2247–2256. [Google Scholar] [CrossRef]
- Li, H.; Chen, W.; Dong, L.; Shi, Y.; Liu, J.; Fu, Y.Q. Interfacial bonding mechanism and annealing effect on Cu-Al joint produced by solid-liquid compound casting. J. Mater. Process. Technol. 2018, 252, 795–803. [Google Scholar] [CrossRef]
- Zhao, J.L.; Jie, J.C.; Fei, C.H.E.N.; Hang, C.H.E.N.; Li, T.J.; Cao, Z.Q. Effect of immersion Ni plating on interface microstructure and mechanical properties of Al/Cu bimetal. Trans. Nonferr. Met. Soc. China 2014, 24, 1659–1665. [Google Scholar] [CrossRef]
- Yan, S.; Shi, Y. Influence of Ni interlayer on microstructure and mechanical properties of laser welded joint of Al/Cu bimetal. J. Manuf. Process. 2020, 59, 343–354. [Google Scholar] [CrossRef]
- Ye, Z.; Huang, J.; Yang, H.; Liu, T.; Yang, J.; Chen, S. Effect of Si addition on corrosion behaviors of Cu/Al dissimilar joint brazed with novel Zn-Al-xSi filler metals. J. Mater. Res. Technol. 2019, 8, 5171–5179. [Google Scholar] [CrossRef]
- Breedis, J.F.; Fister, J.C. Copper Alloys for Suppressing Growth of Cu-Al Intermetallic Compounds. U.S. Patent 4498121, 5 February 1985. [Google Scholar]
- Yuan, H.U.; Chen, Y.Q.; Li, L.I.; Hu, H.D.; Zhu, Z.A. Microstructure and properties of Al/Cu bimetal in liquid-solid compound casting process. Trans. Nonferr. Met. Soc. China 2016, 26, 1555–1563. [Google Scholar]
- Liu, G.; Wang, Q.; Zhang, L.; Ye, B.; Jiang, H.; Ding, W. Effects of melt-to-solid volume ratio and pouring temperature on microstructures and mechanical properties of Cu/Al bimetals in compound casting process. Metall. Mater. Trans. A 2019, 50, 401–414. [Google Scholar] [CrossRef]
- Zhang, Y.; Yamane, T.; Hirao, K.; Minamino, Y. Microstructures and Vickers hardness of rapidly solidified Al-Cu alloys near the Al-Al2Cu equilibrium eutectic composition. J. Mater. Sci. 1991, 26, 5799–5805. [Google Scholar] [CrossRef]


| Cu/Al | 10 min | 25 min | 40 min |
|---|---|---|---|
| dclad. (μm) | 1.5 ± 0.15 | 3.8 ± 0.2 | 5.9 ± 0.3 |
| dtran. (μm) | 246 ± 5.4 | 286.3 ± 6.8 | 268 ± 5.5 |
| Time | 25 min | 40 min | |
|---|---|---|---|
| Element | |||
| Cu | 49.84 | 44.73 | |
| Al | 48.55 | 53.92 | |
| Ni | 0.87 | 1.22 | |
Disclaimer/Publisher’s Note: The statements, opinions and data contained in all publications are solely those of the individual author(s) and contributor(s) and not of MDPI and/or the editor(s). MDPI and/or the editor(s) disclaim responsibility for any injury to people or property resulting from any ideas, methods, instructions or products referred to in the content. |
© 2023 by the authors. Licensee MDPI, Basel, Switzerland. This article is an open access article distributed under the terms and conditions of the Creative Commons Attribution (CC BY) license (https://creativecommons.org/licenses/by/4.0/).
Share and Cite
Wu, Z.; Zuo, L.; Zhang, H.; He, Y.; Liu, C.; Yu, H.; Wang, Y.; Feng, W. Effect of Liquid-Solid Volume Ratio and Surface Treatment on Microstructure and Properties of Cu/Al Bimetallic Composite. Crystals 2023, 13, 794. https://doi.org/10.3390/cryst13050794
Wu Z, Zuo L, Zhang H, He Y, Liu C, Yu H, Wang Y, Feng W. Effect of Liquid-Solid Volume Ratio and Surface Treatment on Microstructure and Properties of Cu/Al Bimetallic Composite. Crystals. 2023; 13(5):794. https://doi.org/10.3390/cryst13050794
Chicago/Turabian StyleWu, Zhiyuan, Lijie Zuo, Hongliang Zhang, Yiqiang He, Chengwen Liu, Hongmiao Yu, Yuze Wang, and Wen Feng. 2023. "Effect of Liquid-Solid Volume Ratio and Surface Treatment on Microstructure and Properties of Cu/Al Bimetallic Composite" Crystals 13, no. 5: 794. https://doi.org/10.3390/cryst13050794