1. Introduction
Piezoceramics based on lead-free Na
0.5K
0.5NbO
3 (NKN) are very promising environmentally friendly materials for high-temperature applications due to their high Curie points [
1,
2]. Furthermore, among piezoelectric properties, the piezoelectric charge coefficient
d33 can reach values between 350 and 650 pC/N, similar to common lead zirconate titanate (PZT) compositions [
1,
2]. To further increase important values for sensor [
3,
4] or actuator applications [
4,
5], composites are a viable option. Therefore, the concept of ceramic/ceramic composites for energy-harvesting applications was explored using the model material NKN + 0.2% MnO/Al
2O
3 in a recent study [
6]. Despite the decrease in the piezoelectric properties, the generated power density remained approximately 0.1 µW/mm
3 between 0 and 15 vol% Al
2O
3 [
6]. As a result, this approach might be interesting for the optimization of piezoelectric energy harvesters. In addition, the composite approach was used to improve several other aspects of NKN-based ceramics. For instance, Yu et al. observed increased thermal stability in hot-pressed NKN with the addition of 0.5 mol% Al
2O
3 compared to pure NKN ceramics [
7]. Furthermore, NKN/Al
2O
3 composites were manufactured with the aim to improve upon the microwave absorption properties [
8,
9]. Other piezoelectric materials have been modified with the addition of Al
2O
3 as secondary particles, as well. Thommerel et al. modified the resonance frequency of Pb
0.925La
0.05 (Zr
0.53Ti
0.47)O
3−δ ceramics [
10], allowing for the adjustment of said frequency according to the application. Cao et al. induced a metastable ferroelectric phase into Pb
0.99Nb
0.02 [(Zr
0.57Sn
0.43)
0.94Ti
0.06]
0.98O
3 ceramics via internal stress caused by the thermal expansion mismatch with Al
2O
3 particles [
11]. This metastable phase led to an increase in the pyroelectric response. However, during the sintering process, interdiffusion can occur, leading to an interface with different properties, which in turn can change the macroscopic properties. This can be seen in studies that directly substituted the A or B atoms of the perovskite crystal structure in NKN-based materials.
The inclusion of Li
+ ions in the crystal structure leads to an increase in the piezoelectric properties, such as
(>200 pC/N) and
(>40%) [
12], which is understood to be due to the shift of the polymorphic phase temperature to room temperature. Furthermore, Tan et al. have shown that the substitution of Al in 0.955(K
0.5Na
0.5)(Nb
0.965Sb
0.035)O
3-0.045(Bi
1−xAl
x)Na
0.5ZrO
3 ceramics leads to a piezoelectric charge coefficient of approximately 570 pC/N [
13]. After adding ZrO
2 or TiO
2, Vendrell et al. observed an increase in the piezoelectric charge coefficient from approximately 110 pC/N to 134 pC/N and 124 pC/N, respectively [
14]. This was ascribed to the increased number of oxygen vacancies introduced via acceptor doping. Furthermore, by optimizing the number of oxygen vacancies, electric-field-induced strains can be enhanced [
15]. This was shown by Zhao et al., who introduced Fe
2+ and Cu
+ ions into the lattice of NKN, revealing a unipolar strain of approximately 0.5% at 5 kV/mm, achieved through the formation of defect dipoles and internal bias fields [
15]. On the other hand, studies on BaTiO
3 have shown that an increased concentration of oxygen vacancies can induce time-dependent degradation, which could be mitigated by co-doping with donor materials [
16]. Similar changes in the electromechanical properties are expected in the case of composites around the particles, where, through substitution, an interface occurs. To gain a better understanding of this interface, we focus on changes in the electrical properties, mainly impedance, using impedance spectroscopy.
Impedance spectroscopy is a versatile tool that can be used to characterize the electrical properties of polycrystalline microstructures [
17]. In addition to the possibility of gathering information on the dielectric and conductive properties of grains, grain boundaries, and interfaces, changes in the domain structure and oxygen vacancies can be measured [
18,
19,
20,
21]. For instance, Zeng et al. showed that the activation energy evaluated by the temperature-dependent conductivity could be decreased by doping 0.3Pb(Zn
1/3Nb
2/3)O
3–0.7Pb(Zr
0.49Ti
0.51)O
3 with LiF, as the number of oxygen vacancies increased [
18]. Similar results were measured for Tb- and Tm-doped NKN [
19]. However, the activation energy can also be changed during fatigue, as shown by Nishiyama et al. [
20] in Li-modified NKN. Here, the changes were attributed to the anisotropic character of the ion conductivity of the lattice; due to an increase in the c-axis orientation along the measurement direction during fatigue, the ion conductivity increased macroscopically. On the other hand, in the material system (K
0.5Na
0.5)(Nb
0.995Mn
0.005)O
3–xCuO (0 ≤ x ≤ 2 mol%), an increase in the activation energy was observed [
21], suggesting either a decrease in oxygen vacancies or overall lower ion conduction. Therefore, impedance spectroscopy can give information not only about the conductivity of a material but also potentially about the concentration of oxygen vacancies.
As impedance spectroscopy allows for the distinction between grains and grain boundaries, it is used to measure the contribution to the overall impedance of these different aspects of a polycrystalline sample. As a result, by knowing each contribution to the dielectric and electric properties, composites can be optimized to achieve favorable properties. As such, impedance spectroscopy has been used to analyze 3-0 composite piezoelectrics (notation after Newnham [
22]). For instance, in order to achieve the magnetoelectric effect, Ni
0.5Zn
0.5Fe
2O
4 [
23] and CoFe
2O
4 [
24] were added to PZT. In the first case, impedance spectroscopy revealed the main contribution to the overall resistivity to stem from the grain boundary due to the formation of a glass phase [
23], whereas in the Pb
0.52Zr
0.48TiO
3–CoFe
2O
4 composites, the oxide-ion conductor phase of Pb
0.52Zr
0.48TiO
3 and the polaronic conductor phase of CoFe
2O
4 [
24] showed separate relaxation responses. As such, impedance spectroscopy was used in this study in order to reveal the different contributions of the grain and grain boundary in the previously reported ferroelectric NKN + 0.2% MnO/paraelectric Al
2O
3 composites. Furthermore, the impact of the interface on the electric properties was observed. Additionally, activation energies were determined, thus giving an idea of the concentration of oxygen vacancies. These results were then used to clarify to what extent interdiffusion between materials occurred.
3. Results
The impedance of the composite material is affected by its conductive and dielectric properties. As such,
Figure 1 displays the relative permittivity and dielectric loss of NKN with different vol% Al
2O
3 as a function of temperature. At approximately 400 °C, an anomaly was observed, which is understood to be the Curie point of NKN separating the ferroelectric tetragonal (
P4
mm) and paraelectric cubic (
Pm3
m) phases [
26]. An overall decreasing trend of permittivity with increasing amounts of paraelectric Al
2O
3 was apparent, as well as a decrease in the Curie point. This is in line with previous findings, where hot-pressed NKN with the addition of 0.5 mol% Al
2O
3 exhibited a slight decrease in the Curie point after calcination [
7]. In addition, Fisher et al. have shown that with an increasingly more reducing atmosphere, the Curie point shifts to lower values [
27]. These changes were attributed to an increase in the concentration of oxygen vacancies. In other ferroelectric materials, such as BaTiO
3, a decrease in the Curie point is observed when Fe [
28] is introduced into the perovskite lattice. The decrease in this study could therefore stem from the interdiffusion of Al
3+ ions. Cheng et al., on the other hand, found that substituting the B-side of the perovskite structure with Al
3+ leads to an increase in the Curie point [
29]. It should be noted that, here, significant differences in the microstructure were apparent, which was shown to have an effect on the phase transition temperature [
30]. In NKN ceramics, an increase in grain size leads to an increase in the Curie point [
30]. Since there was a slight decrease in the average grain size in this study, this could have potentially had another impact on the phase transition temperature. Furthermore, a decreasing effect has been previously observed in other perovskite ferroelectrics, such as BaTiO
3 [
31,
32], during the application of external hydrostatic pressure. It should be noted that the direction of the shift depends on the kind of applied mechanical stress. For instance, it was previously shown that uniaxial compressive stress increased the Curie point of NKN-based ceramics [
33]. As such, the stress state in the composites is suggested to be of a hydrostatic nature, leading to a shift of the phase transition temperature to lower values.
On the other hand, the dielectric loss showed an increasing trend with a subsequent decrease, reaching a minimum of 0.2 at 360 °C for NKN with 25 vol% Al
2O
3. It is possible that the introduction of Al
2O
3 results in two opposing effects that increase and decrease the dielectric loss. The introduction of Al
2O
3 should theoretically decrease the dielectric loss, since alumina has a significantly lower value than NKN [
34]. Nevertheless, interdiffusion between the two materials during the sintering process is unavoidable, which leads to an interface with potentially higher dielectric loss. As such, the latter effect is more pronounced at 5 vol% but is taken over by the first with increasing amounts of Al
2O
3. It should be noted that sample variations in the microstructure and porosity could lead to differences, as well.
Besides the shift of the Curie point, the Curie–Weiss temperature and the diffusiveness of the phase transition can change with the introduction of stress or dopants [
28,
32,
35,
36]. In the paraelectric phase, the temperature dependence of the dielectric constant of NKN is described by the Curie–Weiss law. The Curie–Weiss temperature
was determined by performing a linear extrapolation of the inverse dielectric constant from the high-temperature region to zero. The Curie point and Curie–Weiss temperature are shown in
Figure 1b as a function of vol% Al
2O
3. The difference between
and
increased with the addition of 5 vol% Al
2O
3 and remained relatively constant with additional amounts. This suggests an increase in the first-order character of the transition, which can also be observed as a decrease in the maximum permittivity [
32]. This would be consistent with the mechanism of uniaxial compression [
35]. However, due to a decrease in the Curie point, hydrostatic compression was suggested, which would lead to a phase transition of the second order, meaning that the Curie point and Curie–Weiss temperature coincide [
37]. On the other hand, BaTiO
3 showed a general increase in the difference between
and
with increasing amounts of the dopant [
28]. Only at higher amounts was a decreasing trend observed, which would be consistent with the results of this study.
In order to determine the diffusiveness of the phase transition, Uchino and Nomura proposed an empirical relation [
36]:
where
is the maximum permittivity,
is the corresponding temperature, and
K is a constant. The exponent
is used to characterize the diffusiveness of the phase transition, where a value of
= 1 represents a sharp transition, and a value
= 2 corresponds to a diffuse transition. The value of
was determined by performing linear regression fits to log–log plots of permittivity as a function of temperature, as described in Equation 6. The obtained values are shown in
Figure 1c as a function of vol% Al
2O
3. The diffusiveness of the phase transition decreased from approximately 1.3 to 1.1 between 0 and 10 vol%. After plateauing between 10 and 20 vol%, the exponent increases again to approximately 1.25. This trend is consistent with previous studies on BaTiO
3 and Fe as a dopant [
28]. Mechanical stress, on the other hand, would show an overall increasing character in diffusiveness [
35]. As such, the results point toward the interdiffusion of Al
3+ ions being the predominant process at lower vol% Al
2O
3. Due to the concurrent effects of internal stress, interdiffusion, and doping at higher Al
2O
3 contents, the exact mechanism driving the observed trend remains uncertain. In order to better understand the sample-to-sample variation in one composition, three samples were measured in total for each vol% Al
2O
3. To have a conservative estimate of the variation, the largest standard deviation was chosen, with the added uncertainty from the linear fitting function. This resulted in variations of ±2%, ±4%, and ±5%, for the Curie point, Curie–Weiss temperature, and diffusiveness, respectively. The possible reasons for the variation are as follows: firstly, the estimation of the Curie–Weiss temperature and diffusiveness rely on the estimation of said values via the fitting function; secondly, the observed variance between the samples could also be related to the microstructure, since grain size and porosity affect the diffusiveness of the phase transition. For instance, decreasing the grain size increases the diffusiveness [
38,
39,
40]. Additionally, the aforementioned interdiffusion between the materials is dependent on the connection between the NKN and Al
2O
3 particles during the sintering process. The agglomeration of Al
2O
3 could still be present, with the variation in the amount resulting in different volumes of the interface between the two materials. As previously discussed, oxygen vacancies can change the Curie point, as well as the Curie–Weiss temperature and diffusiveness. Furthermore, due to differences in the thermal expansion coefficient, mechanical stress can occur during and after the sintering process. Variations in this internal stress can lead to variations between samples of the same composition, since mechanical stress has been shown to impact the discussed values in
Figure 1b,c.
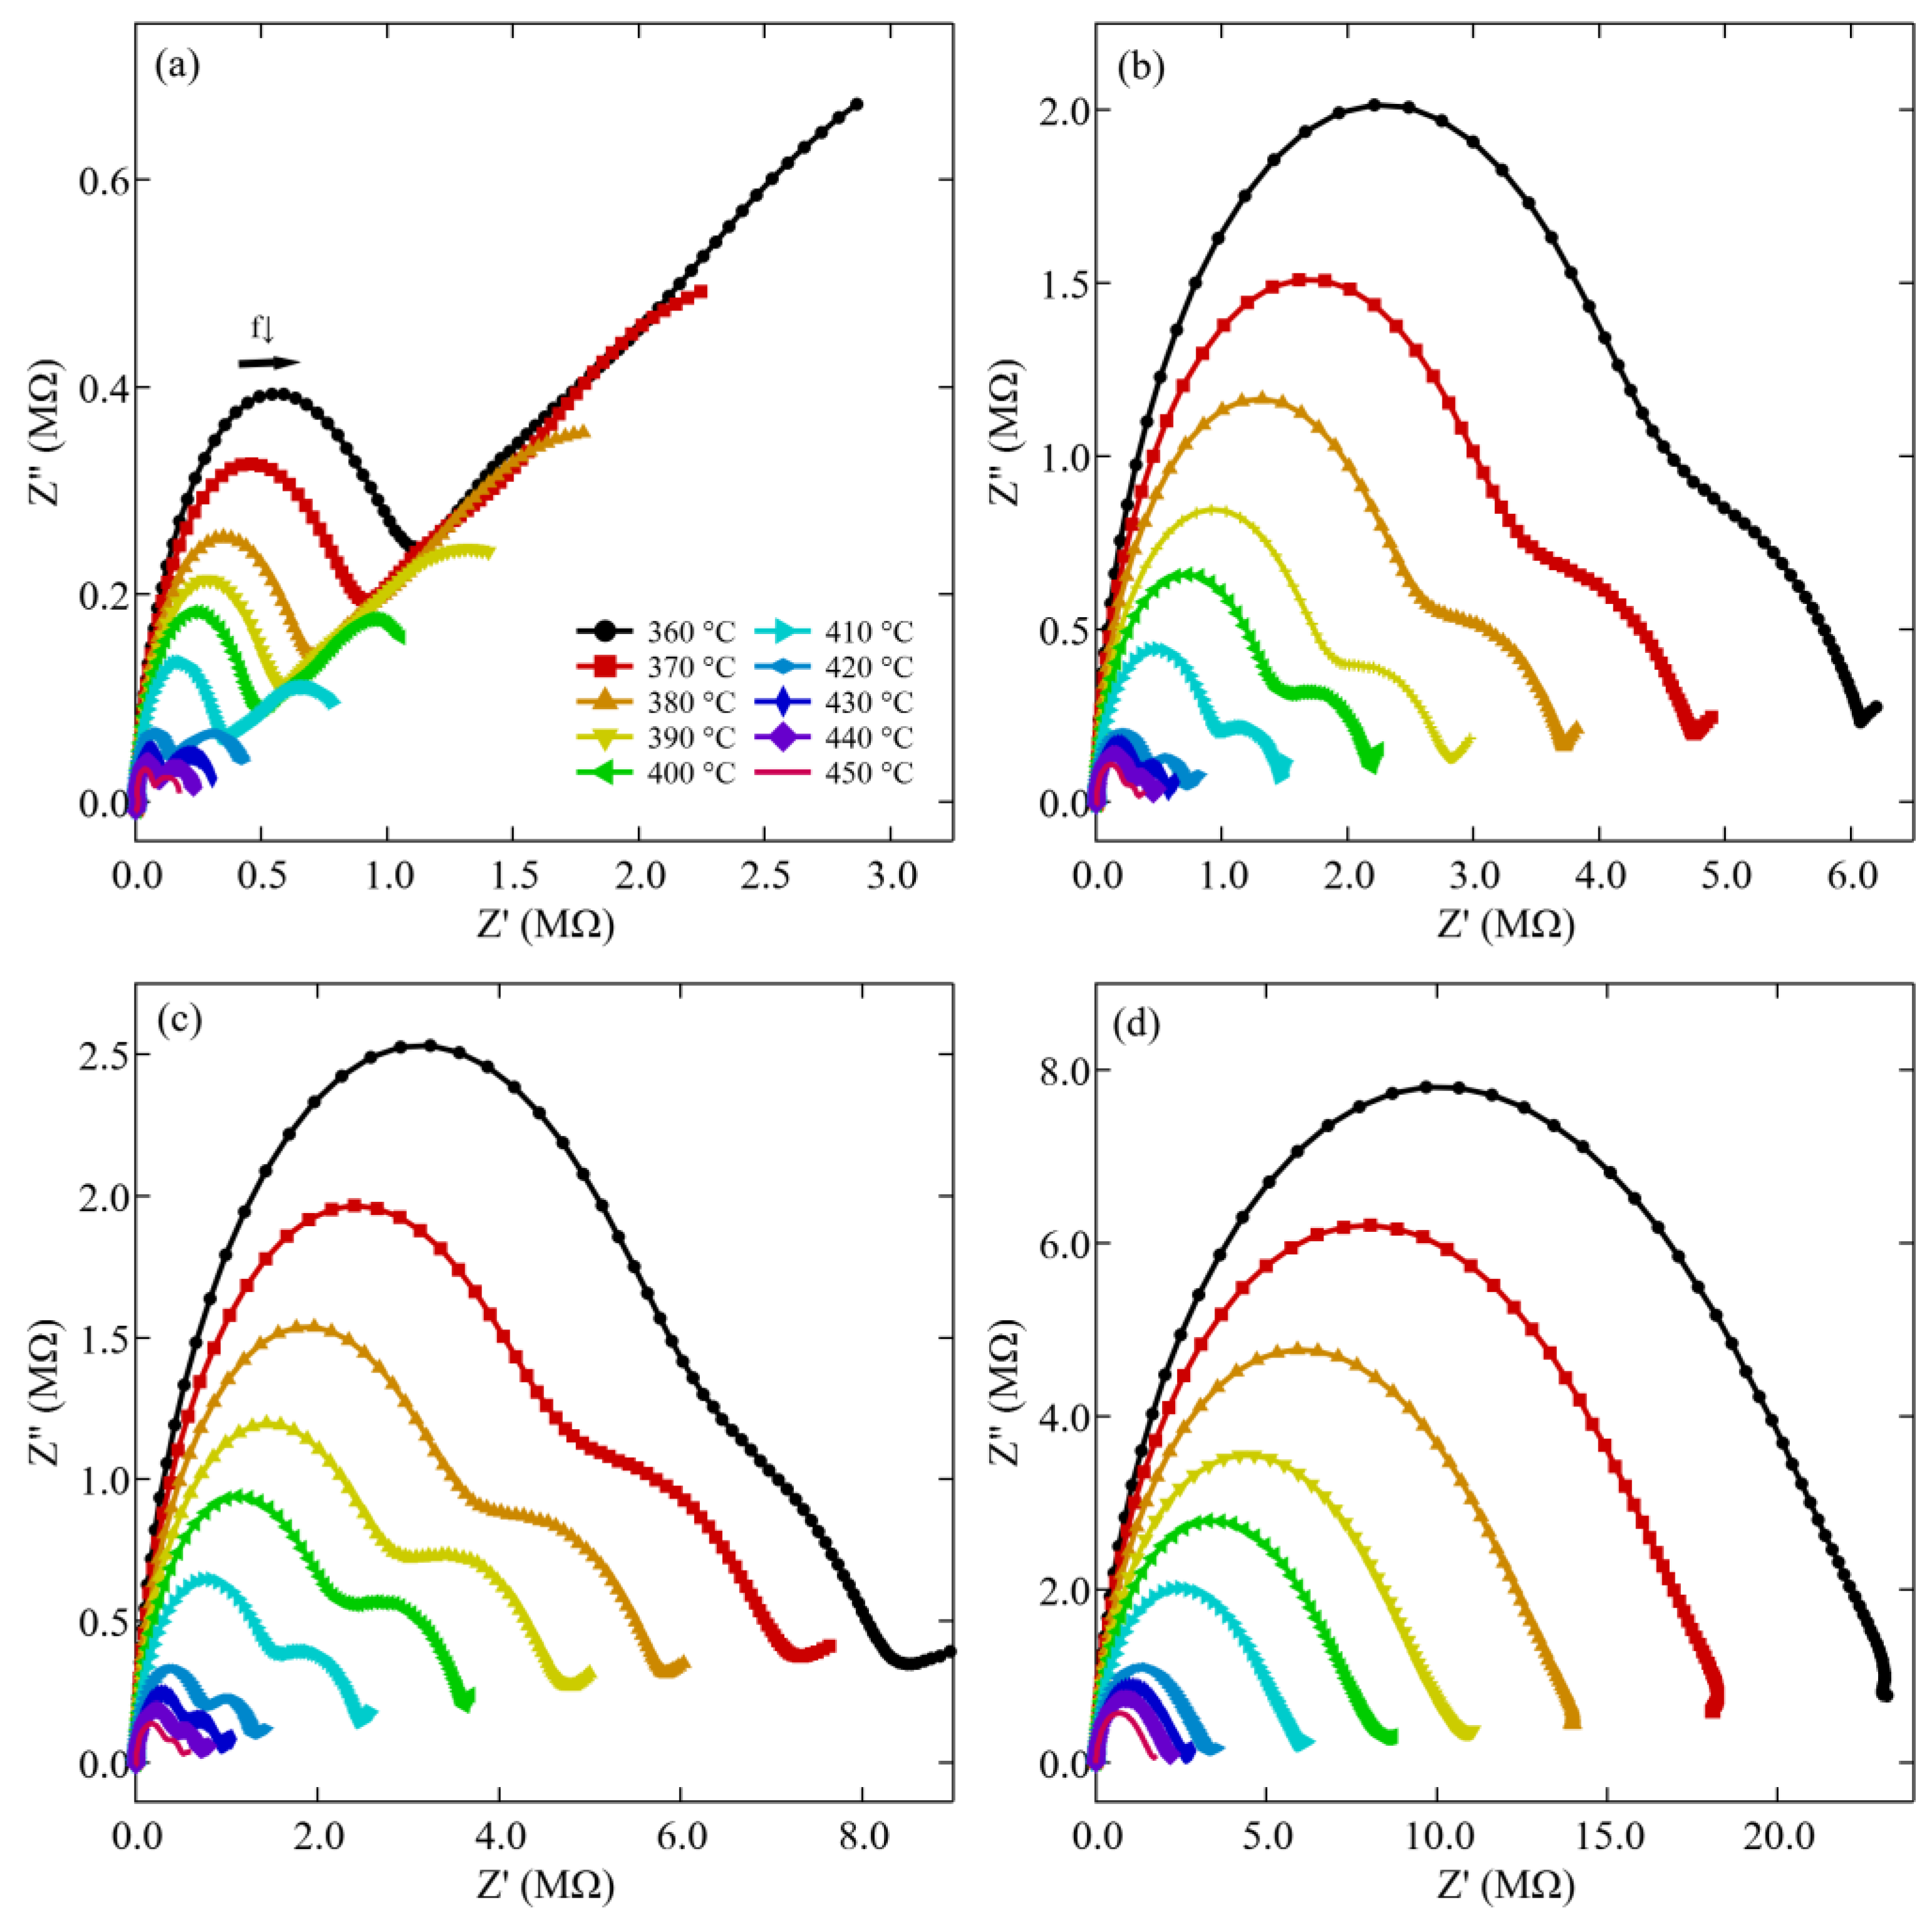
Figure 2 shows the frequency-dependent imaginary versus real part of the impedance (Nyquist plots) of the prepared composites with different Al
2O
3 contents as a function of temperature. All samples exhibit two semicircles that refer to the high- and intermediate-frequency-associated bulk and grain boundary impedance, respectively [
17,
41], where the low-frequency tail feature of the impedance spectra appears due to the electrode/material interface. As the temperature increases, the radius of the two semicircles decreases, which is likely due to an increase in the overall conductivity. Between 410 °C and 420 °C, the temperature range at which NKN transitions from a ferroelectric tetragonal phase into a paraelectric cubic phase, a significant decrease in real and imaginary impedance occurred. With increasing amounts of Al
2O
3, the response evolves into a single semi-circle due to the superimposed bulk and grain boundary contributions. Furthermore, it should be noted that the range of the
y-axis, as well as the
x-axis, is adjusted for different Al
2O
3 contents to improve visibility. As such, when comparing the different compositions, an increase in the real and imaginary impedance with increasing vol% Al
2O
3 is apparent. Similar to what has been observed in Pb
0.925La
0.05 (Zr
0.53Ti
0.47)O
3−δ with variable fractions of Al
2O
3 [
10], the change could be due to an increase in the resistivity of the bulk response with increasing content.
To gain more insight, the imaginary part of the impedance (Bode plot), as well as the electrical modulus, is shown as a function of frequency (
Figure 3). Similar to the Nyquist plots discussed earlier, two relaxation processes can be observed for all composites for the Bode plots. At 360 °C, the relaxation frequency for the bulk material is in the range of 0.1–1 kHz. At lower frequencies, around 10 Hz, the relaxation process for the grain boundary can be observed. In general, the relaxation frequencies of a material depend on the conductivity
, as well as on the relative permittivity
:
With increasing temperature, both maxima shift to higher frequencies, which is likely due to an increase in conductivity, suggesting that the bulk and grain boundary relaxation process is thermally activated. On the other hand, the relaxation frequency of the bulk response decreases with increasing amounts of Al
2O
3. Interestingly, the response of the grain boundary remains relatively constant. In order to understand this behavior, additional factors that may influence the relaxation frequency will be discussed. For instance, the decreasing trend in the relaxation frequency of the bulk may indicate a decrease in conductivity rather than changes in capacitance. At 360 °C the relative permittivities were 1526, 1540, 1495, 1372, and 1369 for NKN samples with 0 vol%, 5 vol%, 10 vol%, 15 vol%, 20 vol%, and 25 vol% Al
2O
3, respectively. With decreasing permittivity, the relaxation frequencies would shift to higher values, indicating that conductivity is the predominant factor. Another aspect that can change the value of the relaxation frequency is the change in the microstructure. This was shown for 0.925(K
0.5Na
0.5)NbO
30.075Bi(Zn
2/3(Ta
0.5Nb
0.5)
1/3)O
3 ceramics, where the bulk resistance gradually increased with decreasing grain size [
42]. Since the average grain size did decrease with increasing vol% Al
2O
3 [
6], a similar trend is to be expected. However, it should also be noted that the microstructure remained in relatively the same order of magnitude, suggesting a rather small impact [
6]. Furthermore, the electrical insulative property of Al
2O
3 would have an effect analogous to that of pores. Previous studies have shown that the effective conductivity decreases with increasing porosity, resulting in a shift to lower frequencies [
43]. A similar effect should therefore be observed not only for the bulk but also for the grain boundary response. The last possibility is that, through interdiffusion, Al
2O
3 changes the conductivity of the grain boundary/creates an interface with different conductivities. This has been observed for YSZ/Al
2O
3 composites, where the interface had a higher conductivity, thus increasing the relaxation frequency [
44,
45]. Interestingly, a slight increase in the relaxation frequency was observed between 0 and 5 vol%. Similar observations were made on YSZ/Al
2O
3, where the grain boundary conductivity increased between 0 and 1 wt%, followed by a gradual decrease with the further addition of Al
2O
3 [
44]. It is likely that the pore effect and the formation of the interface have opposing effects on conductivity. Whereas the formation of the interface decreases the conductivity of the grain boundary, the addition of Al
2O
3 decreases the overall conductivity for both bulk and grain boundary.
To further confirm this, the electric modulus
was calculated, since changes in the modulus suggest possible changes in capacitance, whereas changes in the impedance are based on changes in resistance [
46]. The electric modulus was calculated from Equations (4) and (5). From the values of
, the imaginary part was determined. Maxima were clearly observed to be similar to the peaks in the impedance representing dielectric relaxation processes, albeit at different frequencies. In the ideal Debye-type relaxation process, the two peaks should coincide at the same frequency [
47]. The large full width at half maximum and the asymmetrical shape of the peaks also suggest non-Debye behavior [
48]. Similar to the observations on the relaxation peaks of the impedance, the maxima shifted to the higher frequency range with an increase in temperature, further confirming that the relaxation process is a thermally activated process. In addition, the value decreases with temperature until reaching the Curie point. Afterward, the peak increases in value with increasing temperature. The peak maxima are related to the relative permittivity as follows:
Since NKN undergoes a first-order ferroelectric-to-paraelectric phase change, the permittivity exhibits a finite maximum, and the electric modulus shows a minimum. Furthermore, since the maximum was only observed for the grain, it can be concluded that the dielectric relaxation is derived from the grain response. The increasing value of the peak maximum can also be explained by the actuation of the small polaron hopping mechanism and a simultaneous decrease in electron–lattice coupling, which was observed in a previous study on (Na
0.52K
0.4425Li
0.0375)(Nb
0.92Ta
0.08)O
3 to be well above the Curie point [
49]. With increasing Al
2O
3 concentrations, the relaxation peak shifts to lower frequencies, which suggests an increase in the relaxation time that is closely related to a decrease in dielectric permittivity (
Figure 1). This is further confirmed by the increase in the maximum values of
with increasing amounts of Al
2O
3. However, this change was not as significant as changes in the impedance with increasing vol%, further confirming that the predominant factor is the change in conductivity. It should be noted that at the highest frequency range, the imaginary electric modulus shows an additional inclination with increasing frequency. This could potentially be another relaxation process in the sample. Nevertheless, due to the limited observed range, it is not possible to make statements on the cause.
4. Discussion
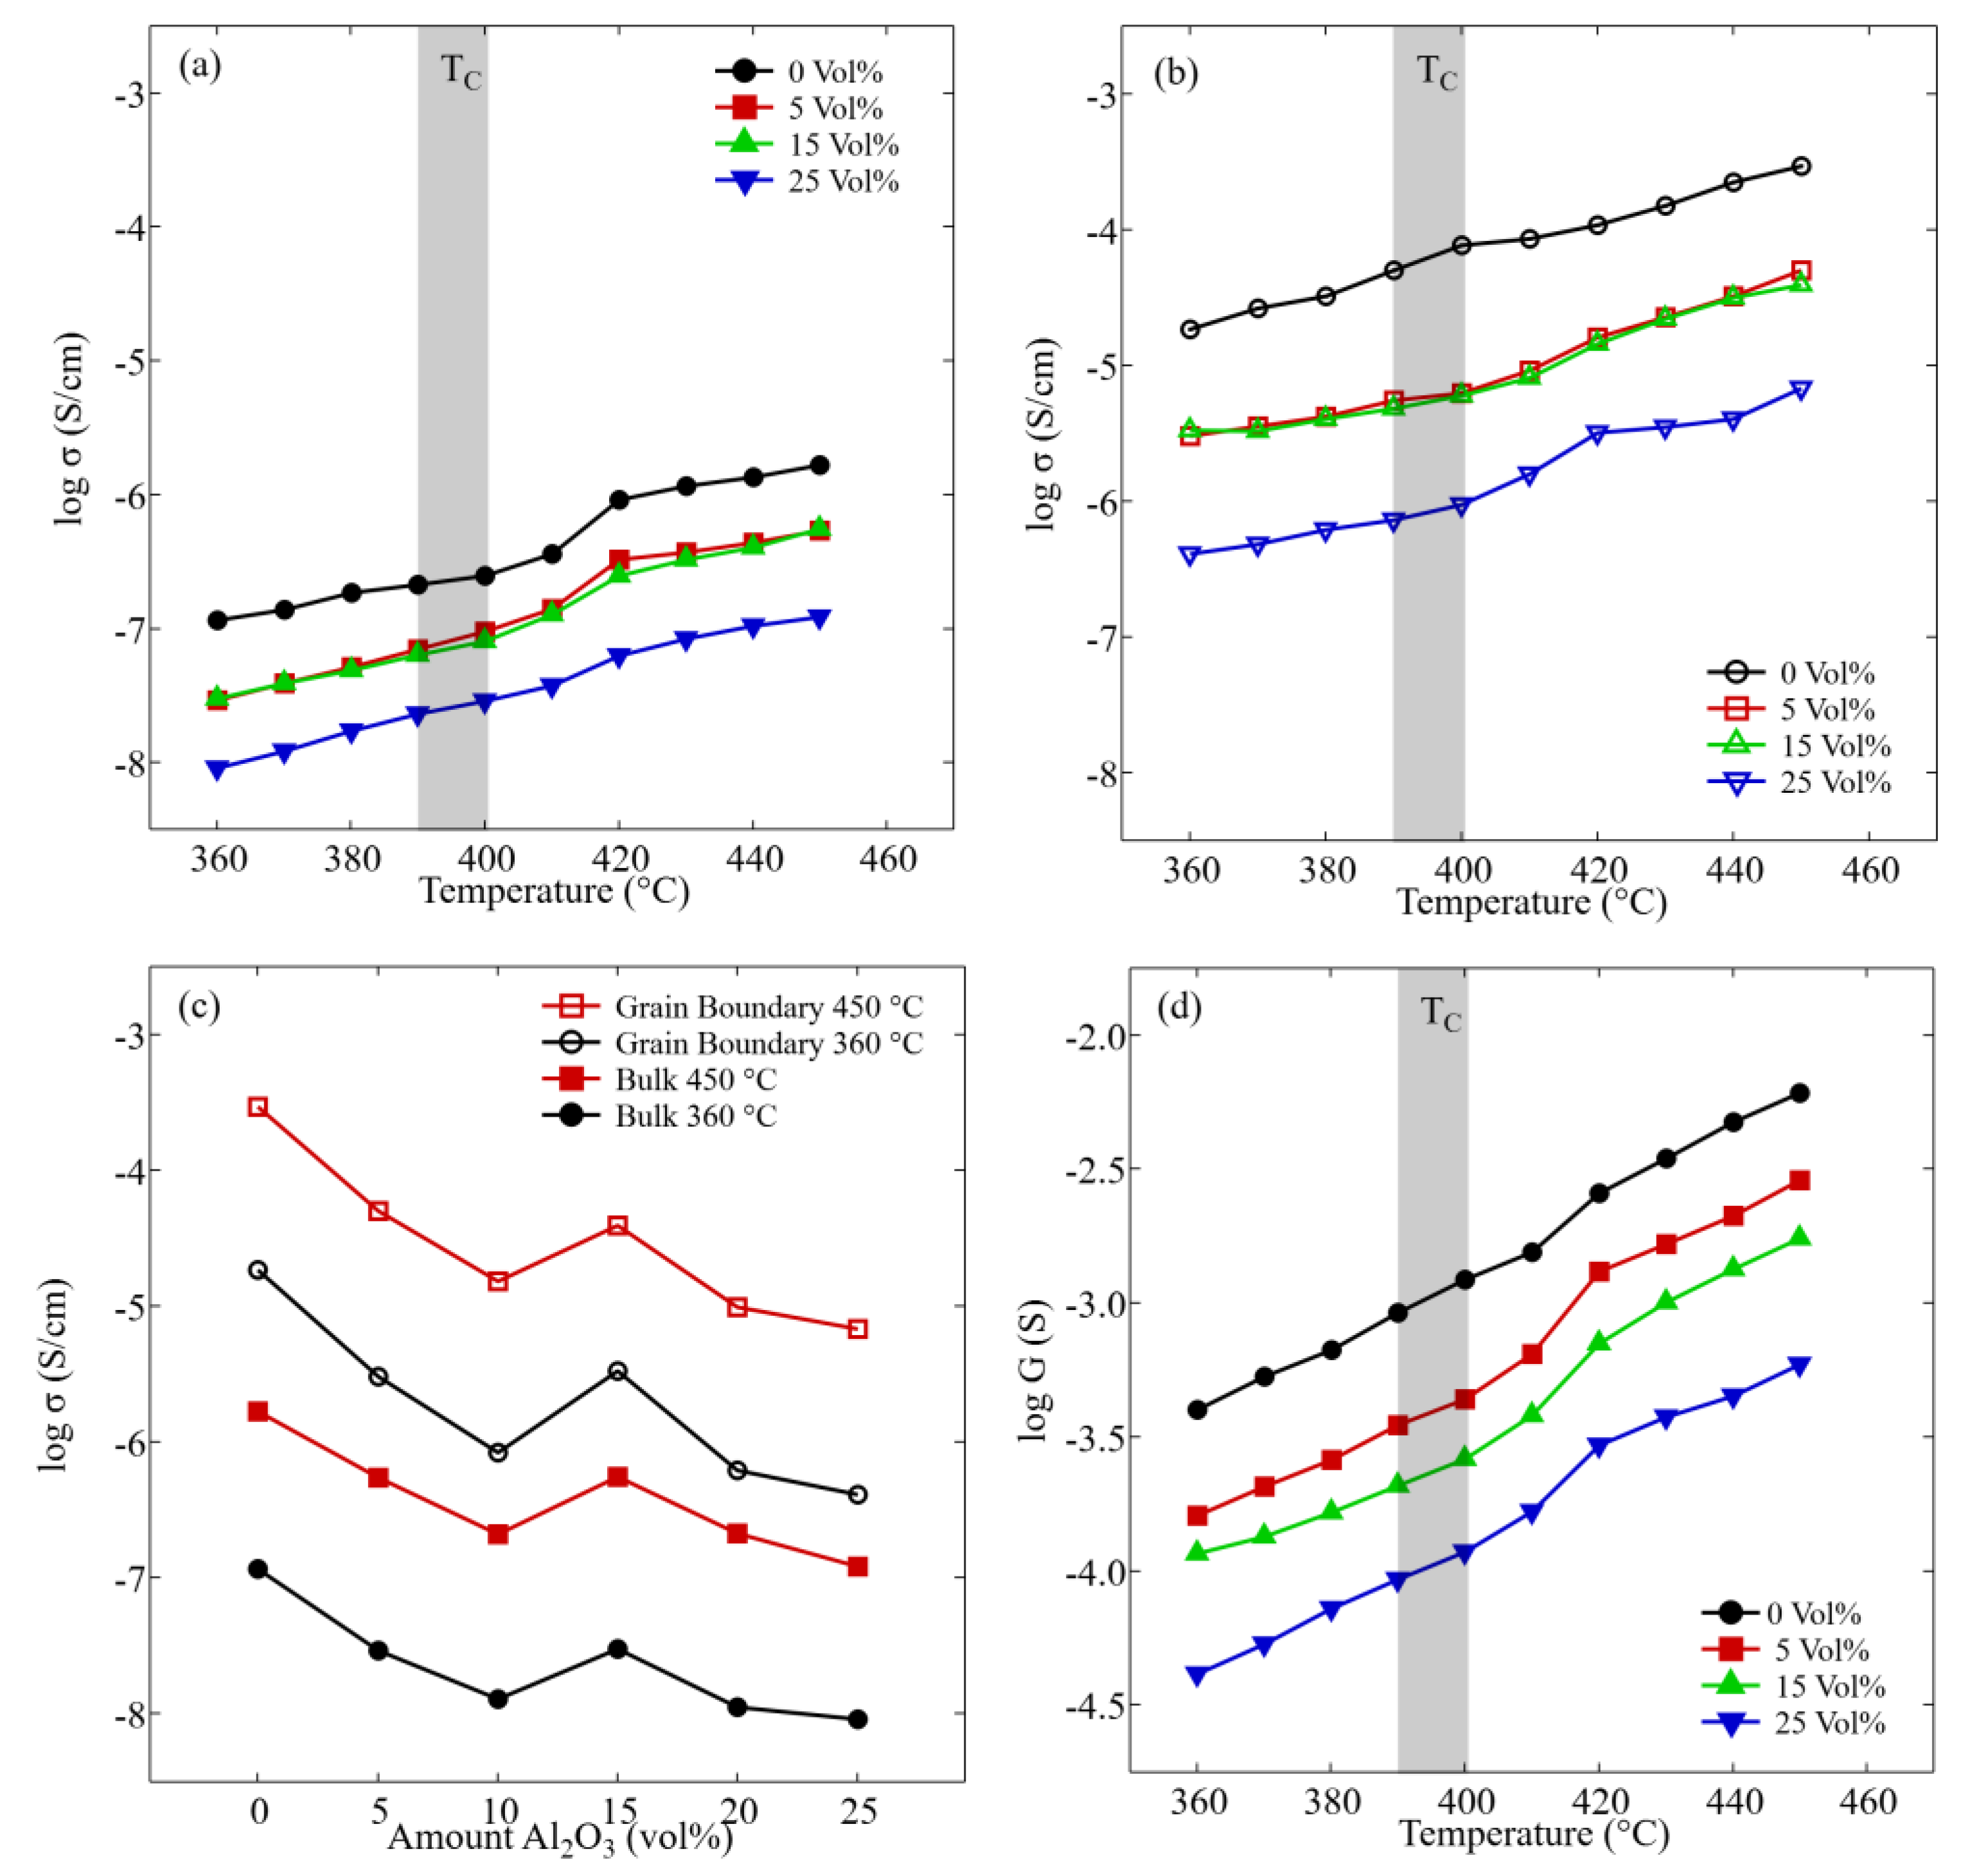
Conductivity,
σ, was determined from the extracted resistance and is plotted in
Figure 4. Here,
σ increased by orders of magnitude with increasing temperature for the bulk as well as grain boundary values, further confirming that the conduction behavior is a process caused by thermally activated charge carriers [
50]. A pronounced increase in conductivity was observed at approximately 410 °C, which is above the Curie point. Similar changes in conductivity in the ferroelectric-to-paraelectric phase transition have been observed in other materials [
51,
52]. It is also apparent that the conductivity of the grain boundary is higher than that of the bulk, corresponding well to previous investigations on similar NKN-based materials [
21]. When adding Al
2O
3 to the material, the conductivities of the bulk and the grain boundary decreased, although this decrease was more pronounced in the grain boundary than in the bulk. For instance, at 360 °C, the decrease is approximately two orders of magnitude for the grain boundary, whereas it is only one order of magnitude for the bulk. The conductivity of NKN with 5 vol% and 15 vol% Al
2O
3 was similar, which is more apparent when comparing all compositions to each other (
Figure 4d). A sudden increase in
σ from 10 to 15 vol% can be observed. It should be noted that the conductivity can be affected by changes in the microstructure, such as porosity and grain size. To minimize such effects, all samples were prepared with a relative density above 95%. Nonetheless, slight variations cannot be avoided, and they could be responsible for the observed differences. In regard to the grain size, since the average grain size showed a decreasing trend [
6], an additional decrease in conductivity should be the result [
42]. However, the distribution of Al
2O
3 particles could also impact the conductivity. Depending on the number of agglomerates, the volume of the interface between NKN and Al
2O
3 would change, and by extension, so would the overall conductivity. This could also have implications for the assumptions made by the brick-layer model [
25], leading to variations between samples. Considering these points, it is difficult to say whether the significant increase from 10 vol% to 15 vol% is a real effect.
Additionally, the blocking factor
was taken into account. The blocking factor informs about the proportion of the resistance of the grain boundary (
) compared to the overall resistance (
) and correlates with the fraction of charge carriers blocked at the grain boundaries. The overall conductance is shown in
Figure 4d, where, similar to the previously observed conductivities, a decreasing trend is observed. When calculating
), a continuous decreasing trend from 0.6 to 0.3 with increasing Al
2O
3 content is apparent. These results demonstrate that despite the overall decrease in conductivity, the predominant conduction path shifts more toward the grain boundary.
Since previous observations suggested that the conduction process is thermally activated, the activation energy for these processes can be calculated using the Arrhenius law. The results for the conductivity as a function of temperature as well as the calculated activation energies are shown in
Figure 5. Due to significant changes in the conductivity around the Curie point, two separate ranges have been fitted. It should be noted that the activation energy was only estimated below the Curie point, as the number of measurement points was insufficient to obtain reliable results from the fitting. The standard deviation from the linear fitting equations was used to calculate the error. At 0 vol%, the activation energies for the bulk and grain boundary are 0.87 ± 0.06 eV and 1.26 ± 0.09 eV, respectively. Similar values have been calculated for similar materials and have been linked to the motion of ionized oxygen vacancies [
20,
41,
53]. It should be noted that in oxide ceramics, background impurities are present, leading to intrinsic defects that contribute to the overall concentration of oxygen vacancies [
41,
54]. In particular, in NKN, the additional volatilization of Na and K can shift the charge balance [
53]. In addition, Rafiq et al. have shown that the inclusion of Mn
2+ ions leads to the substitution of the B-side of the perovskite, which is occupied by Nb
5+. Subsequently, the formation of additional oxygen vacancies is favored, leading to a reduction in the activation energy [
53]. This reduction was also observed in the grain boundary of the composite material with increasing amounts of Al
2O
3. In view of ionic substitution, Al
3+ (0.535 A°, CN = 6) most likely replaced Nb
5+ (0.64 A°, CN = 6) at the B site, resulting in the formation of oxygen vacancies. This is evidenced by the above-discussed behavior of the temperature-dependent permittivity, as well as the formation of a bias field, as shown in a previous study [
6]. Similar results were also found in other studies on NKN with Al
2O
3 [
9,
29]. The activation energy for the bulk response increased from 0.87 ± 0.06 eV to approximately 1.12 ± 0.03 eV, with the most significant change occurring at 5 vol%. As previous studies suggested, the predominant conductive process in NKN is through oxygen vacancy migration at temperatures above 400 °C, with an activation energy between 0.98 and 1.41 [
20,
55,
56]. The findings of the current study correspond well with these values. This suggests that as little as 5 vol% is sufficient to reduce the mobility of oxygen vacancies in the bulk, as was observed in Ba
0.85Ca
0.15)(Zr
0.1Ti
0.9)O
3/Al
2O
3 composites [
57]. However, whereas in Pb-based perovskite ferroelectrics, a maximum activation energy of 1.2 eV is observed, values for NKN-based can reach up to 1.7 eV [
56]. This would suggest that there is an additional mechanism at elevated vol%. It is possible that at higher amounts of Al
2O
3, Al
3+ diffusion reaches the bulk, thus increasing the number of oxygen vacancies and decreasing the thermal ionization energy. This process would counteract the hindrance of oxygen vacancy migration, resulting in a seemingly unchanging activation energy with additional vol%. On the other hand, the activation energy of the grain boundary decreased from 1.26 ± 0.09 eV to 0.99 ± 0.09 eV, indicating that the diffusion of Al
3+ into the bulk is limited and predominantly takes place in close vicinity to the grain boundary. This is consistent with the previously mentioned blocking force. As such, Al
3+ is incorporated at grain boundaries during the sintering of the composites, leading to increased oxygen vacancies. It should be noted that changes in the activation energy can also change if a shift from single-ionized oxygen vacancies (0.3–0.5 eV) to double-ionized oxygen vacancies (0.6–1.2 eV) occurs [
58]. Since the measured values are still in the range of double-ionized oxygen vacancies, it seems unlikely that this happened here. When observing the overall conductivity, additional information can be deduced. For one, 15 vol% has a lower overall conductivity than 5 vol%, despite analogous values for the grain and grain boundary. This suggests a variation in the microstructure. Additionally, the overall activation energy remains at approximately 1.08 ± 0.05 eV, since the grain and grain boundary show a counteracting trend with increasing amounts of Al
2O
3. The estimated error is relatively large when compared to the actual values but is still below the actual trend. A further source of variation between the different samples is as previously mentioned, i.e., the microstructure.
Although an increase in the number of oxygen vacancies would increase the conductivity, decreased effective conductivity is observed. For one, as mentioned above, the introduction of Al2O3 is similar to increasing the porosity of the sample, which decreases the overall conductivity. However, as previously observed in other materials, an interface can be formed between NKN and Al2O3, leading to the formation of oxygen vacancies and an increase in conductivity. Since the effective conductivity decreases, Al2O3 seems to have a predominantly decreasing effect.


