Article

Up-Conversion Photoluminescence in Thulia and Ytterbia Co-Doped Yttria-Stabilized Zirconia Single Crystals

1
School of Physical Science and Technology, Guangxi University, 100 East Daxue Road, Nanning 530004, China
2
School of Mechanical Engineering, Guangxi University, 100 East Daxue Road, Nanning 530004, China
*
Authors to whom correspondence should be addressed.
Crystals 2023, 13(3), 460; https://doi.org/10.3390/cryst13030460
Submission received: 24 February 2023 / Revised: 3 March 2023 / Accepted: 4 March 2023 / Published: 7 March 2023
(This article belongs to the Special Issue Rare Earths-Doped Materials (Volume II))

Abstract

:
ZrO2 is an attractive host matrix for luminescence material because of its excellent physical properties, such as low phonon energy and wide band gap. In this work, the highly transparent Tm2O3 and Yb2O3 co-doped yttria stabilized zirconia (YSZ) (abbreviated as Yb/Tm: YSZ) single crystals were grown by the optical floating zone method. The Yb/Tm: YSZ samples were stabilized in the cubic phase at room temperature when Yb3+ and Tm3+ replaced Y3+. The influence of Yb3+ co-doping on the up-conversion luminescence properties of the crystals was systematically studied. A total of 0.5 mol% Tm2O3 and 2.0 mol% Yb2O3 co-activated YSZ single crystal (abbreviated as 2.0Yb/Tm: YSZ) has the maximum luminous intensity. There were seven absorption peaks located at around 358, 460, 679, 783.3, 850–1000, 1200, and 1721.5 nm that were observed in the absorption spectrum of the 2.0Yb/Tm: YSZ single crystal. There were three up-conversion peaks at around 488, 658 and 800 nm that were observed when the Yb/Tm: YSZ samples were excitated at 980 nm. The fluorescence lifetime of Tm3+ for the 1G43H6 transition of the 2.0Yb/Tm: YSZ sample is 7.716 ms as excited with a 980 nm laser. In addition, the oscillator strength parameters Ωλ (λ = 2, 4 and 6) of this sample were derived by the Judd–Ofelt theory to evaluate the laser performance of the host materials. The ratio Ω46 of this sample is 0.80, implying its excellent laser output. Therefore, the 2.0Yb/Tm: YSZ single crystal is a considerable potential material for laser and luminescence applications.

1. Introduction

Rare earth ions activated up-conversion luminescence material can convert near-infrared light into visible light by absorbing two or more low-energy photons and emitting one high-energy photon. This phenomenon violates the Stokes law, called the anti-Stokes luminescence or the up-conversion luminescence [1]. As they can emit short wavelength (high energy) light under the excitation of long wavelength (low energy) light source, the up-conversion luminescent materials have attracted great attention in the field of the infrared anti-counterfeiting, the anti-stokes cold light refrigeration, the up-conversion laser, the up-conversion 3D display, the sensing, and the medical applications [2,3,4,5,6,7].
As the emitted photon energy is greater than that of the excited ones, the energy levels between the activator and the sensitizer have to be very close to realize the continuous absorption of photons and energy transfer in the up-conversion luminescence process. Among the trivalent rare earth ions, Tm3+ is an important up-conversion luminescence activator. It has a ladder-like schema of energy level, and its 1D23F4 and 1G43H6 transition wavelengths are around 450 and 480 nm, respectively. The blue up-conversion luminescence process of Tm3+ can be excited under the pumping at 650, 800, and 980 nm. Tm3+ has been extensively studied due to its suitability for commercial InGaAs (940–990 nm) laser diode pumping. Yb3+ has the electronic configuration of 4f13, and its energy state structure only contains one excited state(2F5/2), which is slightly higher than the metastable excited state of Tm3+ (3H5). Besides, Yb3+ has a strong absorption cross-section at 980 nm. The effective energy transfer can occur between Yb3+ and Tm3+, achieving efficient up-conversion luminescence. The co-doping of Yb3+ and Tm3+ can substantially improve the up-conversion luminescence efficiency [8,9,10,11,12], which was widely adopted in investigating and utilizing light radiation.
The efficiency of up-conversion luminescence material depends not only on the characteristics of rare earth ions, but also on the host material [13,14,15,16]. Seeking appropriate host materials to achieve high efficiency, high sensitivity, and a stable up-conversion luminescence laser remains a challenge. Among various inorganic host materials, fluorides were widely studied because of their lower phonon energy and higher up-conversion emission efficiency. However, their chemical and thermal instability limits the potential applications in different environments. Besides, the sensitivities of present optical thermal sensors decline rapidly with increasing temperature. Oxide materials have attracted extensive attention because of their stable physical and chemical properties, such as good thermal stability, oxidation resistance, high mechanical strength, and being green and pollution-free.
Among many oxides, zirconia (ZrO2) is proven to be an excellent matrix material for the trivalent lanthanide ions doping due to its low phonon energy (470 cm−1) [8], wide band gap (5.0 eV) [9], high density, low thermal expansion, and large chemical stability. However, the ZrO2 has three phases, including monoclinic (lower than 1170 °C), tetragonal (1170 °C–2370 °C), and cubic (larger than 2370 °C) [9]. The phase transformation of ZrO2 often comes with a volume change, leading to cracking. It is necessary to keep ZrO2 stable in the cubic phase. One of the important ways is adding the stabilizers to ZrO2 to form a stable solid solution. The more common way is adding 8 mol% Y2O3 to ZrO2 to form the yttria zirconia solid (YSZ) solution, which has a cubic structure from room temperature to the melting point.
It is difficult to prepare high quality YSZ single crystal by conventional methods due to its high melting point (2700 °C). The optical floating zone technology can concentrate the light at the same point to increase the heating temperature to 3000 °C. Also, it can be used to grow metal oxide single crystals with a high melting point as no crucible is needed in the growth process. Our research group has successfully grown Y3Al5O12 [17,18,19,20] and ruby [20,21] single crystals by this method. Therefore, in this work, the YSZ single crystals co-activated by various concentrations of Yb3+ and Tm3+ were grown by the optical floating zone technology. The structure and up-luminescence properties of the samples were characterized. Moreover, we utilized the Judd–Ofelt theory to analyze the spectral parameters of Tm3+ and Yb3+ in the samples.

2. Materials and Methods
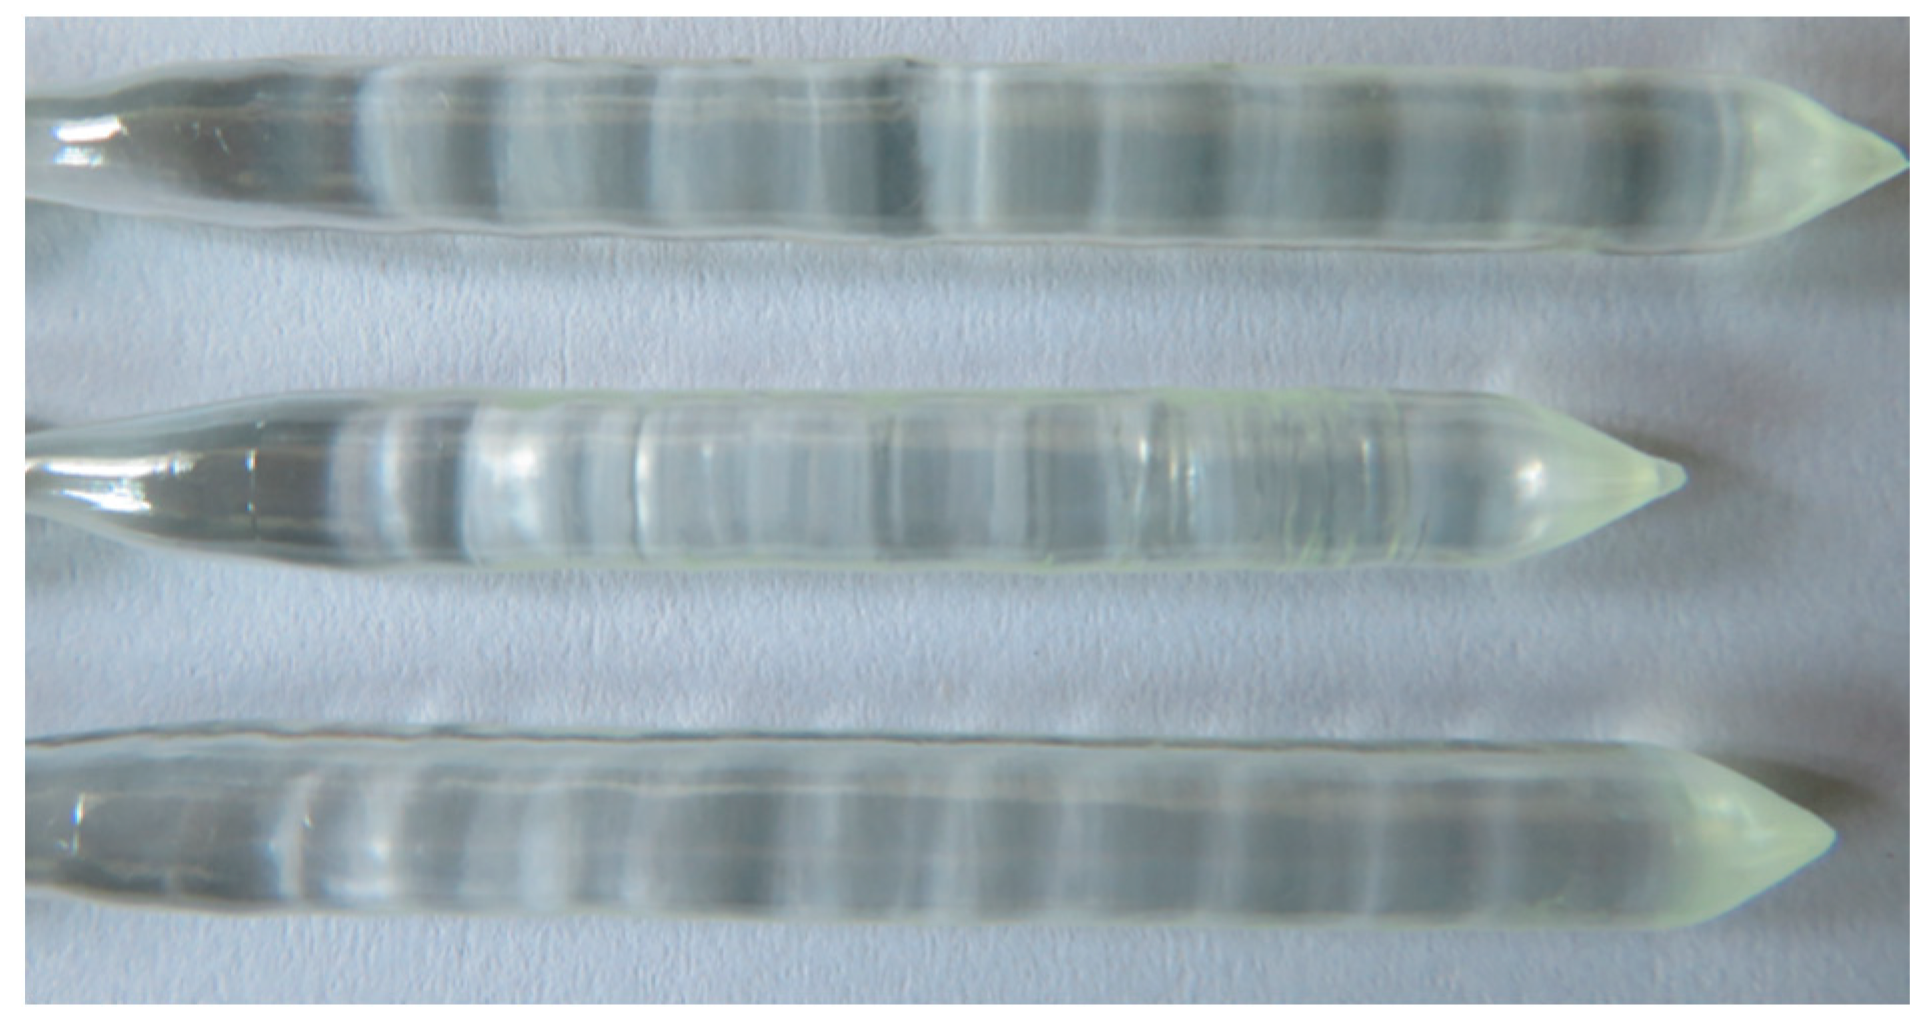
2.1. Crystal Growth

A series of polycrystalline ceramic rods were prepared through a solid-state reaction process before the single crystal growth. The oxides ZrO2 (99.99%), Y2O3 (99.99%), Tm2O3 (99.99%), and Yb2O3 (99.99%) powders (Aladdin, Shanghai, China) were employed as raw materials. The appropriate amounts of powders were weighed at specified mole ratios (as seen in Table 1) and mixed homogeneously by a magnetic stirrer for 24 h. Then, each mixture was oven-dried at 85 °C for 24 h and grounded in an agate mortar for 0.5 h. The prepared powder was packed in a long rubber balloon, vacuumed, sealed, and isostatically pressed under a pressure of 68 MPa to obtain the feed and seed rods. The obtained rods were sintered at 1550 °C for 10 h in the air to be compact and uniform polycrystalline ceramic rods.
Single crystals of Tm2O3 and Yb2O3 co-doped YSZ were grown using an optical floating zone furnace (FZ-T-12000-X-VII-VPO-GU-PC, Crystal Systems Co., Yamanashi, Japan). During growth, a counter-rotated seed of 10 rpm of the seed and feed rods, a flow rate of 4 L/min of air was maintained, and the crystal growth rate was about 5 mm/h.
The as-grown Yb/Tm: YSZ single crystals were colorless and about 5 × 80 mm in size, as shown in Figure 1. The crystals had a smooth surface and were free from cracks. The chips of about 1.0 mm in thickness were cut from the Yb/Tm: YSZ crystal rods and then double-sided polished.

2.2. Characterization

The X-ray diffraction (XRD) patterns were collected by a diffractometer (DX-2700, Haoyuan, Dangdong, China) using Cu-Kα (λ = 1.5406 Å) radiation in the 2θ range of 20°–80° with a step of 0.02°. The existing phases of as-prepared crystal chips were investigated also by Raman scattering. The Raman spectra in the wavenumber range of 150–950 cm−1 were obtained by a confocal Raman spectrometer (inVia Reflex, Renishaw, London, UK) with the laser excitation at 532 nm.
The absorption spectra of crystal chips were collected on a UV-Visible-NIR spectro photometer (UV-3600, Shimadzu, Kyoto, Japan) with a resolution of 1 nm. The steady emission spectra were measured by a photoluminescence (PL) spectrometer (ZLF325, Zolix Instruments Co., Ltd, Beijing, China) with a 980 nm laser diode as an excitation source. Fluorescence decay curves were recorded with a fluorescence spectrometer (FLS920, Edinburgh Instruments, Edinburgh, UK) excited with a 980 nm laser as the excitation light.

3. Results and Discussion

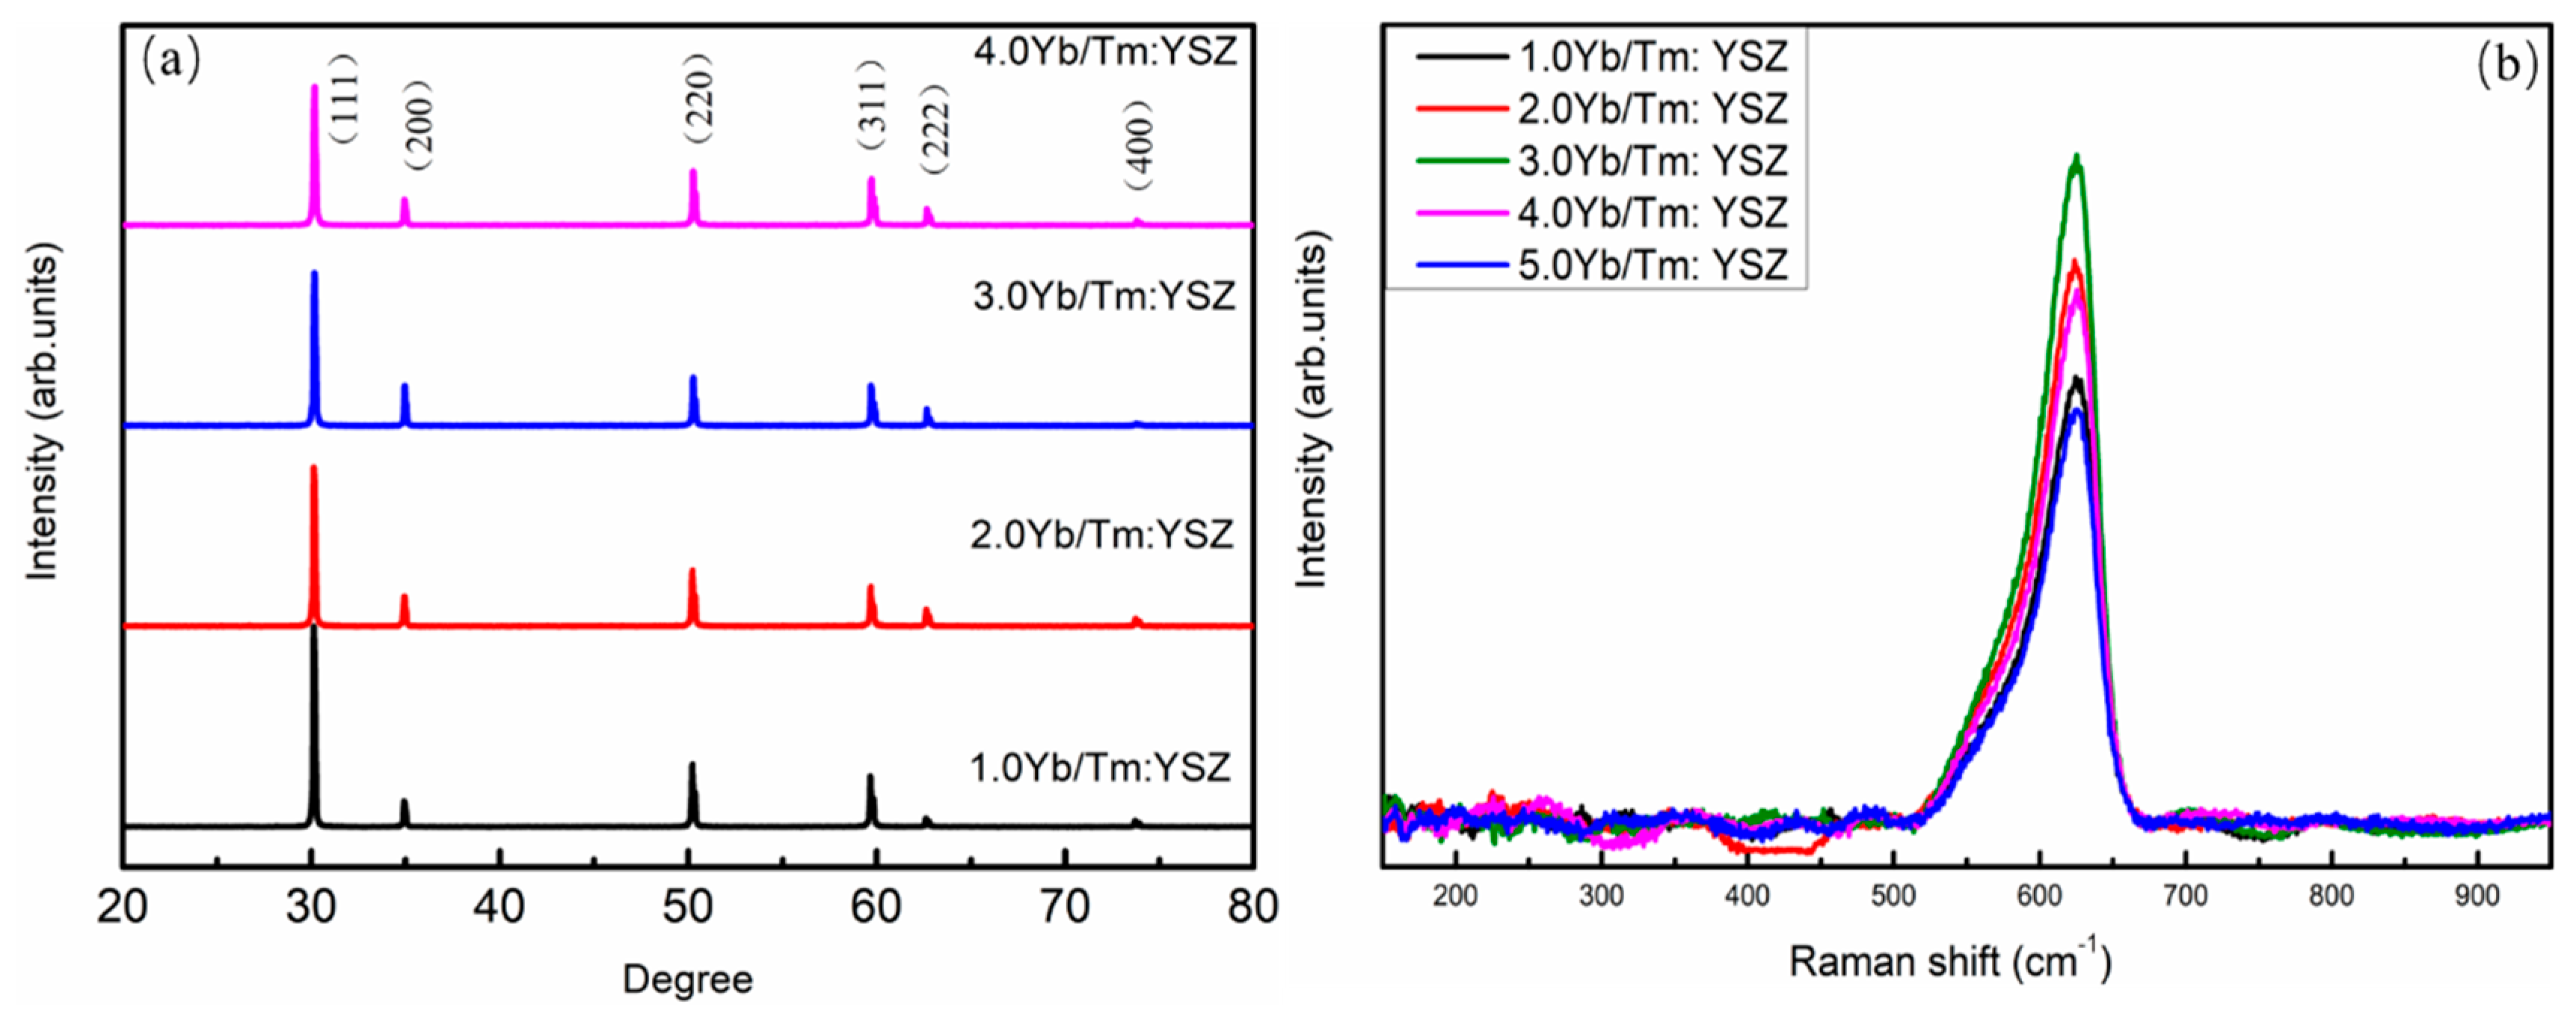
3.1. Structure Analysis

The as-grown Yb/Tm: YSZ single crystals were crushed and ground into a powder to obtain detailed structure information. The XRD patterns of Yb/Tm: YSZ powders are shown in Figure 2a. For all the samples, six peaks were detected. It is impossible to identify the cubic and the tetragonal ZrO2 as they share very similar X-ray reflection [12,22]. Raman spectroscopy is widely used to distinguish the three possible structures of ZrO2 [23,24,25]. The Raman spectra of Yb/Tm: YSZ crystal chips are shown in Figure 2b. The Raman spectra of all samples are characterized by one strong peak in the wave-number range of 150–950 cm−1. The Raman peak centered at around 625 cm−1, corresponding to the F2g mode of the cubic phase [26], is a little bigger than that of 0.5 Tm2O3:YSZ single crystal [12], and it may attributed to the presence of co-doped Yb2O3. The diffraction patterns of all the samples match well with the standard card of cubic ZrO2 (JCPDS No.97-008-9429), belonging to the Fm-3m (225) space group. No extra peaks of a secondary phase were observed, indicating that Tm3+ and Yb3+ successfully entered the YSZ lattice. In addition, the cell parameters decrease slightly with the increase of Yb2O3 content, as seen in Table 2. This is due to the Yb3+ preferentially substituting for Y3+, and the radius of Yb3+ (0.985 Å) is smaller than Y3+ (1.019 Å).

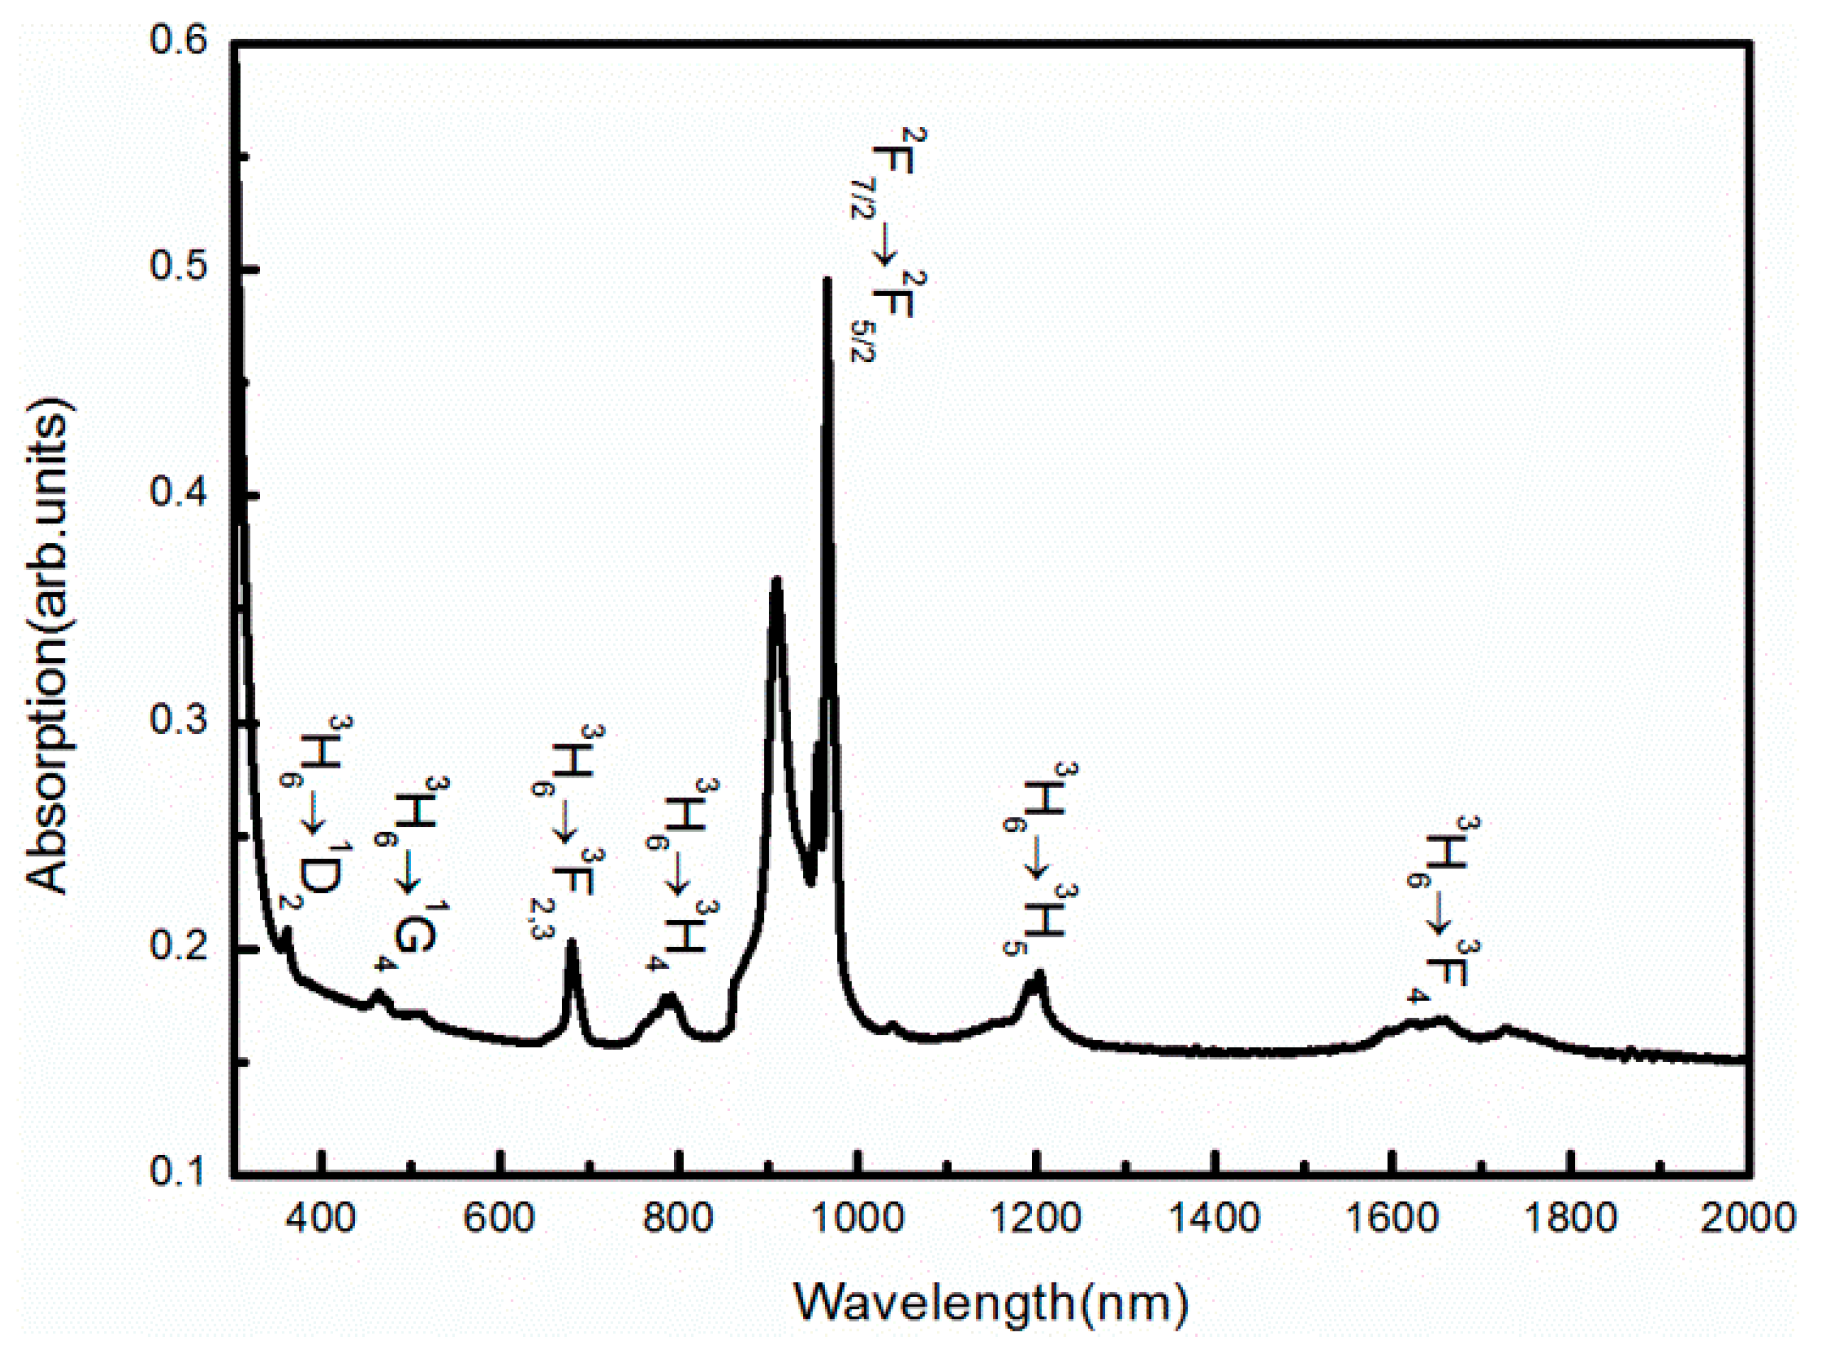
3.2. Absorption Spectra and Judd-Ofelt Analysis

The optical absorption spectra of x Yb/Tm: YSZ single crystals between 300 and 2000 nm were tested, as shown in Figure 3. There is no characteristic absorption related to d-d transition in the range of 300–2000 nm because the d orbit of Zr4+ is empty. Therefore, the absorption peaks of all the samples are from the transitions between Tm3+ and Yb3+. There are four visible and three IR absorption peaks, centering at 358, 460, 679, 783.5, 1200, and 1721.5 nm which correspond to the transitions of Tm3+: 3H61D2, 3H61G4, 3H63F2,3, 3H63H4, 3H63H5, and 3H63F4, respectively. The strongest absorption peak is at around 850–1000 nm, corresponding to the transition of Yb3+: 2F7/22F5/2, which indicated that Yb3+ has a large absorption of the 980 nm laser excitation and is suitable as a sensitizer in the up-conversion luminescence of Tm3+.
Optically, the Judd–Ofelt (J-O) theory, through an analysis of the oscillator strengths, the emission branching radio and the radiative lifetime [27,28,29] is used for analyzing the possible transition mechanisms of the rare earth ions that are affected by the host materials.
Based on the absorption spectrum of 2.0Yb/Tm: YSZ single crystal chip, the oscillator strengths for an induced electric dipole transition from the initial state to the final state are calculated according to the Equation (1) [28,29].
f = 8 π 2 m c σ 3 h 2 J + 1 n 2 + 2 2 9 n λ = 2 , 4 , 6 Ω λ 4 f N Ψ J / / U λ / / 4 f N Ψ J 2
where m, c, σ, h, J, and n are the electron mass, velocity of light, transition energy, Planck constant, total angular momentum, and index of refraction, respectively. Ωλ (λ = 2, 4 and 6) is oscillator intensity parameter and Uλ (λ = 2, 4 and 6) is the reduced matrix element. The values of average wavelength and the measured and calculated oscillated strengths for the 2.0Yb/Tm: YSZ single crystal are collected in Table 3.
According to the J-O theory, the absorption oscillator strengths of Tm3+ ion are calculated, as shown in Table 3. The Judd–Ofelt parameters of Tm3+ in different host materials are listed in Table 4. The root mean square (RMS) is 0.077 × 10⁻²⁰ cm2, indicating the high reliability of the obtained oscillator strengths. The intensity parameters Ωλ (λ = 2, 4, 6) of Tm3+ are 0.41 × 10⁻²⁰ cm2, 0.12 × 10⁻²⁰ cm2, and 0.15 × 10⁻²⁰ cm2. It is well known that the Ω2 parameter is sensitive to crystal structure and related to the covalency of the RE3+ sites. While Ω4 and Ω6 depend on the viscosity and rigidity of the host material. The value of Ω2 is larger than that of Ω4, revealing the relatively low symmetry of the Tm3+ site and the covalence that exists between the Tm3+ ions and anions as well as the asymmetry around the metal ion site [30]. According to the previous analysis, oxygen vacancies can be formed when the Y3+, Tm3+ and Yb3+ ions occupy the sites of the small Zr4+. Based on the theoretical calculation, the oxygen vacancies are located at the nearest neighbor of Zr4+, leading to the seven-fold coordination and the symmetry reduction of the Zr4+ sites. It could be concluded that the Tm3+ occupy the Zr4+ site with seven coordination after entering YSZ lattice. Meanwhile, Ω46 is one of the important parameters for the spectral characterization of the host materials. The value of Ω46 for 2.0Yb/Tm: YSZ single crystal is 0.8, which is larger than 0.68, 0.389, and 0.15 in LLF [31], YVO4 [32], and SrWO4 [33], revealing that the sample is a potential material for laser output.
Using the Ωλ values, the radiative properties such as spontaneous transition probability Aed, branching ratios β, and radiative lifetime τrad for the transitions of Tm3+ in 2.0Yb/Tm: YSZ single crystal are calculated and listed in Table 5.

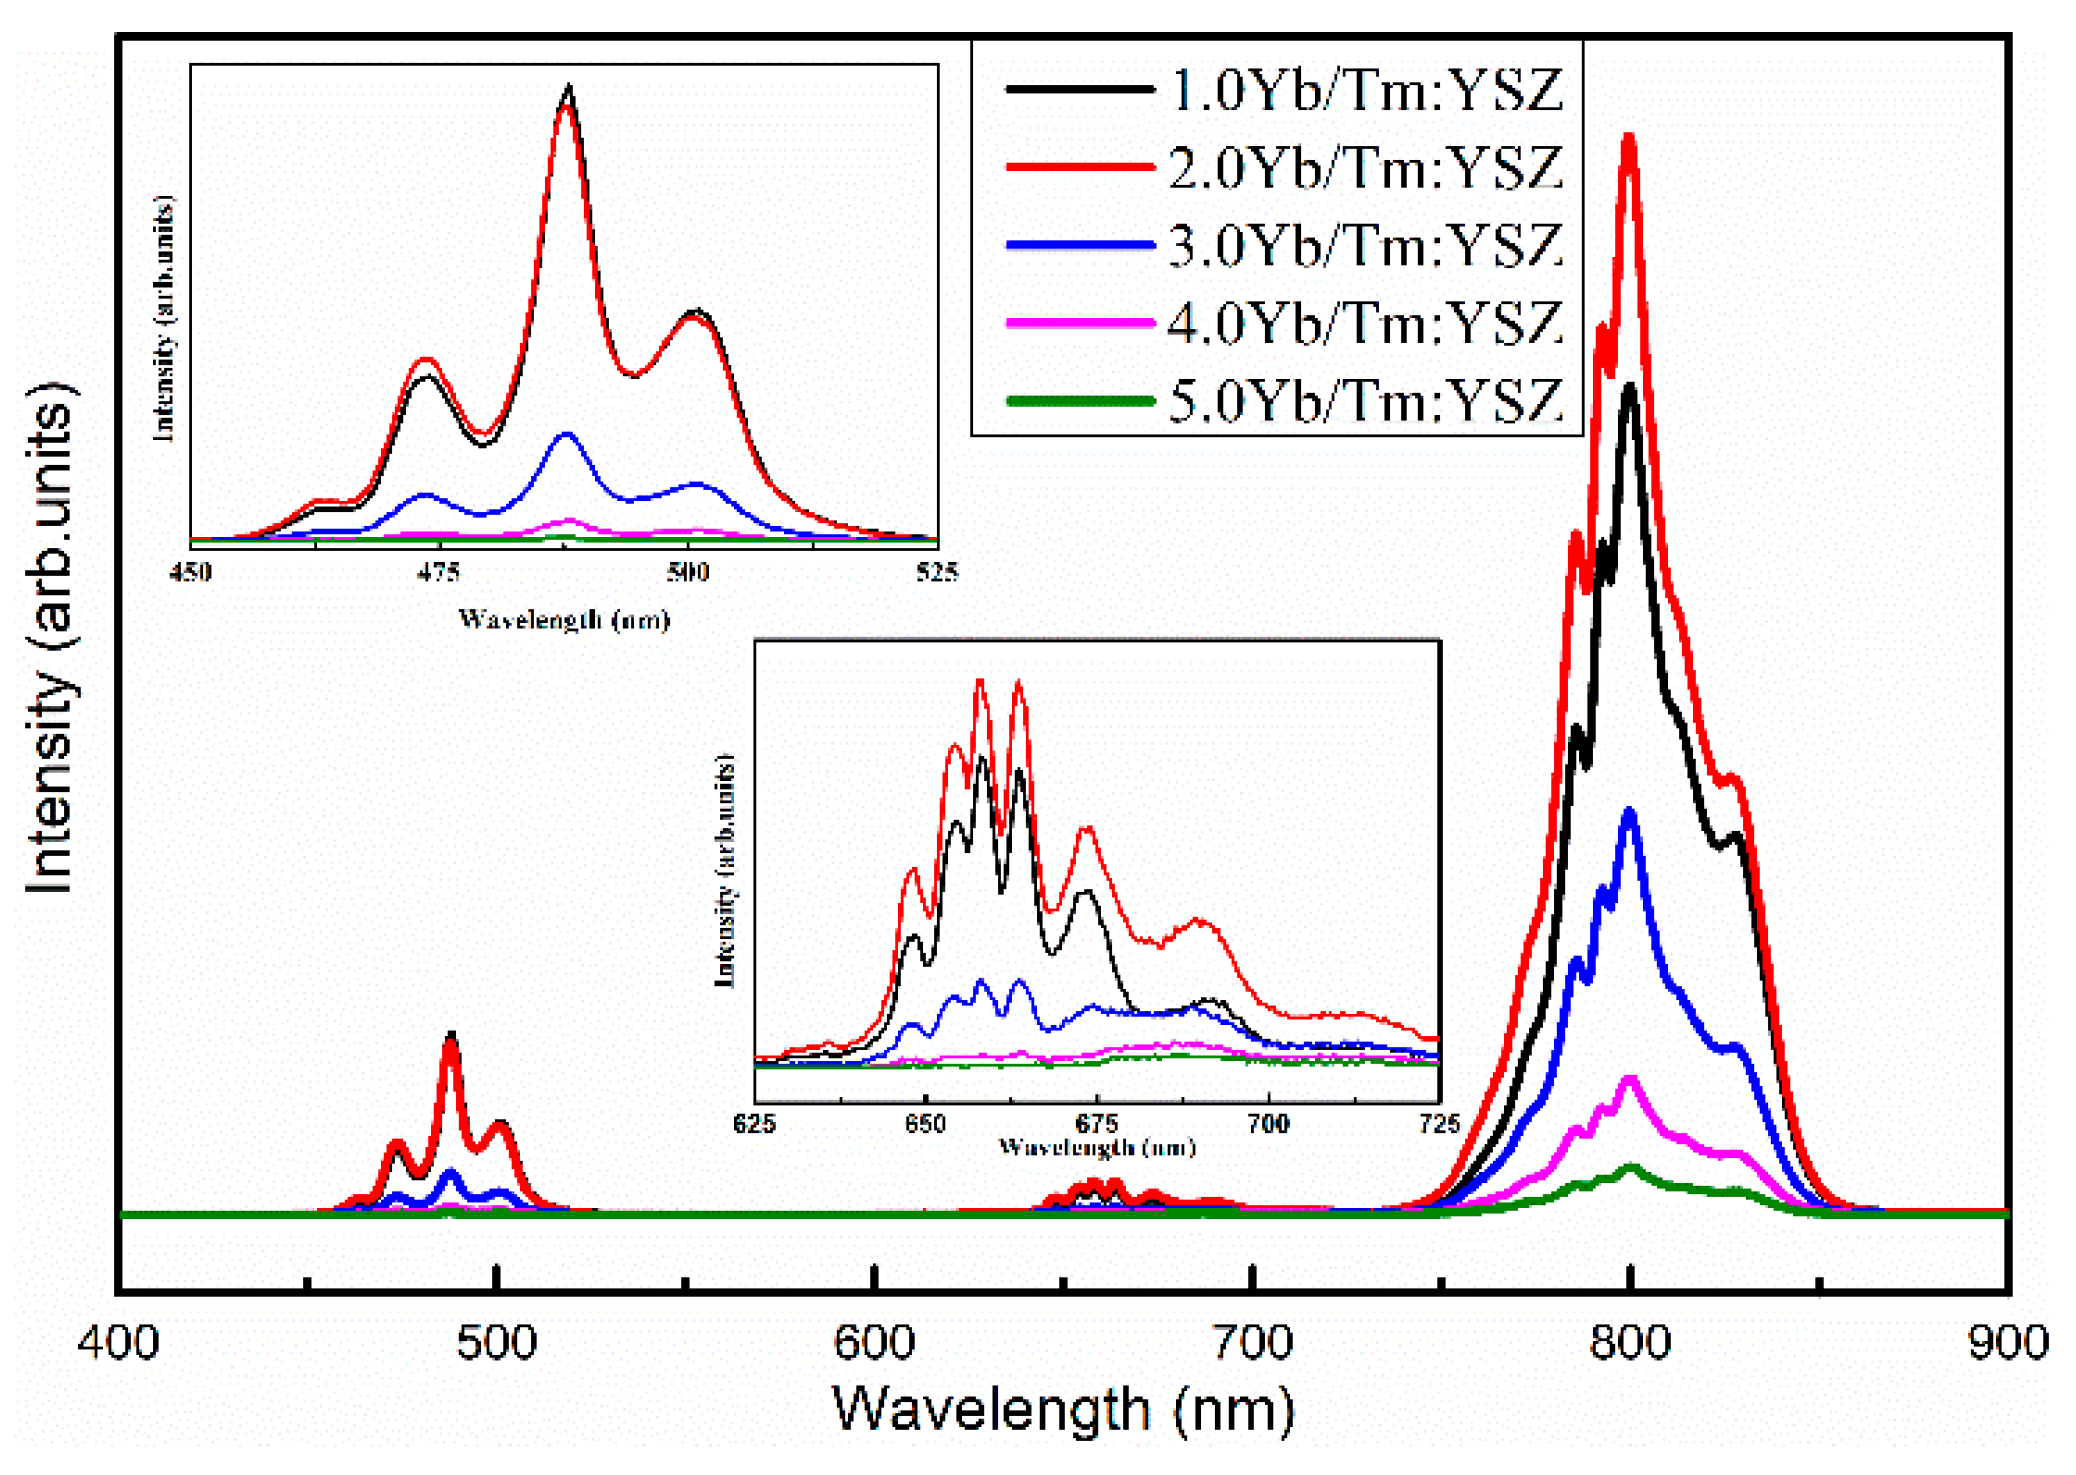
3.3. Luminescence Properties

Figure 4 shows the emission spectra of the YSZ: 0.5 mol%Tm2O3, x mol%Yb2O3 (x = 1.0, 2.0, 3.0, 4.0, 5.0) in the wavelength range of 400–900 nm under the 980 nm laser excitation at room temperature. Clearly, under the excitation of 980 nm, the bright blue luminescence was observed by the naked eye, as shown in Figure 5. The emission spectra consisted of three main emission bands at around 488 (blue), 658 (red), and 799 nm (NIR), corresponding to the of 1G43H6, 1G43F4, and 3H43H6 transitions of Tm3+, respectively. Among these, the NIR emission corresponding to 3H43H6 at 799 nm is the dominant one, and is consistent with the literature. As the Yb2O3 concentration increases, the position and shape of the emission peaks is similar, indicating the same surrounding of Tm3+. In other words, the structure of YSZ crystals does not change significantly after Yb2O3 co-doping. The structure of the crystal affected the luminescence properties directly. The blue up-conversion luminescence of Tm3+ in cubic ZrO2 is composed of three peaks, while it is a single peak in monoclinic ZrO2. The blue emission band in Figure 4 is mainly composed of three peaks, indicating that the crystal structure is cubic, and it is consistent with the XRD and Raman spectroscopy results.
Figure 6 shows the intensities of the emission peaks of the samples. The luminescence intensity increases with an increase in Yb2O3 concentration up to 2.0 mol%, and then decreases dramatically, due to the concentration quenching effect. According to the Blasse theory, the process of non-radiative energy transfer depends on the radiative reabsorption or the electric multipolar interaction of the activated ion. However, the radiation reabsorption process only occurs in the case of a large overlap between the excitation spectrum of the sensitizer and the emission spectrum of the activator. As can be seen in Figure 4, the emission peaks of Tm3+ are located at 488, 658, and 799 nm, while the absorption peak of the Yb3+ is located at around 980 nm, and the peak overlap is very small. Therefore, the concentration quenching in Yb/Tm: YSZ single crystals is induced by the electric multipolar interaction.
To examine the up-conversion mechanisms, the emission spectra of (0.5 mol%Tm2O3, 2.0 mol%Yb2O3): YSZ single crystal under 980 nm excitation at different power are plotted in Figure 7. The luminescence intensity (I) increases with the power (P), following the multiphoton formula, I ∝ Pn. Here, n is the number of photons to populate the emitting states and is obtained by the slope of the linear fits of lg I-lg P curves. The slopes are 3.13, 3.30, and 2.32 for the blue emission centered at 488 nm, red emission centered at 658 nm, and NIR emission centered at 799 nm, respectively. This indicates that the red and blue emissions involve three photons while the NIR emission needs two photos. Although a photo avalanche (PA) is a possible mechanism for up-conversion luminescence, it is excluded because no inflection was observed in the power curve. Therefore, the up-conversion luminescence of Yb/Tm: YSZ single crystal is realized by the energy transfer (ET), the ground state absorption (GSA), and the excited state absorption (ESA) processes.
Figure 8 is the energy level diagram of the Yb3+-Tm3+ co-doped system. The transition processes in this up-conversion luminescence can be explained by the following. First, the electron of Yb3+ is excited from the ground state 2F7/2 to the 2F5/2 energy level by absorbing one 980 nm photon. Then, the Yb3+ transfers the energy to the ground state of neighboring Tm3+ according to the ET process. After that, the electron in the 3H6 state of Tm3+ is excited to the 3H5 state via the GSA process. The 3F4 state is populated by the fast non-radiative relaxation. Following this, the Yb3+ absorbs the second photon and transfers the energy to the Tm3+, leading to the excitation of the electron from the 3F4 state of Tm3+ to the 3F2,3 state via the ESA channel. Subsequently, the non-radiative transition between two activator ions will populate the 3H4 state. Finally, the Yb3+ absorbs the third photon and transfers the energy to the 3H4 state, leading to the electron excitation to the 1G4 state. Then, the up-conversion luminescence is generated by the transitions from the high to the low-energy states. Therefore, the emission of blue (488 nm), red (658 nm), and NIR (799 nm) are observed according to the 1G43H6, 1G43F4, and 3H43H6 transitions, respectively.

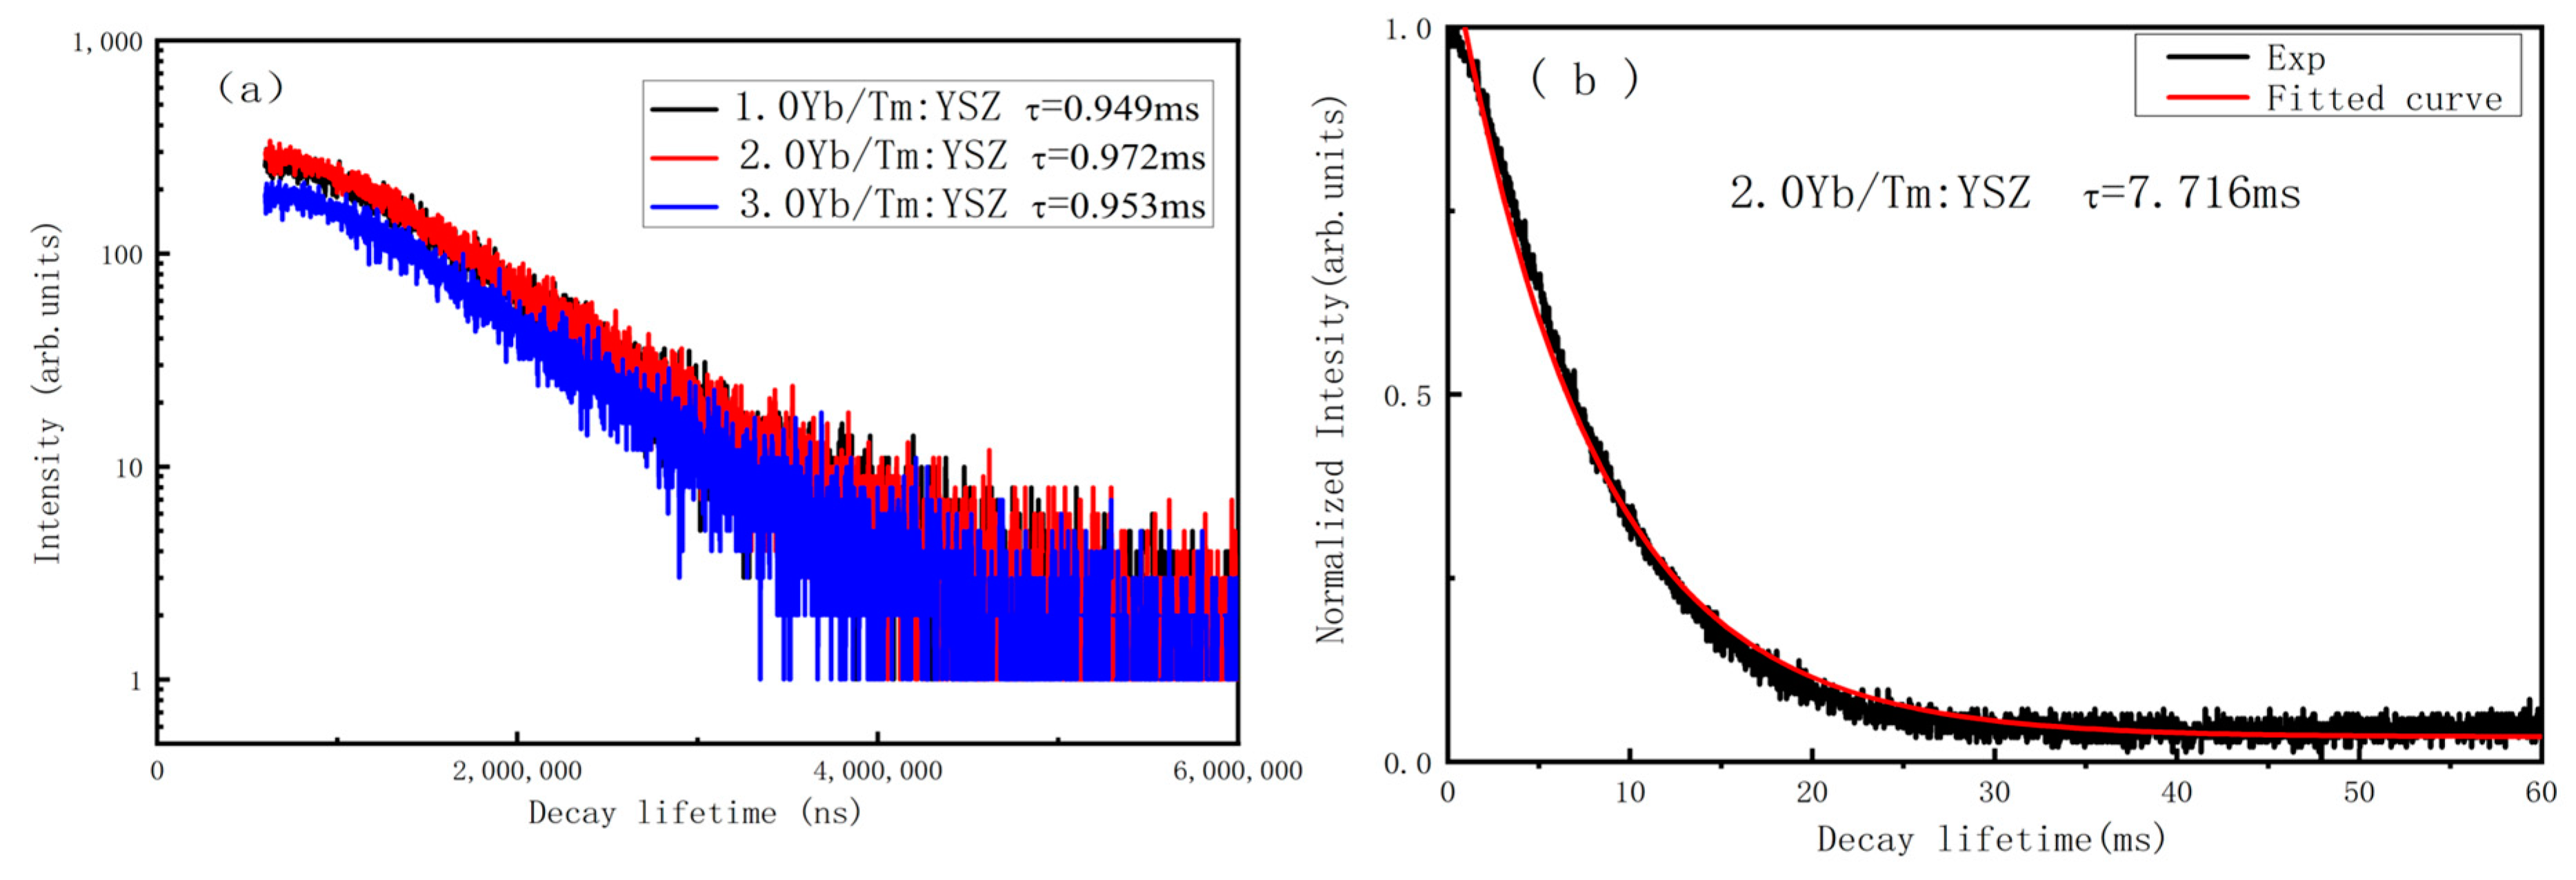
3.4. Luminescence Decay Kinetics

Figure 9a presents the fluorescence decay curve of the emission line 1G43F4 (658 nm) of Tm3+ in x Yb/Tm: YSZ crystal (x = 1.0, 2.0, 3.0 mol%), excited by 980 nm at room temperature. From a single exponential function fitting, the average fluorescence lifetime τ of the 1G43F4 transition of the x Yb/Tm: YSZ crystal (x = 1.0, 2.0, 3.0 mol%) is equal to 0.949 ms, 0.972 ms, and 0.953 ms, respectively. The 2.0Yb/Tm: YSZ single crystal has the longest lifetime. As the concentration of Tm3+ remains the same, the excited state lifetime of Tm3+ is affected by the energy transfer process between Yb3+ and Tm3+. In addition, the fluorescence decay curve for Tm3+ for the 1G43H6 (488 nm) transition in 2.0Yb/Tm: YSZ single crystal is shown in Figure 9b. The average fluorescence lifetime is 7.716 ms. The decay time is larger than that of Tm: LGYSO [37] (1.669 ms), Tm: YVO4 [38] (1.9 ms), Tm: SSO [39] (1.14 ms), revealing the suitability of the YSZ crystal as a host material for luminescence of Tm3+.

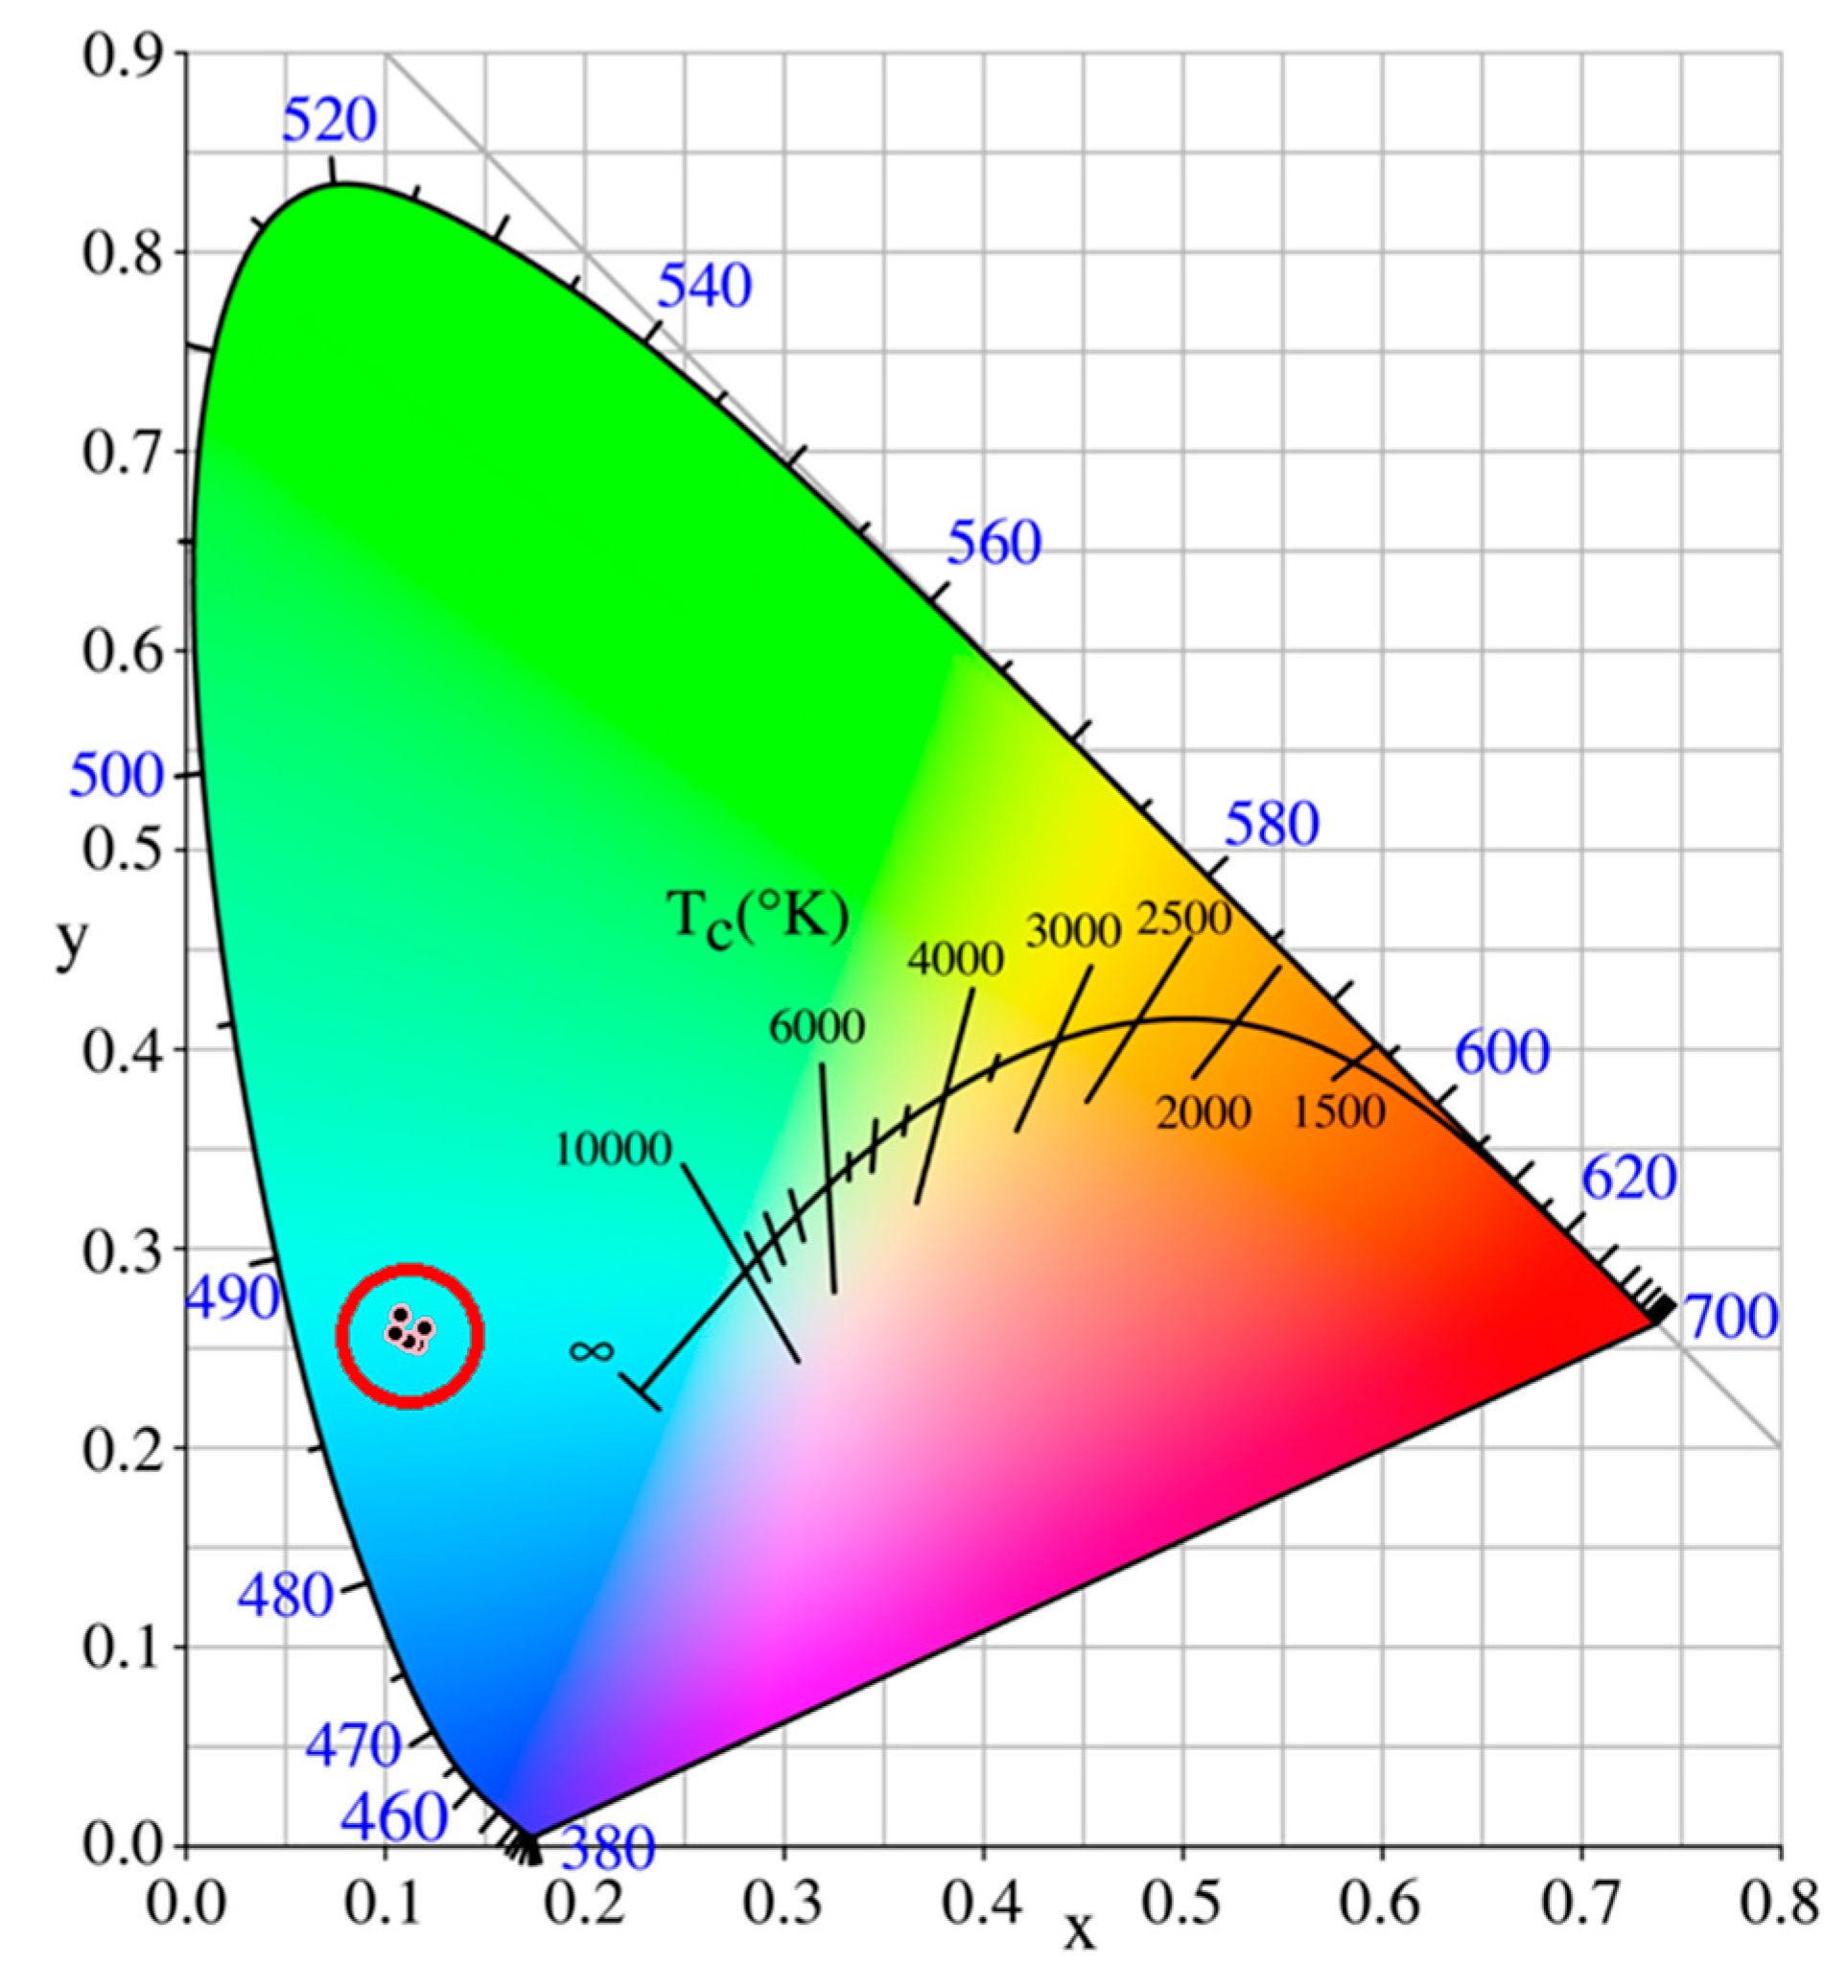
3.5. Color Chromaticity Coordinates

The color chromaticity characteristics of the Yb/Tm: YSZ single crystals were analyzed by the Commission International de l’éclairage (CIE) chromaticity coordinates diagram as shown in Figure 10 and Table 6. The color points of all the samples are in cyan region, and the purity of the blue emission is 79.5% for the 2.0Yb/Tm: YSZ single crystal.

4. Conclusions

High-quality Yb3+/Tm3+ co-doped YSZ cubic single crystals were grown by the optical floating zone method. With an increasing concentration of Yb2O3, the cell parameter decreases due to the Yb3+ preferential substitution for Y3+. There were seven absorption peaks that were observed in the range of 300–2000 nm, corresponding to the transitions from Tm3+ 3H6 ground state to the 1D2 (358 nm), 1G4 (460 nm), 3F2,3 (679 nm), 3H4 (783.3 nm), 3H5 (1200 nm), and 3F4 (1721.5 nm) excited states and that in the 850–1000 nm region of Yb3+ (2F7/22F5/2) transition. Based on the absorption spectrum, the oscillator strength parameters Ωλ (λ = 2, 4, 6) were calculated by the Judd–Ofelt theory. The Ω2 value is larger than Ω4, and it indicates that Tm3+ preferentially substituted for Zr4+ with seven coordination. There were three up-conversion emission peaks around 488, 658, and 799 nm that were observed when Yb/Tm: YSZ single crystal was excited with a 980 nm laser. The intensities of the emission peaks reached maximum when the concentration of Yb2O3 was 2.0 mol%, and then the concentration quenching effect appeared due to the electric multipole interaction. In addition, a two-photon process is involved for populating the 3H4 level of Tm3+, whereas a three-photon process is involved in the generation of blue emission. The energy transfer between Yb3+ and Tm3+ was confirmed by the changes of the lifetime of Tm3+ from the fluorescence decay, which also reached a maximum with 2.0 mol% Yb2O3. The fluorescence lifetime of Tm3+ for 1G43H6 transition was measured to be 7.716 ms for 2.0Yb/Tm: YSZ single crystal excited with a 980 nm laser. Furthermore, the color coordinates of the 2.0Yb/Tm: YSZ sample had a blue luminescence purity of 79.5%. Therefore, the 2.0Yb/Tm: YSZ single crystal is a potential candidate for the laser and luminescence applications.

Author Contributions

Conceptualization, D.H. and T.X.; methodology, B.F. and S.X.; software, Y.H.; validation, S.X., Y.H. and Z.Z.; formal analysis, W.D.; investigation, D.H.; resources, S.X. and W.D.; data curation, Y.H.; writing—original draft preparation, D.H.; writing—review and editing, Z.Z.; visualization, Y.H.; supervision, W.D.; project administration, S.X. and Y.H.; funding acquisition, S.X. and Y.H. All authors have read and agreed to the published version of the manuscript.

Funding

This work was financially supported by the Education Department of Guangxi Zhuang Autonomous Region, China under Grant No. 2021KY0017, the Chinese National Innovation Program of “Great Innovation Program” under Grant No. 202110593084, the Guangxi Natural Science Foundation under Grant No. 2022GXNSFBA035447, and the National Natural Science Foundations of China under Grant No. 12105055 and 12265005.

Data Availability Statement

The data that were presented in this study are available on reasonable request from the corresponding author.

Acknowledgments

The authors gratefully thank Dingkang Xiong for useful discussions on the subject matter of this paper.

Conflicts of Interest

The authors declare no conflict of interest.

References

  1. Yan, Z.; Xu, W.; Ying, Z.; Yan, L.; Xi, Y. Optical temperature sensing of up-conversion luminescence materials: Fundamentals and process. J. Alloys Compd. 2020, 817, 152691. [Google Scholar]
  2. Naresh, V.; Adusumalli, V.; Park, Y.; Lee, N. NIR triggered NaYF4:Yb3+,Tm3+@NaYF4/CsPb(Br1-x/Ix)3 composite for up-converted white-light emission and dual-model anti-counterfeiting applications. Mater. Today Chem. 2022, 23, 100752. [Google Scholar] [CrossRef]
  3. Zhang, W.; Ji, X.; Chen, K.; Wang, C.; Sun, S. Thermochromic performance of a new temperature sensitive pigment based on rhodamine derivative in both liquid and solid systems. Prog. Org. Coat. 2019, 137, 105280. [Google Scholar] [CrossRef]
  4. Peng, Z.; Wen, W.; Li, W.; Ya, W.; Sheng, T.; Ze, C.; Shou, X.; Bernard, G.; Wen, D. Up-conversion luminescence and Judd-Ofelt analysis of Nd2O3-doped yttria stabilized zirconia single crystals. Crystengcomm 2022, 24, 5977–5986. [Google Scholar]
  5. Yong, Z.; Peng, L.; Xiang, L.; Hao, C.; Guo, X.; Zheng, Q. Up-conversion nanoparticles/PMMA composites for light-emitting applications. Nano 2021, 15, 2050023. [Google Scholar]
  6. Xi, J.; Zhong, Z.; Tian, Z.; Ce, L.; Zhuang, L.; Wei, Y.; Xin, W.; Xue, S.; Xu, Z.; Hong, S.; et al. Enhanced up-conversion luminescence intensity of NaY(MoO4)2:Ho3+/Yb3+ phosphor by doping with Mg2+ ions for use in high-efficiency optical temperature senser. J. Lumines. 2022, 245, 118759. [Google Scholar]
  7. Qiu, H.; Qi, W.; Feng, H.; Zheng, X.; Lei, Z.; Su, Z. Multicolor coding up-conversion nanoplatform for rapid screening of multiple foodborne pathogens. ACS Appl. Mater. Interfaces 2021, 13, 26782–26789. [Google Scholar]
  8. Xiao, F.; Lai, G.; Yi, H.; Qi, Z. Uniform spheres of α-NaYF4:RE3+ (RE = Eu, Tb, Ce, Er, and Tm): Template-free synthesis, multi-color photoluminescence, and their application in cellular imaging. Crystals 2020, 10, 119. [Google Scholar]
  9. Xiang, L.; Yun, W.; Pan, Z.; Wan, G. Highly sensitivity, selectivity chemosensor for methyl orange using upconversion NaBiF4: Yb/Tm nanosheets. J. Solid State Chem. 2021, 301, 122307. [Google Scholar]
  10. Joshi, R.; Perala, R.; Shelar, S.; Ballal, A.; Singh, B.; Ning, R. Super Bright Red Upconversion in NaErF4: 0.5%Tm @NaYF4: 20%Yb Nanoparticles for Anti-counterfeit and Bioimaging Applications. ACS Appl. Mater. Interfaces 2021, 13, 3481–3490. [Google Scholar] [CrossRef] [PubMed]
  11. Dai, W.; Wen, W.; Xiao, T.; Bernard, G.; Shou, X.; Wen, D. Upconversion visible light emission in Yb/Pr co-doped yttria-stabilized zirconia (YSZ) single crystals. Crystals 2021, 11, 1328. [Google Scholar]
  12. Shou, X.; Xiao, T.; Fen, L.; Lei, Z.; Yu, H.; Bernard, G.; Wen, D. Growth and optical properties of thulia-doped cubic yttria stabilized zirconia single crystals. Ceram. Int. 2019, 45, 15974–15979. [Google Scholar]
  13. Chang, L.; Aleksandr, A.; Maxim, M.; Aleksandr, A.; Victor, A. Microwave sol-gel synthesis and upconversion photoluminescence properties of CaGd2(WO4)4:Er3+/Yb3+ phosphors with incommensurately modulated structure. J. Solid State Chem. 2015, 228, 160–166. [Google Scholar]
  14. Sushil, R.; Manisha, M.; Vineet, R. Er3+-Yb3+/Er3+-Yb3+-Li+/Er3+-Yb3+-Zn2+:Gd2O3 nanophosphors for efficient frequency upconverter and temperature sensing applications. Mater. Res. Bull. 2018, 106, 66–73. [Google Scholar]
  15. Chang, L.; Aleksandr, A.; Maxim, M.; Aleksandr, O.; Victor, A. Structural and spectroscopic effects of Li+ substitution for Na+ in LixNa1-xCaGd0.5Ho0.05Yb0.45(MoO4)3 scheelite-type upconversion phosphors. Molecules 2021, 26, 7357. [Google Scholar]
  16. Krishna, K.; Upadhyay, M.; Kesarwani, V.; Kumar, K. Blue frequency upconversion emission and optical thermometry of Ca3(PO4)2: Tm3+/Yb3+. Optik 2023, 273, 170477. [Google Scholar] [CrossRef]
  17. Yan, W.; Mei, L.; Er, X.; Shou, X.; Yu, H.; Wen, D. Luminescent properties and first-principles calculations of (Cr,Ca):YAG crystals. Int. J. Mod. Phys. B 2017, 31, 1744070. [Google Scholar]
  18. Wen, D.; Zhen, C.; Yan, M.; Xiu, C.; Ding, X.; Yu, H. Micro-defects and optical properties of YAG:Ce crystals prepared by optical floating zone method. Int. J. Mod. Phys. B 2017, 31, 1744068. [Google Scholar]
  19. Xiu, C.; Xiao, L.; Xiao, C.; Shou, X.; Ding, X.; Wen, D. Preparation, characterization and optical properties of Dy-doped yttrium aluminum garnet. Int. J. Mod. Phys. B 2017, 31, 1744071. [Google Scholar]
  20. Fen, L.; Xiao, T.; Shou, X.; Xiang, W.; Bernard, G.; Wen, D. Micro-defects and luminescence of thulium-doped yttrium aluminum garnet single crystals. Physica B 2022, 628, 413568. [Google Scholar]
  21. Fen, L.; Bernard, G.; Xiao, T.; Xiang, W.; Dan, C.; Wen, D. Luminescence and EPR properties of high quality ruby crystals prepared by the optical floating zone method. Opt. Mater. 2019, 91, 183–188. [Google Scholar]
  22. Li, S.; Long, Z.; Lei, L. Quantitative effect of Zr content on the structure and Water-Gas shift reaction activities of supported on Ceria-Zirconia. Crystals 2018, 8, 261. [Google Scholar]
  23. Hua, C.; Xian, Q.; Bin, L.; Yu, L.; Yu, Z.; Rui, T.; Mei, Z.; Qi, Z. Synthesis and room-temperature ultraviolet photoluminescence properties of zirconia nanowires. Adv. Funct. Mater. 2004, 14, 243–246. [Google Scholar]
  24. Soares, M.R.N.; Ferro, M.; Costa, F.M.; Monteiro, T. Upconversion luminescence and blackbody radiation in tetragonal YSZ co-doped with Tm3+ and Yb3+. Nanoscale 2015, 7, 19958–19969. [Google Scholar] [CrossRef]
  25. Xiao, T.; Shou, X.; Lei, Z.; Fen, L.; Bernard, G.; Wen, D. Preparation and optical properties of Ho3+-doped YSZ single crystals. Appl. Phys. A-Mater. Sci. Process. 2018, 124, 853. [Google Scholar]
  26. Yashima, M.; Ohtake, K.; Kakihana, M.; Arashi, H.; Yoshimura, M. Determination of tetragonal-cubic phase boundary of Zr1− xRxO2−x/2 (R = Nd, Sm, Y, Er and Yb) by Raman scattering. J. Phys. Chem. Solids 1996, 57, 17–24. [Google Scholar] [CrossRef]
  27. Jin, Z.; Zeng, X.; Xin, W.; Sheng, G.; Xin, L.; Fei, G. Ferroelectric and spectroscopic properties of Ho3+/Yb3+ co-doped Pb(Mg1/3Nb2/3)O3-32PbTiO3 crystal. Crystals 2022, 12, 225. [Google Scholar]
  28. Judd, B.R. Optical absorption intensities of rare-earth ions. Phys. Rev. 1962, 127, 750. [Google Scholar] [CrossRef]
  29. Ofelt, G.S. Intensities of crystal spectra of rare-earth ions. J. Chem. Phys. 1962, 37, 511–520. [Google Scholar] [CrossRef]
  30. Xiao, T.; Shou, X.; Fen, L.; Xiang, W.; Bernard, G.; Ding, X.; Wen, D. Highly efficient up-conversion green emission in Ho/Yb co-doped yttria-stabilized zirconia single crystals. J. Lumines. 2019, 209, 95–101. [Google Scholar]
  31. Xiong, J.; Peng, H.; Zhao, C.; Huang, Y.; Zhang, L.; He, M.; Chen, G. Crystal growth, spectroscopic characterization, and laser performance of Tm: LiLuF4 crystal. Laser Phys. Lett. 2009, 6, 868–871. [Google Scholar] [CrossRef]
  32. Ermeneux, F.; Goutaudier, C.; Moncorge, R.; Cohen-Adad, M.; Bettinelli, M.; Cavalli, E. Growth and fluorescence properties of Tm3+ doped YVO4 and Y2O3 single crystals. Opt. Mater. 1997, 8, 83–90. [Google Scholar] [CrossRef]
  33. Caird, J.; DeShazer, L.; Nella, J. Characteristics of room-temperature 2.3-µm laser emission from Tm3+ in YAG and YAlO3. IEEE J. Quantum Electron. 1975, 11, 874–881. [Google Scholar] [CrossRef]
  34. Weber, M.; Varitimos, T.; Matsinger, B. Optical intensities of rare-earth ions in yttrium orthoaluminate. Phys. Rev. B. 1973, 8, 47–53. [Google Scholar] [CrossRef]
  35. Guo, J.; Chao, T.; Zhen, Y.; Jian, L.; Zhao, Z.; Bai, W. Thermal properties and polarized spectral analysis of Tm3+: SrWO4 crystal. Solid State Commun. 2005, 134, 583–588. [Google Scholar]
  36. Gao, S.; Zhu, Z.; Wang, Y.; Li, J.; Tu, C. Polarized spectroscopic characterization and energy transfer of Tm3+-, Ho3+-BaLaGa3O7: New promising 2.0 µm laser crystals. Laser Phys. 2014, 24, 085004. [Google Scholar] [CrossRef]
  37. Xing, H.; Rui, W.; Yi, W.; Pei, Z.; Si, Z.; Zhen, C.; Yi, Z.; Gui, Z. A novel crystal Tm: Lu0.8Gd0.8Y0.4SiO5 with potential for broadband tunable lasing. Infrared Phys. Technol. 2018, 88, 81–86. [Google Scholar]
  38. Lisiecki, R.; Ryba-Romanowski, W.; Lukasiewicz, T. Relaxation of excited states fo Tm3+ and Tm3+- Eu3+ energy transfer in YVO4 crystal. Appl. Phys. B-Lasers Opt. 2006, 83, 255–259. [Google Scholar] [CrossRef]
  39. Kei, Y.; Tian, F.; Sheng, Z.; Cheng, L.; Tao, L.; Wei, M.; Zheng, Z.; Qing, W.; Liang, S.; Piotr, S.; et al. Spectral and laser performance of a Tm3+:ScYSiO5 crystal. J. Alloys Compd. 2017, 712, 412–417. [Google Scholar]
Figure 1. Yb/Tm:YSZ single crystal rods grown by the optical floating zone method.
Crystals 13 00460 g001
Figure 2. (a) XRD patterns for powders that were obtained by grinding x Yb/Tm: YSZ single crystals, (b) Raman spectra of x Yb/Tm: YSZ single crystals.
Crystals 13 00460 g002
Figure 3. Absorption spectra of 2.0Yb/Tm: YSZ single crystal.
Crystals 13 00460 g003
Figure 4. Up-conversion luminescence spectra for x Yb/Tm: YSZ crystals excited at 980 nm.
Crystals 13 00460 g004
Figure 5. Photo of the 2.0Yb/Tm: YSZ single crystals under 980 nm laser excitation.
Crystals 13 00460 g005
Figure 6. Intensities of emission peaks as a function of x in the x Yb/Tm: YSZ single crystal.
Crystals 13 00460 g006
Figure 7. Up-conversion emission spectra of 2.0Yb/Tm: YSZ single crystal under the 980 nm excitation with different powers. The inset is the relationship between the up-conversion emission intensity and excitation power for the 2.0Yb/Tm: YSZ single crystal.
Crystals 13 00460 g007
Figure 8. Energy level diagram of Tm3+−Yb3+ energy transfer in the YSZ crystal under the 980 nm excitation. ET = energy transfer upconversion; GSA = ground state absorption; ESA = excited state absorption.
Crystals 13 00460 g008
Figure 9. (a) Fluorescence decay curves for Tm3+ for 1G43F4 (658nm) transition in Yb/Tm: YSZ single crystals; (b) Fluorescence decay curve for Tm3+ for 1G43H6 (488 nm) transition in 2.0Yb/Tm: YSZ single crystal.
Crystals 13 00460 g009
Figure 10. Chromaticity diagram for Yb/Tm: YSZ single crystals. All coordinates are in the red circle.
Crystals 13 00460 g010
Table 1. Chemical compositions of Tm2O3 and Yb2O3 co-activated YSZ single crystals.
SamplesComposition (mol%)
YSZTm2O3Yb2O3
1.0Yb/Tm: YSZ98.50.51.0
2.0Yb/Tm: YSZ97.50.52.0
3.0Yb/Tm: YSZ96.50.53.0
4.0Yb/Tm: YSZ95.50.54.0
5.0Yb/Tm: YSZ94.50.55.0
Table 2. Cell parameters of x Yb/Tm: YSZ single crystals.
SamplesCell Parameters (Å)
a = b = c
1.0Yb/Tm: YSZ5.1590
2.0Yb/Tm: YSZ5.1581
3.0Yb/Tm: YSZ5.1580
4.0Yb/Tm: YSZ5.1555
Table 3. Values of average wavelength and the experimental and calculated oscillated strengths for the 2.0Yb/Tm: YSZ single crystal.
3H6 λ ¯ (nm)Doubly Reduced Matrix ElementsOscillator Strengths
(10−20 cm2)
‖U22‖U24‖U26FexpFcal
1D2359.6200.31560.09280.05560.0533
1G4482.730.04830.07480.01250.09140.0309
3F2 + 3F3679.9600.31641.09220.23380.2093
3H4781.750.23730.10900.59470.19570.2028
3H51193.250.10740.23140.63830.28020.1714
3F41688.910.53750.72610.23820.38930.3465
RMS ΔS (10−20 cm2)0.077
Table 4. Judd–Ofelt parameters for Tm3+ doped in different hosts.
CrystalΩ2 (10−20 cm2)Ω4 (10−20 cm2)Ω6 (10−20 cm2)Ω46Ref
LLF0.931.191.750.68[31]
YVO491.052.70.389[32]
SrWO47.410.250.980.15[33]
YAG0.71.20.52.4[34]
YAP0.672.300.743.108[34]
YLF2.421.280.901.422[35]
SrGdGa3O71.291.080.472.3[36]
YSZ0.410.120.150.80This work
Table 5. Calculated radiative transition rates, branching ratios, and radiative lifetimes for different transition levels of 2.0Yb/Tm: YSZ single crystal.
Initial LevelFinal Level λ ¯ (nm)Aedβτrad (ms)
1G43F216343.1930.561.764
3F3149414.0062.47
3H4117759.52010.50
3F4763210.58237.15
3H566642.7517.54
3H6488236.80941.78
3H43H521664.9811.402.819
3F4143227.0577.63
3H6801.8322.64190.97
Table 6. Values of CIE coordinates calculated for the various samples.
SampleCIE xCIE y
1.0Yb/Tm: YSZ0.10800.2661
2.0Yb/Tm: YSZ0.11640.2521
3.0Yb/Tm: YSZ0.11160.2528
4.0Yb/Tm: YSZ0.10570.2576
Disclaimer/Publisher’s Note: The statements, opinions and data contained in all publications are solely those of the individual author(s) and contributor(s) and not of MDPI and/or the editor(s). MDPI and/or the editor(s) disclaim responsibility for any injury to people or property resulting from any ideas, methods, instructions or products referred to in the content.

