Article

Impact of Erbium Doping in the Structural and Magnetic Properties of the Anisotropic and Frustrated SrYb2O4 Antiferromagnet

by
Diana Lucia Quintero-Castro
1,2,*,
Juanita Hincapie
2,3,
Abhijit Bhat Kademane
1,
Minki Jeong
4,5,
Matthias Frontzek
6,7,
Alexandra Franz
2,
Amutha Ramachandran
1,
Fabiano Yokaichiya
2,8,
J Ross Stewart
9 and
Rasmus Toft-Petersen
2,10,11
1
Department of Mathematics and Physics, Universitetet i Stavanger, 4036 Stavanger, Norway
2
Helmholtz Zentrum Berlin für Materialien und Energie, D-14109 Berlin, Germany
3
Laboratory for Magnetism and Advanced Materials, Universidad Nacional de Colombia, Manizales 17003, Colombia
4
Laboratory for Quantum Magnetism, Ecole Polytechnique Federale de Lausanne, 1015 Lausanne, Switzerland
5
School of Physics and Astronomy, University of Birmingham, Edgbaston, Birmingham B15 2TT, UK
6
Laboratory for Neutron Scattering, PSI, 5232 Villigen, Switzerland
7
Oak Ridge National Laboratory, Neutron Scattering Division, Oak Ridge, TN 37831, USA
8
Department of Physics, Universidade Federal do Paraná, Curitiba 82590-300, Brazil
9
ISIS Neutron and Muon Source, Rutherford Appleton Laboratory, Didcot OX11 0QX, UK
10
Department of Physics, Technical University of Denmark, 2800 Kgs. Lyngby, Denmark
11
European Spallation Source, Partikelgatan 2, 224 84 Lund, Sweden
*
Author to whom correspondence should be addressed.
Crystals 2023, 13(3), 529; https://doi.org/10.3390/cryst13030529
Submission received: 27 February 2023 / Revised: 11 March 2023 / Accepted: 13 March 2023 / Published: 20 March 2023
(This article belongs to the Special Issue Rare Earths-Doped Materials (Volume II))

Abstract

:
We present a systematic study of the structural and magnetic properties of a series of powder samples of SrYb 2 x Er x O 4 with different Yb/Er concentrations. Magnetometry and neutron diffraction have been used to study the magnetic ground states of the compound series, while inelastic neutron scattering was used to investigate the crystal field excitations for a chosen concentration. These results show that the crystal structure remains the same for all compositions, while the lattice parameters increase linearly with the Er content. All compounds showed some type of magnetic transition below 1 K, however, both the magnetic structure and nature of the phase transition vary throughout the series. The samples present a non-collinear magnetic structure with the moments lying on the ab plane for low Er content. For high Er content, the magnetic structure is collinear with the moments aligned along the c-axis. A critical concentration is found where there is a bifurcation between zero-field and field-cooled magnetic susceptibility. This irreversible process could be due to the random mixture of single-ion magnetic anisotropies.

1. Introduction

The chemical properties of the different rare earth elements are very similar, allowing for mutual solubility [1]. It is possible to percolate different rare earth ions in a single lattice adjusting the anisotropy parameters and inducing new magnetic properties. The substitute ion creates a random local field that disturbs the magnetic ground state of the parent compound, eventually freezing the moments, allowing for another kind of magnetic ground state to emerge or leading to order–disorder transitions [2,3,4,5,6].
Here, we present a systematic study of the influence of Er-doping in the magnetic properties of the anisotropic and frustrated antiferromagnet SrYb 2 O 4 . SrLn 2 O 4 compounds (Ln: Yb, Er, Ho, Dy, and Tb between others) are insulating rare-earth magnets, consisting of two distinct zigzag chains running along the c-axis (see Figure 1). The geometrical characteristics of these compounds, magnetic frustration and low dimensionality, in combination with strong single-ion anisotropy, suppress long-range order either totally or partially [7]. The members of this family exhibit unique and very different magnetic ground states, including the co-existing types of short-range order, incommensurate magnetic structures, non-collinear magnetic structures, and the absence of magnetic order [8,9,10,11,12]. Magnetic exchange interactions are different for each zigzag chain, and interactions between the chains are weak, as it has been reported for SrEr 2 O 4 [13], SrYb 2 O 4 [14], and SrDy 2 O 4 [9]. Thus, these systems can be considered as having two independent highly anisotropic zigzag chains. A consequence is a display of very complex magnetic phase diagrams [14,15,16].
SrEr 2 O 4 presents long-range magnetic correlations, coupling one of the spin chains along the c-axis. This order coexists with short-range incommensurate magnetic order for the second chain [18,19]. This ground state stands in contrast to the magnetic properties of SrYb 2 O 4 , where the long-range magnetic order is formed at 0.9 K, aligning with partial magnetic moments in the a b plane for both chains in a non-collinear manner. This long-range order coexists with short-range spin correlations evidenced by the presence of elastic and inelastic magnetic diffuse scattering [14]. The magnetic properties of ytterbium magnets with edge-shared octahedra are attracting a lot of interest in the quantum magnetism community [20,21]. This is due to the large energy separation between the ground state Kramers doublet of Yb 3 + and the first crystal field excited state. This well-isolated ground state is common in Yb 3 + -based compounds. This effective spin-only doublet ground state can host interactions leading to quantum fluctuations irrespective of its composition [22]. This exhibits spin ice states [23], dimerization [24,25], and spin liquid-like behaviour [26].
In this manuscript, an investigation of the influence of randomly substituting Yb using the Er in SrYb 2 O 4 is presented. This work aims to contribute to the understanding of the series’ atomic and magnetic structure, single-ion anisotropy and geometric frustration, by testing how robust are these co-existing types of magnetic order in a percolated system. The powder samples of these compounds have been prepared. The DC magnetic susceptibility as well as the magnetization measurements were performed. The atomic and magnetic structures are investigated using neutron powder diffraction, while the Crystal Field (CF) levels scheme is investigated using inelastic neutron scattering (INS). Our findings indicate that it requires less than 25 % Er substitution for it to dominate the magnetic ground state.

2. Experimental Details

The powder samples of SrYb 2 x Er x O 4 were synthesized by performing a solid-state reaction. The off-stoichiometric amounts of SrCO 3 and Yb 2 O 3 (Er 2 O 3 ) were thoroughly mixed in a ratio 1:0.85; 15% extra SrCO 3 was found to be necessary for all samples due to SrCO 3 evaporation following [27]. The mixed precursors were pressed into a pellet and heated three times for periods of 36 h at 1350 C with intermediate grindings to achieve a single phase powder of SrYb 2 x Er x O 4 . Multiple measurements were recorded to characterize these samples, including squid magnetometry, X-ray, and neutron diffraction. The static magnetic susceptibility and low-field magnetization were measured using a superconducting quantum interference device Magnetic Property Measurement System, Quantum Design at the Laboratory for Magnetic Measurements at the Helmholtz-Zentrum Berlin. The susceptibility measurements were performed using a field of 1 T over a temperature range of 2–400 K. The magnetic moment was also measured as a function of the magnetic field at 2 K and 0.3 K for all the samples. The susceptibility measurements for temperatures down to 0.3 K were recorded in a Cryogenics Ltd. system. The powder samples were mixed with stycast. Four copper wires anchored to the coldest spot were used to aid good thermalization. The stycasted sample was glued using GE varnish onto a silver cold finger. The data from 0.3 K up to 1.5 K and 2.5 K were obtained by pumping liquid 3 He. The susceptibility was obtained in an applied field of 0.01 T.
To study the atomic structure of SrYb 2 x Er x O 4 (with x = 1 ,   2 ,   5 ,   50 % ) samples, the fine resolution powder diffractometer FIREPOD at the BER II reactor at the Helmholtz-Zentrum Berlin (HZB) was used [28]. An incident neutron wavelength of 1.798 Å was selected using a Ge ( 511 ) monochromator. The data were collected at room temperature with a counting time of 5 h each. The magnetic structure was studied by means of the powder neutron diffraction using the neutron diffractometer DMC at PSI [29] for the samples with x = 1 ,   5 ,   25 ,   50 % . A wavelength of 2.45 Å selected using a PG monochromator, was chosen with the aim of acquiring data at low wave–vector transfers. Counting times of 7 h per temperature per sample were used. The measurements were collected at dilution temperatures of 40 mK and 10 K, with the aim of subtracting the magnetic signal from the nuclear contribution (at 10 K). The inelastic neutron scattering experiments were performed on a polycrystalline sample of SrYb 2 x Er x O 4 (with x = 10 % ) mass 3.9 g at 5 K and 220 K. The direct geometry neutron Time-of-Flight (TOF) instrument MAPS at ISIS-RAL [30] was used to perform these measurements. It was operated in two multi-rep modes yielding two incident energies ( E i ) 28 meV and 160 meV using the sloppy chopper operated at 400 Hz. For convenience, the notation Er X % , where X denotes the substituted percentage, is used in this manuscript to refer to the Er-substituted percentage.

3. Results and Discussion

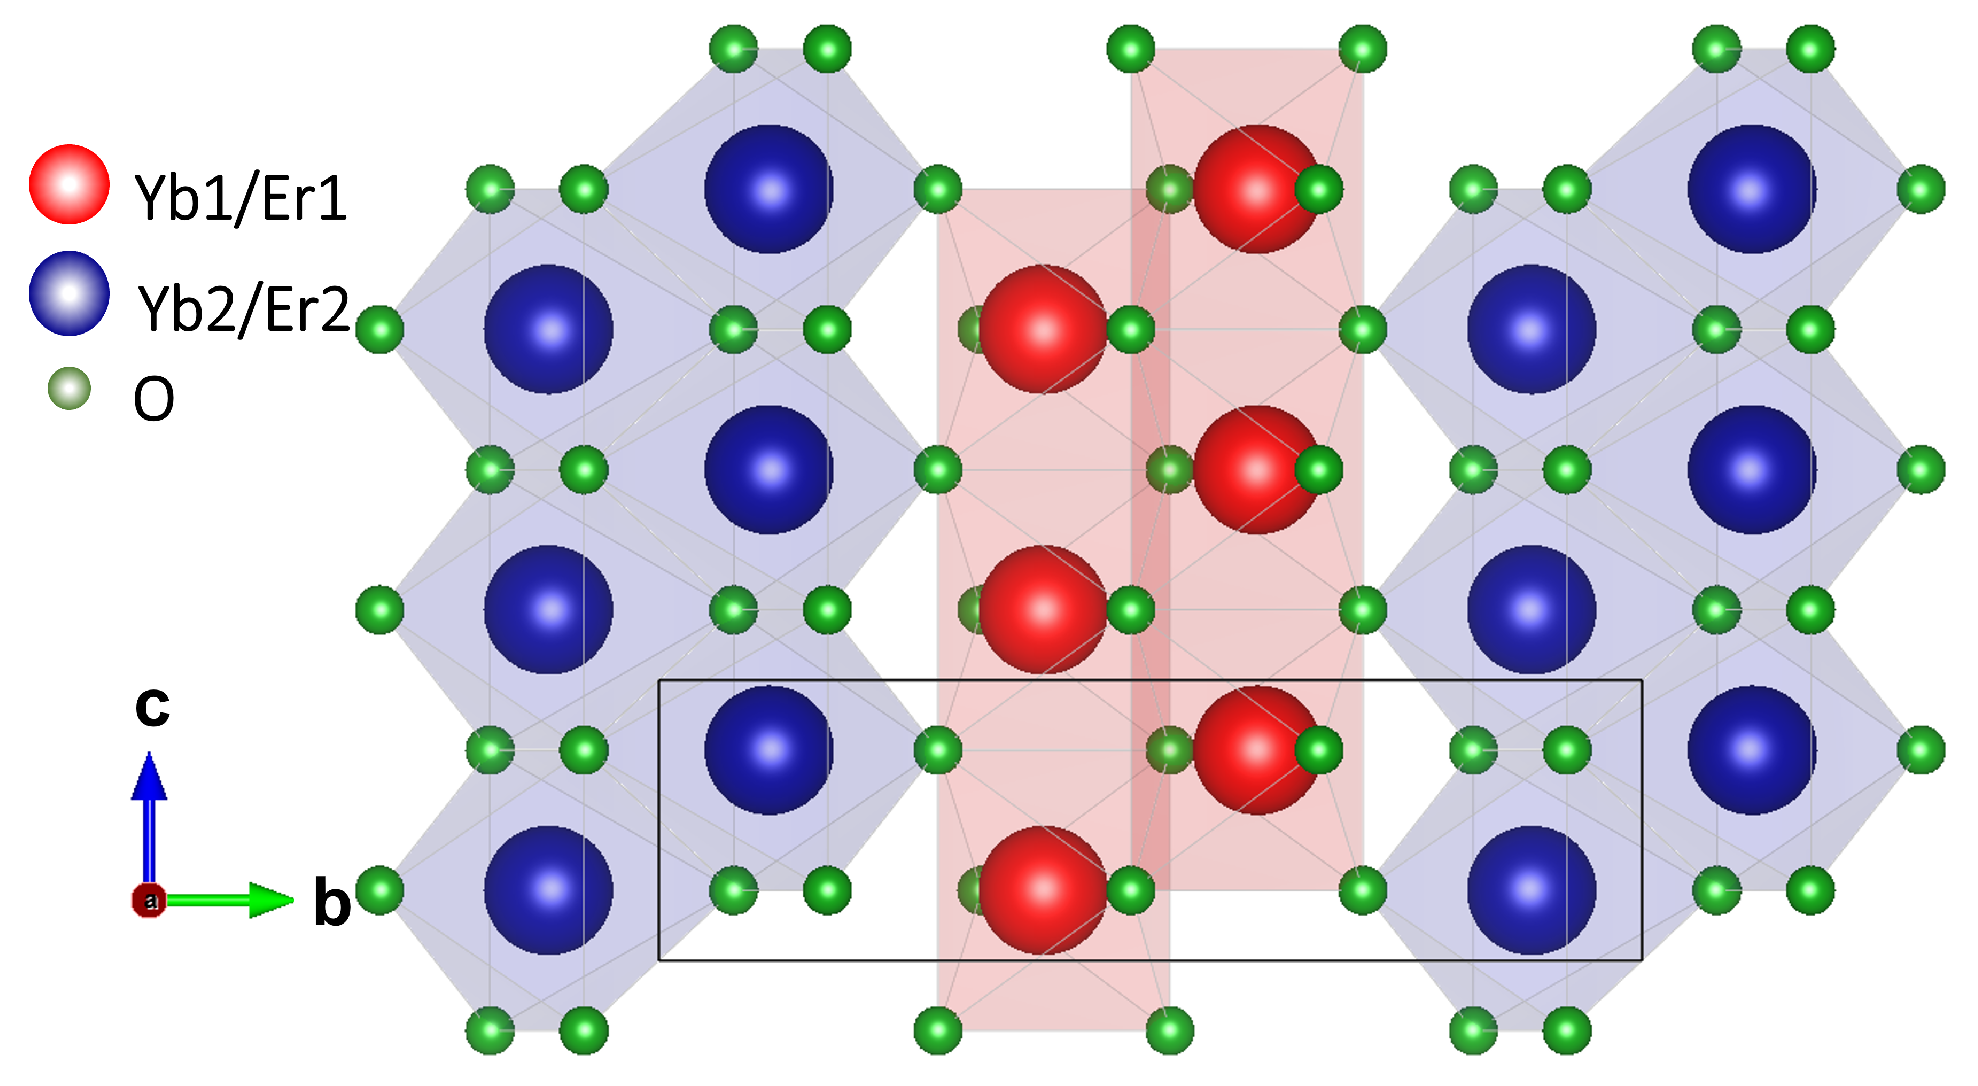
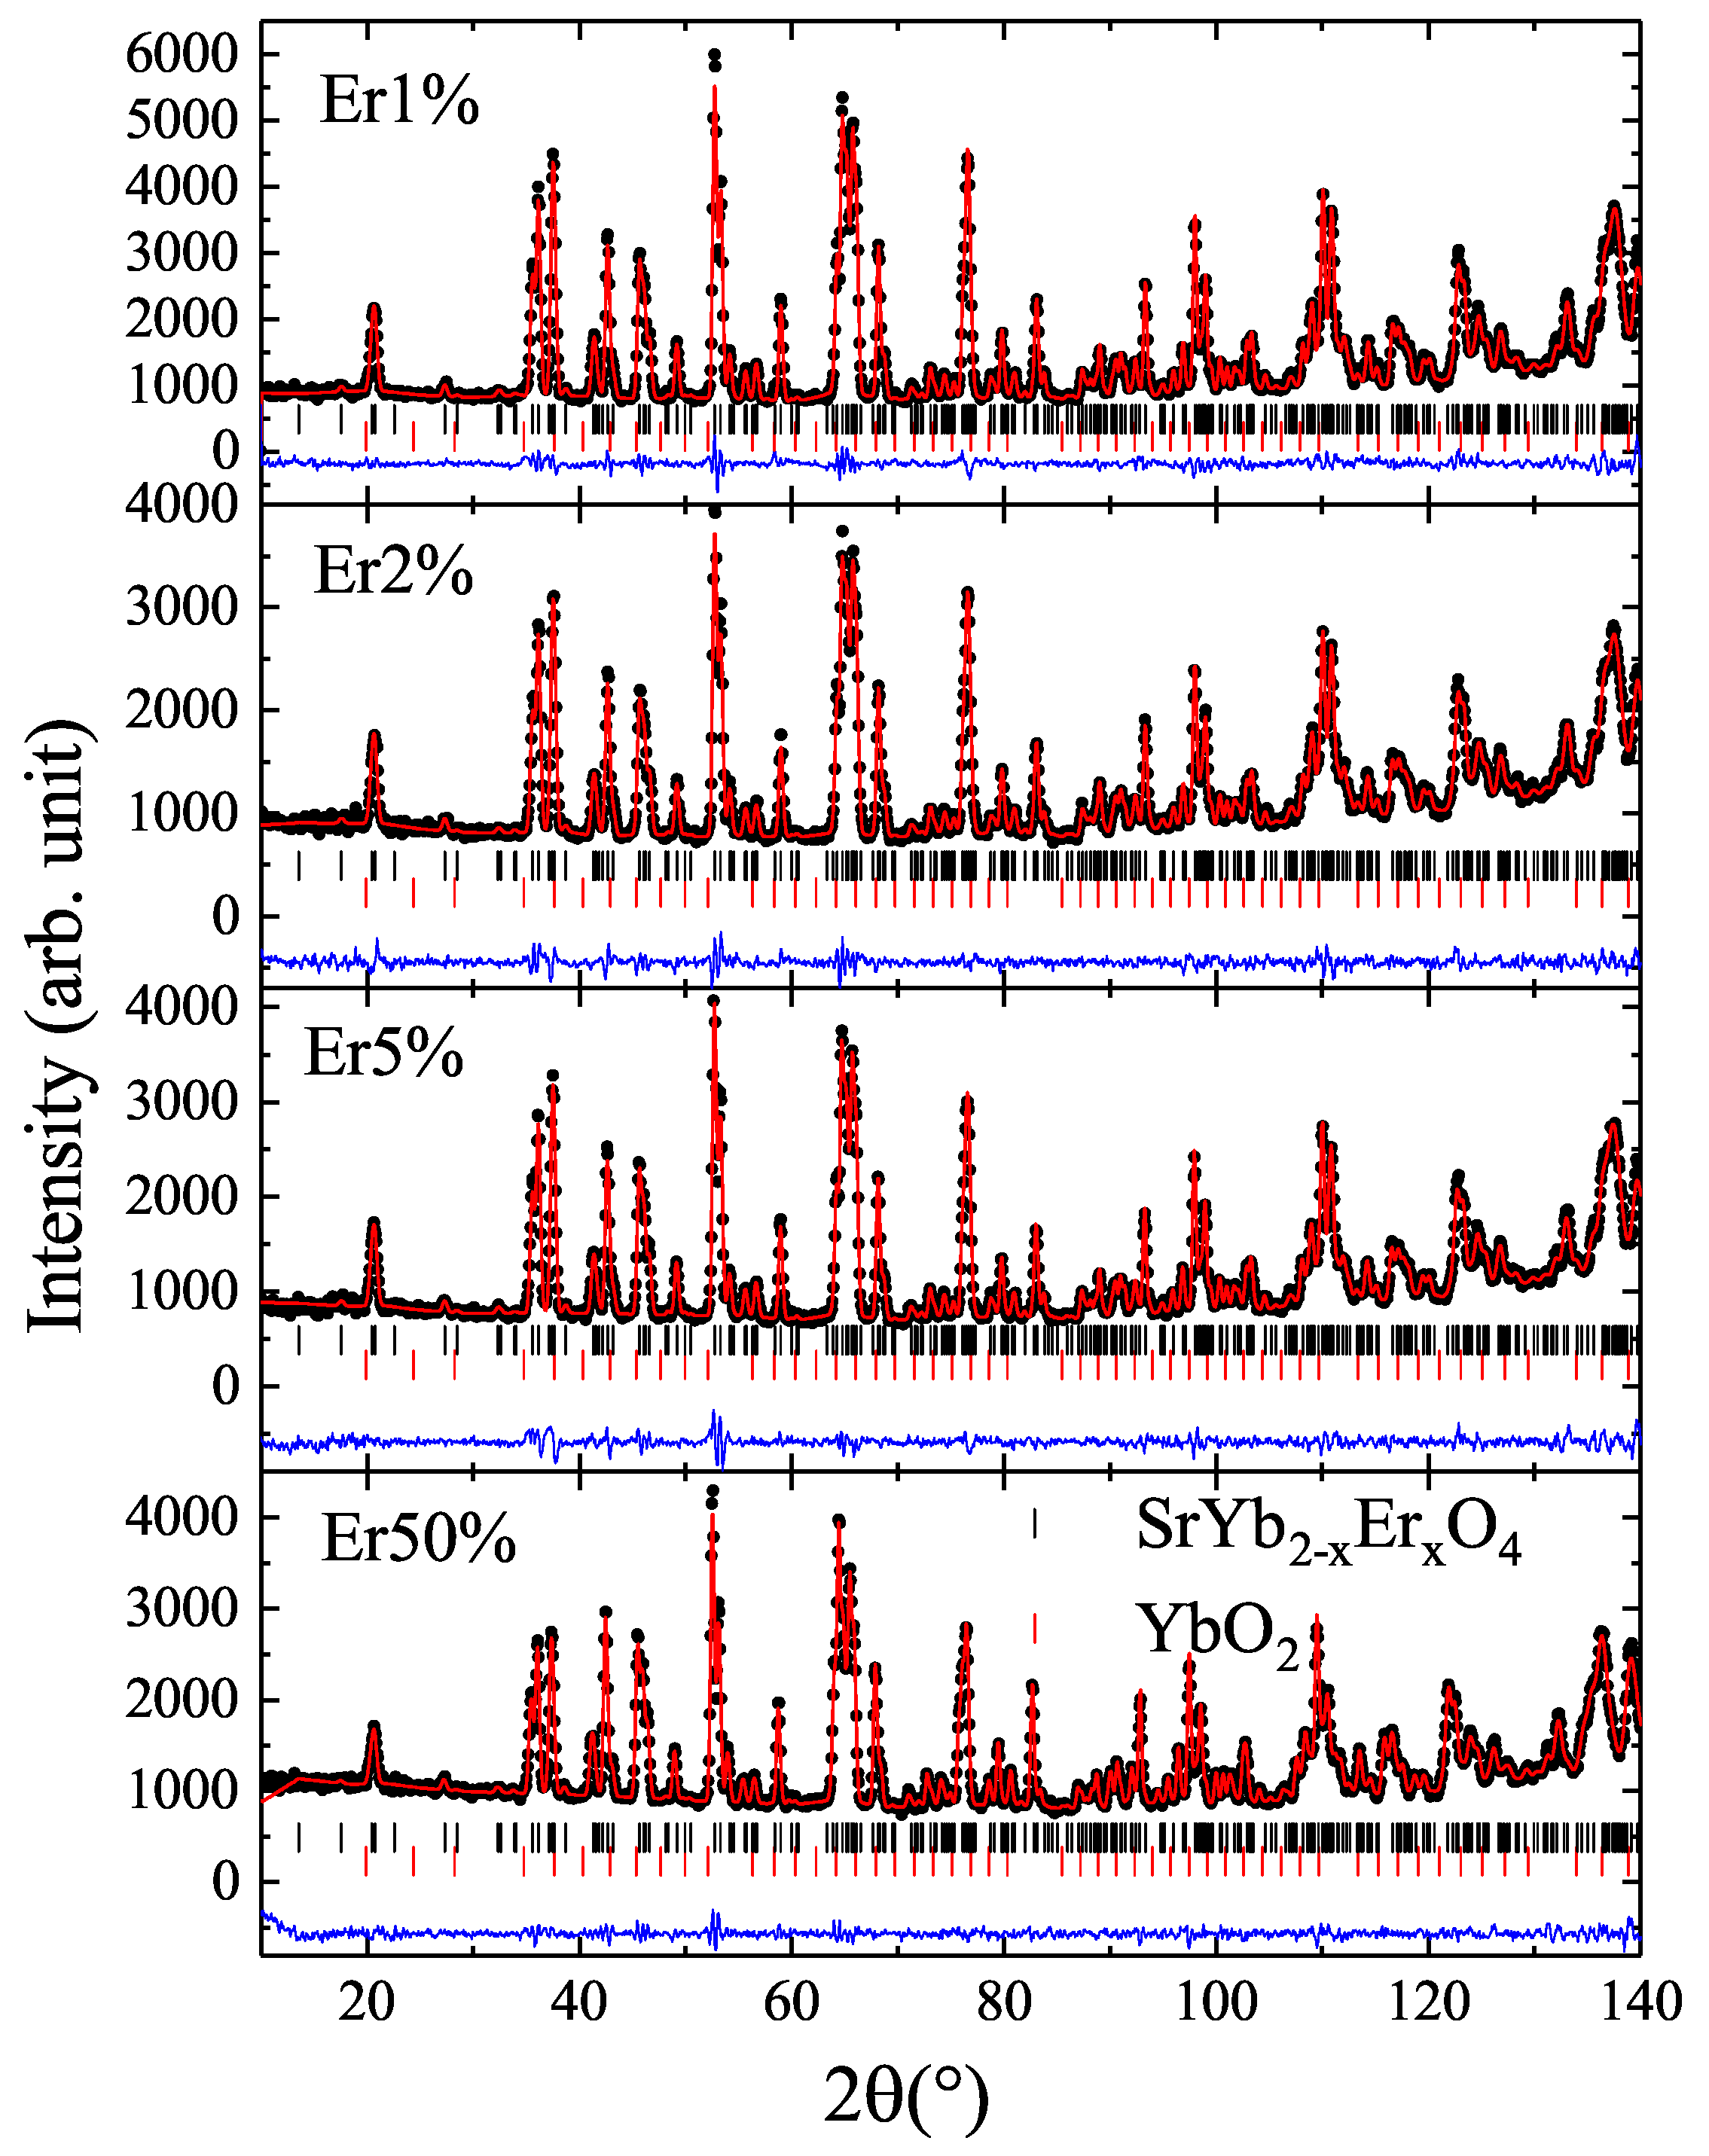
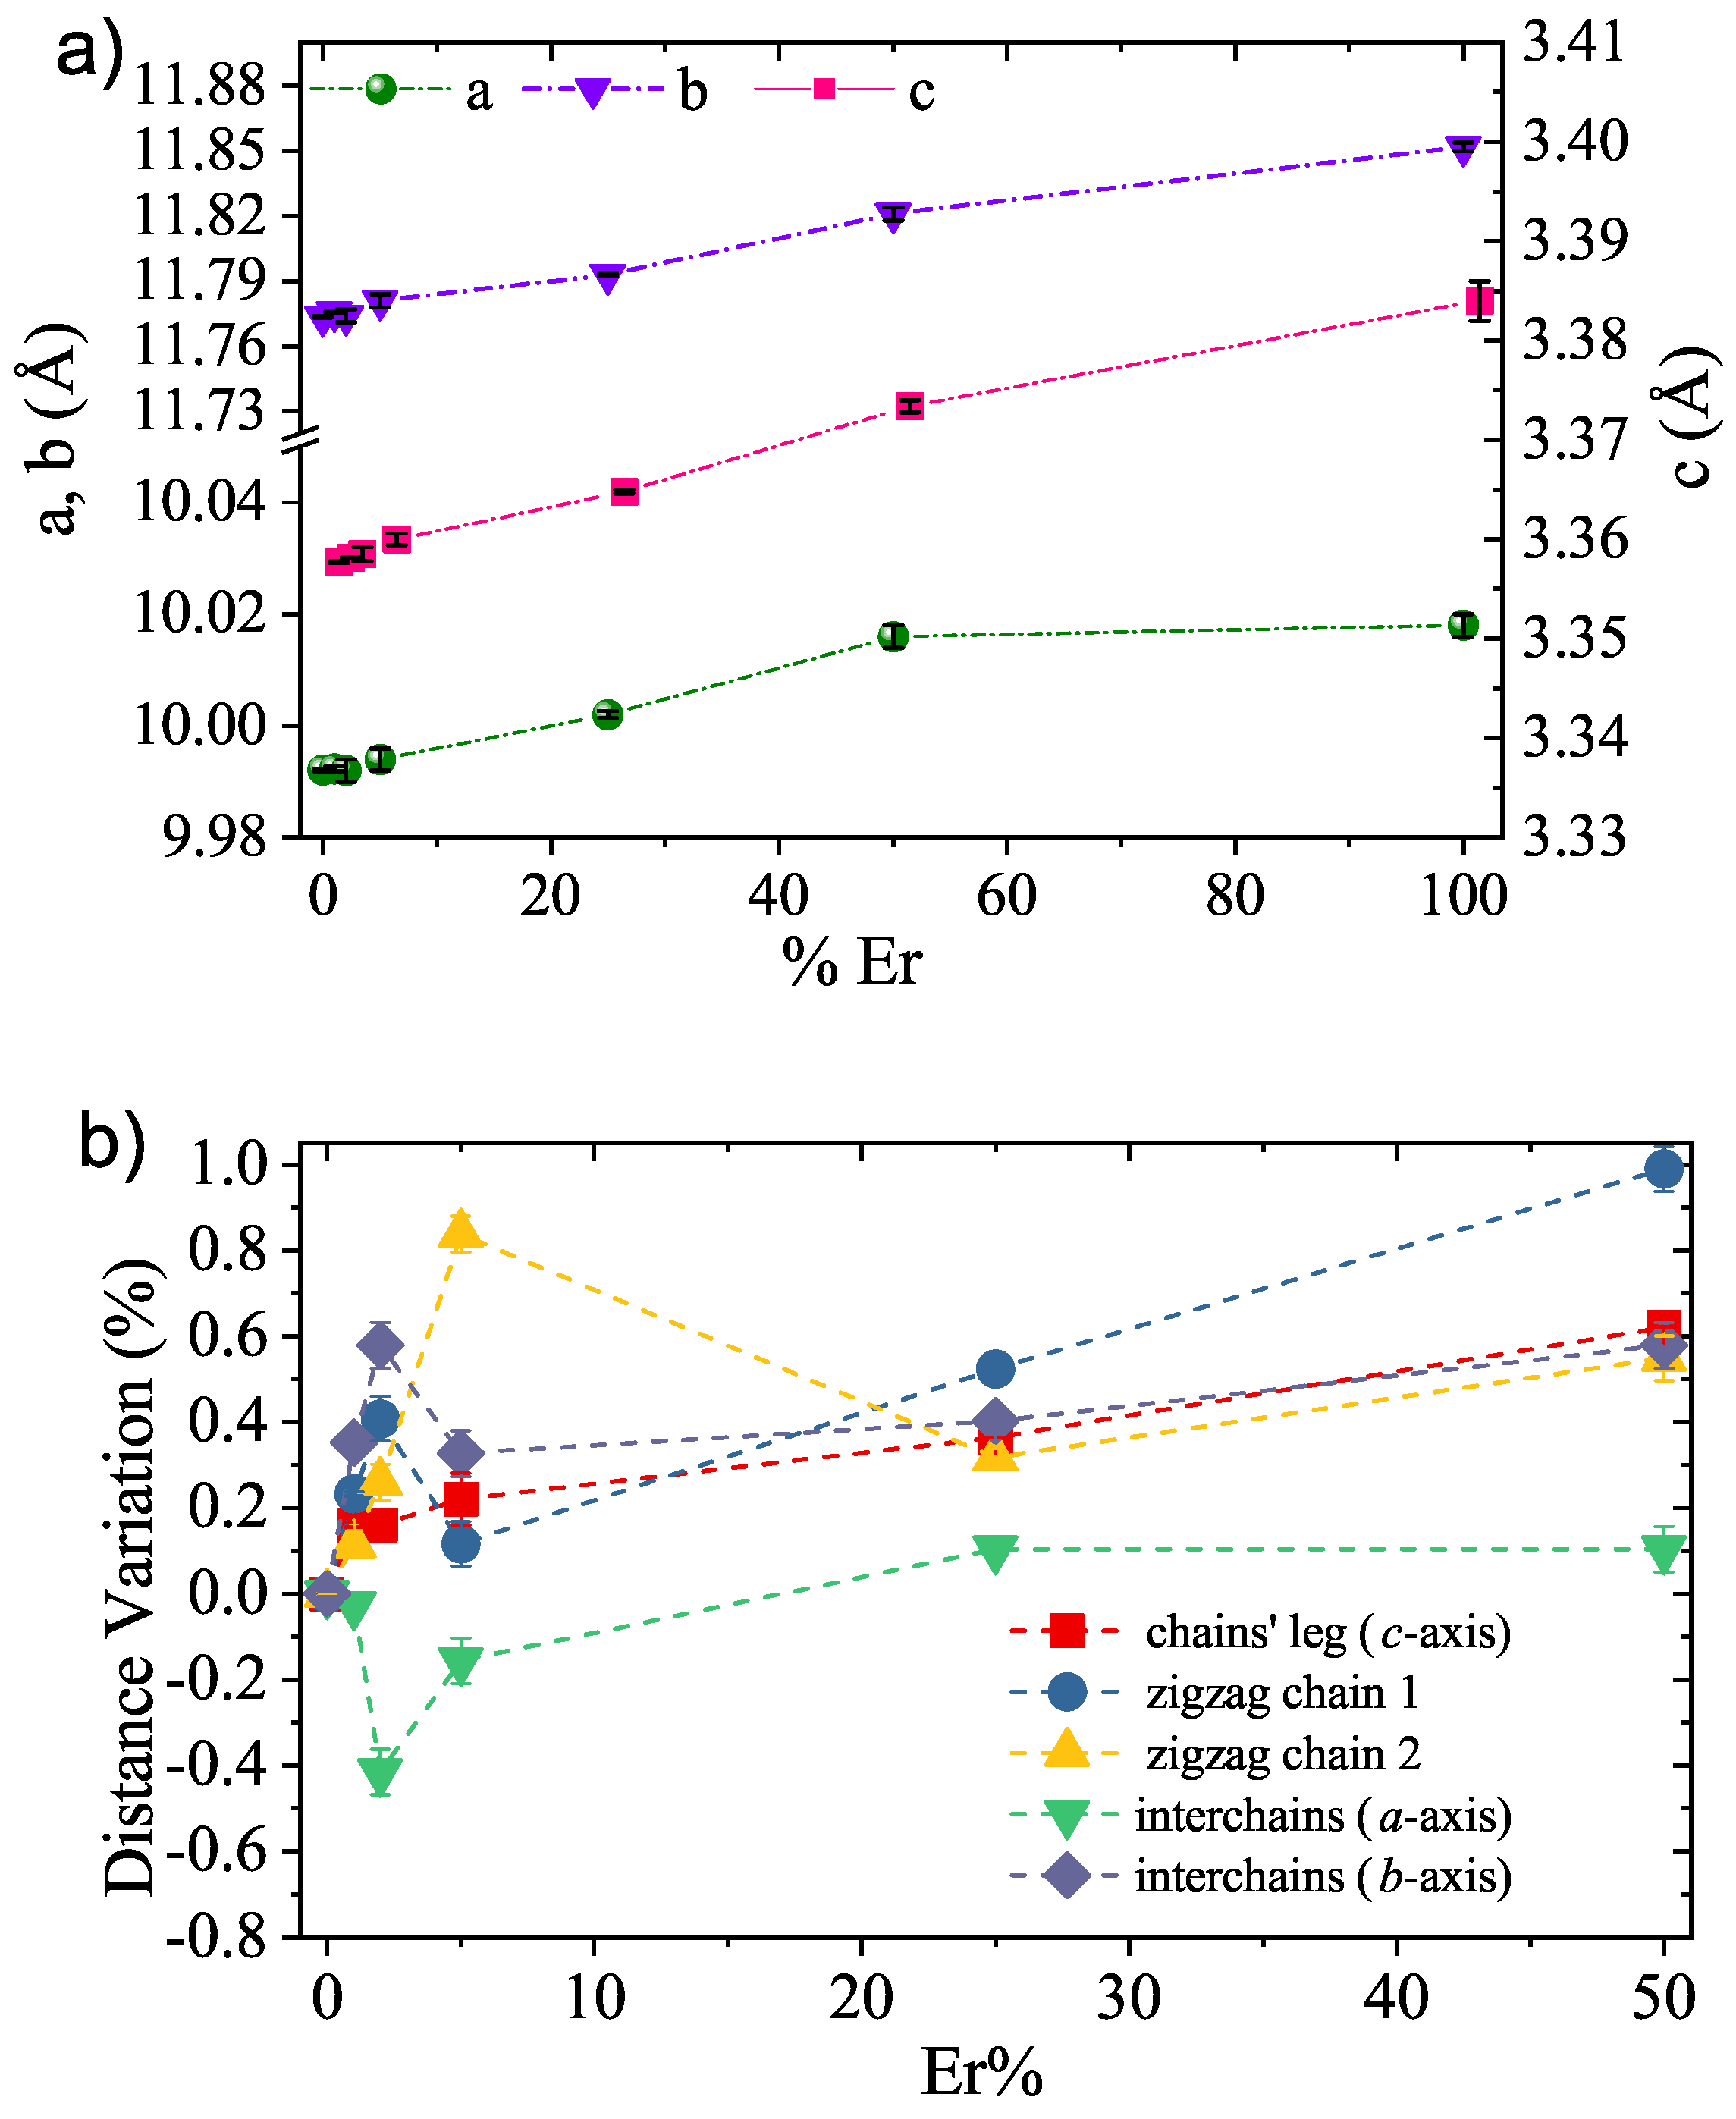
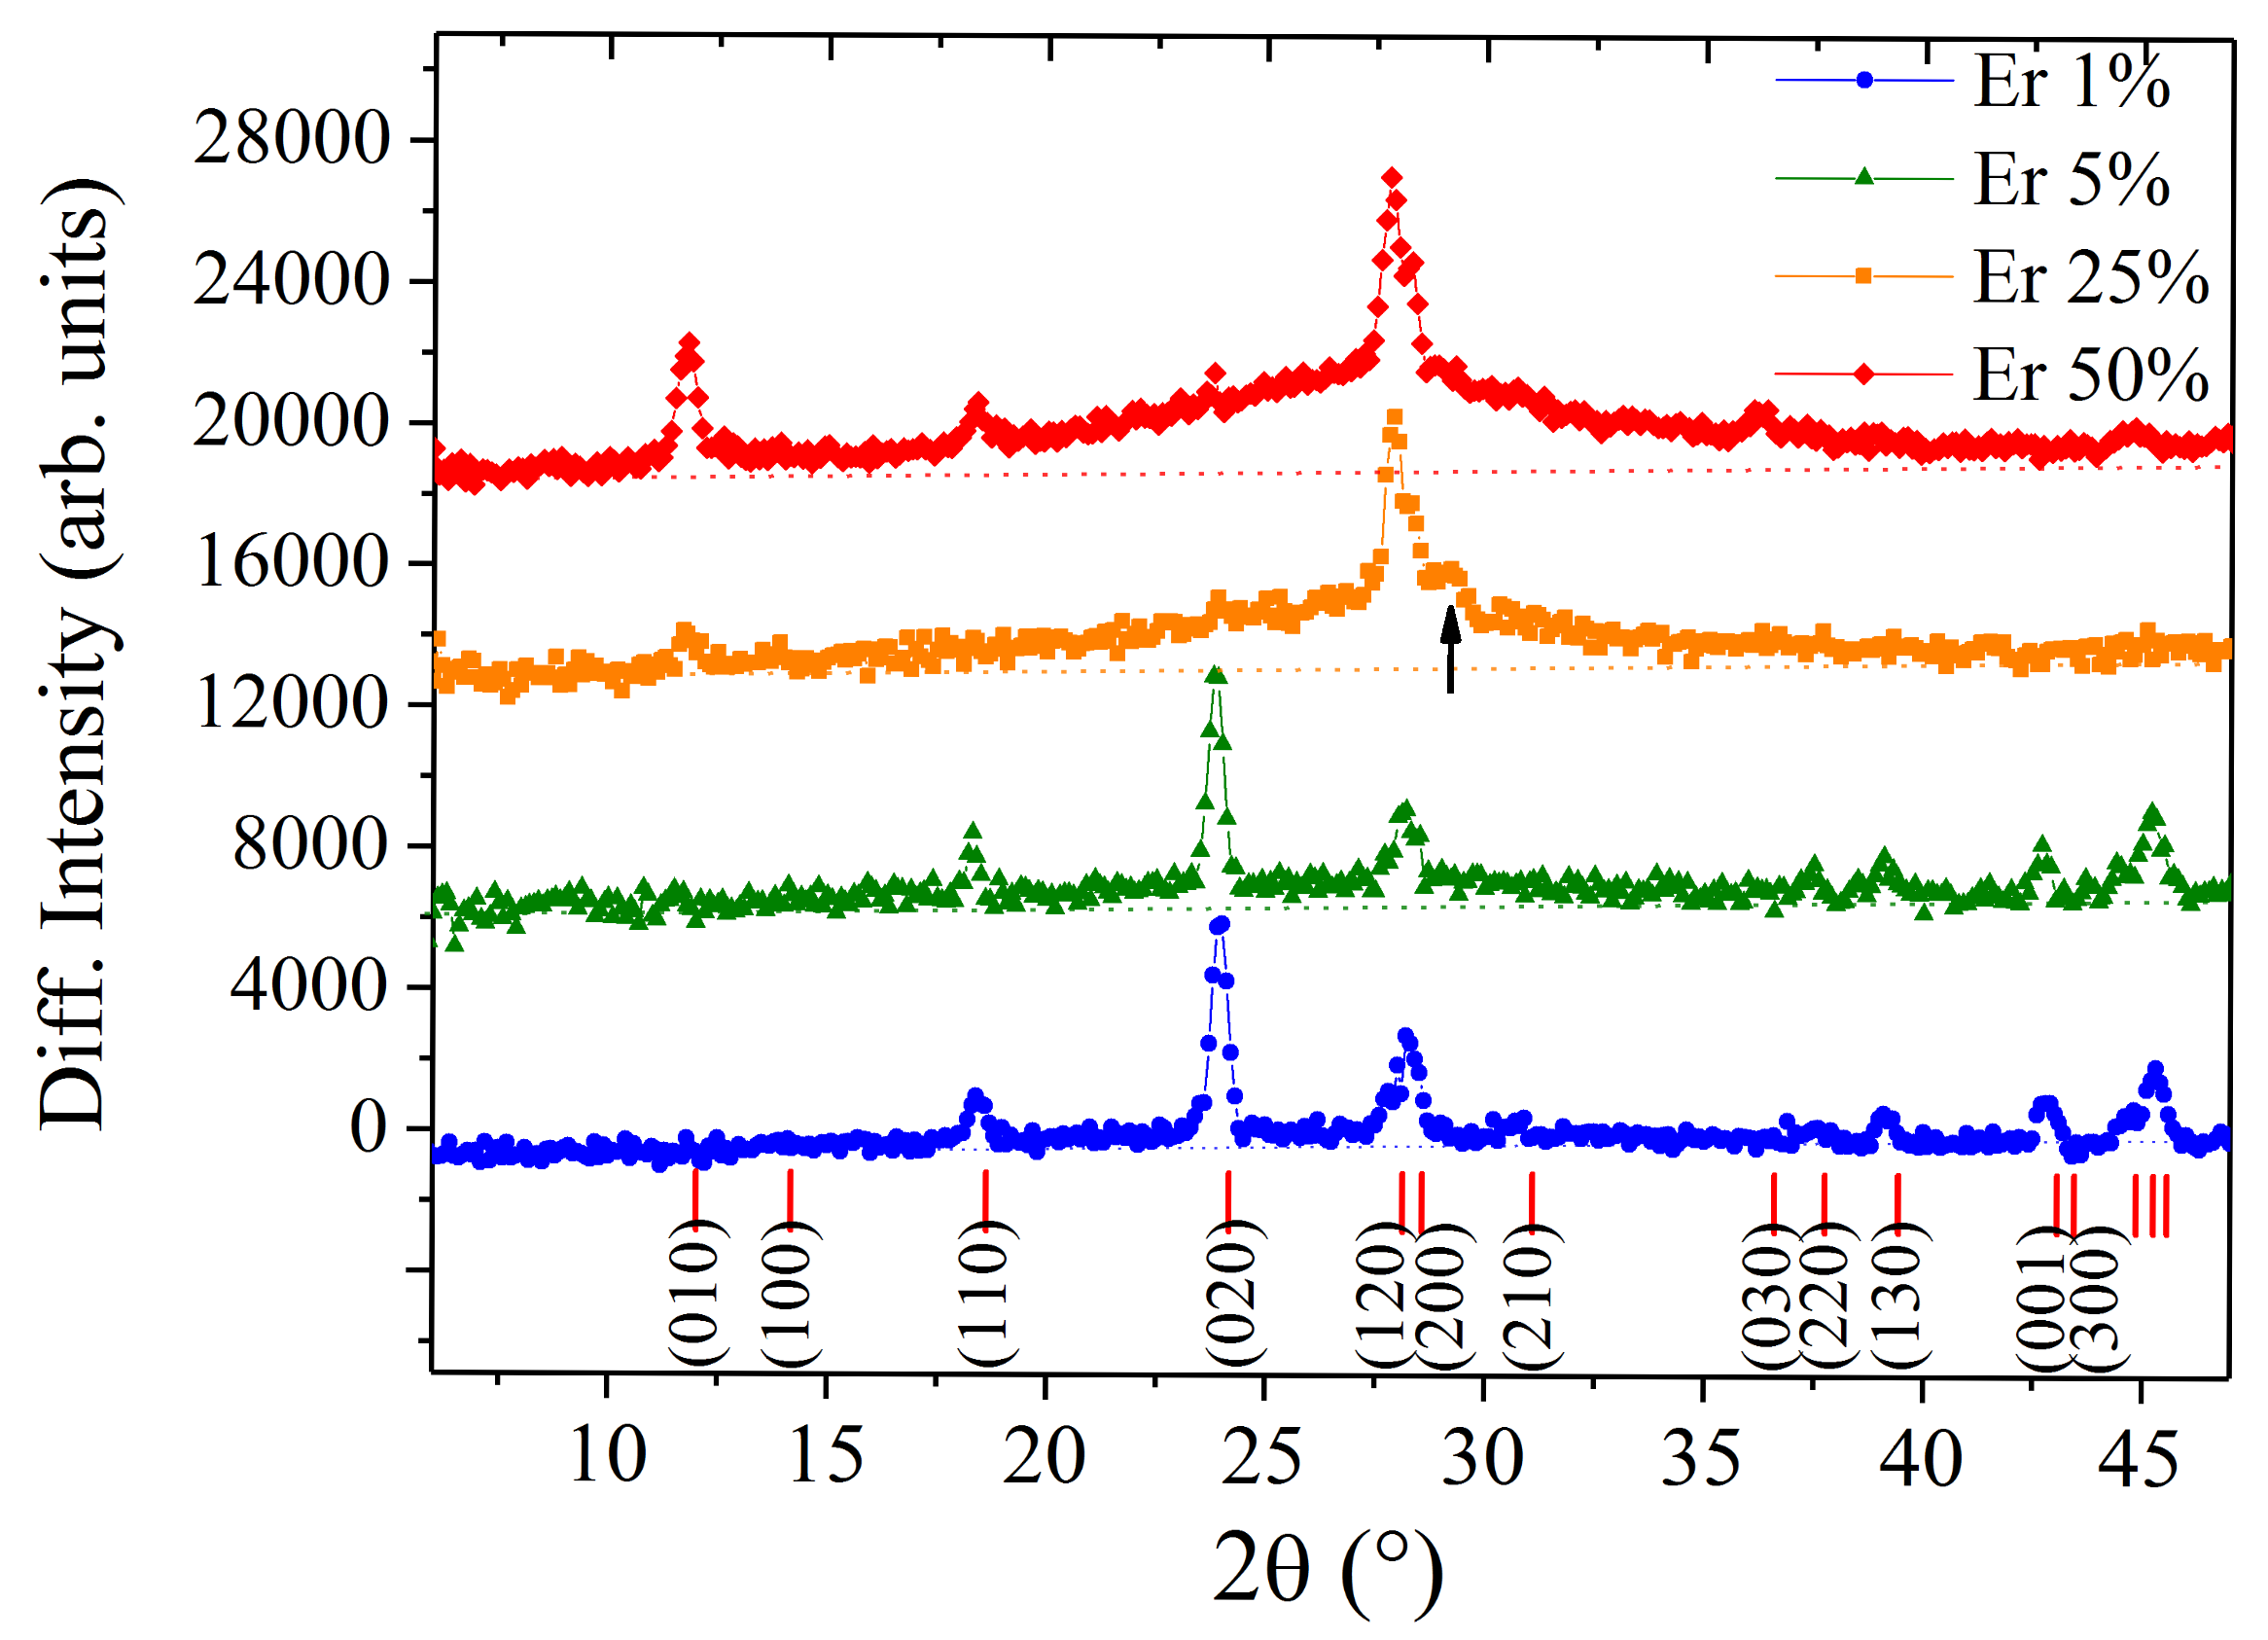
3.1. Structural Characterization

The atomic structure of SrYb 2 O 4 and SrEr 2 O 4 consists of nonmagnetic Sr 2 + ions filling the columnar cavities of a network of edge- and corner-shared LnO 6 octahedra. These octahedra form a distorted honeycomb-like structure in the a b plane. The rare-earth ions are arranged in zigzag chains running parallel to the c-axis. Each chain contains only one of the two crystallographically independent rare-earth ions. A schematic figure of the atomic structure projected onto the b c plane is shown in Figure 1.
Powder neutron diffraction patterns acquired on FIREPOD at room temperature are shown in Figure 2. The patterns were refined using the Rietveld method in FULLPROF [31]. The crystal structure was refined successfully for all samples in the space group Pnam (No. 62), in agreement with the published atomic structures of the parent compounds SrYb 2 O 4 and SrEr 2 O 4 . The resulting lattice parameters and R-factors are listed in Table 1.
The unit cell expands as more Er is introduced to the structure. The total expansion for Er 50 % is of 1.6 % from a total cell volume of from 393.0132 ( 2 ) Å 3 [14] to 399.40 ( 2 ) Å 3 . The dependence of the lattice parameters as a function of the Er content is linear as it is shown in Figure 3a.
The Er ion was found to occupy both crystallographic positions. The neutron scattering lengths for the Er and Yb ions are different enough to refine site occupations from FIREPOD ( 7.79 fm for Er and 12.41 fm for Yb). The refined values are consistent with the ratios calculated for the solid-state reaction during sample preparation. The occupations are listed in Table 1. Malkin et al. [13] have reported the possibility of the rare-earth ion occupying the Sr position. However, we do not find evidence for this in our samples within the experimental capabilities of the chosen methods.
As described earlier, an off-stoichiometric mix of the initial reactants was needed to avoid an excess of Yb 2 O 3 . In order to ensure that the impurity phase was nonexistent in our final samples, the phase was refined in addition to the expected structure. It was found that such impurities constitute much less than 1% of the total sample mass.
Figure 3b shows the variation of the interatomic distances as a function of the Er content in comparison with the interatomic distances in SrYb 2 O 4 . These distances have been extracted from the results of the refinement of the neutron powder diffraction patterns collected on FIREPOD at room temperature. The changes within these characteristic atomic distances are not linear with the doping ratio of the Er ions, but there are abrupt changes for the Er contents between 5% and 10%. The biggest change is seen in the distance along the zigzag for chain 2. The overall changes in the a b plane compensate to cause the average relative deviation from a perfect honeycomb structure to be constant. None of the zigzag chains are equilateral triangles in any of these compounds.
We find that the deviations from the perfect oxygen octahedra surrounding both chains are not as big as the deviations reported for SrTb 2 O 4 [12] or SrDy 2 O 4 [9] and that these do not change significantly when introducing Er to the structure.

3.2. Magnetic Properties

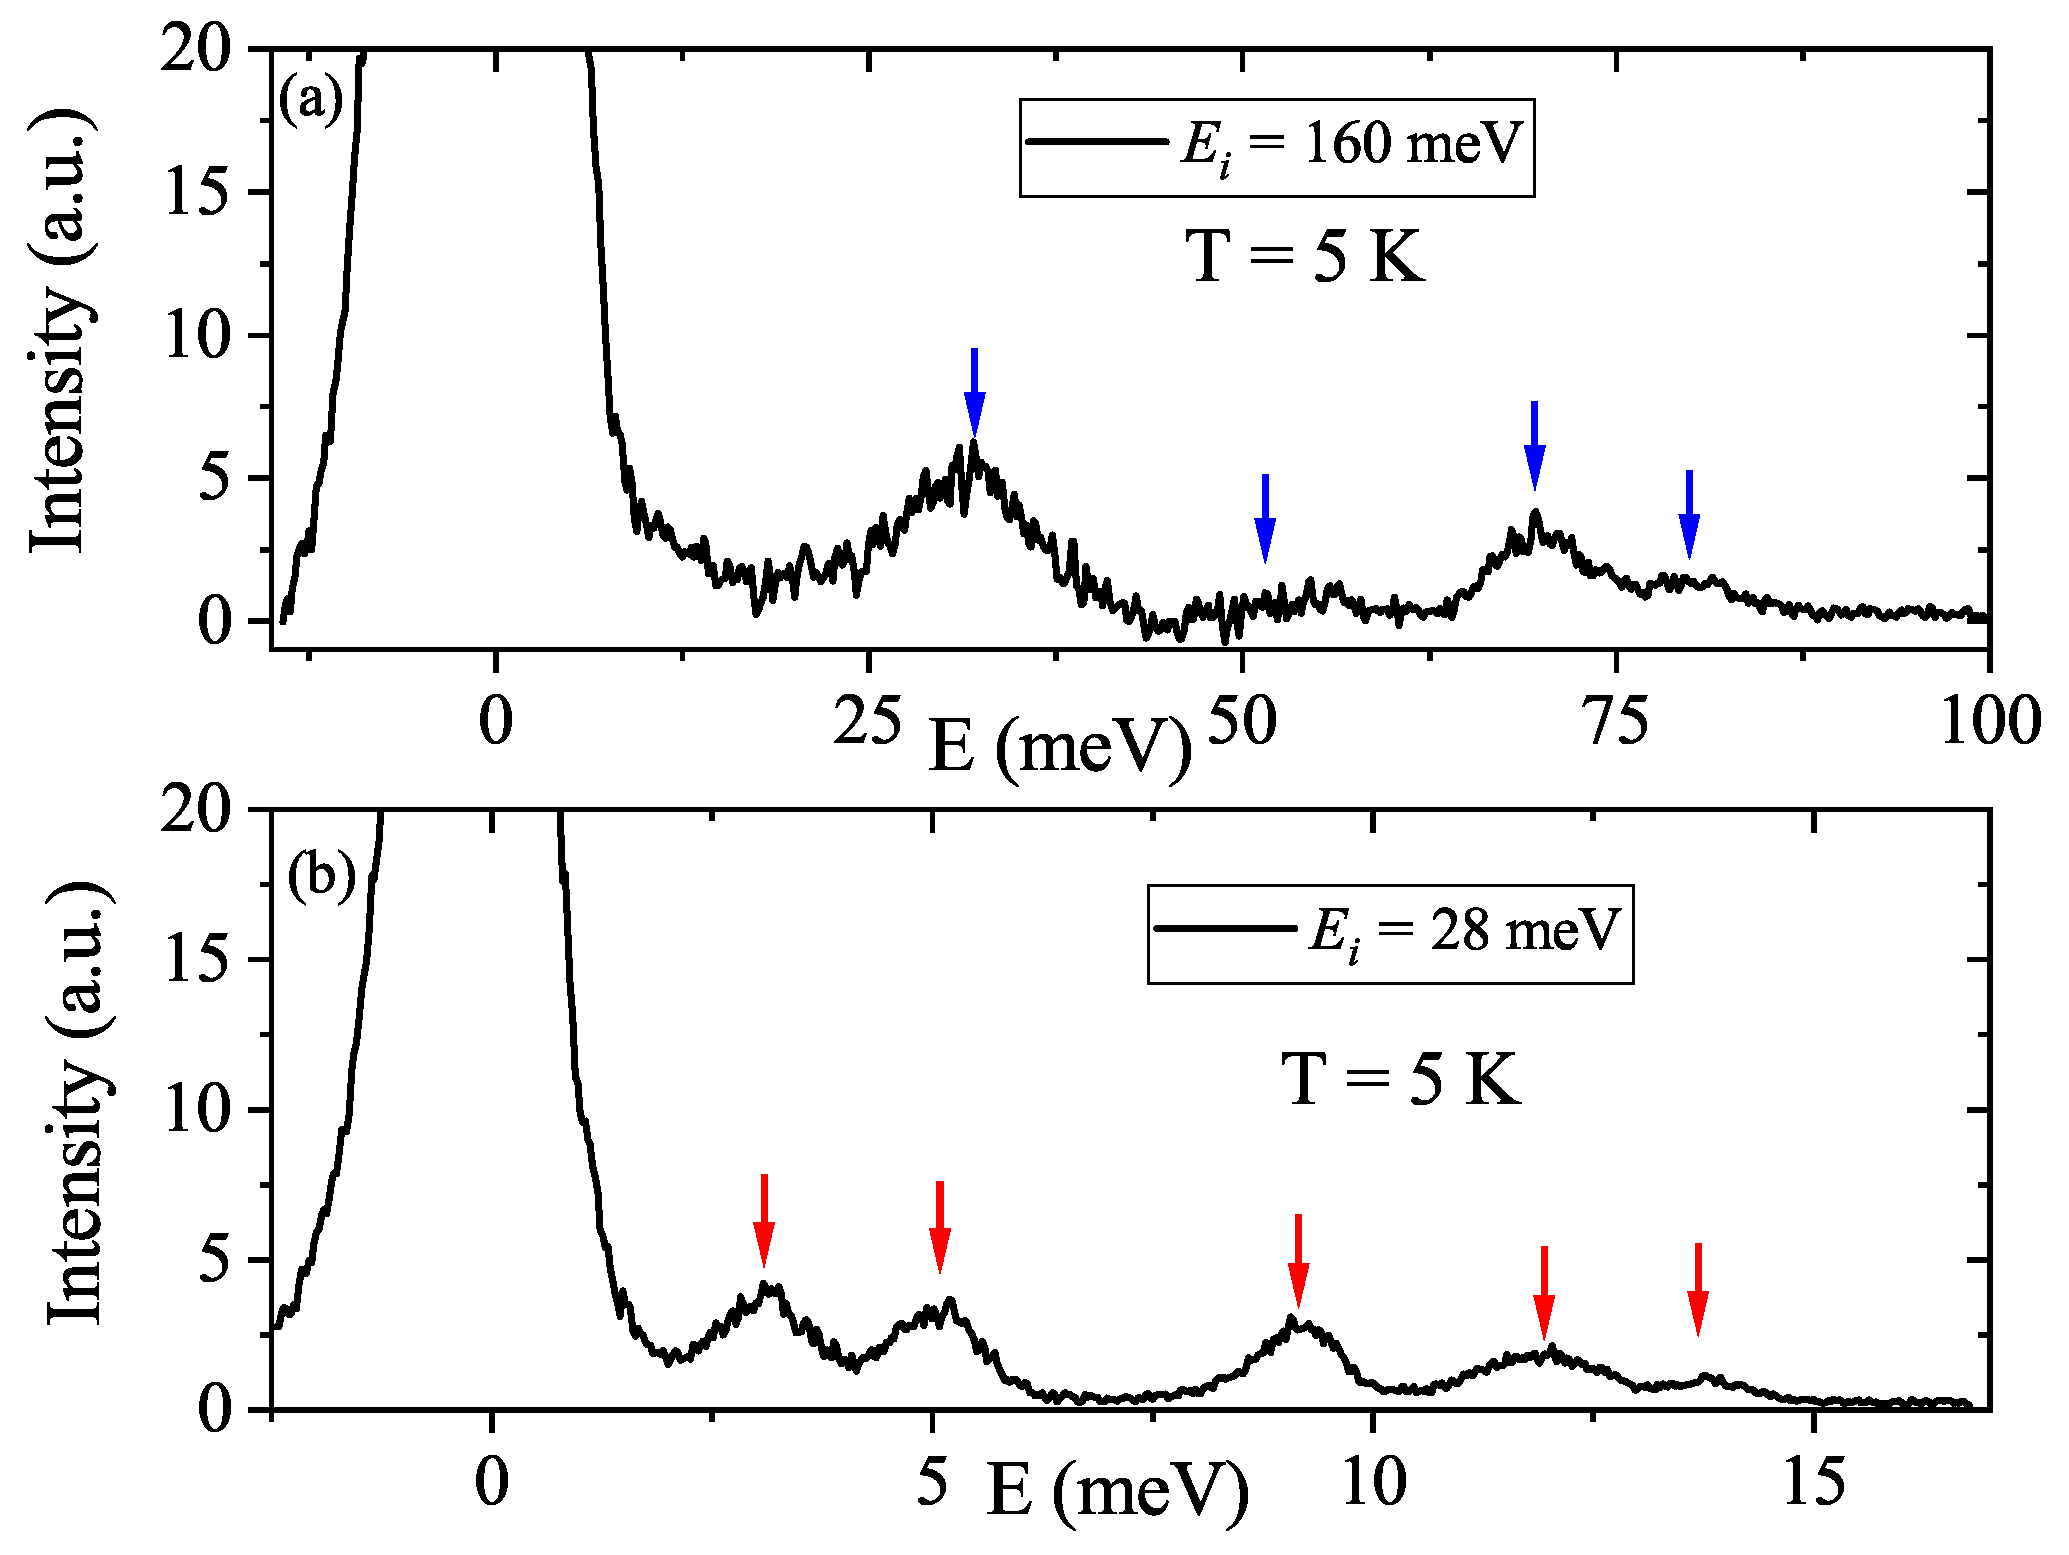
3.2.1. Single-Ion Anisotropies

A characteristic playing an important role in the nature of the unconventional magnetic ground states in this family of compounds is that they appear to present different single ion anisotropy for each Ln 3 + site and therefore host different magnetic ground states per chain. Experimental studies and calculations support this idea for SrEr 2 O 4 [13], SrDy 2 O 4 [9], and SrYb 2 O 4 [32]. The lanthanide ions are surrounded by the distorted oxygen octahedra, the site symmetry for both inequivalent sites is monoclinic, C 1 h , and is characterized by a single mirror plane perpendicular to the c-axis. Malkin et al. [13] find that, for SrEr 2 O 4 , the easy axis of the magnetization is parallel to the chain direction (along the c-axis) for Er1, and is perpendicular to the chain direction for Er2. A similar behaviour is reported in the case of SrDy 2 O 4 , where site 1 has an easy axis anisotropy along the c-axis and site 2 has an easy axis in the a b plane [9]. In SrTm 2 O 4 , site 1 has an easy axis anisotropy and site 2 has easy plane anisotropy both lying in the a b plane [33]. These studies report a non-obvious symmetry correspondence between the suggested anisotropy and the oxygen atom positions surrounding the magnetic ions.
In the case of SrEr 2 O 4 , the ground multiplet 4 I 15 / 2 of Er 3 + is split into eight Kramer’s doublets for low point symmetry, and the bandwidth extends up to 28 meV [13]. In the case of SrYb 2 O 4 , the ground multiplet 2 I 7 / 2 of Yb 3 + splits in 4 Kramer’s doublets. The inelastic neutron scattering measurements reported in [32] show three excited modes for both Yb sites. The ground state Γ 6 is well isolated with a gap next to the excited state of about 25.86 meV for both sites. Precise CF parameters for the SrYb 2 O 4 that can describe inelastic neutron scattering and magnetic susceptibility results have not been reported; therefore, the single-ion anisotropy is still unknown.
Powder INS spectra measured for the Er 10 % are presented as a function of energy transfer ( Δ E) in Figure 4a,b. These data were collected at 5 K with incident energies 28 and 160 meV; the presented figure was obtained by integrating the wave–vector transfer dependent data in the range 1–2 Å 1 . In this figure, the crystal field (CF) levels reported for Er 3 + in SrEr 2 O 4 [13] are marked with red arrows, whereas the levels reported for Yb 3 + in SrYb 2 O 4 are marked with blue arrows. This shows that below 28 meV, all the levels correspond to Er 3 + (Figure 4b), whereas, above 28 meV, all levels correspond to Yb 3 + (Figure 4a). The perfect one-to-one correspondence to the parent compounds CF levels suggest that, within the measured energy and temperature scale, there are no significant effects due to ion substitution.

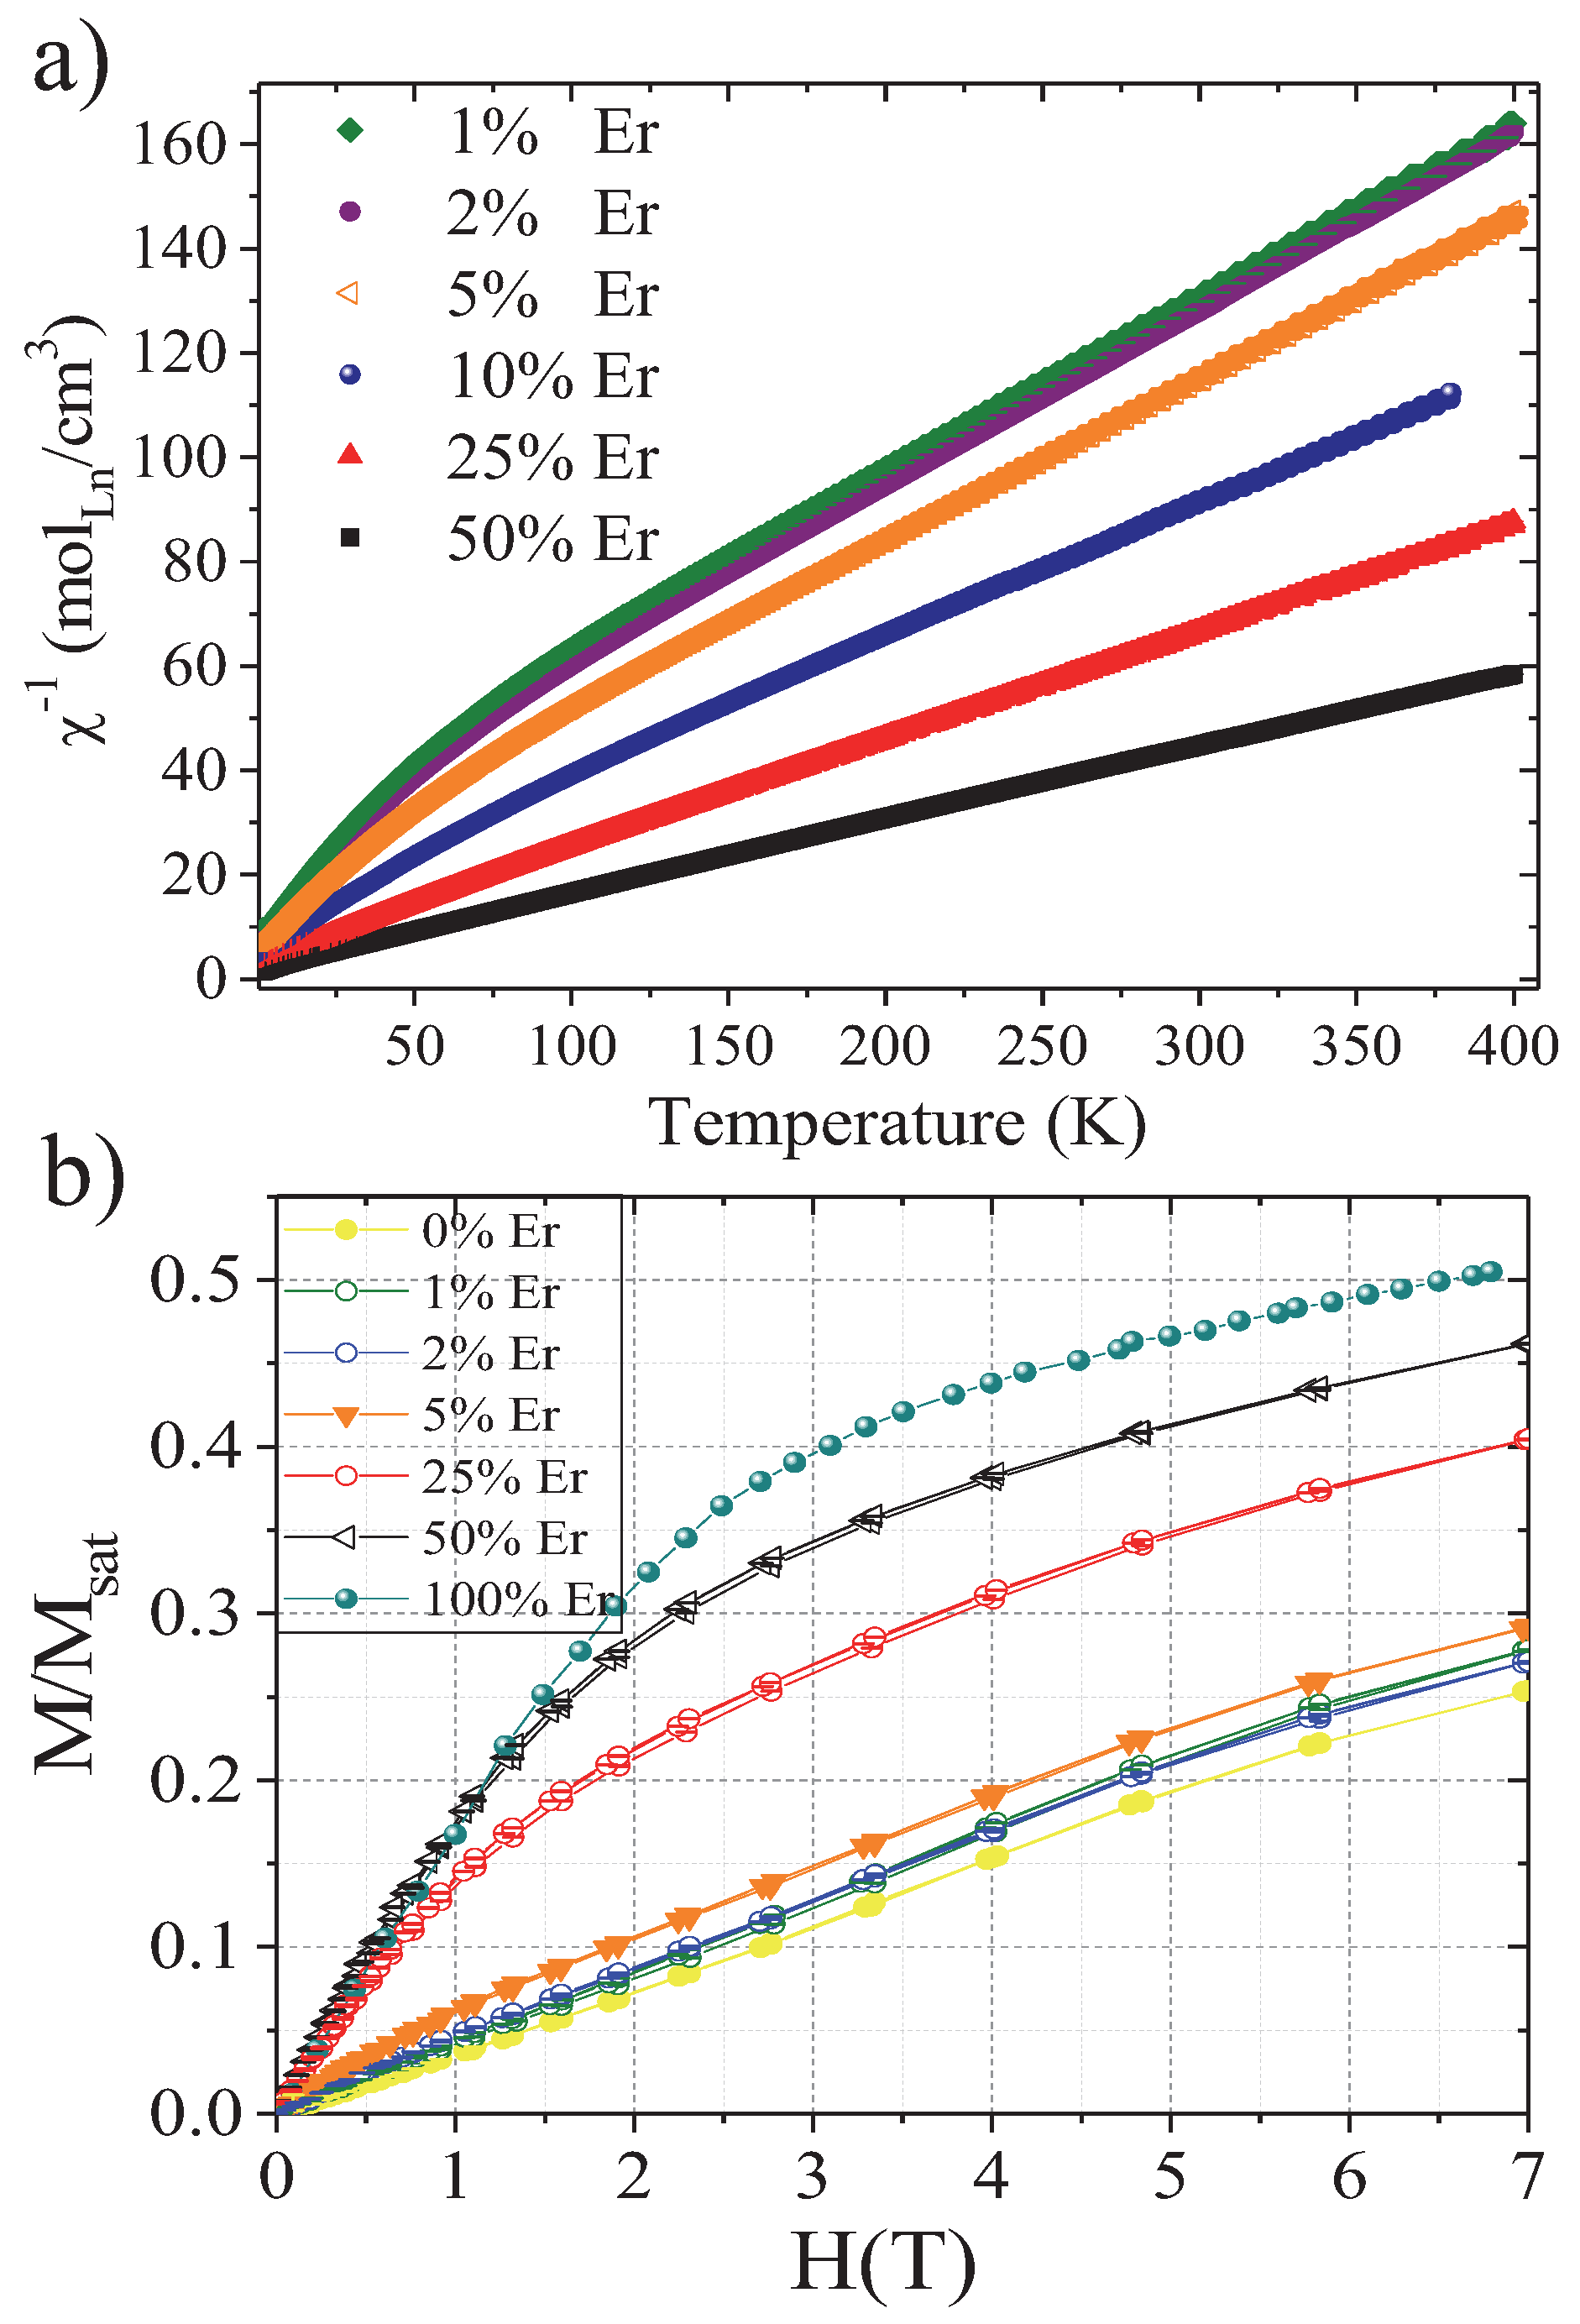
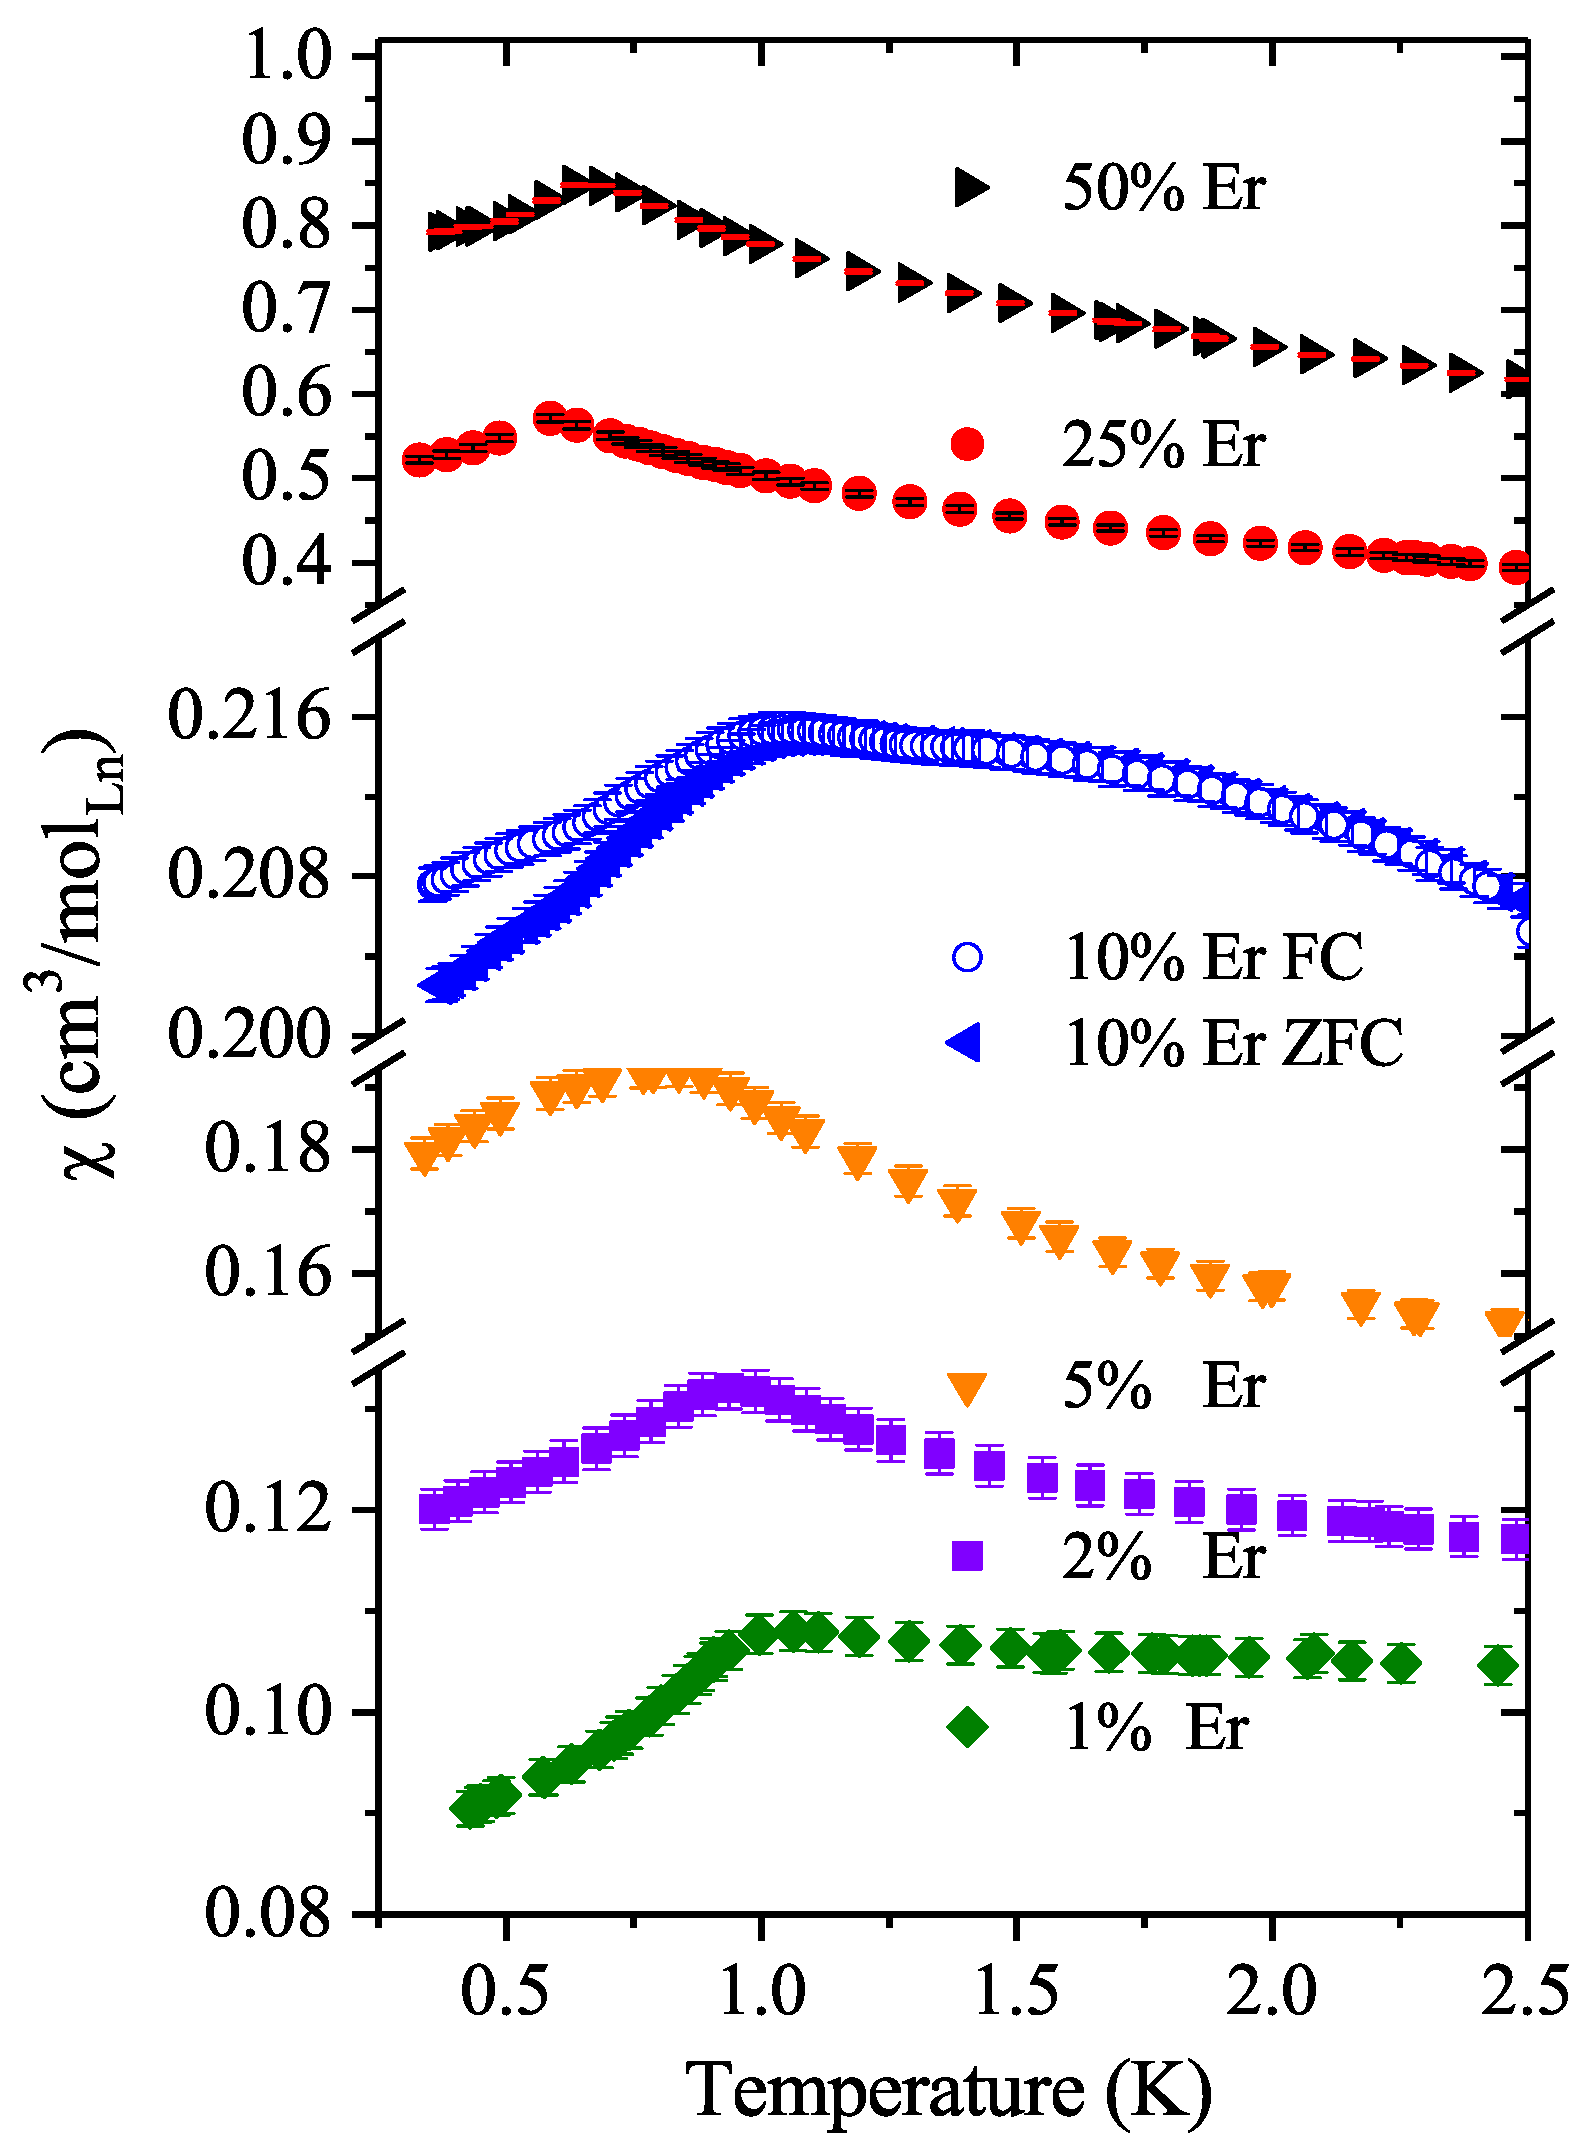
3.2.2. Magnetic Susceptibility and Magnetization

DC magnetic susceptibility has been measured for all samples in two temperature ranges, sub-kelvin regime, and 4 He regime up to 400 K. The high-temperature regime (see Figure 5a) shows a paramagnetic behaviour for all samples. No sign of magnetic transition is seen above 5 K for all samples, and all curves show a paramagnetic behaviour. The DC susceptibility as well as the magnetization measurements as a function of field (see Figure 5b) show that the magnetic moment of each sample increases as a function of the Er content. Such behavior is expected as Er 3 + ( 9.5 μ B ) has a bigger ionic moment than Yb 3 + ( 4.5 μ B ). Between 2 K and 5 K, there is a change in the DC-susceptibility slope for the 0%, 1%, and 2% of Er. This could be due to short-range magnetic correlations as it has been observed in SrYb 2 O 4 [14].
The Curie–Weiss temperatures were extracted from the susceptibility data for temperatures above 250 K; these values are shown in Figure 6. All values are negative, thus indicating the AFM nature of the magnetic interactions for all samples. The Curie–Weiss temperature is clearly reduced when the Er content is increased. However, it is important to notice that, at these temperatures, the susceptibility has contributions from thermally populated Yb CF levels (highest CF for Yb: 930 K and for Er:160 K), thus overestimating the strength of these interactions.
Figure 5b shows the magnetic moment for all samples as a function of the external magnetic field at 2 K. The moment has been normalized to the saturation moment expected for the total multiplet. All samples are far away from saturation in the measured field range, which is expected from the high-lying CF levels. There is no magnetic hysteresis detected at this temperature for any sample.
The low-temperature susceptibility data are shown in Figure 7. All samples present magnetic transition-like features below 1 K. Only the samples with 25 and 50 % of the Er content present sharp transitions. The features in the susceptibility curve of the samples with lower Er content are much broader, especially the one with Er 5 % . This transition could be linked to short-range correlations. All the measurements were collected at zero field cooled (ZFC) and field cooled (FC). A bifurcation between the ZFC and FC susceptibility is only visible for the Er 10% sample starting at 1 K. This behaviour could be linked to a formation of a spin frozen state. Additionally, this sample presents a change in the slope of the susceptibility at 0.55 K; this change could be linked to a lower phase transition due to a re-alignment of the Yb or Er spins.
A frustration factor has been calculated as the ratio between the Néel temperature and the Curie–Weiss temperature. This result is plotted in Figure 6. The magnetic frustration is calculated to be much higher for the sample with 5% Er to later decrease. The frustration factor decreases as a function of the Er content, which can be due to the average deviation from a perfect equilateral triangle within zigzag chain 1 for the samples with 25% and 50% and/or due to the CF-level contributions to the high-temperature susceptibility for the samples with higher Yb contents.

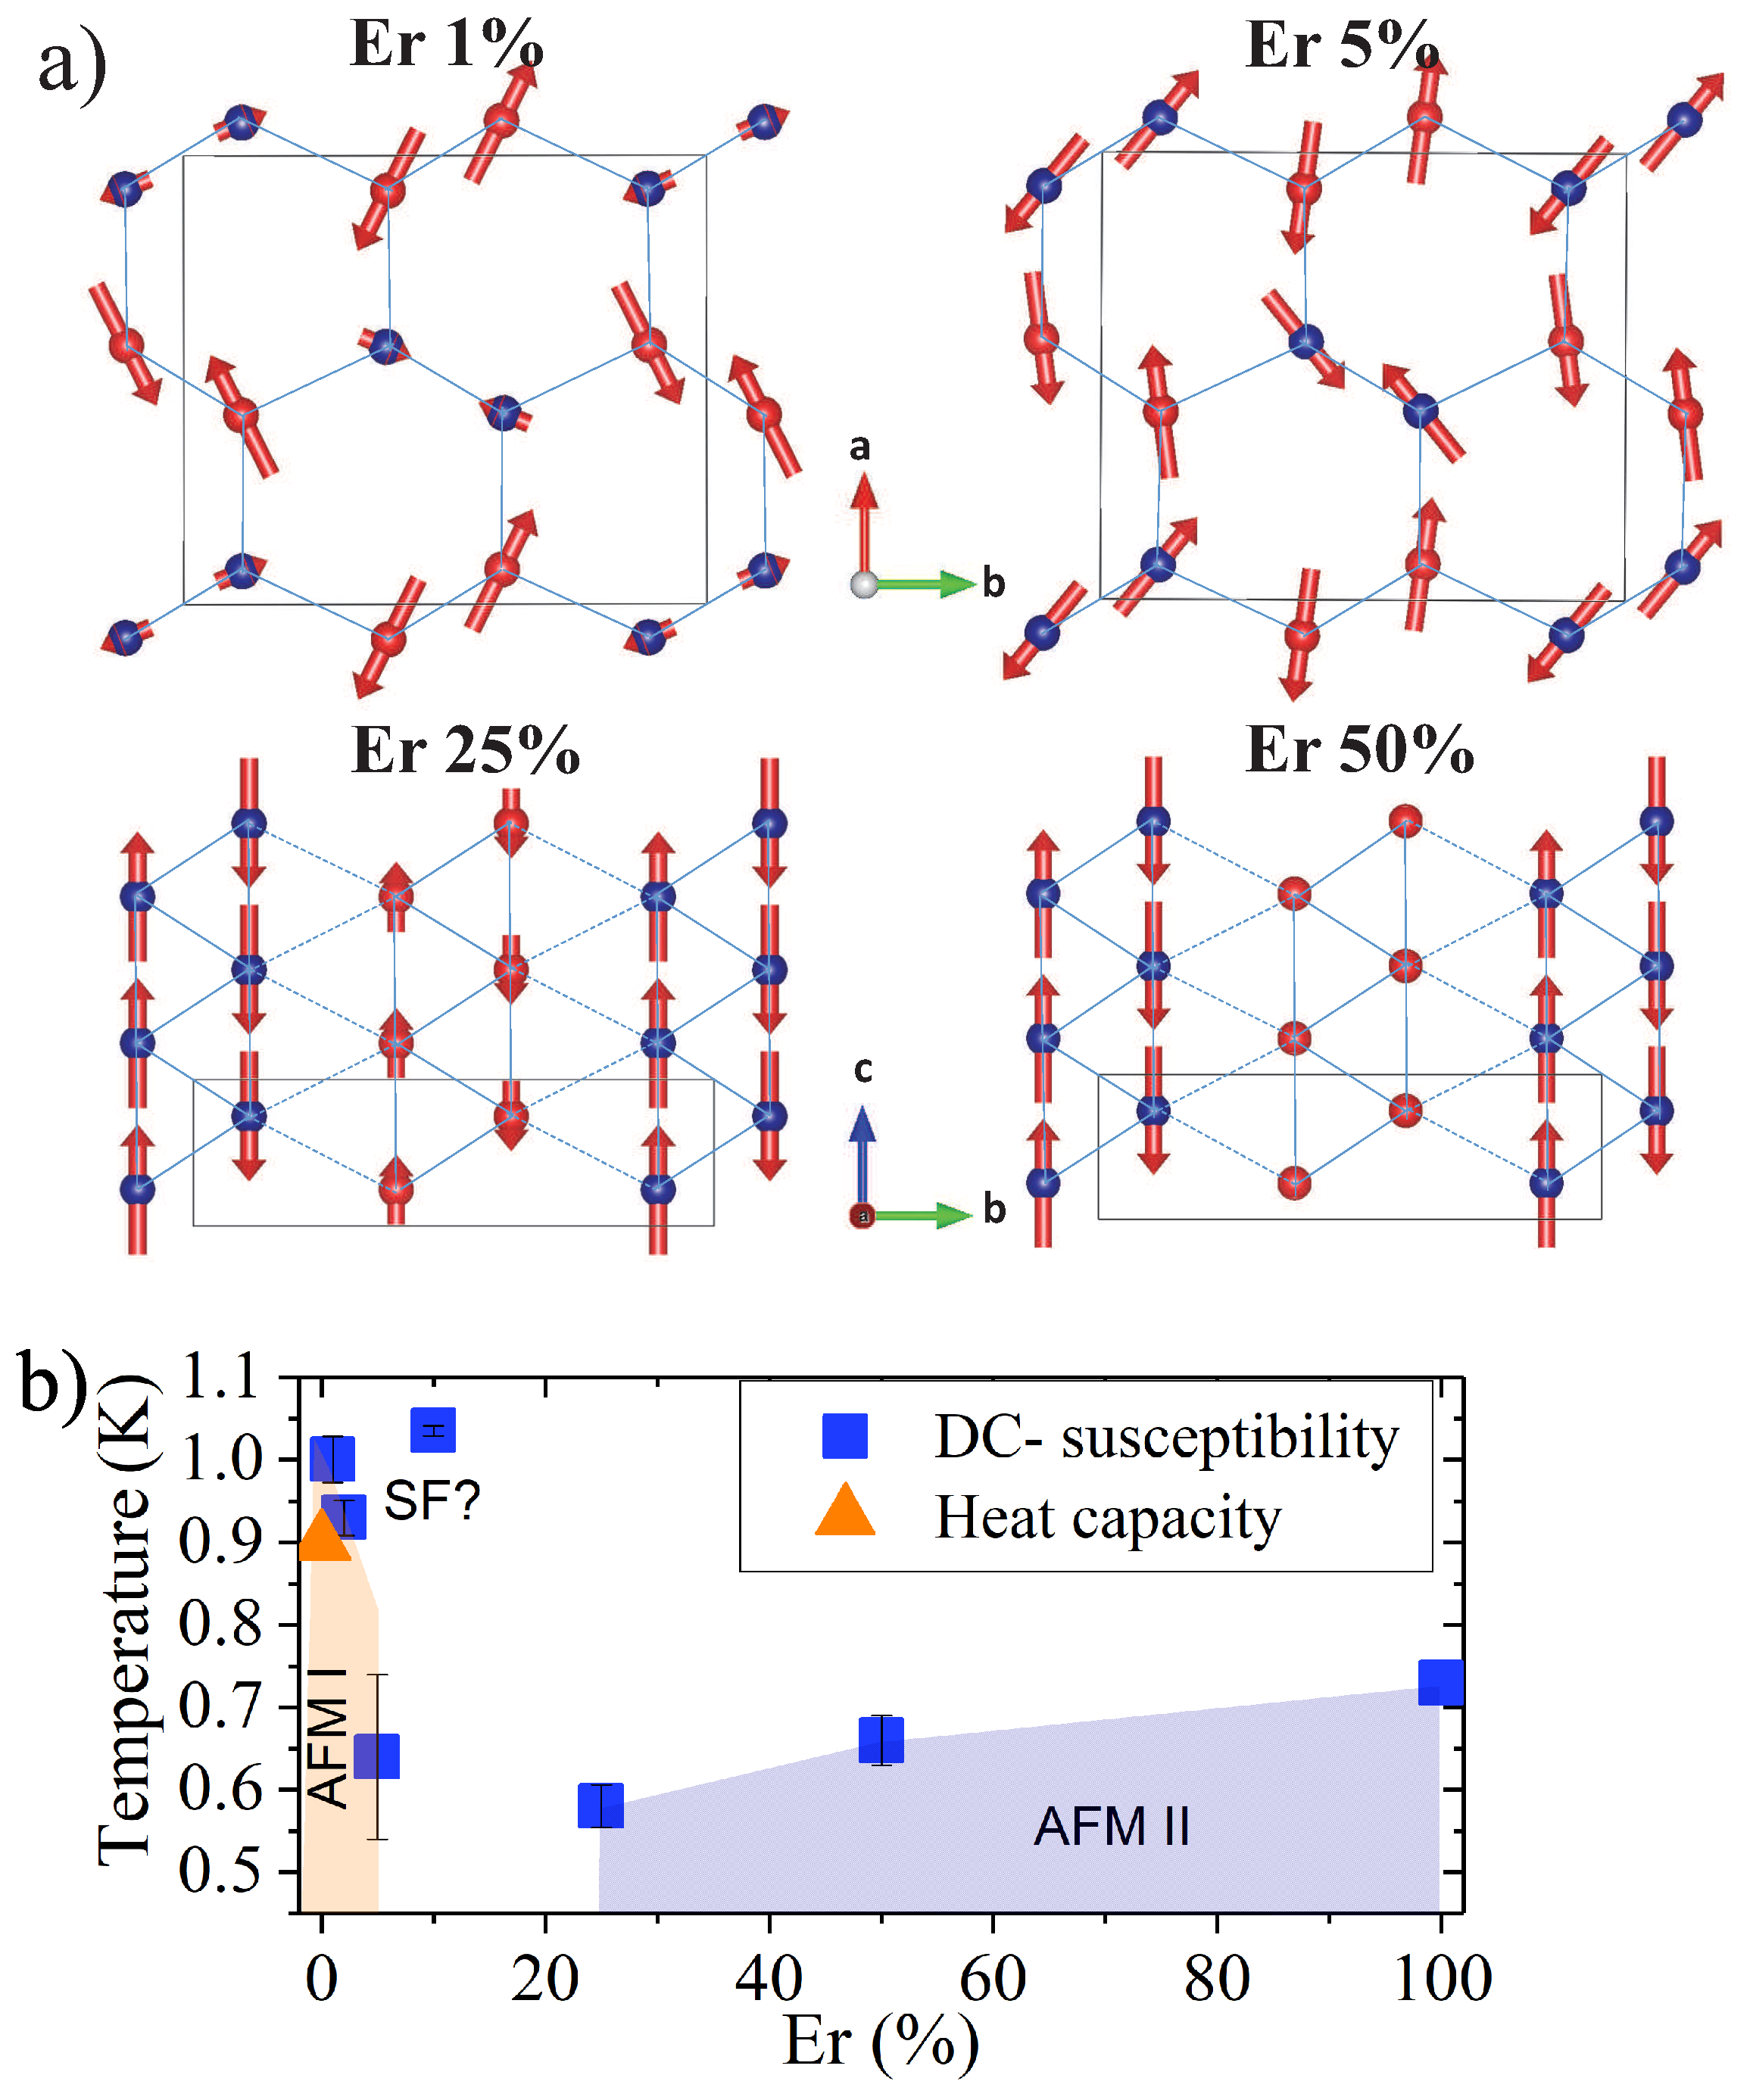
3.2.3. Magnetic Structure

Neutron powder diffraction patterns were collected for samples with 1 % , 5 % , 25 % , and 50 % Er content, at two temperatures, 40 mK and 10 K, on DMC. The data for other concentrations are not available. The high-temperature patterns (10 K) were used to subtract the nuclear component from the low-temperature patterns (40 mK). The resultant patterns correspond to the magnetic contribution to the scattering signal and were refined using FULLPROF [31]. Figure 8 shows all the magnetic components of all patterns for four samples of the series. The patterns have been shifted in the y-axis for better comparison. The patterns from the 1 % and 5 % samples are not that different from the pure Yb sample; however, the 25 % and 50 % samples are very different and closer to the structure of the pure Er sample.
The refinements of all patterns were produced assuming a magnetic propagation vector of k = [ 0 ,   0 ,   0 ] . There is only one peak that does not coincide with this propagation vector and it belongs to the 25 % sample at a d-spacing of: 4.86 Å ( 2 θ = 29.1 ). This wave vector corresponds to a non-commensurable position, but there are no additional magnetic peaks on the incommensurate positions. Therefore, we cannot draw the conclusion of a coexistent magnetic structure. For the refinement, we have used two different models, while, for the 1 % and 5 % , we have used the model reported for the pure Yb sample: with the two modes: A x and G y [14]. These correspond to relative orders of (+−+−)along the a-axis and (+−−+) along the b-axis for the four equivalent Yb 3 + / Er 3 + ions. The magnetic moments lie in the a b plane, and the two nonequivalent Yb 3 + / Er 3 + sites have different-sized ordered moments. The total ordered moment is significantly reduced in comparison to the total available moment for both ion concentrations. This magnetic structure is denoted here as AFM I. Table 2 lists all the refinement results for all studied samples.
For the samples with 25 % and 50 % Er content, the magnetic structure is very different, being represented best by the G Z mode. This was reported previously to describe the magnetic order in SrEr 2 O 4 [18]. It corresponds to the relative order (++−−). In this case, the moments have no component on the ab plane but only along the c-axis. The ordered magnetic moment for the two different positions is very different from each other. This model comes closer to the model for the pure Er sample, where only one of the two sites orders along the c-axis. This magnetic structure is denoted here as AFM II.
Four magnetic models are proposed for these four samples. These are sketched in Figure 9. Apart from the well-defined magnetic Bragg peaks, there is a diffuse component that strongly increases for the 25 % and 50 % samples. The expected flat background has been marked as horizontal lines in Figure 8; the intensity above the lines is magnetic in origin, with two components, short- and long-range magnetic order. This diffuse component has a maximum around the ( 1 ,   2 ,   0 ) and ( 2 ,   0 ,   0 ) and it indicates that there is an enhancement of the short-range magnetic correlations for these compounds. These positions are in agreement with [19], where diffuse scattering is seen near these Bragg peaks. However, due to the powder origin of the measured data, we cannot attribute the scattering to short-range stripes, as is the case for the Er [19], Dy [34], and Ho samples [11].
All main results, along with the Néel temperatures are summarized in the phase diagram shown in Figure 9b. There is a critical Yb/Er content linked to a phase transition between the two magnetic structures going through a possible intermediate spin frozen state. Higher values of Er concentration induced a realignment of all moments along the easy axis for Er1, due to its large moment.

4. Conclusions

We present a systematic study of the influence of Er-doping in the structural and magnetic properties of SrYb 2 O 4 . We find that the atomic structure remains the same for the whole doping range, while the lattice parameters increase linearly with the Er content as expected due to the different ionic sizes. This brings small changes in the interatomic distances. The largest distance change is within the zigzag chain 2, possibly indicating a release in the original geometric frustration, which is reflected in a reduction in the frustration factor for high Er concentrations. All the samples show some type of magnetic transition below 1 K. Er 1 % and Er 5 % order in a similar fashion to the SrYb 2 O 4 pristine sample, which is a non-collinear structure where the moments lie on the a b plane. The ordered moment of the Yb2/Er2 is smaller than the one for Yb1/Er1. The refined total magnetic moment is surprisingly reduced for these two concentrations, which is in contrast to the magnetization that indeed increases as a function of the Er content as is expected from the larger available ionic moment. It is also important to notice that the frustration factor peaks for those concentrations as it approaches the Er 10% concentration that appears as critical, thus showing a bifurcation between ZFC and FC susceptibility. The magnetic ordered structure is different for higher concentrations. A further detailed investigation of this particular concentration is needed. Single crystals of this concentration have been grown and diffraction work is being carried out. The samples with higher Er contents present a magnetic ordered structure similar to the pristine sample SrEr 2 O 4 . In the case of Er 25 % , both Yb/Er sites carry a moment, but this is much more reduced for Yb2/Er2. For Er 50 % , the magnetic ordered moment on Yb2/Er2 is zero, as is the case of SrEr 2 O 4 . This reduction in the moment for the Yb2/Er2 site can be linked to the increased magnetic diffuse scattering, suggesting that these compounds might present a co-existent short-range order. Further single-crystal diffuse scattering experiments will be necessary to validate the statement. Furthermore, it is noticed how the increased concentration of Er ions strengthens the ferromagnetic interactions for the Er1 chain. These are evident in the AFM II phase, where the spins choose FM alignments within the zigzag legs. This could be a reflection of both the frustration reduction and the effect of single-ion anisotropy, which favours the a b plane for Yb and the c-axis for the Er1 moments. Our INS results for the chosen Er 10 % sample show no changes in the CF schemes of these two ions, indicating a preservation of the single-ion anisotropy for at least this concentration. This result is in agreement with other studies that report little or no change in the CF levels schemes and single ion anisotropies in magnetic percolated systems or diluted magnets [35].

Author Contributions

Conceptualization: D.L.Q.-C. and R.T.-P., Investigation: J.H., D.L.Q.-C., M.J., M.F., A.F. and J.R.S. Formal analysis: D.L.Q.-C., J.H., A.B.K. and F.Y. Data curation: D.L.Q.-C. and J.H. Resources: J.H. and A.R. Supervision: D.L.Q.-C. Writing—original draft preparation: D.L.Q.-C. writing—review and editing: D.L.Q.-C., A.B.K. and R.T.-P. All authors have read and agreed to the published version of the manuscript.

Funding

This research received no external funding.

Data Availability Statement

Upon request or from Neutron/X-ray sources according to their data policies.

Acknowledgments

We would like to thank Helmholtz Zentrum Berlin for supporting Juanita Hincapie Bedoya during this project through the summer student program. This work is based on experiments performed at the Swiss spallation neutron source SINQ, Paul Scherrer Institute, Villigen, Switzerland, ISIS neutron and muon source, UK, and at the research reactor BER-II at the Helmholtz Zentrum Berlin, Germany. We thank Henrik M. Ronnow for kindly providing access to the Cryogenic SQUID magnetometer. We also thank Oleg Petrenko, Manh Duc Le, and Bella Lake for helpful discussions.

Conflicts of Interest

The authors declare no conflict of interest.

References

  1. Jensen, J.; Mackintosh, A. Rare Earth Magnetism; Clarendon Press Oxford: Oxford, UK, 1991. [Google Scholar]
  2. Sachdev, S. Spin glasses enter the quantum regime. Phys. World 1994, 7, 25. [Google Scholar] [CrossRef] [Green Version]
  3. Sandvik, A.W.; Vekić, M. Disorder Induced Phase Transition in a Two-Dimensional Random Quantum Antiferromagnet. Phys. Rev. Lett. 1995, 74, 1226–1229. [Google Scholar] [CrossRef] [Green Version]
  4. Gingras, M.J.P.; Henelius, P. Collective Phenomena in the LiHoxY1-xF4 Quantum Ising Magnet: Recent Progress and Open Questions. J. Phys. Conf. Ser. 2011, 320, 012001. [Google Scholar] [CrossRef] [Green Version]
  5. Biltmo, A.; Henelius, P. Unreachable glass transition in dilute dipolar magnet. Nat. Commun. 2012, 3, 857. [Google Scholar] [CrossRef] [PubMed] [Green Version]
  6. Stewart, J.R.; Hillier, A.D.; Hillier, J.M.; Cywinski, R. Structural and dynamical study of moment localization in β-Mn1-xInx. Phys. Rev. B 2010, 82, 144439. [Google Scholar] [CrossRef] [Green Version]
  7. Karunadasa, H.; Huang, Q.; Ueland, B.G.; Lynn, J.W.; Schiffer, P.; Regan, K.A.; Cava, R.J. Honeycombs of triangles and magnetic frustration in SrL2O4 (L = Gd, Dy, Ho, Er, Tm, and Yb). Phy. Rev. B 2005, 71, 144414. [Google Scholar] [CrossRef]
  8. Petrenko, O.A. Low-temperature magnetism in the honeycomb systems SrLn2O4 (Review Article). Low Temp. Phys. 2014, 40, 106–112. [Google Scholar] [CrossRef] [Green Version]
  9. Gauthier, N.; Fennell, A.; Prévost, B.; Uldry, A.C.; Delley, B.; Sibille, R.; Désilets-Benoit, A.; Dabkowska, H.A.; Nilsen, G.J.; Regnault, L.P.; et al. Absence of long-range order in the frustrated magnet SrDy2O4 due to trapped defects from a dimensionality crossover. Phys. Rev. B 2017, 95, 134430. [Google Scholar] [CrossRef] [Green Version]
  10. Wen, J.J.; Tian, W.; Garlea, V.O.; Koohpayeh, S.M.; McQueen, T.M.; Li, H.F.; Yan, J.Q.; Rodriguez-Rivera, J.A.; Vaknin, D.; Broholm, C.L. Disorder from order among anisotropic next-nearest-neighbor Ising spin chains in SrHo2O4. Phys. Rev. B 2015, 91, 054424. [Google Scholar] [CrossRef] [Green Version]
  11. Young, O.; Wildes, A.R.; Manuel, P.; Ouladdiaf, B.; Khalyavin, D.D.; Balakrishnan, G.; Petrenko, O.A. Highly frustrated magnetism in SrHo2O4: Coexistence of two types of short-range order. Phys. Rev. B 2013, 88, 024411. [Google Scholar] [CrossRef] [Green Version]
  12. Li, H.F.; Zhang, C.; Senyshyn, A.; Wildes, A.; Schmalzl, K.; Schmidt, W.; Boehm, M.; Ressouche, E.; Hou, B.; Meuffels, P.; et al. Incommensurate antiferromagnetic order in the manifoldly-frustrated SrTb2O4 with transition temperature up to 4.28 K. Front. Phys. 2014, 2, 42. [Google Scholar] [CrossRef] [Green Version]
  13. Malkin, B.Z.; Nikitin, S.I.; Mumdzhi, I.E.; Zverev, D.G.; Yusupov, R.V.; Gilmutdinov, I.F.; Batulin, R.; Gabbasov, B.F.; Kiiamov, A.G.; Adroja, D.T.; et al. Magnetic and spectral properties of the multisublattice oxides SrY2O4:Er3+ and SrEr2O4. Phys. Rev. B 2015, 92, 094415. [Google Scholar] [CrossRef] [Green Version]
  14. Quintero-Castro, D.L.; Lake, B.; Reehuis, M.; Niazi, A.; Ryll, H.; Islam, A.T.M.N.; Fennell, T.; Kimber, S.A.J.; Klemke, B.; Ollivier, J.; et al. Coexistence of long- and short-range magnetic order in the frustrated magnet SrYb2O4. Phys. Rev. B 2012, 86, 064203. [Google Scholar] [CrossRef] [Green Version]
  15. Fennell, A.; Pomjakushin, V.Y.; Uldry, A.; Delley, B.; Prévost, B.; Désilets-Benoit, A.; Bianchi, A.D.; Bewley, R.I.; Hansen, B.R.; Klimczuk, T.; et al. Evidence for SrHo2O4 and SrDy2O4 as model J1J2 zigzag chain materials. Phys. Rev. B 2014, 89, 224511. [Google Scholar] [CrossRef] [Green Version]
  16. Petrenko, O.A.; Young, O.; Brunt, D.; Balakrishnan, G.; Manuel, P.; Khalyavin, D.D.; Ritter, C. Evolution of spin correlations in SrDy2O4 in an applied magnetic field. Phys. Rev. B 2017, 95, 104442. [Google Scholar] [CrossRef] [Green Version]
  17. Momma, K.; Izumi, F. VESTA: A three-dimensional visualization system for electronic and structural analysis. J. Appl. Crystallogr. 2008, 41, 653–658. [Google Scholar] [CrossRef]
  18. Petrenko, O.A.; Balakrishnan, G.; Wilson, N.R.; deBrion, S.; Suard, E.; Chapon, L.C. Low-temperature magnetic ordering in SrEr2O4. Phy. Rev. B 2008, 78, 184410. [Google Scholar] [CrossRef] [Green Version]
  19. Hayes, T.J.; Balakrishnan, G.; Deen, P.P.; Manuel, P.; Chapon, L.C.; Petrenko, O.A. Coexistence of the long-range and short-range magnetic order components in SrEr2O4. Phys. Rev. B 2011, 84, 174435. [Google Scholar] [CrossRef] [Green Version]
  20. Rau, J.G.; Wu, L.S.; May, A.F.; Poudel, L.; Winn, B.; Garlea, V.O.; Huq, A.; Whitfield, P.; Taylor, A.E.; Lumsden, M.D.; et al. Anisotropic Exchange within Decoupled Tetrahedra in the Quantum Breathing Pyrochlore Ba3Yb2Zn5O11. Phys. Rev. Lett. 2016, 116, 257204. [Google Scholar] [CrossRef] [PubMed] [Green Version]
  21. Hallas, A.M.; Gaudet, J.; Butch, N.P.; Tachibana, M.; Freitas, R.S.; Luke, G.M.; Wiebe, C.R.; Gaulin, B.D. Universal dynamic magnetism in Yb pyrochlores with disparate ground states. Phys. Rev. B 2016, 93, 100403. [Google Scholar] [CrossRef] [Green Version]
  22. Rau, J.G.; Gingras, M.J.P. Frustration and anisotropic exchange in ytterbium magnets with edge-shared octahedra. Phys. Rev. B 2018, 98, 054408. [Google Scholar] [CrossRef] [Green Version]
  23. Hermele, M.; Fisher, M.P.A.; Balents, L. Pyrochlore photons: The U(1) spin liquid in a S=12 three-dimensional frustrated magnet. Phys. Rev. B 2004, 69, 064404. [Google Scholar] [CrossRef] [Green Version]
  24. Hester, G.; Nair, H.S.; Reeder, T.; Yahne, D.R.; DeLazzer, T.N.; Berges, L.; Ziat, D.; Quilliam, J.A.; Neilson, J.R.; Aczel, A.A. A Novel Strongly Spin-Orbit Coupled Quantum Dimer Magnet: Yb2Si2O7. arXiv 2018, arXiv:1810.13096. [Google Scholar] [CrossRef] [Green Version]
  25. Kittaka, S.; Sugiyama, T.; Shimura, Y.; Sakakibara, T.; Matsuda, S.; Ochiai, A. Singlet-triplet crossover in the two-dimensional dimer spin system YbAl3C3. J. Korean Phys. Soc. 2013, 62, 2088–2092. [Google Scholar] [CrossRef] [Green Version]
  26. Shen, Y.; Li, Y.D.; Wo, H.; Li, Y.; Shen, S.; Pan, B.; Wang, Q.; Walker, H.C.; Steffens, P.; Boehm, M.; et al. Evidence for a spinon Fermi surface in a triangular-lattice quantum-spin-liquid candidate. Nature 2016, 540, 559–562. [Google Scholar] [CrossRef] [Green Version]
  27. Balakrishnan, G.; Hayes, T.J.; Petrenko, O.A.; Paul, D.M. High quality single crystals of the SrR2O4 family of frustrated magnets. J. Phys. Condens. Matter 2008, 21, 012202. [Google Scholar] [CrossRef] [PubMed] [Green Version]
  28. Franz, A.; Hoser, A. E9: The Fine Resolution Powder Diffractometer (FIREPOD) at BER II. J. Large-Scale Res. Facil. 2017, 3, A103. [Google Scholar] [CrossRef] [Green Version]
  29. Fischer, P.; Keller, L.; Schefer, J.; Kohlbrecher, J. Neutron diffraction at SINQ. Neutron News 2000, 11, 19–21. [Google Scholar] [CrossRef]
  30. Ewings, R.A.; Stewart, J.R.; Perring, T.G.; Bewley, R.I.; Le, M.D.; Raspino, D.; Pooley, D.E.; Škoro, G.; Waller, S.P.; Zacek, D.; et al. Upgrade to the MAPS neutron time-of-flight chopper spectrometer. Rev. Sci. Instrum. 2019, 90, 035110. [Google Scholar] [CrossRef] [PubMed] [Green Version]
  31. Available online: http://www.ill.eu/sites/fullprof/index.html (accessed on 15 March 2023).
  32. Quintero-Castro, D.L. Neutron Scattering Investigations on 3d and 4f Frustrated Magnetic Insulators. PhD Thesis, Technical University of Berlin, Berlin, Germany, 2011. [Google Scholar]
  33. Bhat Kademane, A.; Quintero-Castro, D.; Siemensmeyer, K.; Salazar-Mejia, C.; Gorbunov, D.; Stewart, J.; Luetkens, H.; Baines, C.; Li, H. Crystal field effects in the zig-zag chain compound SrTm2O4. J. Magn. Magn. Mater. 2022, 551, 169020. [Google Scholar] [CrossRef]
  34. Gauthier, N.; Fennell, A.; Prévost, B.; Désilets-Benoit, A.; Dabkowska, H.A.; Zaharko, O.; Frontzek, M.; Sibille, R.; Bianchi, A.D.; Kenzelmann, M. Field dependence of the magnetic correlations of the frustrated magnet SrDy2O4. Phys. Rev. B 2017, 95, 184436. [Google Scholar] [CrossRef] [Green Version]
  35. Crystal electric fields in rare earth-Ba-Cu-oxide superconductors. J. Magn. Magn. Mater. 1988, 76–77, 607–608. [CrossRef]
Figure 1. Visualization of the atomic structure of SrLn 2 O 4 . Two different types of zigzag chains—red (chain 1-Yb1/Er1) and blue (chain 2-Yb2/Er2)—run along the c-axis, and oxygen atoms (in green) form different octahedra around Yb/Er ions. Sr ions (not shown) fill the columnar cavities. The drawings were generated using the software VESTA [17].
Crystals 13 00529 g001
Figure 2. Observed, calculated, and difference profiles from the Rietveld refinement of the FIREPOD data collected at room temperature for all samples. The calculated patterns (red lines) are compared with the observed ones (black dots). The blue line represents the difference between them and the green bars indicate the (h,k,l) positions.
Crystals 13 00529 g002
Figure 3. (a) Lattice parameters as a function of Er content extracted from the refinement of FIREPOD data (for Er 1 % , Er 2 % , Er 5 % , and Er 50 % ) at room temperature and DMC data (for Er 25 % ) at 10 K. Lattice parameters for Er 0 % and Er 100 % were from [7]. (b) Percentage of variation of interatomic distances as a function of Er content, extracted from the refinement of neutron powder diffraction patterns collected on FIREPOD data at room temperature.
Crystals 13 00529 g003
Figure 4. Powder INS spectra measured at 5 K with incident energies 160 meV (a) and 28 meV (b) in Er 10 % . Arrows correspond to CF energy levels reported for Er 3 + (red arrows) [13] and Yb 3 + (blue arrows) [32] ions in parent compounds SrEr 2 O 4 and SrYb 2 O 4 respectively.
Crystals 13 00529 g004
Figure 5. (a) DC inverse magnetic susceptibility as a function of temperature for an external magnetic field of H = 1 T for all powder samples. (b) Magnetic moment as a function of the external magnetic field at 2 K. Data for SrYb 2 O 4 and SrEr 2 O 4 are from [14] and [7], respectively.
Crystals 13 00529 g005
Figure 6. Curie–Weiss temperature and frustration factor as a function of Erbium content. Data for the SrYb 2 O 4 have been collected from [14] and, for SrEr 2 O 4 , have been collected from [18].
Crystals 13 00529 g006
Figure 7. Low-temperature DC-magnetic susceptibility as a function of temperature for all samples at 0.01 T.
Crystals 13 00529 g007
Figure 8. DMC powder pattern, low temperature (40 mK)–10 K data for four samples. The patterns have been shifted in intensity for comparison. The expected reflections for magnetic structures with k = [ 0 ,   0 ,   0 ] are marked in the figure as red lines. Straight horizontal lines are a guide for the eye referring to the expected flat background. The intensity above this line is magnetic in origin.
Crystals 13 00529 g008
Figure 9. (a) Proposed magnetic structures for Er 1 % , Er 5 % , Er 25 % , and Er 50 % samples. The red circles represent Yb1/Er1 ions and the blue circles represent Yb2/Er2. Magnetic moment directions and lengths are represented by red arrows. The drawings were generated using the software VESTA [17]. (b) Magnetic phase diagram as a function of temperature and Er content. The blue squares represent the estimated critical temperatures, obtained from the magnetic DC susceptibility analysis. The data point for Er 10 % indicates the bifurcation in the susceptibility, SF indicates the hypothesis of a spin–flip or spin glass state for this concentration. The triangle represents the Néel temperature extracted from heat capacity measurements for SrYb 2 O 4 [14]. Critical temperatures for SrEr 2 O 4 were extracted from [18].
Crystals 13 00529 g009
Table 1. Lattice parameters, occupations, and R-factors obtained from the refinement of the FIREPOD data (for Er 1 % , Er 2 % , Er 5 % , and Er 50 % ) at room temperature and DMC data (for Er 25 % ) at 10 K.
SrYb 2 x Er x O 4 a(Å)b(Å)c(Å) Occ Yb 1 (%) Occ Yb 2 (%) Occ Er 1 (%) Occ Er 2 (%)R
x = 1 % 9.9923 ( 2 ) 11.7758 ( 2 ) 3.358 ( 5 ) 99 ( 1 ) 99 ( 1 ) 0 ( 1 ) 1 ( 1 ) 3.56
x = 2 % 9.992 ( 3 ) 11.775 ( 3 ) 3.3586 ( 7 ) 102 ( 2 ) 93 ( 2 ) 2 ( 2 ) 7 ( 2 ) 3.43
x = 5 % 9.994 ( 2 ) 11.781 ( 3 ) 3.3600 ( 6 ) 87 ( 5 ) 96 ( 2 ) 12 ( 2 ) 4 ( 2 ) 3.66
x = 25 % 10.00 ( 1 ) 11.79 ( 1 ) 3.3648 ( 2 ) 75 ( 5 ) 70 ( 2 ) 25 ( 2 ) 29 ( 2 ) 5.61
x = 50 % 10.02 ( 2 ) 11.821 ( 3 ) 3.3734 ( 6 ) 55 ( 2 ) 49 ( 2 ) 44 ( 2 ) 50 ( 2 ) 2.96
Table 2. Moments along the different crystallographic directions for 1, 5, 25, and 50% samples. Obtained from the refinement of DMC results.
SrYb 2 O 4 [14] μ x μ y μ z
Yb1 3.37 ( 5 ) 1.9 ( 1 ) 0.00
Yb2 0.81 ( 5 ) 2.0 ( 1 ) 0.00
SrYb 2 x Er x O 4 , x = 1 % μ x μ y μ z
Yb1/Er1 1.2 ( 1 ) 0.6 ( 3 ) 0.00
Yb2/Er2 0.2 ( 1 ) 0.5 ( 3 ) 0.00
R m a g 17.94
SrYb 2 x Er x O 4 , x = 5 % μ x μ y μ z
Yb1/Er1 0.9 ( 3 ) 0.1 ( 3 ) 0.00
Yb2/Er2 0.6 ( 3 ) 0.5 ( 3 ) 0.00
R m a g 20
SrYb 2 x Er x O 4 , x = 25 % μ x μ y μ z
Yb1/Er1 0.00 0.00 0.3 ( 3 )
Yb2/Er2 0.00 0.00 0.6 ( 3 )
R m a g 22.42
SrYb 2 x Er x O 4 , x = 50 % μ x μ y μ z
Yb1/Er1 0.00 0.00 0.26 ( 5 )
Yb2/Er2 0.00 0.00 1.11 ( 5 )
R m a g 19.52
SrEr 2 O 4 [18] μ x μ y μ z
Er1 0.00 0.00 4.5
Er2 0.00 0.00 0.5
Disclaimer/Publisher’s Note: The statements, opinions and data contained in all publications are solely those of the individual author(s) and contributor(s) and not of MDPI and/or the editor(s). MDPI and/or the editor(s) disclaim responsibility for any injury to people or property resulting from any ideas, methods, instructions or products referred to in the content.

