Article

Mechanical, Electrical, and Glass Transition Behavior of Copper–PMMA Composites

by
Victor H. Poblete
1,* and
Mariela P. Alvarez
2
1
Departamento de Ciencias de la Construcción, Universidad Tecnológica Metropolitana, Dieciocho 390, Santiago 8330378, Chile
2
Société Générale de Surveillance (SGS), Canadá Inc., 6490 Vipond Drive, Mississauga, ON L5T1WB, Canada
*
Author to whom correspondence should be addressed.
Crystals 2023, 13(3), 368; https://doi.org/10.3390/cryst13030368
Submission received: 26 January 2023 / Revised: 12 February 2023 / Accepted: 16 February 2023 / Published: 21 February 2023

Abstract

:
The mechanical, electrical, and glass transition behaviors (Tg) of polymethylmethacrylate (PMMA)–metal systems have been studied. Considering both the particle size and the metal filler concentration, the electrical conductivity showed a clear dependence on the sample thickness to reach percolation. An increase of up to 400% of strain-to-failure for the 2% v/v of nanometric filler composites in the mechanical test was observed. Tg analysis showed a decrease in the glass transition temperature when the increase of nanometric metallic filler reached the limit of 2% v/v. Over this concentration, the Tg values showed a tendency to reach the original value of the polymeric matrix without conductive filler. For the 20% v/v micrometric filler composites, the strain-to-failure increased up to 58%, but in the Tg analysis of this composite, no relevant changes were observed when the micrometric metallic filler was increased.

1. Introduction

In the last decade, polymeric composites have been studied for the optimization of the intrinsic properties of their individual constituents to obtain special properties for both different and specific applications of these composites. The filler addition into the polymeric matrix causes important changes in the behavior of the mechanical properties [1,2,3], thermal properties [3,4,5], and electrical properties [6,7] of the composites. The electrically conducting composites possess various advantages when they are compared with their pure metallic counterpart: low cost, simple production, low weight, capacity to absorb the mechanical impact, resistance, and the feasibility of adjusting the electrical conductivity as a function of the filler concentration [8,9,10]. On the other hand, this type of material has been extensively used in the production of devices for applications such as electromagnetic interference, overcurrent protection, chemical-detecting sensors, and surge protection [10,11]. In addition, relevant investigations have been observed in biomedical applications and LCE actuators [12,13,14].
The filler’s aggregation into a polymer matrix can bring an important effect on the behavior of the resulting material, especially on its mechanical and electrical properties. The electrical resistivity of such a composite depends critically on the volume fraction of the conducting filler particles. This behavior has been well-explained by the percolation theory [15,16]. The mechanical properties of a polymeric composite cannot be generalized because different behaviors have been observed by different authors. Ali Gungor [17] reported a descent in the yield strength, tensile strength, % elongation, Izod impact, and an increment of Young’s modulus and hardness with the addition of iron powders (Fe) into a high-density polyethylene (HDPE) matrix. Ash et al. reported an increase of 600% in the strain-to-failure for a critical concentration of polymethylmethacrylate filled with alumina nanoparticles (Al2O3) [18], while Levita et al. reported an increase of 15% in the fracture toughness for a polypropylene matrix (PP) filled with calcium carbonate powder (CaCO3) of 0.07 mm [19]. The magnitude of these changes depends on both the concentration and the parameters of the filler, the superficial area of the filler being an important parameter for the reinforcement. On the other hand, Özkan et al. reported relevant results regarding the physical and mechanical properties of polypropylene (PP) and Fe-PP composites; however, in this investigation, no results of electrical properties such as conductivity or percolation thresholds were reported [20].
Bartczak et al. reported a strong dependence on particle size in the system CaCO3/HDPE. The fragile behavior observed for the filled composites with large particles can be explained by of the existence of a critical interparticle distance in the system [21].
In recent years, the fiber insertion of metallic spheres of micrometric size into polymer matrices has reached conductivities of practical use [2,6,22,23,24]; nevertheless, the fragility of the polymeric composite increases drastically, and the central problem persists: the homogeneity, the critical concentration of metallic particles, and the morphology are insufficient to obtain acceptable both mechanical and electrical properties.
One benchmark commonly used to compare the thermal behavior of composites is the glass transition temperature (Tg). Different behaviors of this parameter as a function of the filler content have been reported by various authors. Some researchers reported an increase in the Tg as a function of filler concentration [25,26]; however, decreases in this parameter have also been reported [5,27]. The interaction between polymer chains and the surface of the particles can create changes in the kinetics of the chains surrounding the particles of the filler due to the presence of the interface. This change is more significant when the filler is of nanometric size because it has a very high superficial area. Even a well-dispersed system with a low filler concentration originates a great interfacial area for which the properties of the resultant material are hardly altered [28]. Through this union, the polymer restricts the mobility of the chains that have been affected, modifying both the structure and the orientation of the chains that surround the surface of the filler particle [29].
In this paper, copper powder-reinforced polymethylmethacrylate polymer matrix composites with various copper volume fractions were prepared through hot press molding, and we report on the electrical, mechanical, and thermal properties of the resulting materials. Our strategy is to achieve high electrical conductivity at a low percolation threshold and acceptable mechanical properties not reported in the literature for copper–PMMA composites. Our efforts focus on the comparative study of these parameters through the use of micrometer-sized and nanometer-sized copper particles.

2. Experimental

The composite was prepared by using the hot press molding method under a nitrogen atmosphere. In this way, a polymethylmethacrylate matrix (PMMA, Goodfellow, 600 μm, ME306010) and a copper powder was used as the conductive filler, considering micrometric (3.25–4.75 μm, Alpha Aesar, #42455) and nanometric size (78 nm, Nanostructured & Amorphous Materials, #0293WF). The conductive filler content varied in the range of 0 to 35% v/v. All the samples were homogenized using a SPEX/MIXER 81,057 at 1400 rpm for 15 min. The homogenized mixtures were compacted in a mold at a pressure of 40 MPa and 400 °C under a nitrogen atmosphere for 15 min [30].
To verify that the PMMA matrix did not present changes in its molecular weight as a consequence of the used high temperature, a molecular weight analysis using viscosimetric measurements was carried out. The measurements of relative viscosity of diluted solutions of PMMA were made using an Ubbelohde viscosimeter with an inner capillary diameter of 6 mm. The work temperature was 25 ± 0.01 °C. Acetone (Merck p.a, #822251) was utilized as a solvent, considering a flow time = 116.6 s. The flow time readings were carried out by means of a chronometer (error = ± 0.1 s), with 5 times for each concentration, to obtain an average value. With the obtained data, the value of the lineal coefficient correlation, the coefficient of decision, and the equation of the straight quadratic minimum were obtained for η sp/C = f (C), where [η] = intercept. To calculate the molar viscosimetric mass, the Mark–Houwink–Sakudara equation was utilized, where K = 7.5 × 10⁻⁵ and a = 0.7 for the polymethylmethacrylate matrix [31].
The current composite density was measured using a standard test that measures the density of plastic by water displacement (ASTM D792) [32]. The comparative measures related to the theoretical formulation density were calculated according to Equation (1), which uses the density values of the individual constituents and the weight percentage of each constituent.
ρ c = 1 i = 1 n w i ρ i
where ρc = density of the composite, wi = weight fraction of the constituent material, and ρi = density of the constituent material. The microstructure was investigated by means of a scanning electron microscope (SEM) with a JEOL 5600 LV SEM.
The first electrical resistivity test was designed to measure longitudinal volume resistivity or in-plane volume resistivity. This test was used for all samples with conductivity greater than 10−4 S/cm. Test specimens cut from the center gauge portion of a tensile bar were surface ground and then cut into sticks 2 mm wide by 2 mm thick by 25.4 mm long using a water jet cutter. For each formulation, a total of six specimens were cut from a single tensile bar, and three bars were used to obtain a minimum of eighteen test specimens.
These samples were then tested using a four-probe technique. A Keithley 224 Programmable Current Source and Keithley 182 Digital Sensitive Voltmeter were used. For samples with conductivity of less than 10−4 S/cm, it was necessary to run the transverse volume resistivity test and the through-plane, volume resistivity test.. In this method, a constant voltage of 10 V was applied to an as-molded test specimen and the resistivity was measured according to ASTM D257 [33] using a Keithley 6517 A Electrometer/High Resistance Meter and 8009 Resistivity Test Fixture.
The mechanical behavior analysis of composites was carried out by mean uniaxial tension testing in accordance with ASTM D638–86 at strain rates of 1 mm/min at about 23 °C. At least five samples of each concentration were tested. The above-mentioned samples were ASTM Type I.
Dynamic mechanical thermal analysis (DMTA) was carried out on a Rheometric Scientific DMTA V using single cantilever bending mode at 1 Hz with 0.1% strain. Temperature ramps from 15 °C to 200 °C were conducted at 2 °C min−1 to determine the Tg of the composites. To determine the glass transition temperature (Tg) of these materials, a thermomechanical analizer (TMA) was used.The analysis was carried out using a TMA/SDTA 840 with a penetration probe. The range of temperature used was from 30–180 °C with a heating rate of 2 °C/min in a flow of nitrogen of 20 mL/min.

3. Results and Discussion

Initial analysis about the degradation of the PMMA matrix under the experimental conditions of this study, Table 1, demonstrates that these conditions do not cause the degradation of the polymeric matrix. The molecular weight of the polymer sample obtained before the molding process was very close to that observed from the sample after the molding process for 15 min at 400 °C. The above statement allows researchers to rule out a possible degradation of the polymeric matrix due to the high temperature used, hence creating the possibility of using this synthesis route with ranges of acceptable reproduction.
The results corresponding to the density analysis of the composites are shown in Table 2. They are recorded as residual density between the real density and the theoretical density as a function of the volumetric concentration of conductive filler. In all cases, a difference in the values of density of approximately 2% regarding the theoretical value is appreciated, this being a very small difference. The residual values are in the range of −0.0025 g/cm3 to 0.0356 g/cm3. The close agreement found between the values of theoretical and real density seemed to guarantee replication in the preparation of each one of the conductive polymeric composites.
The result analysis carried out to study the electrical behavior of the composites are presented in Figure 1 and Figure 2. Figure 1 shows the percolation curve (Log (σ) vs. % v/v of Cu) for different thickness sample composites of PMMA–Cu (3.25–4.75 μm). The variation of the critical volumetric concentration was observed (fC) as a function of the thickness sample. While the thickest samples (2.0 mm) appeared to percolate at ~10 % v/v, the thinnest samples (0.5 mm) required more filler to reach percolation. The conductivity values were approximately 1.5 × 10⁻⁶ S/m for t = 2.0 mm for concentrations close to the percolation threshold (10 % v/v) in the PMMA–Cu (3.25–4.75 μm) composites (Figure 1). In addition, 5 × 10⁻¹² S/m was observed for t = 0.5 mm. This effect was much less pronounced for the PMMA–nanometric copper particles (78 nm) composites shown in Figure 2. In this picture, the thickness of the analyzed samples produces small variations in conductivity values. For the concentrations close to the percolation threshold (10 % v/v), the values of conductivity were 1.5 × 10⁻¹¹ S/m for t = 2.0 mm and 2 × 10⁻¹³ S/m for t = 0.5 mm. Additionally, figures N°1 and N°2 show that the increase in thickness of each sample produces an increase in its volumes, and therefore a greater number of contacts between metallic particles is generated, increasing the electrical conductivity of the composites. Table 3 shows a summary of the critical volumetric concentration for both composite types. According to the obtained results, we can point out that when the average size of filler particle (d) diminishes in relation to the thickness of sample (t), the limitations imposed by the geometry of the composites are less severe. In the percolation site, the probability of generating a percolation path is always greater for a particle immersed within the composite than for a particle located on the surface, because a larger number of new possible pathways exist (larger number of adjacent sites). As the t/d ratio becomes smaller, a higher percentage of particles occupy positions closer than the surface of the composite. Similar results have been obtained by Ruschau in the system conformed by silica filled with silver particles [34].
The microstructural analyses of the conductive polymeric composites performed on cross-section micrographs for each one of the samples were observed by SEM. For the samples with 2% v/v of copper content (Figure 3a,c), an individual number of particles can be distinguished, which cannot be observed in the samples with a 30% v/v copper content (Figure 3b,d).
Here, particle conglomerations could be seen. In samples with 30% v/v metallic copper particles, they formed a cluster that seemed to connect, and in this way, the particles conduct the electric current through a conductivity path due to the presence of a greater percentage of electrons capable of flowing through the sample. The percolation theory [35] assumes that if a site is occupied by a metal particle, the resistance per unit area at that site is equal to the diameter of the particle divided by its conductivity. In cases where the site is not occupied by the metal particle, the resistance is infinite. Thus, it can be assumed that the conductivity through the polymer is zero. Figure 4 and Figure 5 show the morphology of the composites for different concentrations of the metallic filler, both nanometric and micrometric. At low concentrations, polymers with aggregated small particles exhibited conductivity even though the particles were not in contact with each other. According to percolation theory, these results can be explained based on a conduction mechanism called carrier tunneling. In this mechanism, electrons tunnel through the nanometer-sized insulating regions of the polymer that separate the filler particles. On the other hand, when the concentration of metal filler increases above a critical level (Figure N°1 and N°2), then the conductivity depends fundamentally on the number of contacts between copper particles. Similar observations have been obtained by other authors [3,6,9]. The results previously described suggest that the benefits of a favorable segregated geometry can be obtained using the method of heated compression molding [21]. The dispersed formation of a segregated filler structure in the polymer matrix can be achieved by pressing the mixture of thermoplastic powder and the polymer matrix, having a mean particle size D, and the conductive filler having particle size d, provided that D >> d. Similar results were obtained by Mamunya [7].
Figure 6 and Figure 7 show the results of the uniaxial strength testing corresponding to the PMMA–Cu (78 nm) and PMMA–Cu (3.25–4.75 μm) composites, respectively.
Table 4 shows the most prominent mechanical data obtained from the composites prepared by means of different particle sizes. For the composites with 78 nm copper particles, it is observed that at a higher concentration of the metallic filler, the ultimate strength increases from 55.25 MPa (1% v/v) to 69.60 MPa (20% v/v), while for the composites with 3.25–4.75 µm copper particles, the ultimate strength decreases from 55.20 MPa to 12.15 MPa When the concentration of the metal filler is increased.
At higher filler concentrations, composites with micrometer copper particles become brittle with reduced tensile strength and an elastic modulus due to metal–polymer interface effects. The diffusion coefficients of the filler metal could presumably affect the strain values of the polymeric matrix. Then, for the composites with micrometer copper particles, the critical concentration of metal filler and the morphology are insufficient to obtain acceptable both mechanical and electrical properties.
However, the reduction in the volume fraction of the metal filler in the polymer matrix is a dramatic improvement in the mechanical properties of the nanocomposite, as shown in Figure 6, for volumetric concentrations of 1% v/v and 2% v/v.
In Figure 6 and Figure 7, due to 78 nm copper particles infiltration, a clear difference can be observed when they are compared with micrometric-size particles. In the composite conformed by nanometric-sized copper particles (Figure 6), the addition of up to 2% v/v of metallic filler originates a significant increase of the strain-to-failure percentage. For composites with 2% v/v nano copper filler, this increase reaches approximately 450% whit respect to the values obtained for PMMA without metal filler.
Ash et al. observed similar behavior in the system nano-alumina-filled PMMA composites [18]. Finally, in regard to the increase in strain-to-failure, a neck is observed that coincides with a drop in engineering stress at the maximum strain value increasing strain-to-failure. This decrease reaches 26% with regard to the unfilled PMMA for 2% v/v of the nano-copper particles. Figure 7 shows the uniaxial tension testing applied to the 3.25–4.75 μm copper particle-filled PMMA composites. A drastic change in the mechanical behavior due to the growing introduction of copper metallic particles within the polymeric matrix must be emphasized. The addition of 1% v/v of Cu produced a decrease of 27% in the yield stress and of 18% in strain-to-failure, with regard to mechanical tests for the unfilled polymer. This decrease reached 84% in the yield stress and 58% in strain-to-failure when the concentration of metallic particles reached 20% v/v. The change observed in Young’s modulus as a function of the metallic filler concentration is shown in Figure 8. A significant reduction in the module with the addition of small amounts of nanometric copper is observed and a gradual increase as more nanometric filler is added. For the case of the micrometric copper-filled composites, a significant descent is observed in module values with the growing addition of copper particles (3.25–4.75 μm). This decrease reached 76% for 20% v/v of metallic filler, in relation with the value obtained for the unfilled PMMA (32 MPa). The analysis of the mechanical parameters carried out previously indicates that the infiltration of metallic particles of nanometric size has an important effect on the mechanical properties, achieving a change in the yield behavior of the material, compared with the effect taken place by the metallic particles of micrometric size. The facts mentioned above agree with results reported by other authors [1,36,37,38,39]. This behavior could be due to the small size of the nanometric particles related with the great surrounding polymeric area. This extensive superficial area, from the theoretical point of view, plays an important role in composite properties due to the greater quantity of the surrounding polymer altering its stress state [39,40,41]. In spite of the abovementioned, the strain-to-failure behavior observed in the PMMA–Cu composites is very unusual but is in accordance with the observations of Ash et al. in the PMMA/alumina system [18]. In PMMA at strain rate of 1 mm/min and room temperature testing, the primary mode of failure is by crazing, which leads to a brittle failure [42,43,44]. By means of scanning electron microscopy, Ash et al. [18] showed that the failure surface morphology of unfilled PMMA was produced by crack formation and growth. However, when observing the stress–strain curve obtained for the composites, they did not seem to follow similar behavior (Figure 6). The observed ductility in nanometric-filled PMMA–Cu composites indicates that the method of yielding of the material has been altered. A brittle-to-ductile transition is obtained for nanometric filler from 1% v/v. On the other hand, a critical concentration is observed (2% v/v) where the mechanical properties described previously can reach a maximum. This has also been observed in other nanocomposites [36,45,46]. The brittle-to-ductile transition of a polymer such as the PMMA can be obtained with low strain rates in uniaxial tension [47]. From the abovementioned, it can be inferred that the brittle-to-ductile transition can occur if the stress state in the polymer changes in such a way that the shear yielding criterion is reached prior to the formation of crazes. That is, homogeneous yielding by shear vs. heterogeneous yielding by crazing [37]. In this way, ductility is thus gained by the delocalization of yielded material and suppression of crazes that could lead to void formation and subsequent brittle behavior [29,48,49,50,51]. According to the results presented and discussed previously, it can be inferred that a transformation from craze formation to homogeneous shear yielding occurs in the Cu/PMMA composites when nanoparticles are added to the polymer in a sufficient volume fraction (~2% v/v). Around the particles dispersed within the polymeric matrix, polymer chains will exist surrounding the surface of the filler particles. If the polymer chains have a strong affinity for the particle surface, these chains lose some of their mobility and a region of low mobility polymer will exist around each particle [52]. This zone of affected polymer has been estimated to be somewhere between 2 and 9 nm thick [26]. However, the decreased chain mobility within the interaction zone may not always reinforce a polymer. Kendall et al. found that the tear strengths of nano-filled polypropylene decreased as a function of filler content [53]. In nanocomposite systems, a bigger quantity of polymeric mobility exists in comparison with systems that include micrometric particles, which implies a greater amount of free surface within the composite. This fact is reaffirmed when analyzing the behavior obtained for the glass transition temperature in the Cu (78 nm)/PMMA system, shown in Figure 9 (Table 5). The unexpected increase of Young’s modulus for concentrations over 2% v/v in the Cu (78 nm)/PMMA system occurs as a consequence of the increase in the glass transition temperature (Tg). For nanometric filler concentrations over 2% v/v or the utilization of micrometric particles, the values of Tg are maintained close to the unfilled PMMA matrix, increasing the premature brittle failure. In the Tg analysis of micrometric composites, no relevant changes are observed when the micrometric metallic filler is increased (Table 5). So, this free surface apparently exists at the surfaces of the nanoparticles, acting in essence as a void. Testing in uniaxial tension causes these voids to expand, relieving any localized build-ups of hydrostatic stress in the PMMA matrix. Therefore, void formation that would lead to crazing is prevented, and shear yielding of the matrix is favored as the primary yield mechanism. In addition to matrix yielding, void growth would also consume considerable amounts of energy and could lead to macroscopic yield behavior. However, agglomerations of nanoparticles (% v/v > 2) or the use of micrometric-size particles can act as crack initiators that will lead to premature brittle failure, thus lowering the occurrence of ductile behavior observed in low concentrations of metallic nanoparticles.

4. Conclusions

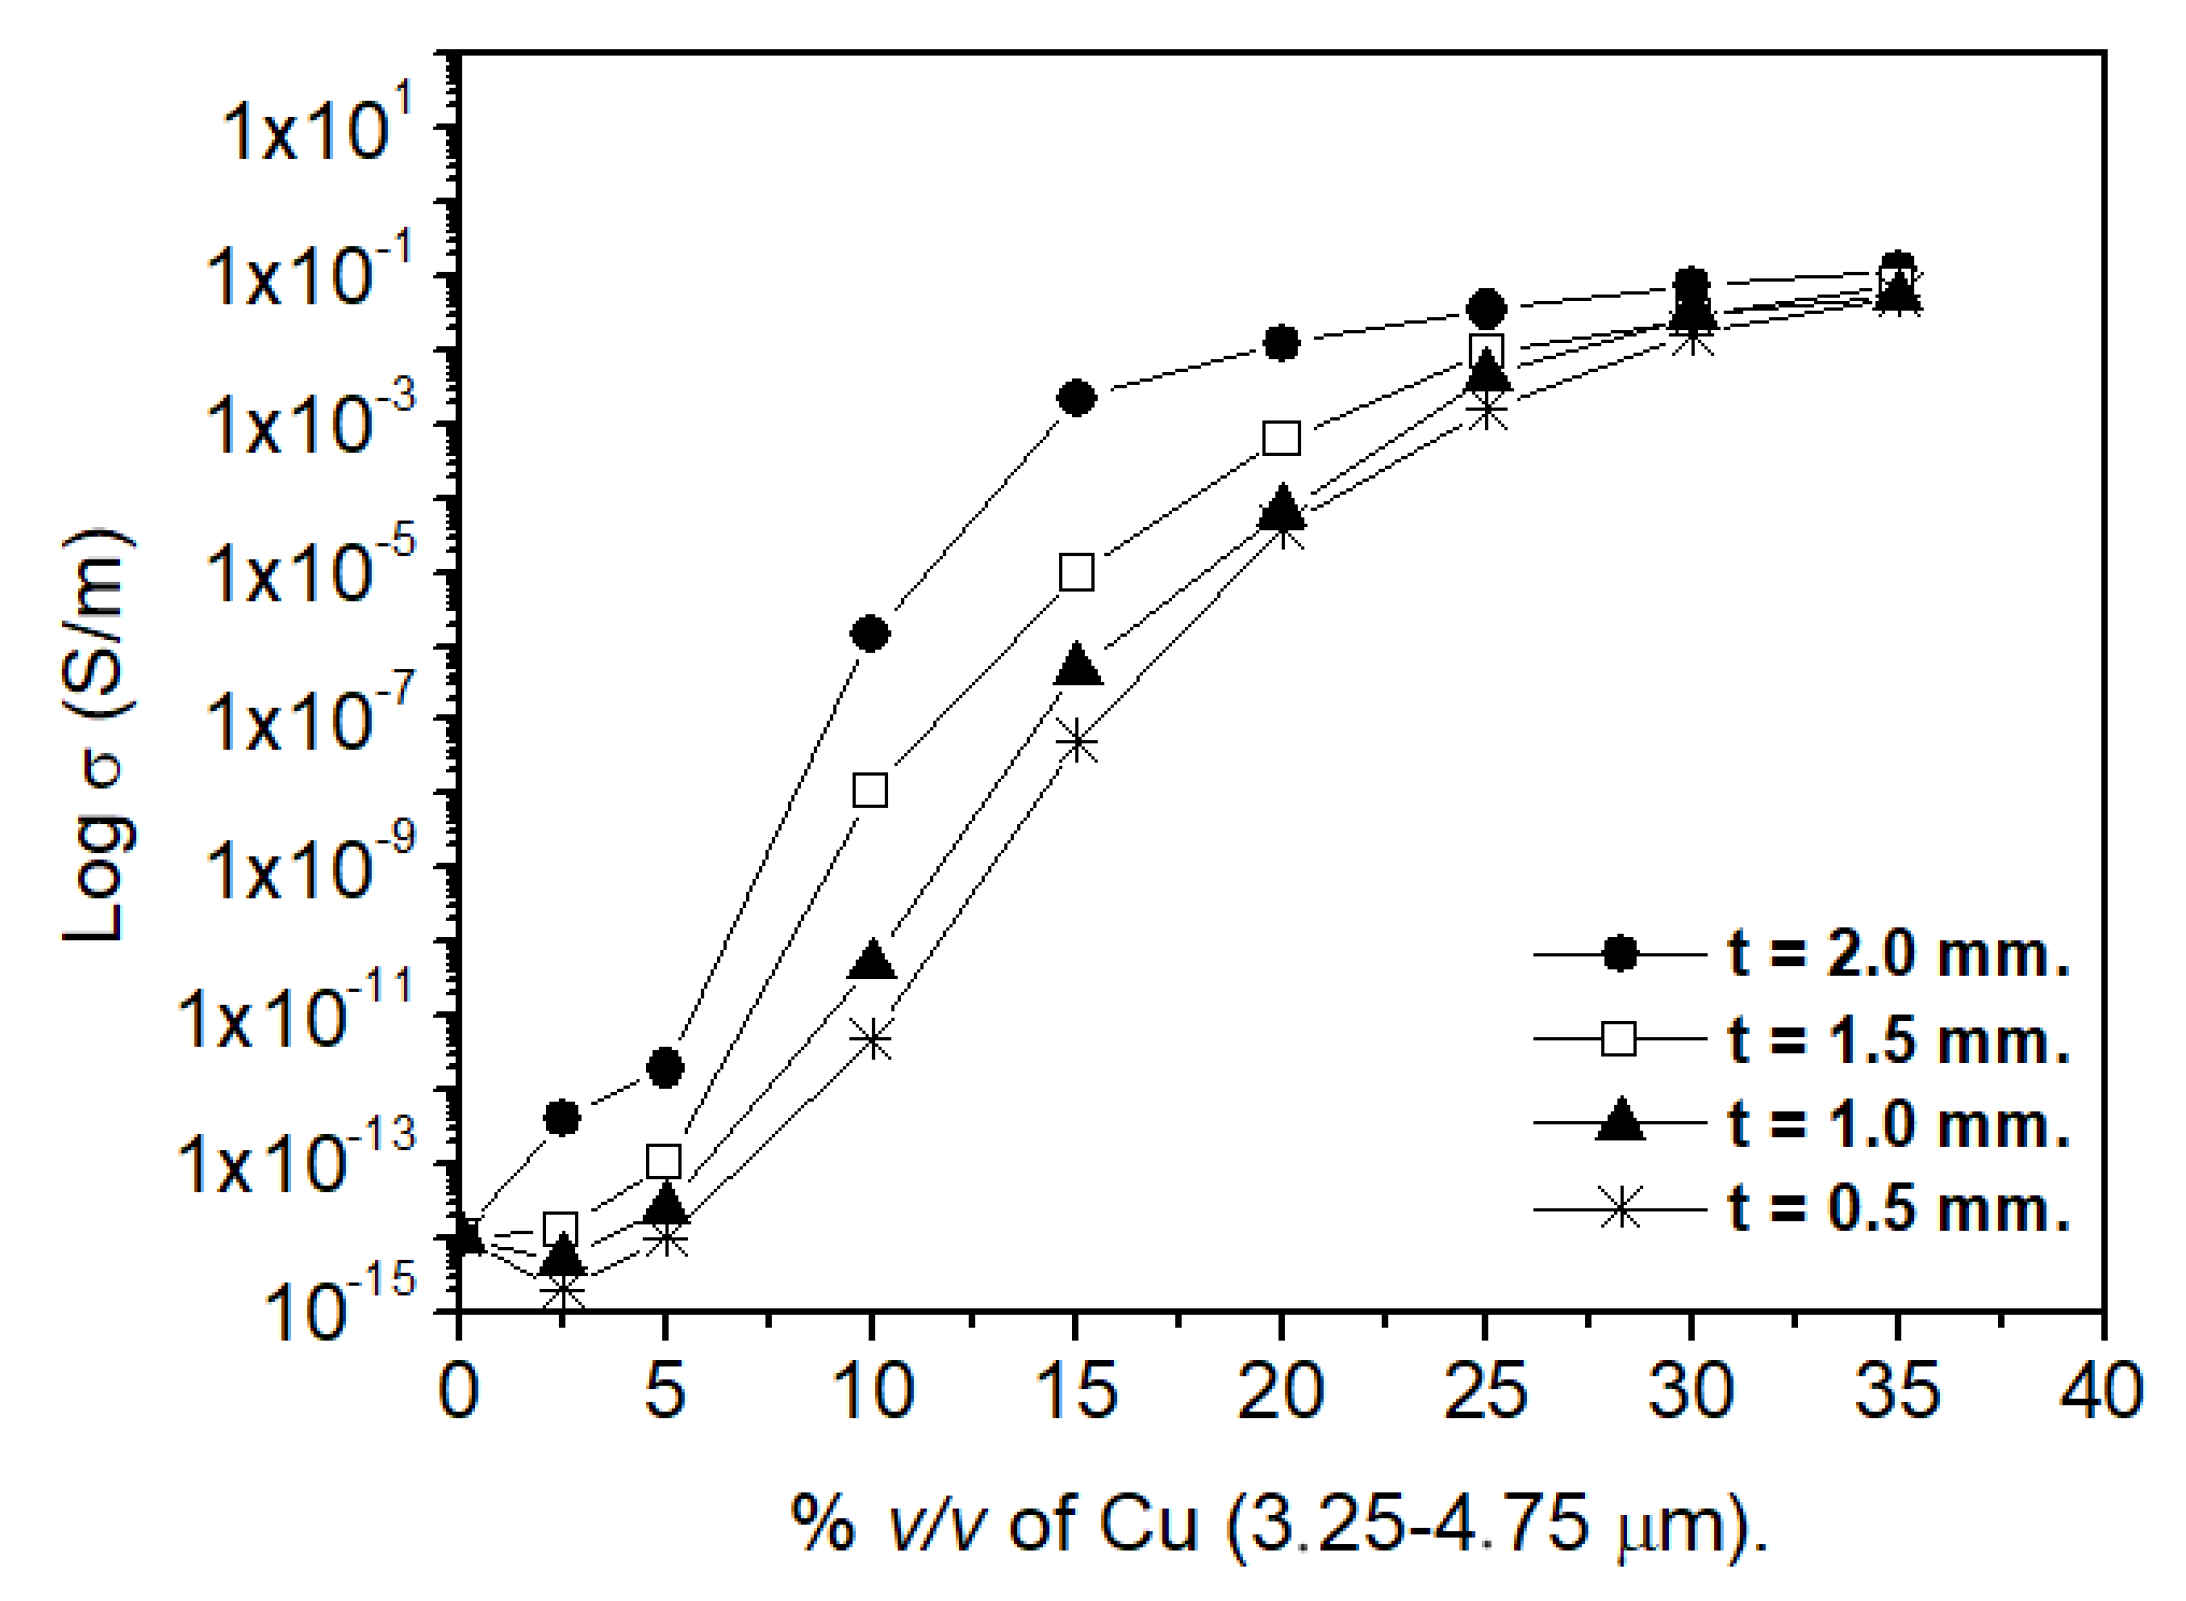
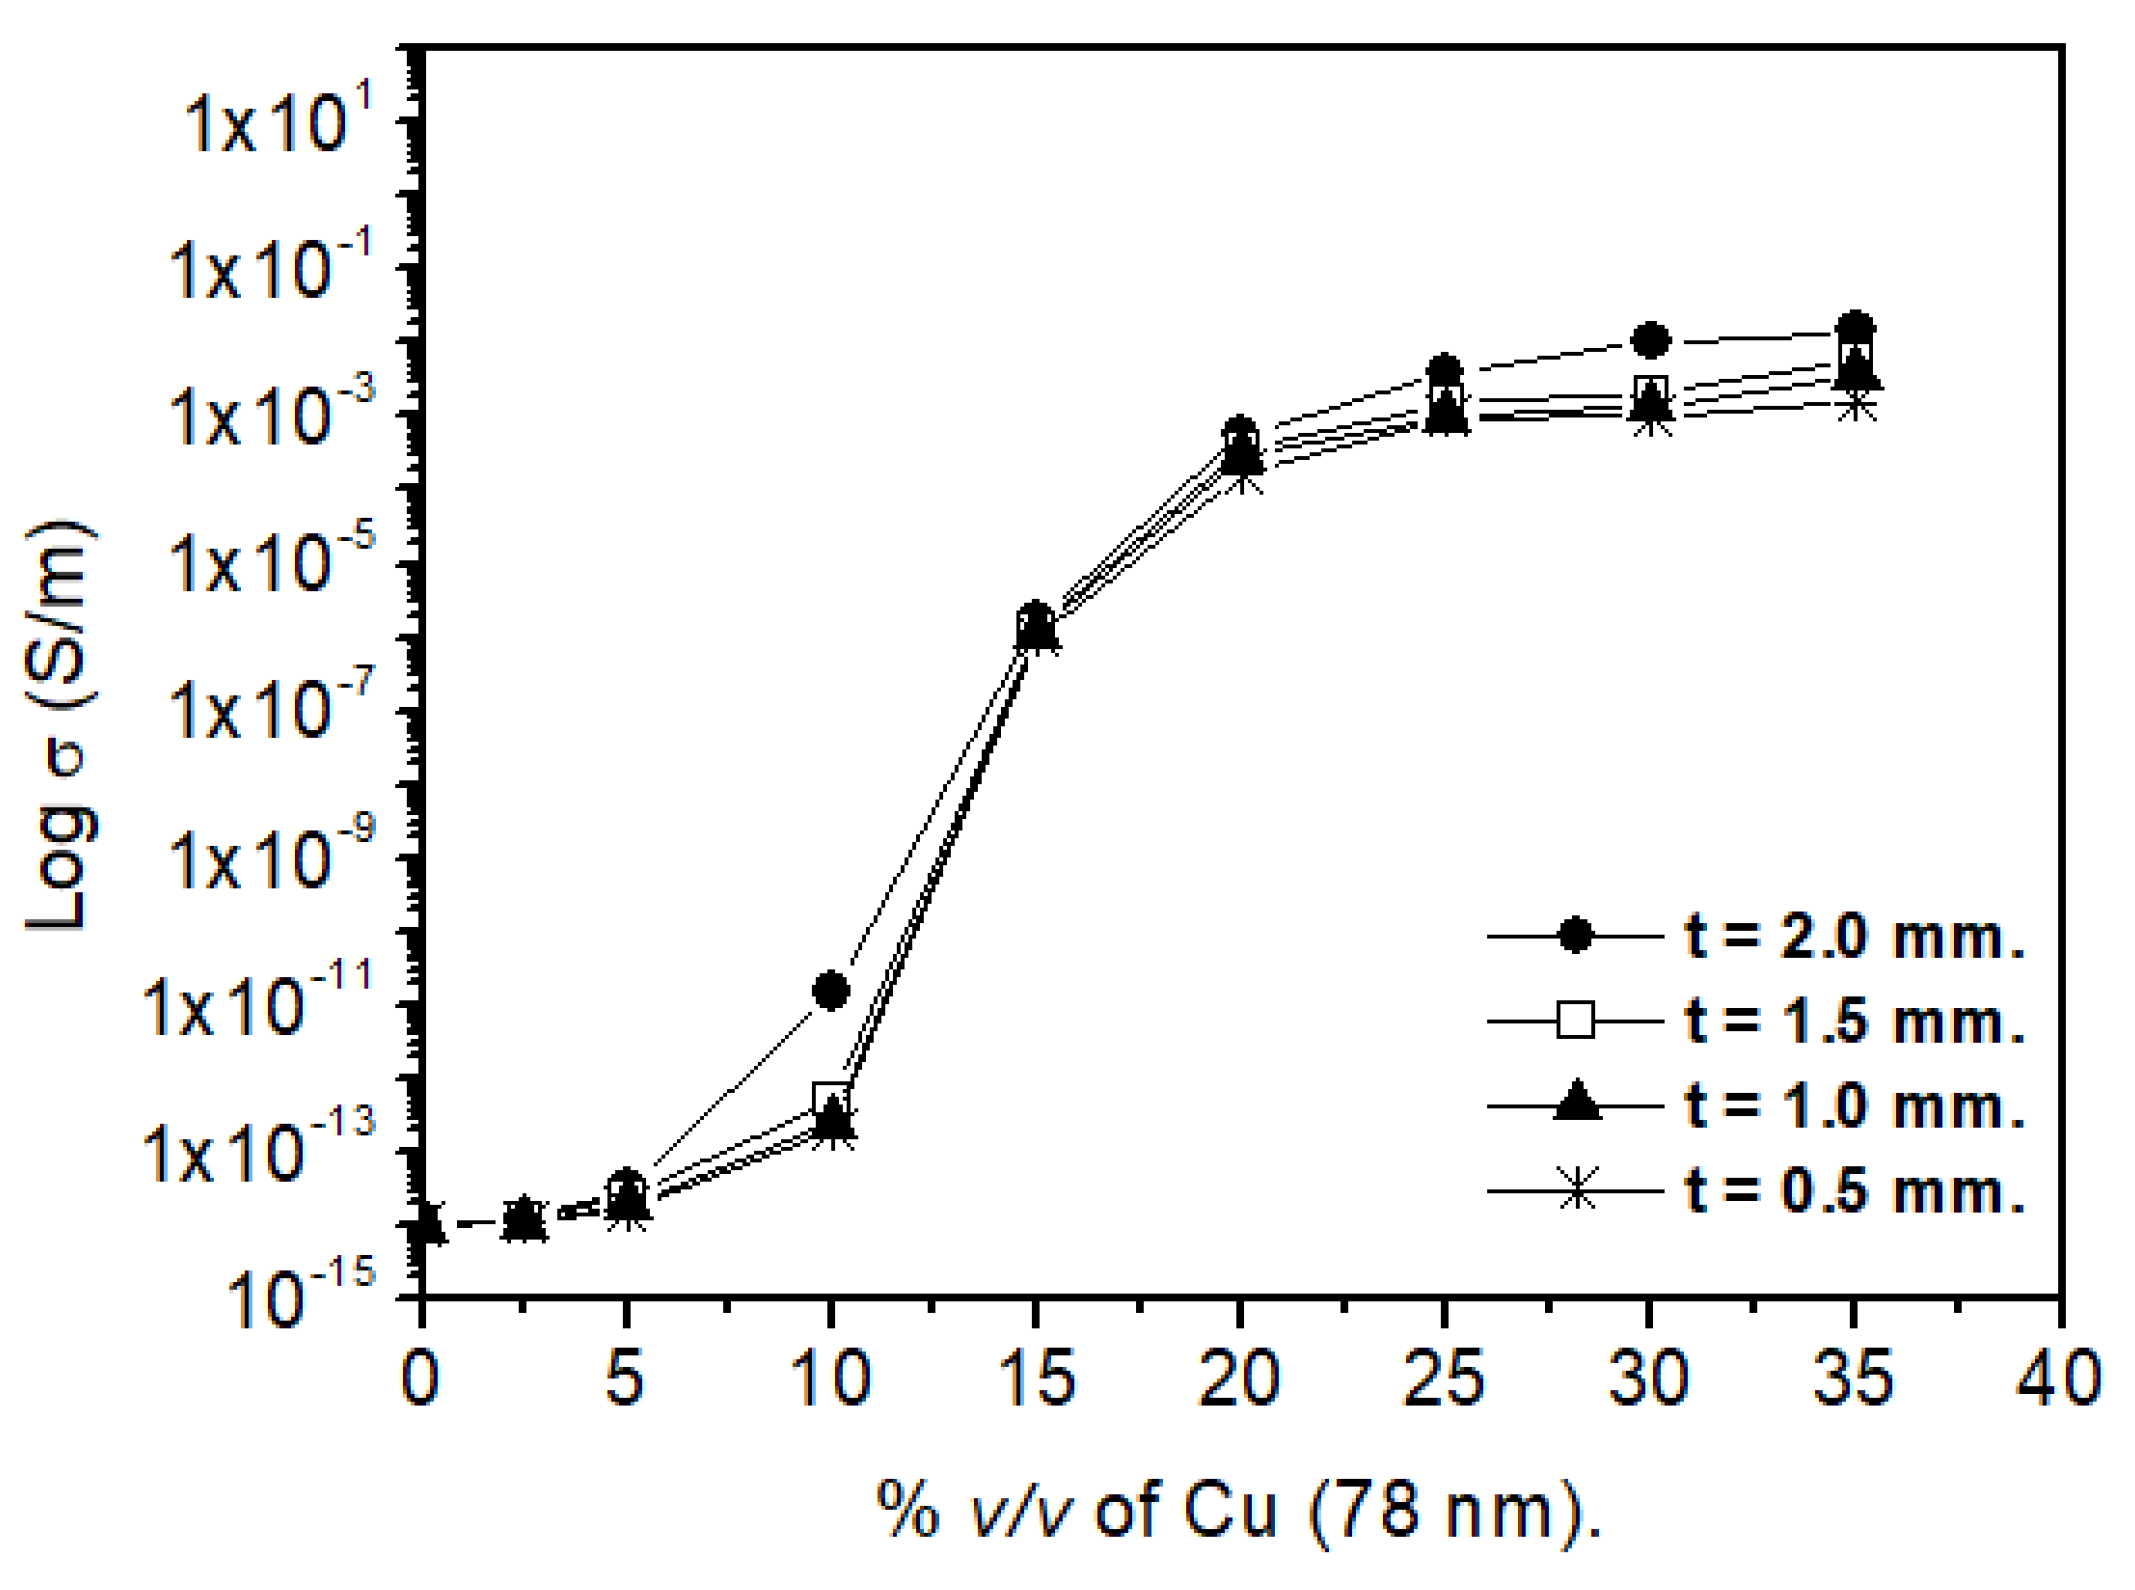
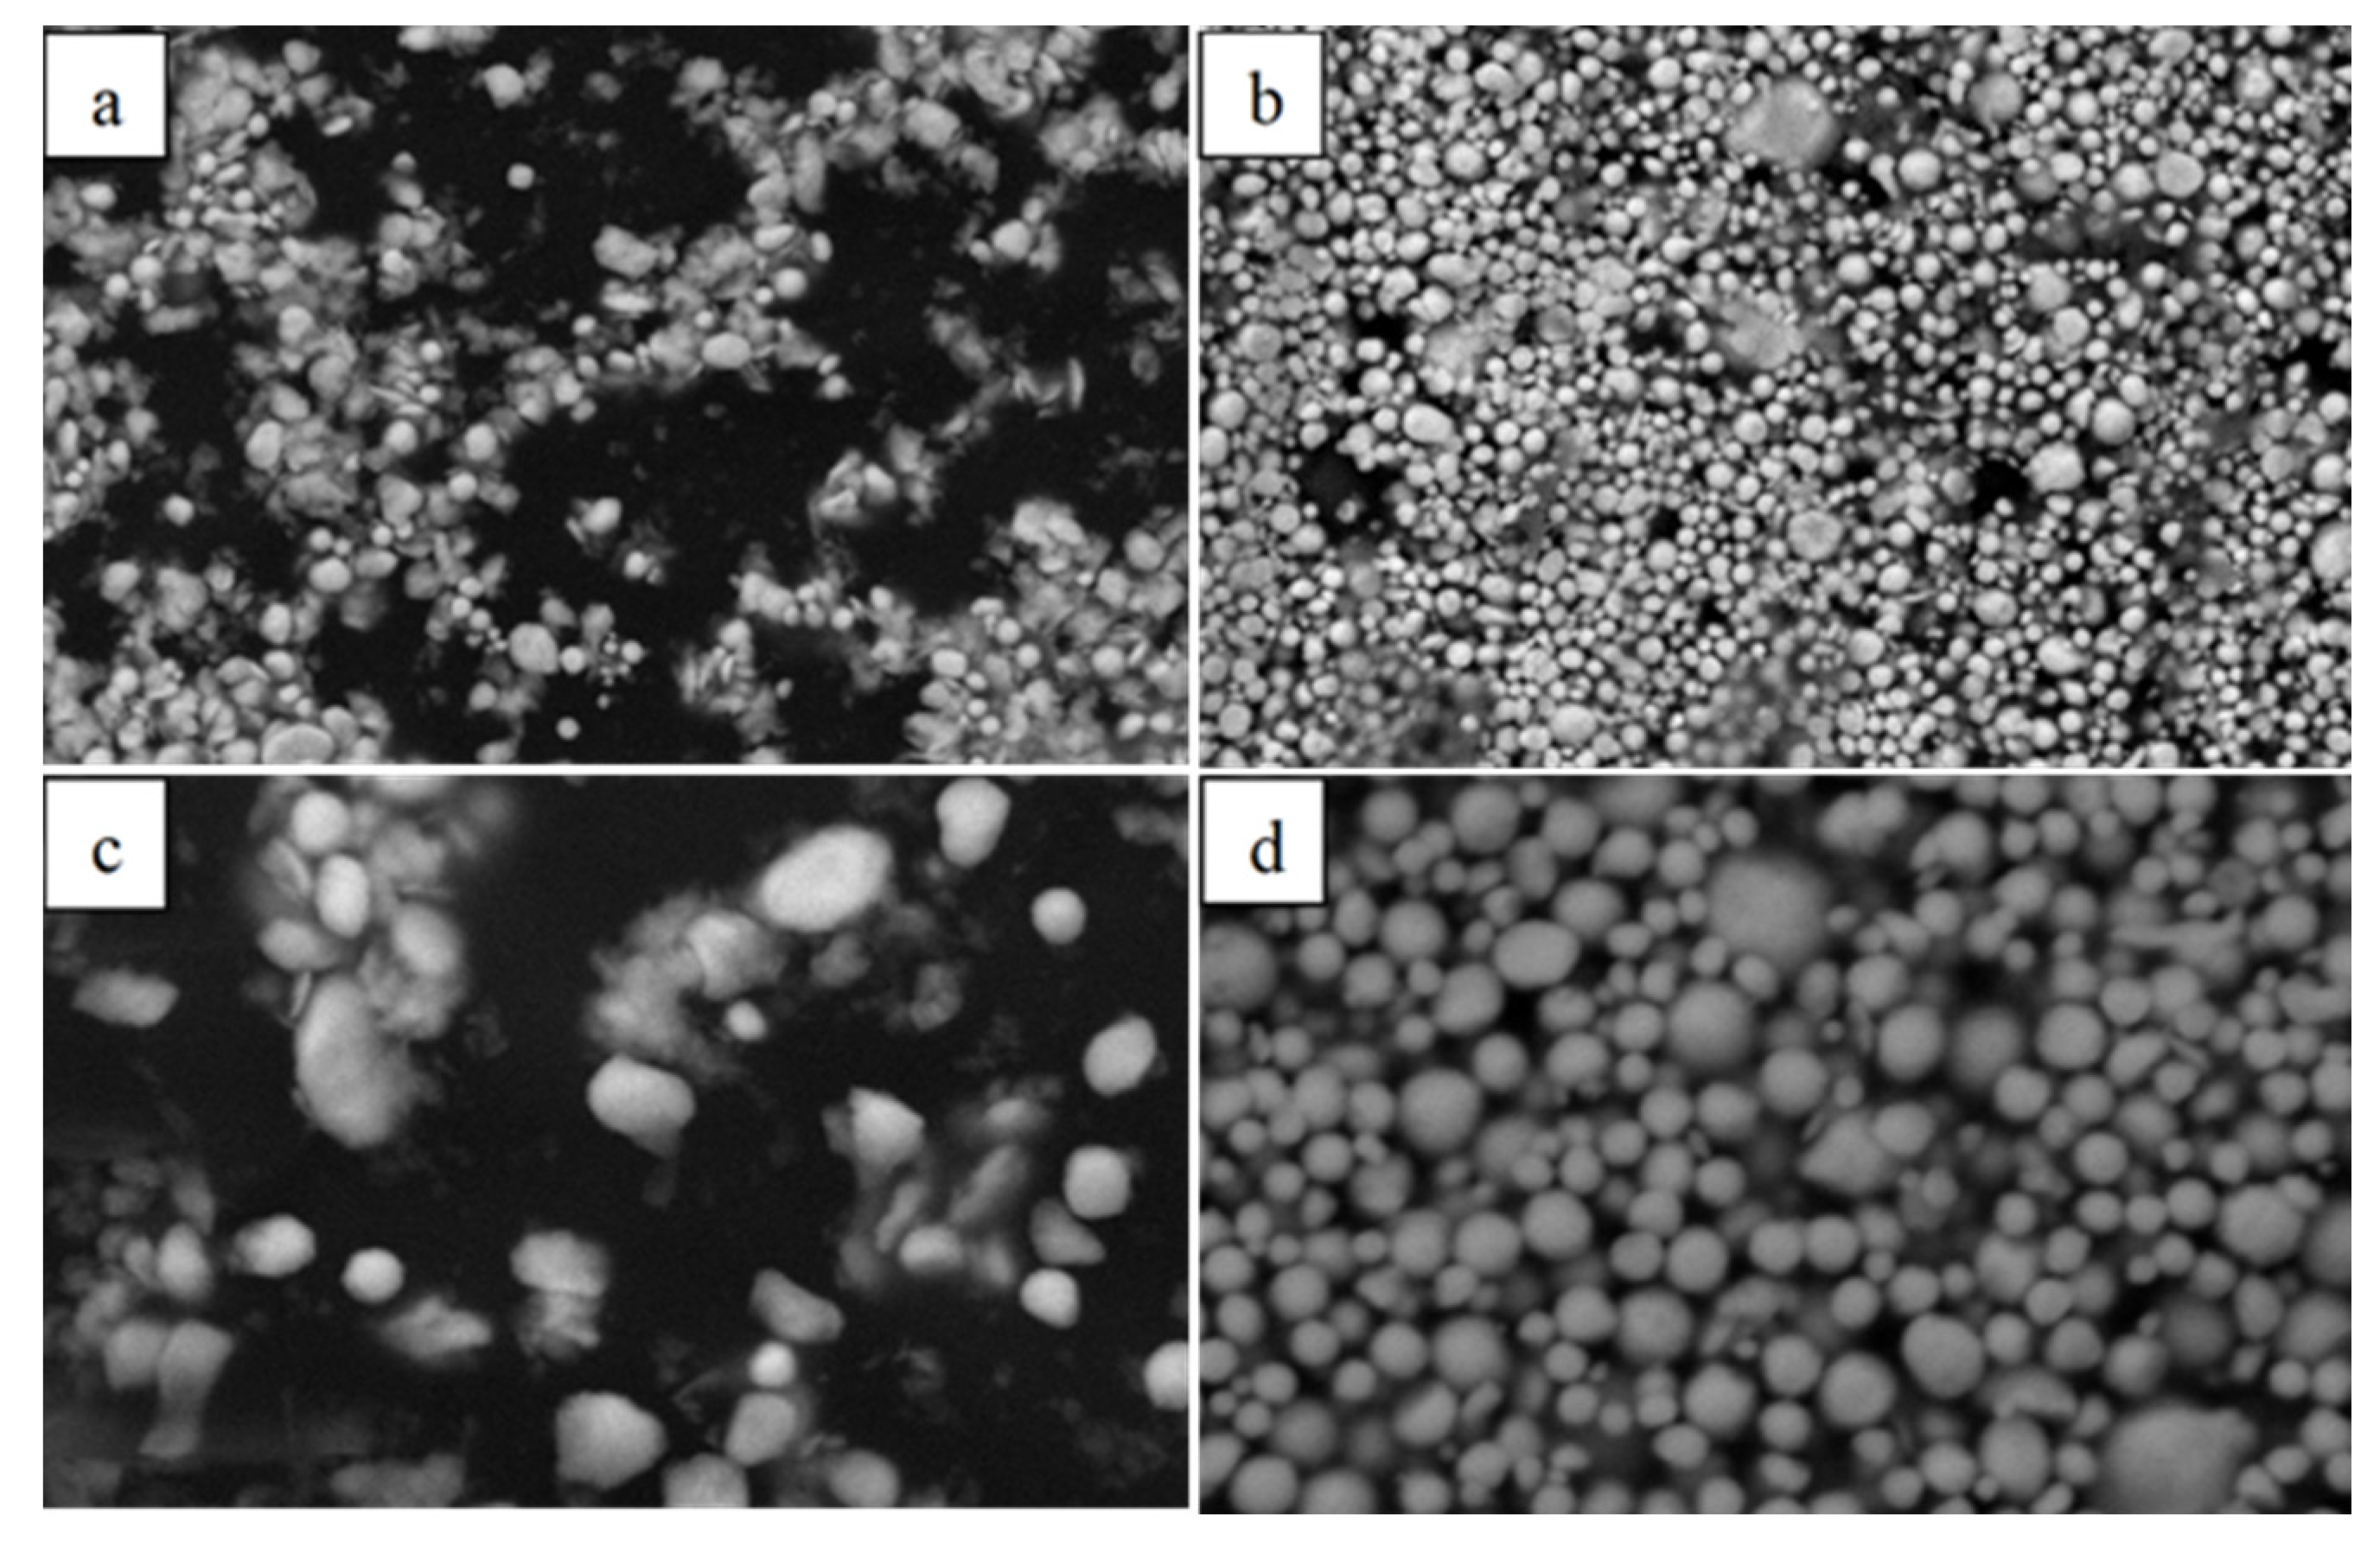
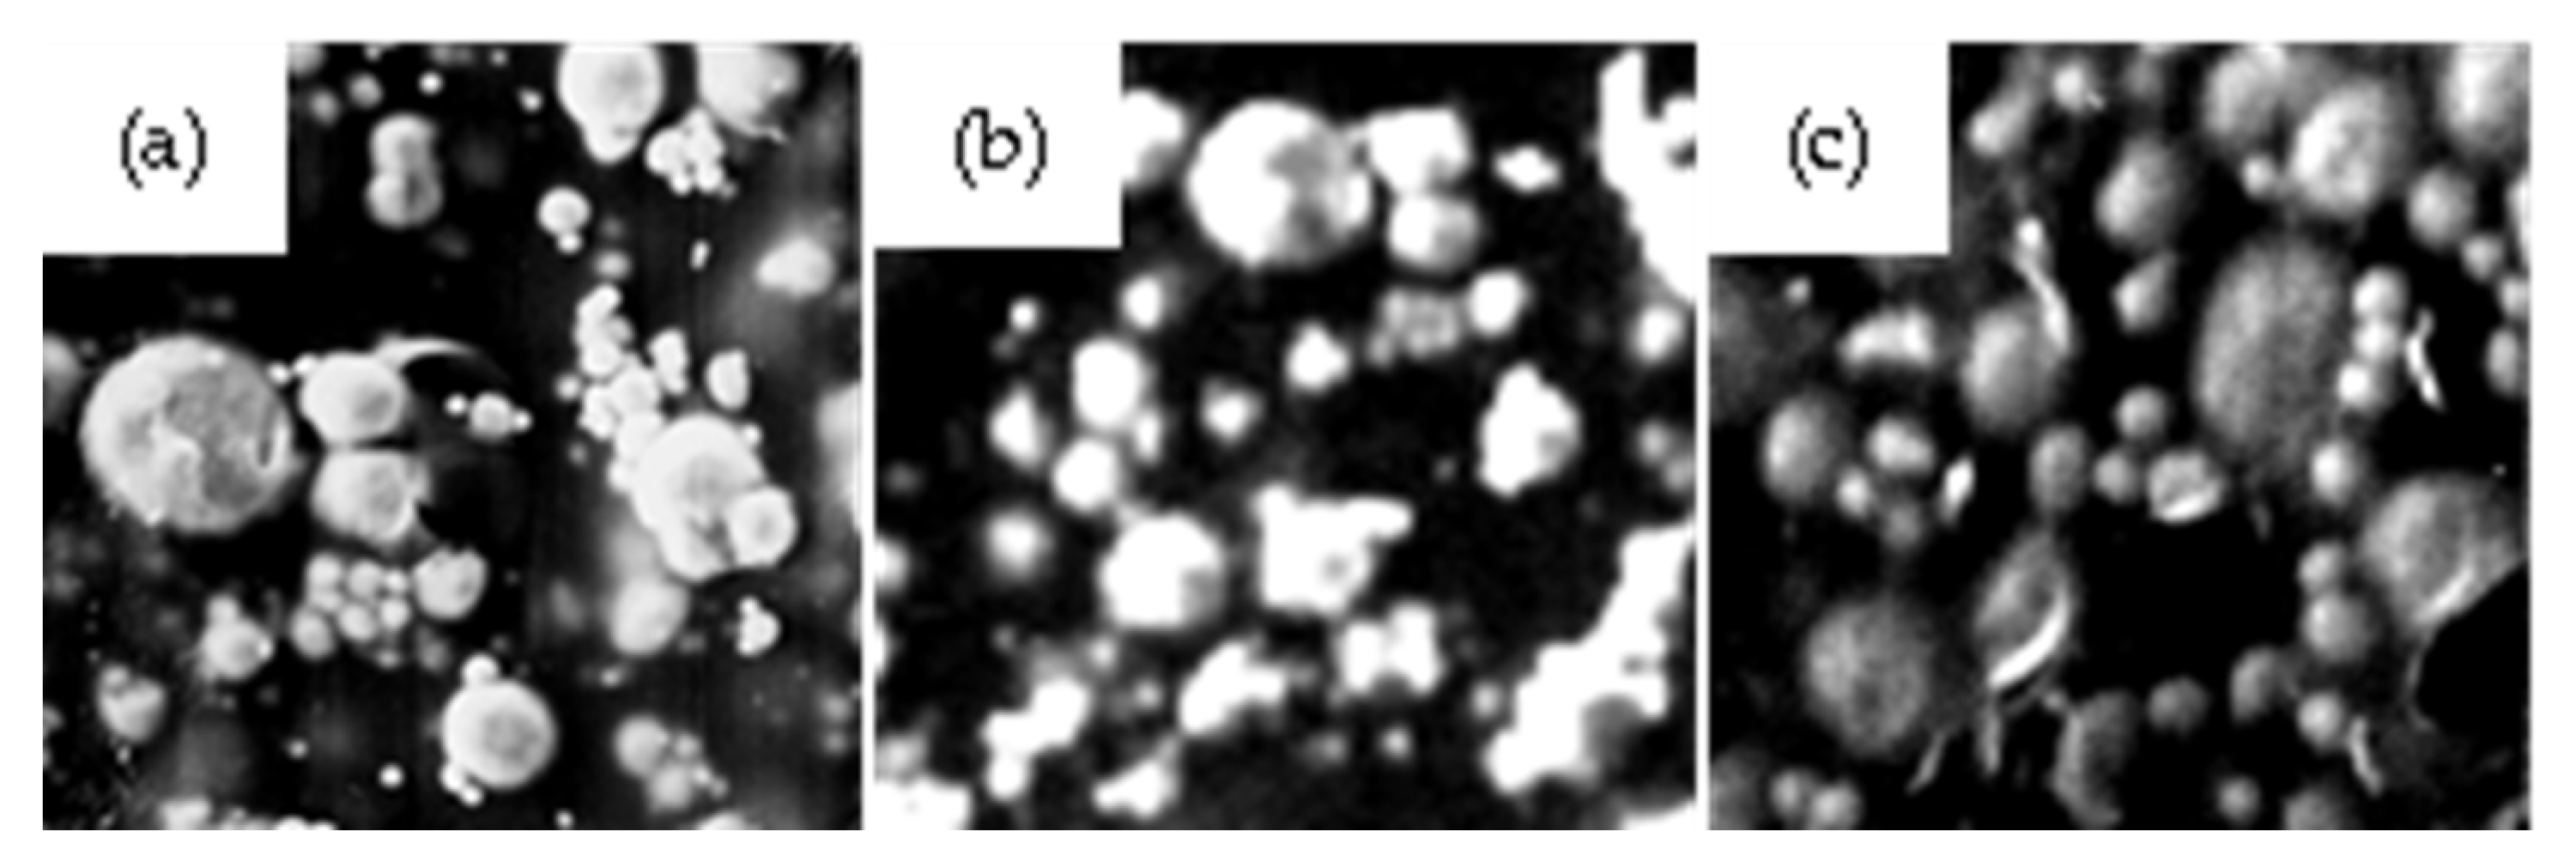
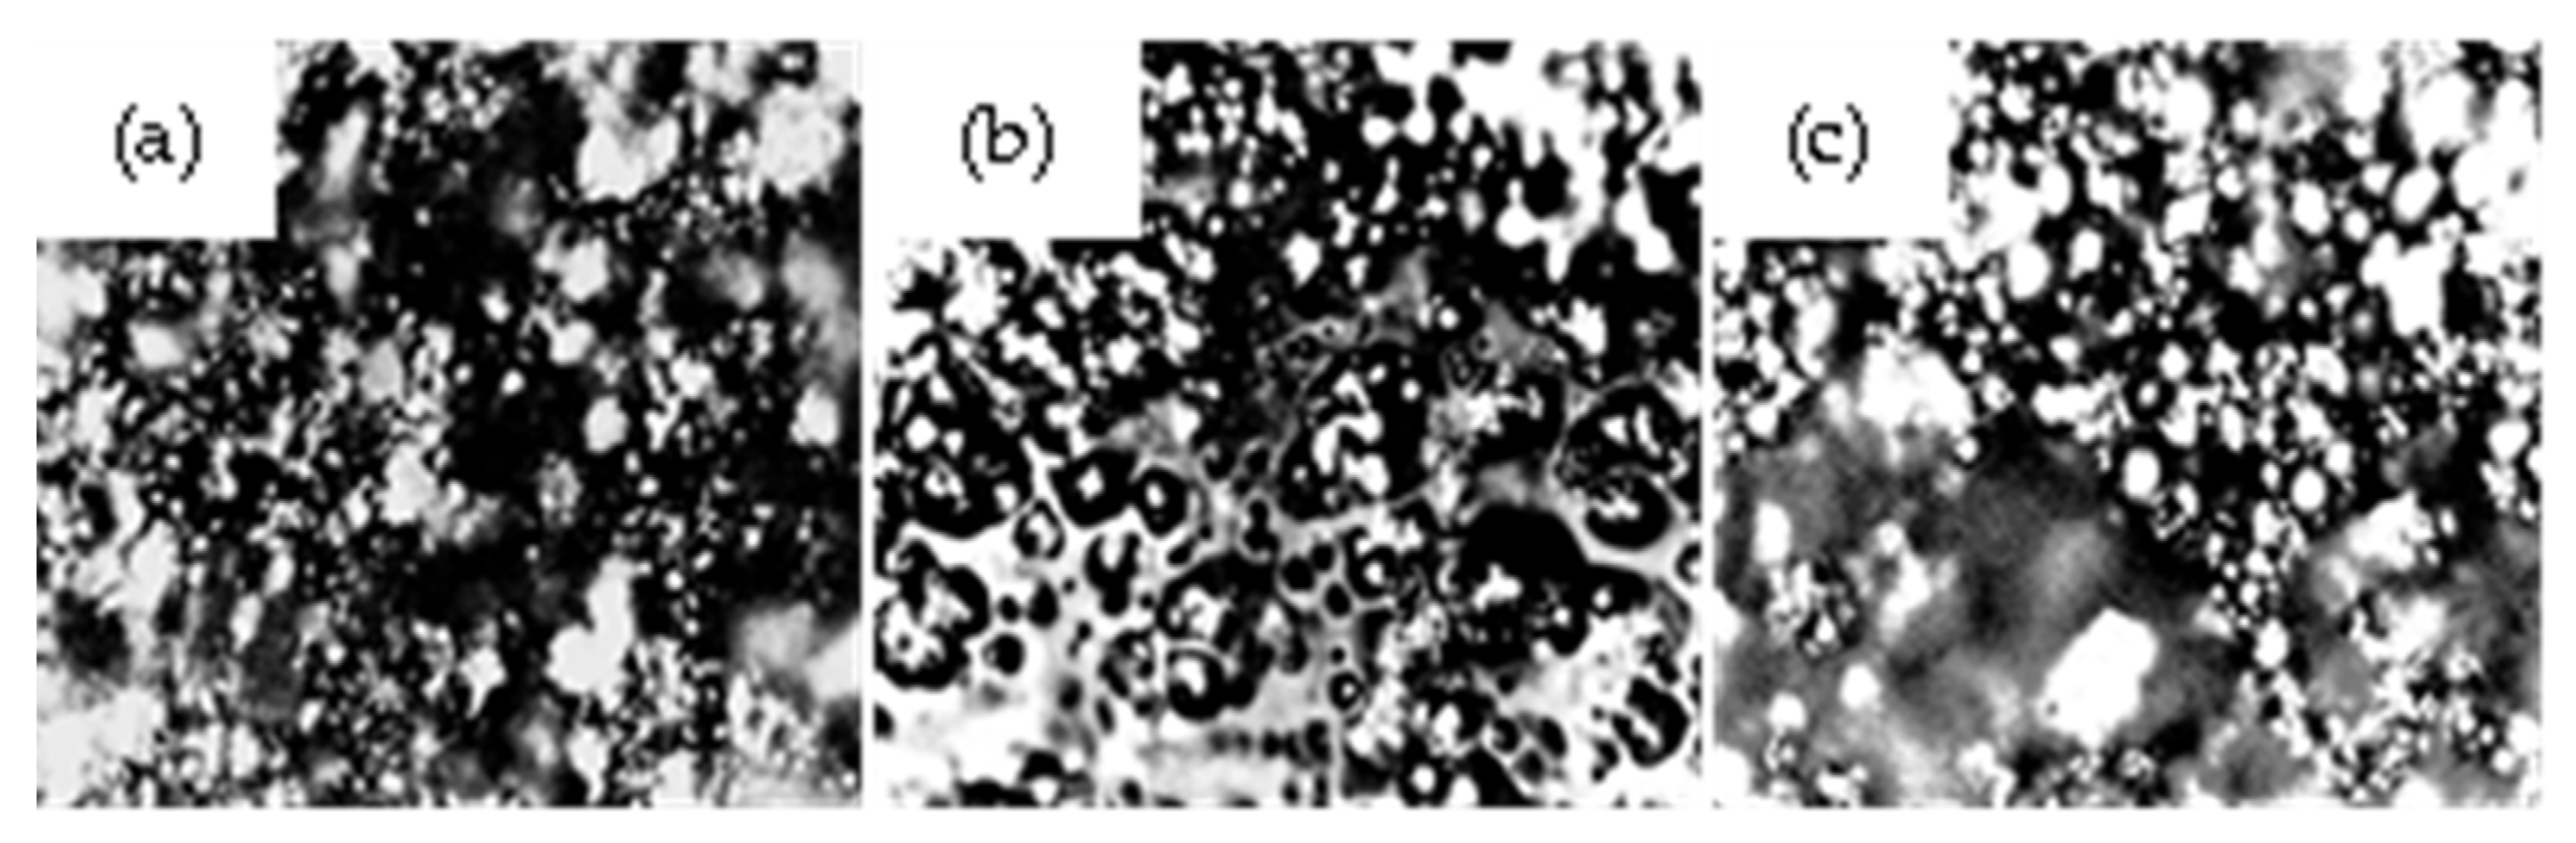
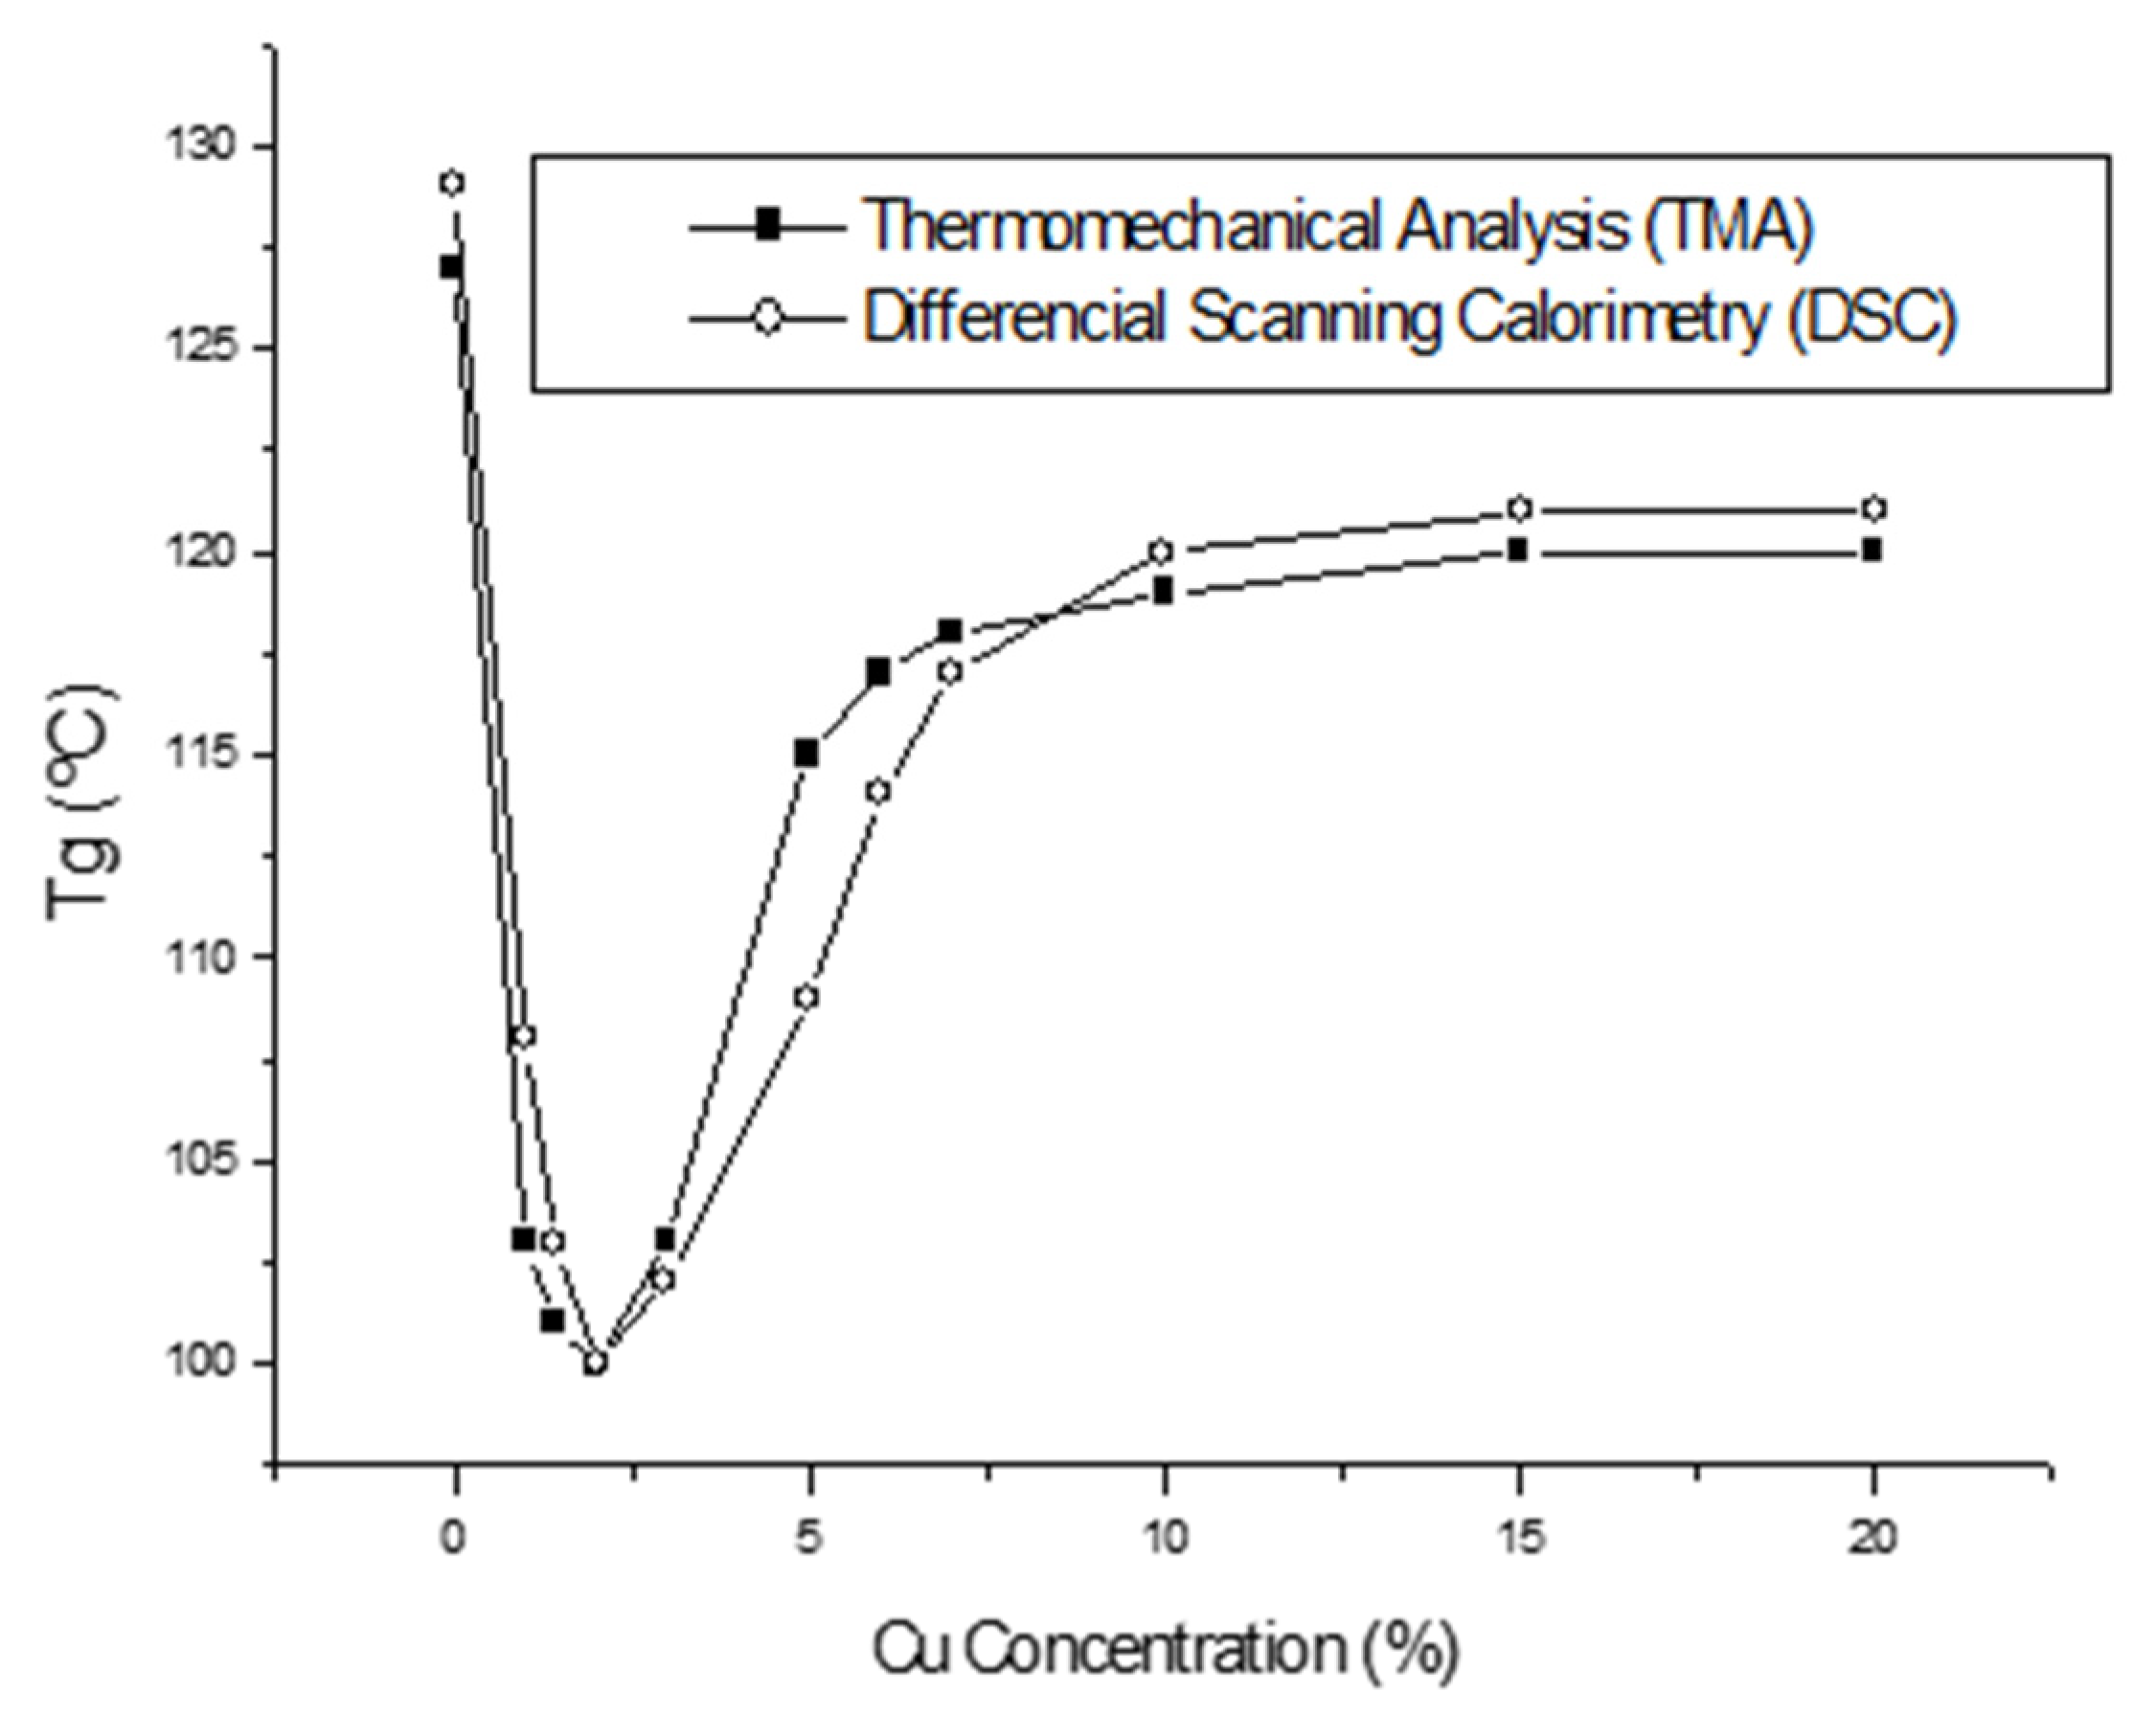
  • In this article, the mechanical, electrical and glass transition behaviors of copper–PMMA composites were investigated. The hot compression molding method is an economic and feasible methodology to prepare a metallic copper particle-filled polymethylmethacrylate matrix. This method also allows to achieve a highly segregated distribution of mtal particles within the polymeric matrix. Using this method, it was possible to lower the percolation threshold reached by other authors in similar systems. The microstructural analysis carried out showed that the probability of forming a network is increased when restricting the volume that any metallic particle can occupy in a single interproximal contact or the interstices of the polymer particles. Considering the general behavior observed in the polymeric composites, it could be stated that when the polymer chains possess a strong affinity with the particles’ surface, the chain mobility is very restricted in the proximity of the particle surface. Even though chain mobility increased in proportion with the increase of the distance between particles, mobility cannot be reached in empty volumes of the polymeric matrix.
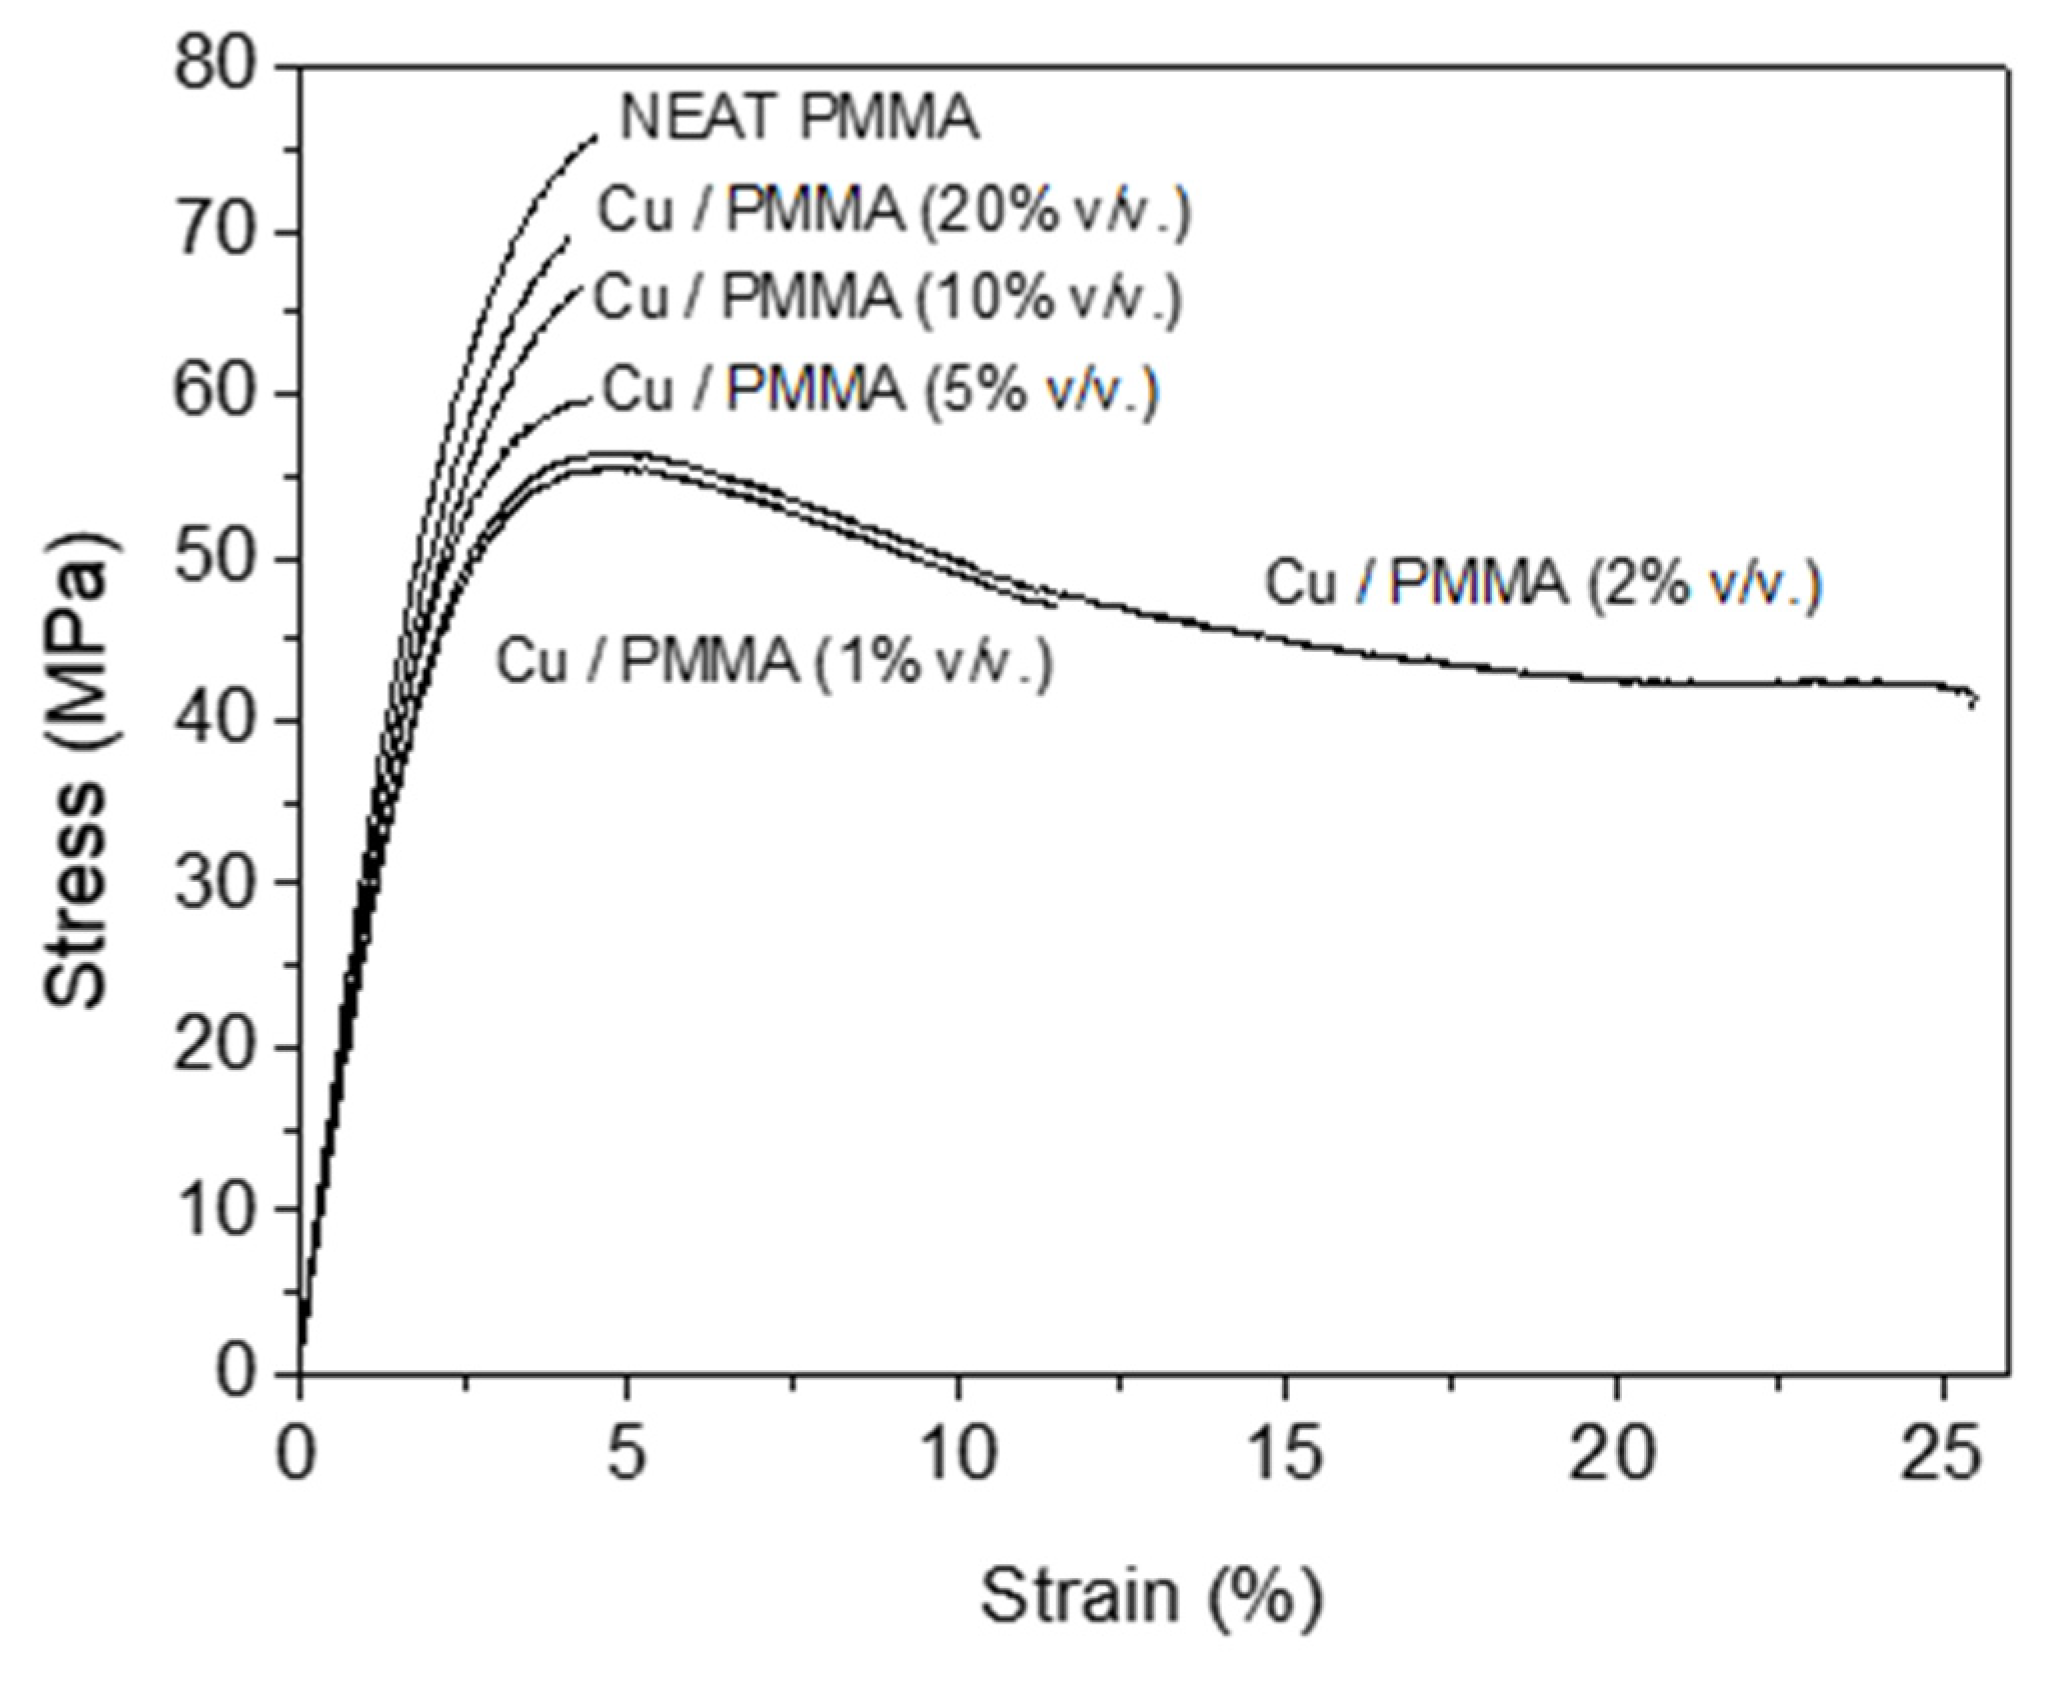
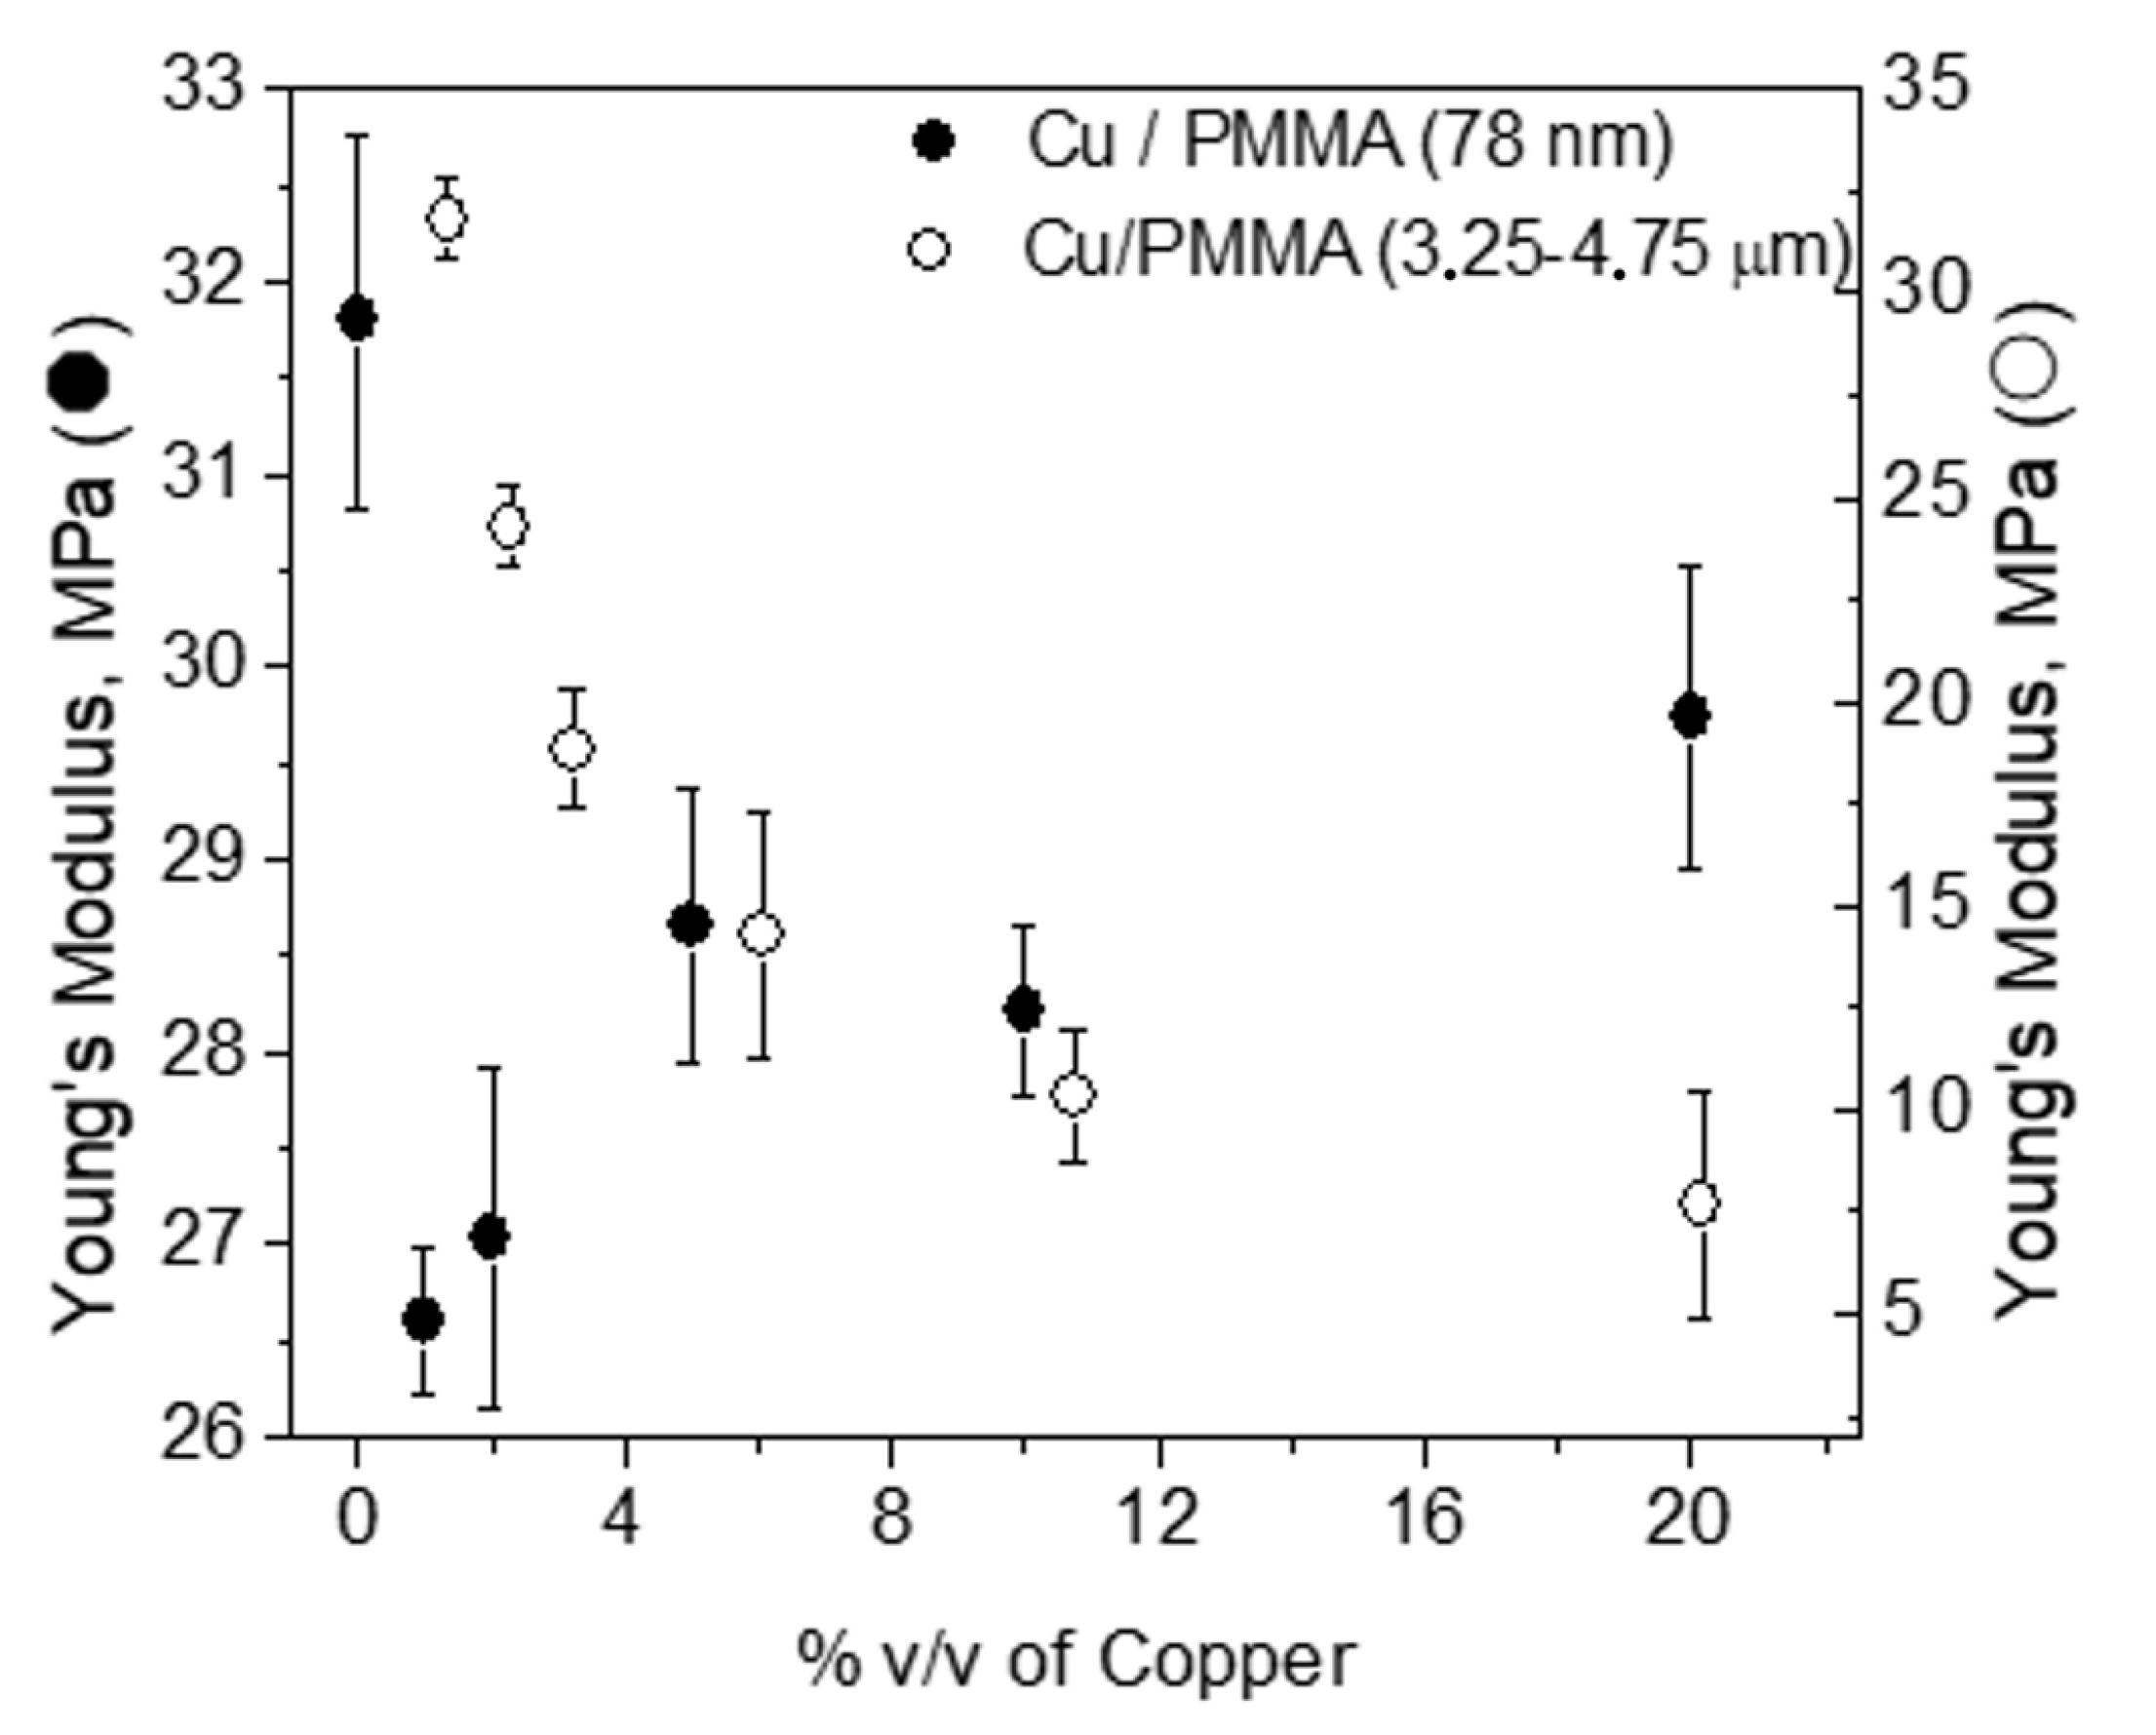
  • The infiltration of low concentrations of nanometric-size metallic particles originates an important increase in the strain-to-failure percentage in the Cu/PMMA composites. In the case of nanometric-filled Cu/PMMA composites, a light descent of Young’s modulus was observed for low concentrations of filler material and a gradual increase as more metallic particles were incorporated into the polymeric matrix. Micrometric-size particles act as stress concentrators within the composite, diminishing the strain-to-failure percentage and Young’s modulus; then for these composites, the critical concentration of metal filler and the morphology are insufficient to obtain acceptable both mechanical and electrical properties. One of the best attributes of nanometric-size filler is its great contact surface in relation to volume. This area apparently plays a fundamental role in the properties observed for the conductive polymeric composites due to the extensive surrounding volume of polymer around the segregated, distributed metallic particles. The abovementioned corresponds to polymer chains that are in contact with the surface of metallic particles. If the polymer chains achieve a strong affinity with the surface of the particle, these chains lose part of their mobility, thus generating a region of reduced mobility around each filler particle.

Author Contributions

Both authors (V.H.P. and M.P.A.) carried out jointly covering all aspects related to the project. All authors have read and agreed to the published version of the manuscript.

Funding

Internal project #275, synthesis and characterization of composite materials. Metropolitan Technological University.

Institutional Review Board Statement

Not applicable.

Informed Consent Statement

Not applicable.

Data Availability Statement

Not applicable.

Acknowledgments

The authors acknowledge the experimental support of the Centro de Ensayos e Investigación en Materiales, Universidad Tecnológica Metropolitana.

Conflicts of Interest

The authors declare no conflict of interest.

References

  1. Wang, Y.; Gao, J.; Ma, Y.; Agarwal, U.S. Agarwal. Study on mechanical properties, thermal stability and crystallization behavior of PET/MMT nanocomposites. Compos. Part B Eng. 2006, 37, 399–407. [Google Scholar] [CrossRef]
  2. Rakowski, W.A.; Zimowski, S. Polyesterimide composites as a sensor material for sliding bearings. Compos. Part B Eng. 2005, 37, 81–88. [Google Scholar] [CrossRef]
  3. Luyt, A.; Molefi, J.; Krump, H. Thermal, mechanical, and electrical properties of copper powder filled low-density and linear low-density polyethylene composites. Polym. Degrad. Stab. 2006, 91, 1629–1636. [Google Scholar] [CrossRef]
  4. Weidenfeller, B.; Höfer, M.; Frank, R.S. Thermal conductivity, thermal diffusivity, and specific heat capacity of particle filled polypropylene. Compos. Part A Appl. Sci. Manuf. 2004, 35, 423–429. [Google Scholar] [CrossRef]
  5. Ash, B.J.; Schadler, L.; Siegel, R.W. Glass transition behavior of alumina/polymethylmethacrylate nanocomposites. Mater. Lett. 2002, 55, 83–87. [Google Scholar] [CrossRef]
  6. Wu, G.; Lin, J.; Zheng, Q.; Zhang, M. Correlation between percolation behavior of electricity and viscoelasticity for graphite filled high density polyethylene. Polymer 2006, 47, 2442–2447. [Google Scholar] [CrossRef]
  7. Mamunya, Y.P.; Davydenko, V.; Pissis, P.; Lebedev, E.V. Electrical and thermal conductivity of polymers filled with metal powders. Eur. Polym. J. 2002, 38, 1887–1897. [Google Scholar] [CrossRef]
  8. Zweifel, Y.; Christopher, J.G. Plummer and Hans-Henning Kausch. Current Transport in conducting particle filled epoxies. Polym. Bull. 1998, 40, 259–266. [Google Scholar] [CrossRef]
  9. Ou, R.; Gerhardt, R.A.; Marrett, C.; Moulart, A.; Colton, J.S. Assessment of percolation and homogeneity in ABS/carbon black composites by electrical measurements. Compos. Part B Eng. 2003, 34, 607–614. [Google Scholar] [CrossRef]
  10. Bhattacharya, S.; Polymers, M.-F. (Eds.) Properties and Applications; Marcel Dekker, Inc.: New York, NY, USA, 1986. [Google Scholar]
  11. Marhoon, I.I.; Majeed, A.H.; Abdulrehman, M.A. Dielectric Behavior of Medical PMMA Polymer Filled With Copper Nanobud Particles. Adv. Electromagn. 2019, 8, 50–56. [Google Scholar] [CrossRef]
  12. Miola, M.; Cochis, A.; Kumar, A.; Arciola, C.R.; Rimondini, L.; Verne, E. Copper-Doped Bioactive Glass as Filler for PMMA-Based Bone Cements: Morphological, Mechanical, Reactivity, and Preliminary Antibacterial Characterization. Materials 2018, 11, 961. [Google Scholar] [CrossRef]
  13. Athar, N.; Akhtar, G.; Murtaza, M.; Shafique, A.; Ahmed; Haidyrah, S. Effect of Cu Ions Implantation on Structural, Electronic, Optical and Dielectric Properties of Polymethyl Methacrylate (PMMA). Polymers 2021, 13, 973. [Google Scholar]
  14. Wang, Z.; Wang, Y.; Cai, S.; Yang, J. Liquid Crystal Elastomers for Soft Actuators. Mater. Lab 2022, 1, 220030. [Google Scholar] [CrossRef]
  15. David, S.M.; Blaszkiewicz, M.; Robert, E. Newnham. Electrical Resistivity of Composites. J. Am. Ceram. Soc. 1990, 73, 2187. [Google Scholar]
  16. Stauffer, D.; Aharony, A. Introduction To Percolation Theory, 2nd ed.; Taylor and Francis: London, UK, 1992. [Google Scholar]
  17. Gungor, A. The physical and mechanical properties of polymer composites filled with Fepowder. J. Appl. Polym. Sci. 2005, 99, 2438–2442. [Google Scholar] [CrossRef]
  18. Benjamin, J.A.; Diana, F.R.; Christopher, J.W.; Linda, S.S.; Richard, W.S.; Brian, C.B.; Tom, A. Mechanical properties of Al2O3/polymethylmethacrylate nanocomposites. Polym. Compos. 2002, 23, 1014–1025. [Google Scholar]
  19. Levita, G.; Marchetti, A.; Lazzeri, A. Fracture of ultrafine calcium carbonate/polypropylene composites. Polym. Compos. 1989, 10, 39–43. [Google Scholar] [CrossRef]
  20. Gülsoy, H.; Taşdemır, M.; Taşdemir, M. Physical and Mechanical Properties of Polypropylene Reinforced with Fe Particles. Int. J. Polym. Mater. Polym. Biomater. 2006, 55, 619–626. [Google Scholar] [CrossRef]
  21. ZBartczak, Z.; Argon, A.; Cohen, R.; Weinberg, M. Toughness mechanism in semicrystalline polymer blends: II. High-density polyethylene toughened with calcium carbonate filler particles. Polymer 1999, 40, 2347–2365. [Google Scholar] [CrossRef]
  22. FBoydağ, F.; Özcanlı, Y.L.; Alekberov, V.; Hikmet, I. Temperature and time dependence of electrical and mechanical durability of LDPE/diamond composites. Compos. Part B Eng. 2005, 37, 249–254. [Google Scholar] [CrossRef]
  23. Lu, J.; Chen, X.; Lu, W.; Chen, G. The piezoresistive behaviors of polyethylene/foliated graphite nanocomposites. Eur. Polym. J. 2006, 42, 1015–1021. [Google Scholar] [CrossRef]
  24. Zhang, B.; Fu, R.; Zhang, M.; Dong, X.; Wang, L.; Pittman, C.U. Gas sensitive vapor grown carbon nanofiber/polystyrene sensors. Mater. Res. Bull. 2006, 41, 553–562. [Google Scholar] [CrossRef]
  25. Mahajan, D.; Desai, A.; Rafailovich, M.; Cui, M.-H.; Yang, N.-L. Synthesis and characterization of nanosized metals embedded in polystyrene matrix. Compos. Part B Eng. 2006, 37, 74–80. [Google Scholar] [CrossRef]
  26. Hergeth, W.-D.; Steinau, U.-J.; Bittrich, H.-J.; Simon, G.; Schmutzler, K. Polymerization in the presence of seeds. Part IV: Emulsion polymers containing inorganic filler particles. Polymer 1989, 30, 254–258. [Google Scholar] [CrossRef]
  27. Ash, B.; Stone, J.; Rogers, D.; Schadler, L.; Siegel, R.; Benicewicz, B.; Apple, T. Investigation into the Thermal and Mechanical Behavior of PMMA/Alumnia Nanocomposites. Mat. Res. Soc. Symp. Proc. 2001, 661. [Google Scholar] [CrossRef]
  28. Vollenberg, J.W.; de Haan, L.J.M.; van de Ven Heikens, D. Particle size dependence of the Young’s modulus of filled polymers: 2. Annealing and solid-state nuclear magnetic resonance experiments. Polymer 1989, 30, 1663–1668. [Google Scholar] [CrossRef]
  29. Nielsen, L.; Landel, R. Mechanical Properties of Polymers and Composites; Marcel Dekker: New York, NY, USA, 1994. [Google Scholar]
  30. Weir, C.E. temperature dependence of compression of linear high polymers at high pressures. J. Res. Natl. Bur. Stand. 1954, 53, 245. [Google Scholar] [CrossRef]
  31. Brandrup, J.; Immergut, E.H. (Eds.) Polymer Handbook, 3rd ed.; John Wiley & Sons: New York, NY, USA, 1989. [Google Scholar]
  32. ASTM D792–66 (Reapproved 1975); Density of Plastics by Water Displacement. American Society for Testing and Materials: Philadelphia, PA, USA, 1966.
  33. ASTM D257–99; Standard Test Methods for DC Resistance or Conductance of Insulating Materials. American Society for Testing and Materials: Philadelphia, PA, USA, 1999.
  34. Ruschau Gregory Richard. Conductive Composites as Chemical Sensors. UMI Dissertation Services, The Pennsylvania State University, Order Number 9214261. 1991. Available online: https://www.proquest.com/openview/9a8b65e7483dc6de8023f7e0d41be172/1?pq-origsite=gscholar&cbl=18750&diss=y (accessed on 26 January 2023).
  35. Broadbent, S.R.; Hammersley, J.M. Percolation Processes. Proc. Comb. Phil. Soc. 1957, 53, 629. [Google Scholar] [CrossRef]
  36. Ou, Y.; Yang, F.; Yu, Z.-Z. A new conception on the toughness of nylon 6/silica nanocomposite prepared via in situ polymerization. J. Polym. Sci. Part B Polym. Phys. 1998, 36, 789–795. [Google Scholar] [CrossRef]
  37. Sumita, M.; Tsukihi, H.; Miyasaka, K.; Ishikawa, K. Dynamic mechanical properties of polypropylene composites filled with ultrafine particles. J. Appl. Polym. Sci. 1984, 29, 1523–1530. [Google Scholar] [CrossRef]
  38. Kotsilkova, R.; Fragiadakis, D.; Pissis, P. Pissis. Reinforcement effect of carbon nanofillers in an epoxy resin system: Rheology, molecular dynamics, and mechanical studies. J. Polym. Sci. Part B Polym. Phys. 2005, 43, 522–533. [Google Scholar] [CrossRef]
  39. Chisholm, N.; Mahfuz, H.; Vijaya; Rangari, K.; Ashfaq, A.; Jeelani, S. Fabrication and mechanical characterization of carbon/SiC-epoxy nanocomposites. Compos. Struct. 2005, 67, 115–124. [Google Scholar] [CrossRef]
  40. Unal, H.; Mimaroglu, A. Influence of Filler Addition on the Mechanical Properties of Nylon-6 Polymer. J. Reinf. Plast. Compos. 2004, 23, 461–469. [Google Scholar] [CrossRef]
  41. Christensen, R.M. Mechanics of Composite Materials; Wiley: New York, NY, USA, 1979. [Google Scholar]
  42. Pal, R. New Model for effective Young’s modulus of particulate composites. Compos. Part B Eng. 2005, 36, 513–523. [Google Scholar] [CrossRef]
  43. Wolock, I.; Kies, J.; Newman, S. Fracture: Proceedings of an International Conference on the Atomic Mechanisms of Fracture, 12–16 April 1959; Averbach, B.L., Felbeck, D.K., Eds.; MIT: Boston, MA, USA, 1959; Chapter 13. [Google Scholar]
  44. Young, R.J.; Lovell, P.A. Introduction to Polymers; Chapman and Hall: New York, NY, USA, 1991. [Google Scholar]
  45. Becker, K.H.; Schmidt, H. Tailoring of thermomechanical properties of thermoplastic nanocomposites by surface modification of nanoscale silica particles. Mat. Res. Soc.Symp. Proc. 1996, 435, 237. [Google Scholar] [CrossRef]
  46. Ng, C.; Ash, B.; Schadler, L.; Siegel, R. A Study of the Mechanical and Permeability Properties of Nano- and Micron- TiO2 Filled Epoxy Composites. Compos. Adv. Mater. 2001, 10. Available online: https://journals.sagepub.com/doi/full/10.1177/096369350101000301 (accessed on 26 January 2023). [CrossRef]
  47. Sternstein, S.S. Polymeric Materials: Relationships Between Structure and Mechanical Behavior; American Society for Metals: Metals Park, OH, USA, 1975; Chapter 7. [Google Scholar]
  48. Lazzeri, A.; Bucknall, C.B. Dilatational bands in rubber-toughened polymers. J. Mater. Sci. 1993, 28, 6799–6808. [Google Scholar] [CrossRef]
  49. Bucknall, C.B. Polymer Blends; Paul, D.R., Bucknall, C.B., Eds.; John Wiley & Sons Inc.: New York, NY, USA, 2000; Volume 2, Chapter 22. [Google Scholar]
  50. Pearson, R.; Yee, A. Influence of particle size and particle size distribution on toughening mechanisms in rubber-modified epoxies. J. Mater. Sci. 1991, 26, 3828–3844. [Google Scholar] [CrossRef]
  51. Wu, S. A generalized criterion for rubber toughening: The critical matrix ligament thickness. J. Appl. Polym. Sci. 1988, 35, 549–561. [Google Scholar] [CrossRef]
  52. Cousin, P.; Smith, P. Dynamic mechanical properties of sulfonated polystyrene/alumina composites. J. Polym. Sci. Part B Polym. Phys. 1994, 32, 459–468. [Google Scholar] [CrossRef]
  53. Kendall, K.; Sherliker, F.R. Colloidal reinforcement: The influence of bound polymer. Brit. Polym. J. 1980, 12, 85. [Google Scholar] [CrossRef]
Figure 1. Percolation curve for different thickness samples of PMMA–Cu (3.25–4.75 μm) composites.
Crystals 13 00368 g001
Figure 2. Percolation curve for different thickness samples of PMMA–Cu (78 nm) composites.
Crystals 13 00368 g002
Figure 3. SEM copper–PMMA composites. (a) 2% v/v Cu 78 nm, (b) 30% v/v Cu 78 nm, (c) 2% v/v Cu 3.25–4.75 µm, and (d) 30% v/v Cu 3.25–4.75 µm.
Crystals 13 00368 g003
Figure 4. Micrograph of micrometric Cu–PMMA composites (3.25–4.75 μm): (a) 5 vol.% Cu, (b) 10 vol.% Cu, and (c) 20 vol.% Cu.
Crystals 13 00368 g004
Figure 5. Micrographs of nanometric Cu–PMMA composites (78 nm): (a) 5 vol.% Cu, (b) 10 vol.% Cu, and (c) 20 vol.% Cu.
Crystals 13 00368 g005
Figure 6. Stress versus strain curves for 1 mm/min strain rate; 78 nm Cu–PMMA composites.
Crystals 13 00368 g006
Figure 7. Stress versus strain curves for 1 mm/min strain rate; 3.25–4.75 um Cu–PMMA composites.
Crystals 13 00368 g007
Figure 8. Young’s modulus of 78 nm-filled (⬤), 3.25–4.75 μm-filled (⭘), and neat PMMA as a function of filler volume percent.
Crystals 13 00368 g008
Figure 9. Glass transition behavior by using thermomechanical (TMA) and differential scanning calorimetry (DSC); 78 nm Cu–PMMA composites.
Crystals 13 00368 g009
Table 1. Molecular weight analysis using viscosimetric measurements of diluted solutions of PMMA as a function of the timed exposure to 400 °C.
Time (min) to 400 °CMolecular Weight (gr/mol)Standard Deviation
043,9001287
543,9001891
1043,8001436
1543,5001562
2542,4001583
Table 2. Density analysis of Cu–PMMA composites as a function of the volumetric concentration of conductive filler.
Cu
(% v/v)
δc Teorica
(g/cm3)
δc Residual
(g/cm3)
Number of SamplesStandard Deviation
2.51.385−0.002530.0035
51.579−0.026830.0423
101.967−0.019830.0389
152.356−0.018830.0443
202.744−0.035630.0479
253.133−0.001530.0047
303.521−0.003530.0123
353.909−0.003130.0122
Table 3. Critical volumetric concentration (Φ) results for both composites for different thickness samples.
Thickness Sample
(mm)
Φc (% v/v)
PMMA–Cu
(3.25–4.75 μm)
Φc (% v/v)
PMMA–Cu
(78 nm)
2.010.0014.80
1.511.5014.80
1.015.0014.90
0.515.0015.00
Table 4. Mechanical data obtained for the composites prepared with both particle sizes (78 nm and 3.25–4.75 μm).
Average Ultimate StrengthStrain to Failure 1% Secant Modulus
(MPa)(% Strain)(MPa)
Cu (% v/v)78 nm3.25–4.75 µm78 nm3.25–4.75 µm78 nm3.25–4.75 µm
075.8875.884.524.5231.8031.80
155.2555.2011.453.7026.6024.28
256.1439.8225.033.0427.0318.82
559.6728.154.482.5128.6614.26
1066.6919.134.332.3028.2110.33
2069.6012.154.131.8929.747.65
Table 5. Glass transition data using thermomechanical (TMA) and differential scanning calorimetry (DSC); 78 nm Copper/PMMA composites.
CompositionTMA—Tg (°C)DSC—Tg (°C)TMA—Tg (°C)DSC—Tg (°C)
Copper/PMMA78 nm Copper/PMMA3.25–4.75 μm Copper/PMMA
Neat PMMA127 ± 1129 ± 3127 ± 1129 ± 3
1 vol %103 ± 2108 ± 2122 ± 2123 ± 2
2 vol %100 ± 2100 ± 1120 ± 1120 ± 1
3 vol %103 ± 1102 ± 2120 ± 1120 ± 2
5 vol %115 ± 1109 ± 1120 ± 1121 ± 1
6 vol %117 ± 2114 ± 2121 ± 1122 ± 2
7 vol %118 ± 2117 ± 2121 ± 2122 ± 2
10 vol %118 ± 2121 ± 3122 ± 2122 ± 3
15 vol %120 ± 3121 ± 3121 ± 1123 ± 3
20 vol %120 ± 3121 ± 2122 ± 3123 ± 2
Disclaimer/Publisher’s Note: The statements, opinions and data contained in all publications are solely those of the individual author(s) and contributor(s) and not of MDPI and/or the editor(s). MDPI and/or the editor(s) disclaim responsibility for any injury to people or property resulting from any ideas, methods, instructions or products referred to in the content.

