Article

Influence of Grain Size on Mechanical Properties of a Refractory High Entropy Alloy under Uniaxial Tension

by
Orlando Deluigi
1,
Felipe Valencia
2,3,
Diego R. Tramontina
1,
Nicolás Amigo
4,
Javier Rojas-Nunez
3,5 and
Eduardo M. Bringa
1,6,*
1
CONICET y Facultad de Ingeniería, Universidad de Mendoza, Mendoza M5500, Argentina
2
Departamento de Computación e Industrias, Facultad de Ciencias de la Ingeniería, Universidad Católica del Maule, Talca 3466706, Chile
3
Centro para el Desarrollo de la Nanociencia y Nanotecnología—CEDENNA, Santiago 9170124, Chile
4
Facultad de Ingeniería, Arquitectura y Diseño, Universidad San Sebastián, Bellavista 7, Santiago 8420524, Chile
5
Departamento de Física, Universidad de Santiago de Chile, USACH, Av. Ecuador 3493, Santiago 9170022, Chile
6
Facultad de Ciencias, Centro de Nanotecnología Aplicada, Universidad Mayor de Chile, Santiago 8580745, Chile
*
Author to whom correspondence should be addressed.
Crystals 2023, 13(2), 357; https://doi.org/10.3390/cryst13020357
Submission received: 30 January 2023 / Revised: 12 February 2023 / Accepted: 13 February 2023 / Published: 19 February 2023

Abstract

:
There is a growing interest in High Entropy Alloys (HEAs) due to their outstanding mechanical properties. Most simulation studies have focused on face-centered cubic (fcc) HEAs; however, bcc HEAs can offer a larger elastic modulus and plastic yielding, thus, becoming possible candidates for the next generation of refractory materials. In this work, we focus on molecular dynamics (MD) simulations of bcc HfNbTaZr nanocrystalline samples, with a grain size (d) between 5 and 17 nm, deformed under tension at 300 K. The elastic modulus increases with the grain size and reaches a plateau near 10 nm. We find the typical inverse Hall–Petch (HP) behavior with yield strength, ultimate tensile stress (UTS), and flow stress increasing with d. Up to 12 nm, there are contributions from dislocations and twins; however, grain boundary (GB) activity dominates deformation. For the 5 nm grains, the GB disorder extends and leads to extensive amorphization and grain size reduction. For  d > 10 nm, there is a HP-type behavior with dislocations and twinning controlling deformation. For this regime, there is hardening at large strains. Compared to bcc single metal samples, the HP maximum of this HEA appears at a lower grain size, and this could be related to the chemical complexity facilitating dislocation nucleation. We use machine learning to help understand deformation regimes. We also compare our results to a single crystal (SC) HfNbTaZr HEA deformed along [001] and find that the single crystal is weaker than the nanocrystalline samples. The single crystal deforms initially by twinning and then rapidly by dislocation multiplication, leading to strong hardening. It has been proposed that edge dislocations play a major role in bcc HEA plasticity, and we also analyze the relative contributions of edge versus screw dislocations during deformation for both single crystal and nanocrystalline samples.

1. Introduction

High–entropy alloys (HEAs) [1,2] have drawn increasing attention as structural materials due to their remarkable mechanical properties. Strength and ductility are strongly influenced by chemical complexity, together with microstructure and temperature, among other factors [3,4,5,6,7]. Such features have encouraged researchers to perform a vast number of studies to elucidate the relationship between the properties and atomic-level structure.
In general, HEAs are polycrystalline, and it is well known that the mechanical properties of metals and metallic alloys can be tuned by controlling the grain size to modify the strength and ductility. As established by the Hall–Petch (HP) effect [8,9,10], strengthening can be achieved through grain refinement. Nevertheless, metals can become softer when the grain size is below a critical value, typically in the range of 10–30 nm, leading to an inverse Hall–Petch (iHP) relationship in nanocrystalline (nc) materials due to enhanced grain boundary (GB) activity [10,11].
There is a need to increase the strength and ductility of materials for technological applications, and that search has led to new materials and the exploration of new deformation regimes. For instance, the iHP effect was shown to be suppressed by high pressure, in a combination of experiments on nc Ni and simulations for nc Cu [12]. This effect was recently re-discovered for nc Ni experiments [13]. Enhancement of the HP hardening was recently observed in nc FeNi by experiments and simulations [14].
Most of the studies of mechanical properties versus grain size deal with face-centered cubic (fcc) single metals and binary alloys [15,16,17,18]. There are fewer studies for grain-size effects on the mechanical properties of single component body-centered cubic (bcc) materials with experiments [9] and atomistic molecular dynamics (MD) simulations [19,20,21] for several metals. For example, Tang et al. simulated Ta under tension without observing significant dislocation or twinning activity because the material failed with brittle intergranular fracture. It is worth mentioning that a constant lateral size was kept in that study, in contrast to the zero lateral pressure condition [20] used by a recent study on nc Ta, which found a maximum flow stress near 8 nm [21]. The HP effect has been found for other polycrystalline materials, including SiC [22].
In recent years, several studies have been conducted to further explore the mechanical properties and capabilities of HEAs [23]. Comparing experiments and atomistic MD simulations can be challenging, partly due to the high deformation rates and sample size constraints. However, MD simulations can offer valuable insights as shown for the tensile deformation of a CoCrFeNiAlTi HEA [24] or high strain rate fracture of CoCrFeNiMn HEA [25]. There are several studies that have explored polycrystalline HEAs and Multi-principal element alloys (MPEAs) at the atomic scale, however, mostly for fcc HEA. Gupta and co-workers studied HP and iHP in CoCrNi simulations [18].
Cao studied the effect of short-range order (SRO) in CrCoNi alloy and proved that this increased the maximum strength, affecting the deformation microstructure and local plastic strain [26]. Liu et al. reported that tensile stress follows the HP relation for grain sizes larger than 15.0 nm, where plasticity is mediated by partial dislocations and stacking faults (SFs) serve as barriers for dislocation gliding [27]. A nc fcc HEA, Al 0.3 CoCrFeNi, was simulated recently, finding a transition between HP and iHP at 12 nm [28]. Al 0.1 CoCrFeNi was simulated for different grain sizes and temperatures, revealing a transition between iHP and HP near 15 nm at 300 K [29].
There are several experimental studies of grain size effects in refractory HEAs as in HfNbTaZrTi [30,31]. However, there is a lack of studies for grain sizes below 1 micron, reaching into the iHP regime. Regarding simulations of grain size effects on the mechanical properties, Chen et al. observed HP and iHP relations in simulations of CoNiFeAl 0.3 Cu 0.7 (fcc) and CoNiFeAl 0.7 Cu 0.3 (bcc) under uniaxial compression, and they found the crossover values of 12.1 nm (fcc) and 18.9 nm (bcc) [32].
Roy et al. found a crossover value of 23.2 nm for bcc multi-principal element alloys (MPEAs) composed of (Mo 0.95 W 0.05 ) 0.85 Ta 0.10 (TiZr) 0.05 [33]. Due to the prevalence of Mo in the composition, this might not be considered a HEA. Recently, nc bcc NbMoTaWV HEA was simulated under tension for several grain sizes, and it was argued that nucleation of the fcc phase was important for plasticity [34]. Finally, grain size effects in a medium-entropy alloy, NbTaZr, were explored, finding nearly constant flow stress for grains with size 8–20 nm under tensile stress at 300 K and  10 9 s 1 [35]. Refractory bcc HEAs display outstanding mechanical properties, including high yield strength and reduced degradation at high temperatures, alongside large ductility, and they could be used as structural materials.
There is a growing number of HEAs that can be synthesized and that are being experimentally probed [3,36]; however, atomistic simulations are lagging experimental advances partly due to a lack of reliable interatomic potentials [4]. In this work, we perform MD simulations to study tensile tests on nc bcc HfNbTaZr HEA samples with different grain sizes. The microstructure evolution is inspected by means of dislocation analysis and local orientation, while several mechanical properties are calculated. Furthermore, machine learning (ML) methods are employed to identify both grain and GBs, providing a framework for grain size evaluation.

2. Methods

The study of a nc HfNbTaZr high entropy alloy was conducted with MD simulations performed with the LAMMPS code [37]. We model an equiatomic alloy to maximize the mixing entropy. The choice of HfNbTaZr is influenced by the availability of a reliable interatomic potential for mechanical behavior. The interaction between atoms was modeled using the embedded atom method (EAM) potential proposed by Maiti and Steurer [38]. This potential was chosen because it provides a reasonable description of dislocations [39]. In addition, Aquistapace and coworkers [40] proved that this interatomic potential describes mechanical properties accurately in comparison with experiments, showing also that elastic constants behave smoothly with pressures up to 60 GPa with the bcc phase as the lowest energy configuration for hydrostatic pressures of at least 20 GPa.
System visualization was performed using the Open Visualization Tool (OVITO) [41]. Defect identification was performed using common neighbor analysis (CNA) [42] and Polyhedral Template Matching (PTM) [43] with the root-mean-square deviation (RMSD) = 0.1–0.15 as implemented in OVITO. We also performed atomic shear strain calculations using the atomic strain tool from OVITO to measure the atomic deformation gradients and the strain tensor at each particle. To quantify dislocation junctions, we used the crystal analysis tool (CAT) [44].
Identification and classification of dislocations were performed using the dislocation extraction algorithm (DXA) [45] implemented in OVITO. If DXA is used in the whole sample, a large initial dislocation density is obtained, even if there are no dislocations inside grains, because there are many dislocation networks at several GBs as has been observed in other bcc HEA [33]. As an approximation, this initial density at zero strain can be subtracted at finite strains; however, this can lead to significant errors. To improve on this, we first removed non-bcc atoms from GBs and then applied DXA. For selected cases, we verified that this does not reduce the number of segments and dislocation line length inside grains, thereby, providing a good measure of dislocation density during deformation.

2.1. Sample Construction
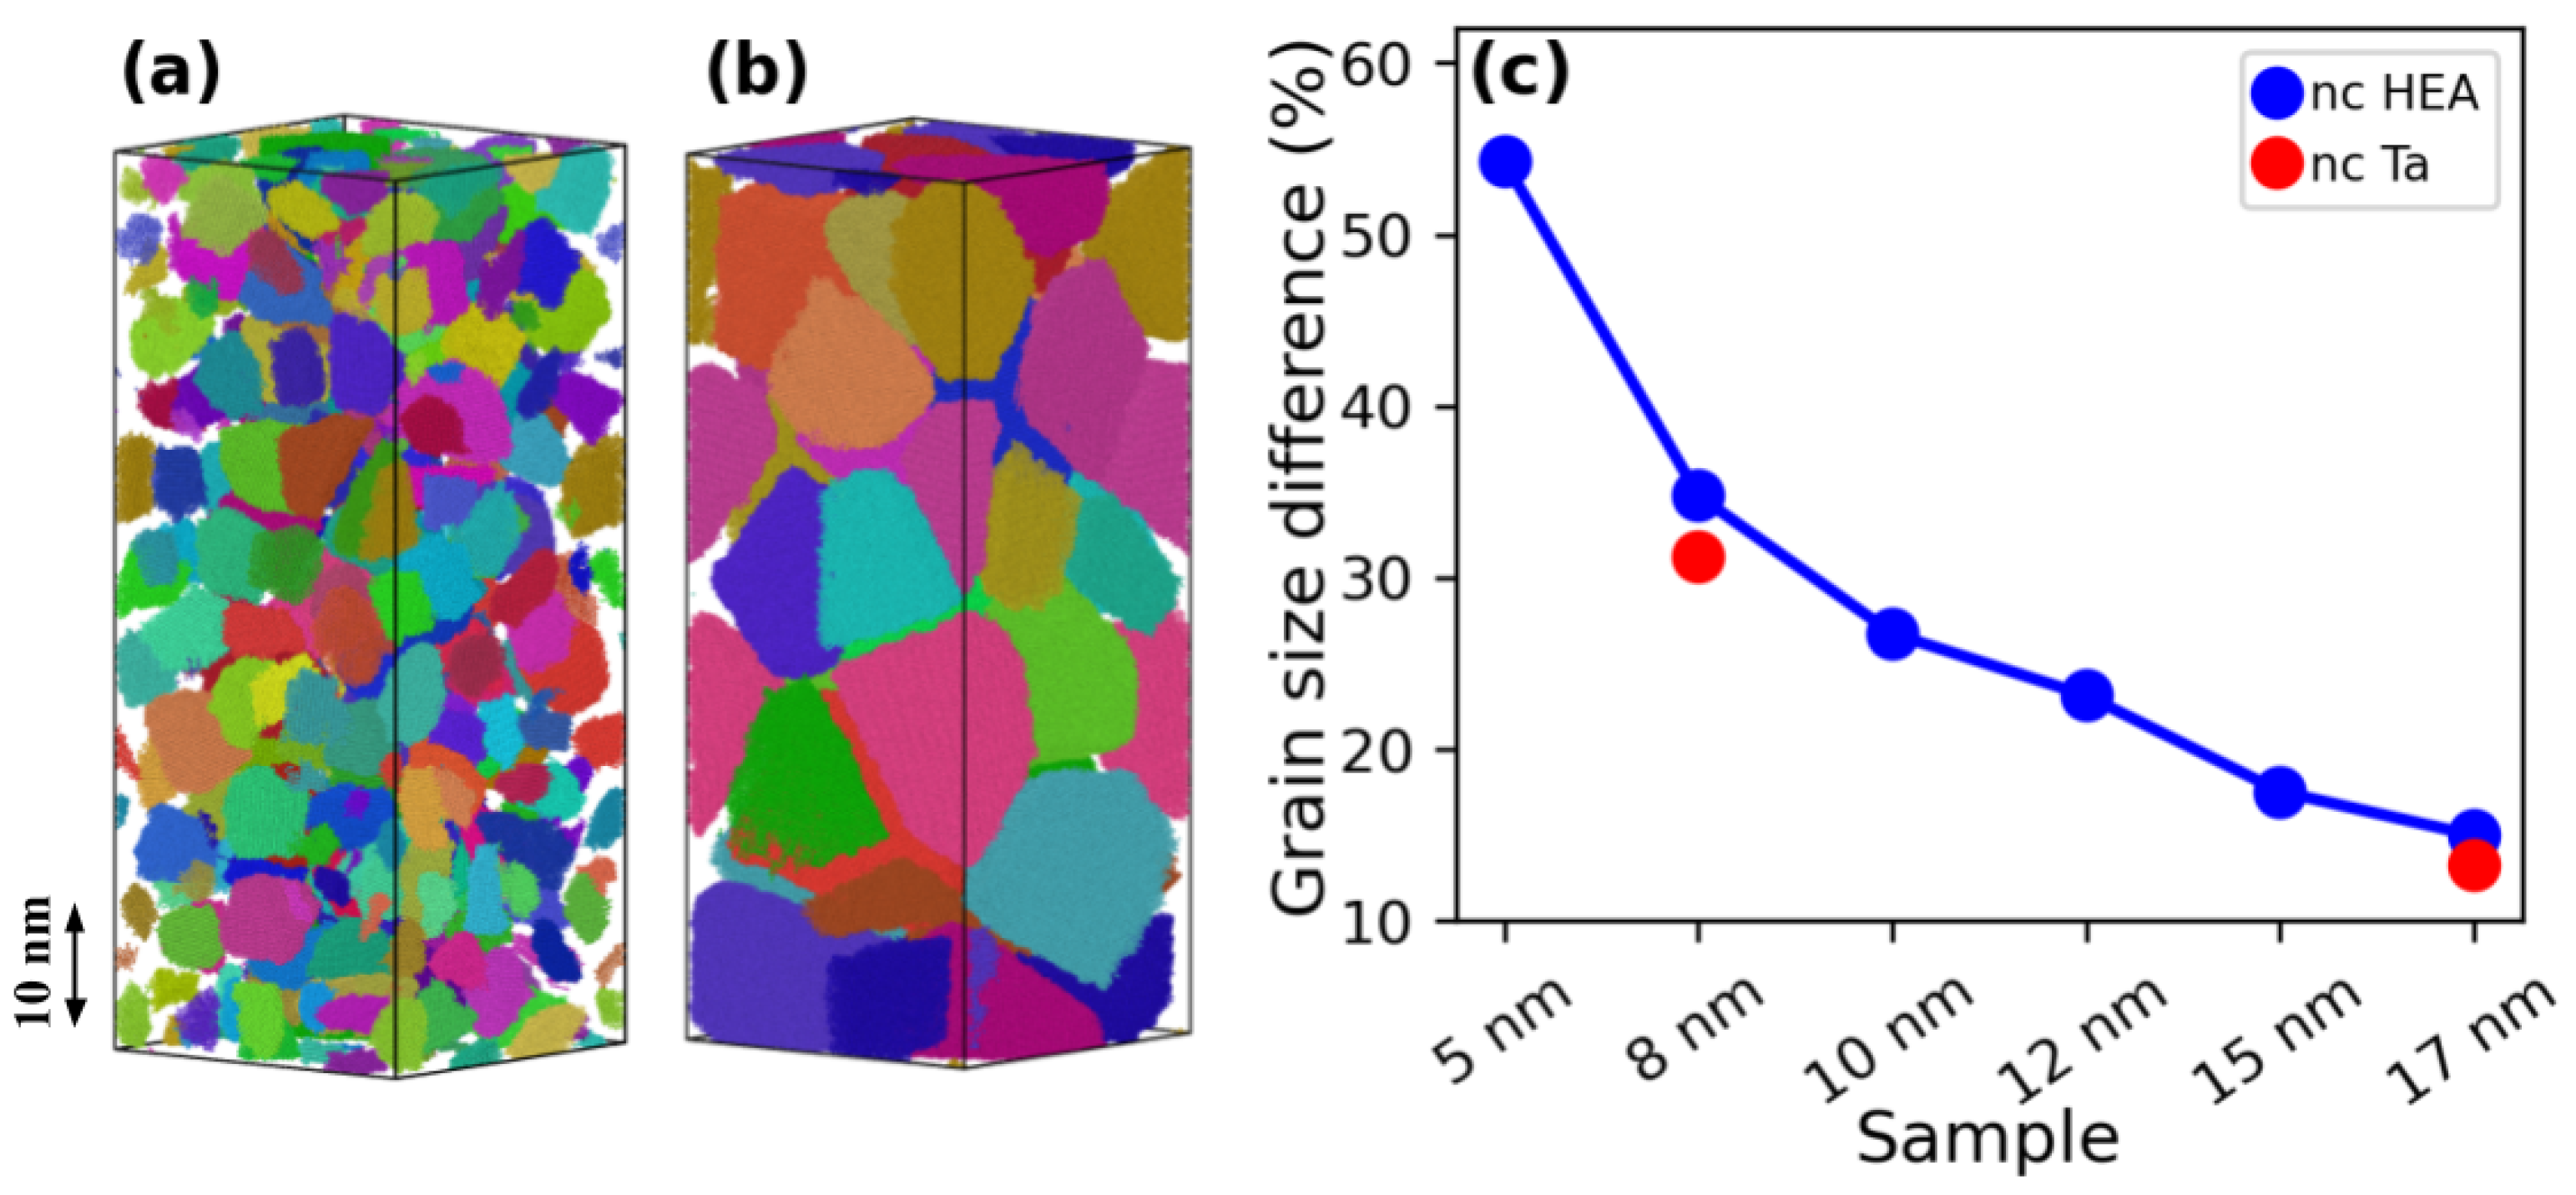
The nc bcc HEA was constructed by means of the Voronoi tessellation algorithm proposed by Lin et al. [46]. nc with grains sizes of 5, 8, 10, 12, 15, and 17 nm were built in a simulation cell with sizes of  80 a 0 × 80 a 0 × 200 a 0 with  a 0 the HEA lattice parameter of 3.63 Å. To construct the nc HfNbZrTa HEA, atoms were randomly assigned with the constraint to obtain an equiatomic alloy. Each one of the simulated nc HEA contains approximately ≈ 2,560,000 atoms. The 8 nm grain size sample initially contained 220 grains, and the 17 nm sample contained 23 grains, large enough to ensure a reliable calculation of the mechanical properties.
The single crystal (SC) bcc HEA was constructed with the same lattice parameter mentioned above, and it is oriented along the principal low-index directions. Nanosystems can display mechanical properties with strong sample size dependence [47,48,49]. We conducted bulk simulations where the sample size should not be relevant for large enough samples, including tens of grains for the case of polycrystals as is the case for our simulations. For the single crystal, the sample has to be able to accommodate different slip planes and twin variants, and we show that our sample is indeed able to do that in the Results section.
Typically, the construction of a Voronoi crystal leads to stress localization due to the partial overlap of GB atoms, which can be accentuated due to the chemical complexity of the HEAs. Thus, relaxation was performed by removing, in the first stage, all atoms with overlap smaller than 0.1 nm. Then, an energy minimization coupled with a box/relax algorithm was conducted to achieve a minimum energy structure with zero pressure. The local minimum obtained was relaxed dynamically during 0.2 ns by raising the nc temperature to 600 K using a Nosé–Hoover thermostat coupled with a zero pressure barostat.
To ensure a relaxed structure, the zero pressure barostat was applied independently in each principal direction. Finally, the system was cooled to 300 K for another 0.2 ns. As a result of the relaxation process, the global stress was zero, and the local residual stress decreased significantly. The grain size was somewhat reduced due to the rearrangement of GB atoms. During the relaxation process, a timestep of 1.0 fs and periodic boundary conditions (PBCs) were adopted.

2.2. Grain Size

It is important to note that our nanocrystal generation code works similarly to many others. All atoms are assigned to a given grain and there are no GB atoms. Grain size is typically obtained by assuming that grains are spherical, calculating the effective diameter for a grain with a given number of atoms [22]. For cubic single-element nanocrystals generated with Voronoi tessellation, this is a fairly good approximation, since GBs are almost single-atom thin. However, nanocrystals obtained from seeded-melt simulations might have thicker GBs [50]. In our case, the chemical complexity of the alloy leads to thick, disordered GBs, and the number of non-crystalline GB atoms is significant as discussed further below.

Determination of Grain Size Using Machine Learning

One of the challenges to determine grain size in cubic systems is the presence of twinning inside grains. There are several strategies to solve this issue, including the one used in the OVITO grain segmentation. However, large levels of disorder can lead to errors in grain size distributions. We developed a strategy to determine grain size in our simulated systems, which include significant disorder. To this aim, random forests (RF) were employed to identify grains and GBs [51]. The framework is described in the following.
A slice of the sample at 0.24 strain was inspected using OVITO and its common neighbor analysis (CNA) tool. Although CNA can recognize crystal structures, such as bcc, fcc, and hcp, it fails to distinguish twins and GBs. From visual inspection, GB atoms were manually selected using OVITO with the support of CNA, and isolated from the rest as shown in Figure S1 in the Supplementary Materials.
Thus, two groups of atoms were obtained, one corresponding to GB atoms and the other to grain atoms. RF was trained with these groups in order to establish an algorithm that can predict whether an atom belongs to GB or to grain. Potential energy, coordination number, atomic volume, per–atom entropy [52], centrosymmetry parameter [53], and Steinhardt parameters [54] were used as features. More details on the machine-learning pipeline can be found in the Supplementary Materials.
Following the RF algorithm, GB and grain atoms were identified during each step of the tension test. Grains were isolated by removing GB atoms, and then the grain segmentation tool in OVITO was used to obtain each grain size. It is important to mention that some atoms were incorrectly classified by RF, resulting in interconnected grains even after the removal of GB atoms, hindering the process of grain segmentation. To overcome this problem, the incorrectly classified atoms were manually removed. The segmentation for the 8 and 17 nm samples are shown in Figure 1a,b, respectively. The grain size was estimated from the number of atoms to volume ratio for the bcc unit cell and the grain as follows:
2 a 0 3 = N a 4 3 π d 2 3 d = 2 a 0 3 N a 8 π 3 ,
where  a 0 is the lattice parameter of the bcc unit cell of the HEA,  N a is the number of atoms in a grain, and d is the estimated grain diameter. Figure 1c shows the resulting average grain diameters (real diameters) and the nominal diameters at zero strain. In all cases, the real diameter is smaller than the nominal, which can be attributed to the chemical complexity that leads to thicker GBs. For comparison, nc Ta samples with exactly the same topology are also included, where the difference between real, and the nominal diameters are slightly smaller. Recently, another method for grain segmentation has been proposed. Vimal et al. developed an unsupervised learning algorithm called Orisodata, which is based on iterative self-organizing data analysis that works in the orientation space [55]. We expect to assess the performance of both Orisodata and our methodology in the near future.
The discrepancy between a “target” simulated grain size and the actual size of crystallites is usually neglected but would be crucial to fit any model involving grain size, including constitutive models for plastic yielding Hall–Petch style [9], size-dependent thermal properties, such as melting. Given that grain size is a dynamic variable, for simplicity, in the results section, we report values including the ultimate yield strength versus the nominal grain size.

2.3. Grain Orientation and Misorientation

In order to evaluate misorientation, the quaternions obtained for each atom by PTM were transformed into Rodrigues vectors [56]. A more complex approach to lattice rotations was recently presented by Mishra et al. [57], and alternative implementations have been used for bcc [58,59] and fcc [60] samples. The misorientation angle between the vector at a given strain and the reference vector, taken as the vector at zero strain for this work, was calculated from the dot vector product and the module of both vectors.
A histogram of misorientation angles revealed that a fraction of the sample retains the original orientation; however, some regions show a well-defined rotation due to twin boundaries, and also due to twin-variants. Standard twin-boundary detection techniques, based on structural identification, such as the one used by CAT, do not allow a direct evaluation of twin volume. Here, in order to quantify twin volume fractions, we considered rotations larger than 5 degrees. Using PTM, we selected only bcc atoms to eliminate twin boundaries.

2.4. Simulation Protocol for Mechanical Deformation

Mechanical behavior under tension is important for many technological applications; however, due to computational cost, it is difficult to conduct MD simulations of mechanical deformation for strain rates below ∼ 10 8 s 1 . Recent tensile simulations of a defective HfNbTaZr single crystal under uniaxial loading showed an increased plastic yield when increasing the rate from  10 8 s 1 to  10 9 s 1 , as expected [40]. In this work, uniaxial loading was performed inducing a homogeneous tensile deformation along the z-axis with a constant strain rate of  2 × 10 8 s 1 .
To this aim, the positions of atoms are remapped by an affine transformation each time step to match the box deformation following the “fix deform” functionality in LAMMPS [37]. All samples were simulated using PBCs [61]. Some uniaxial tension studies at high strain rates were performed with non-zero lateral stress [40,47]. In our case, the system pressure in x and y axis was set to zero. The system temperature was kept at 300 K during the whole deformation process using a velocity re-scaling thermostat. Samples were deformed until a maximum strain of 0.4 was achieved. A strain of 0.4 indicates a 40% strain [47]. A timestep of 1.0 fs was employed during the tensile tests.

3. Results

Below, we present the results for the stress–strain response under tension and then discuss the contributions of GB activity, dislocations, and twinning.

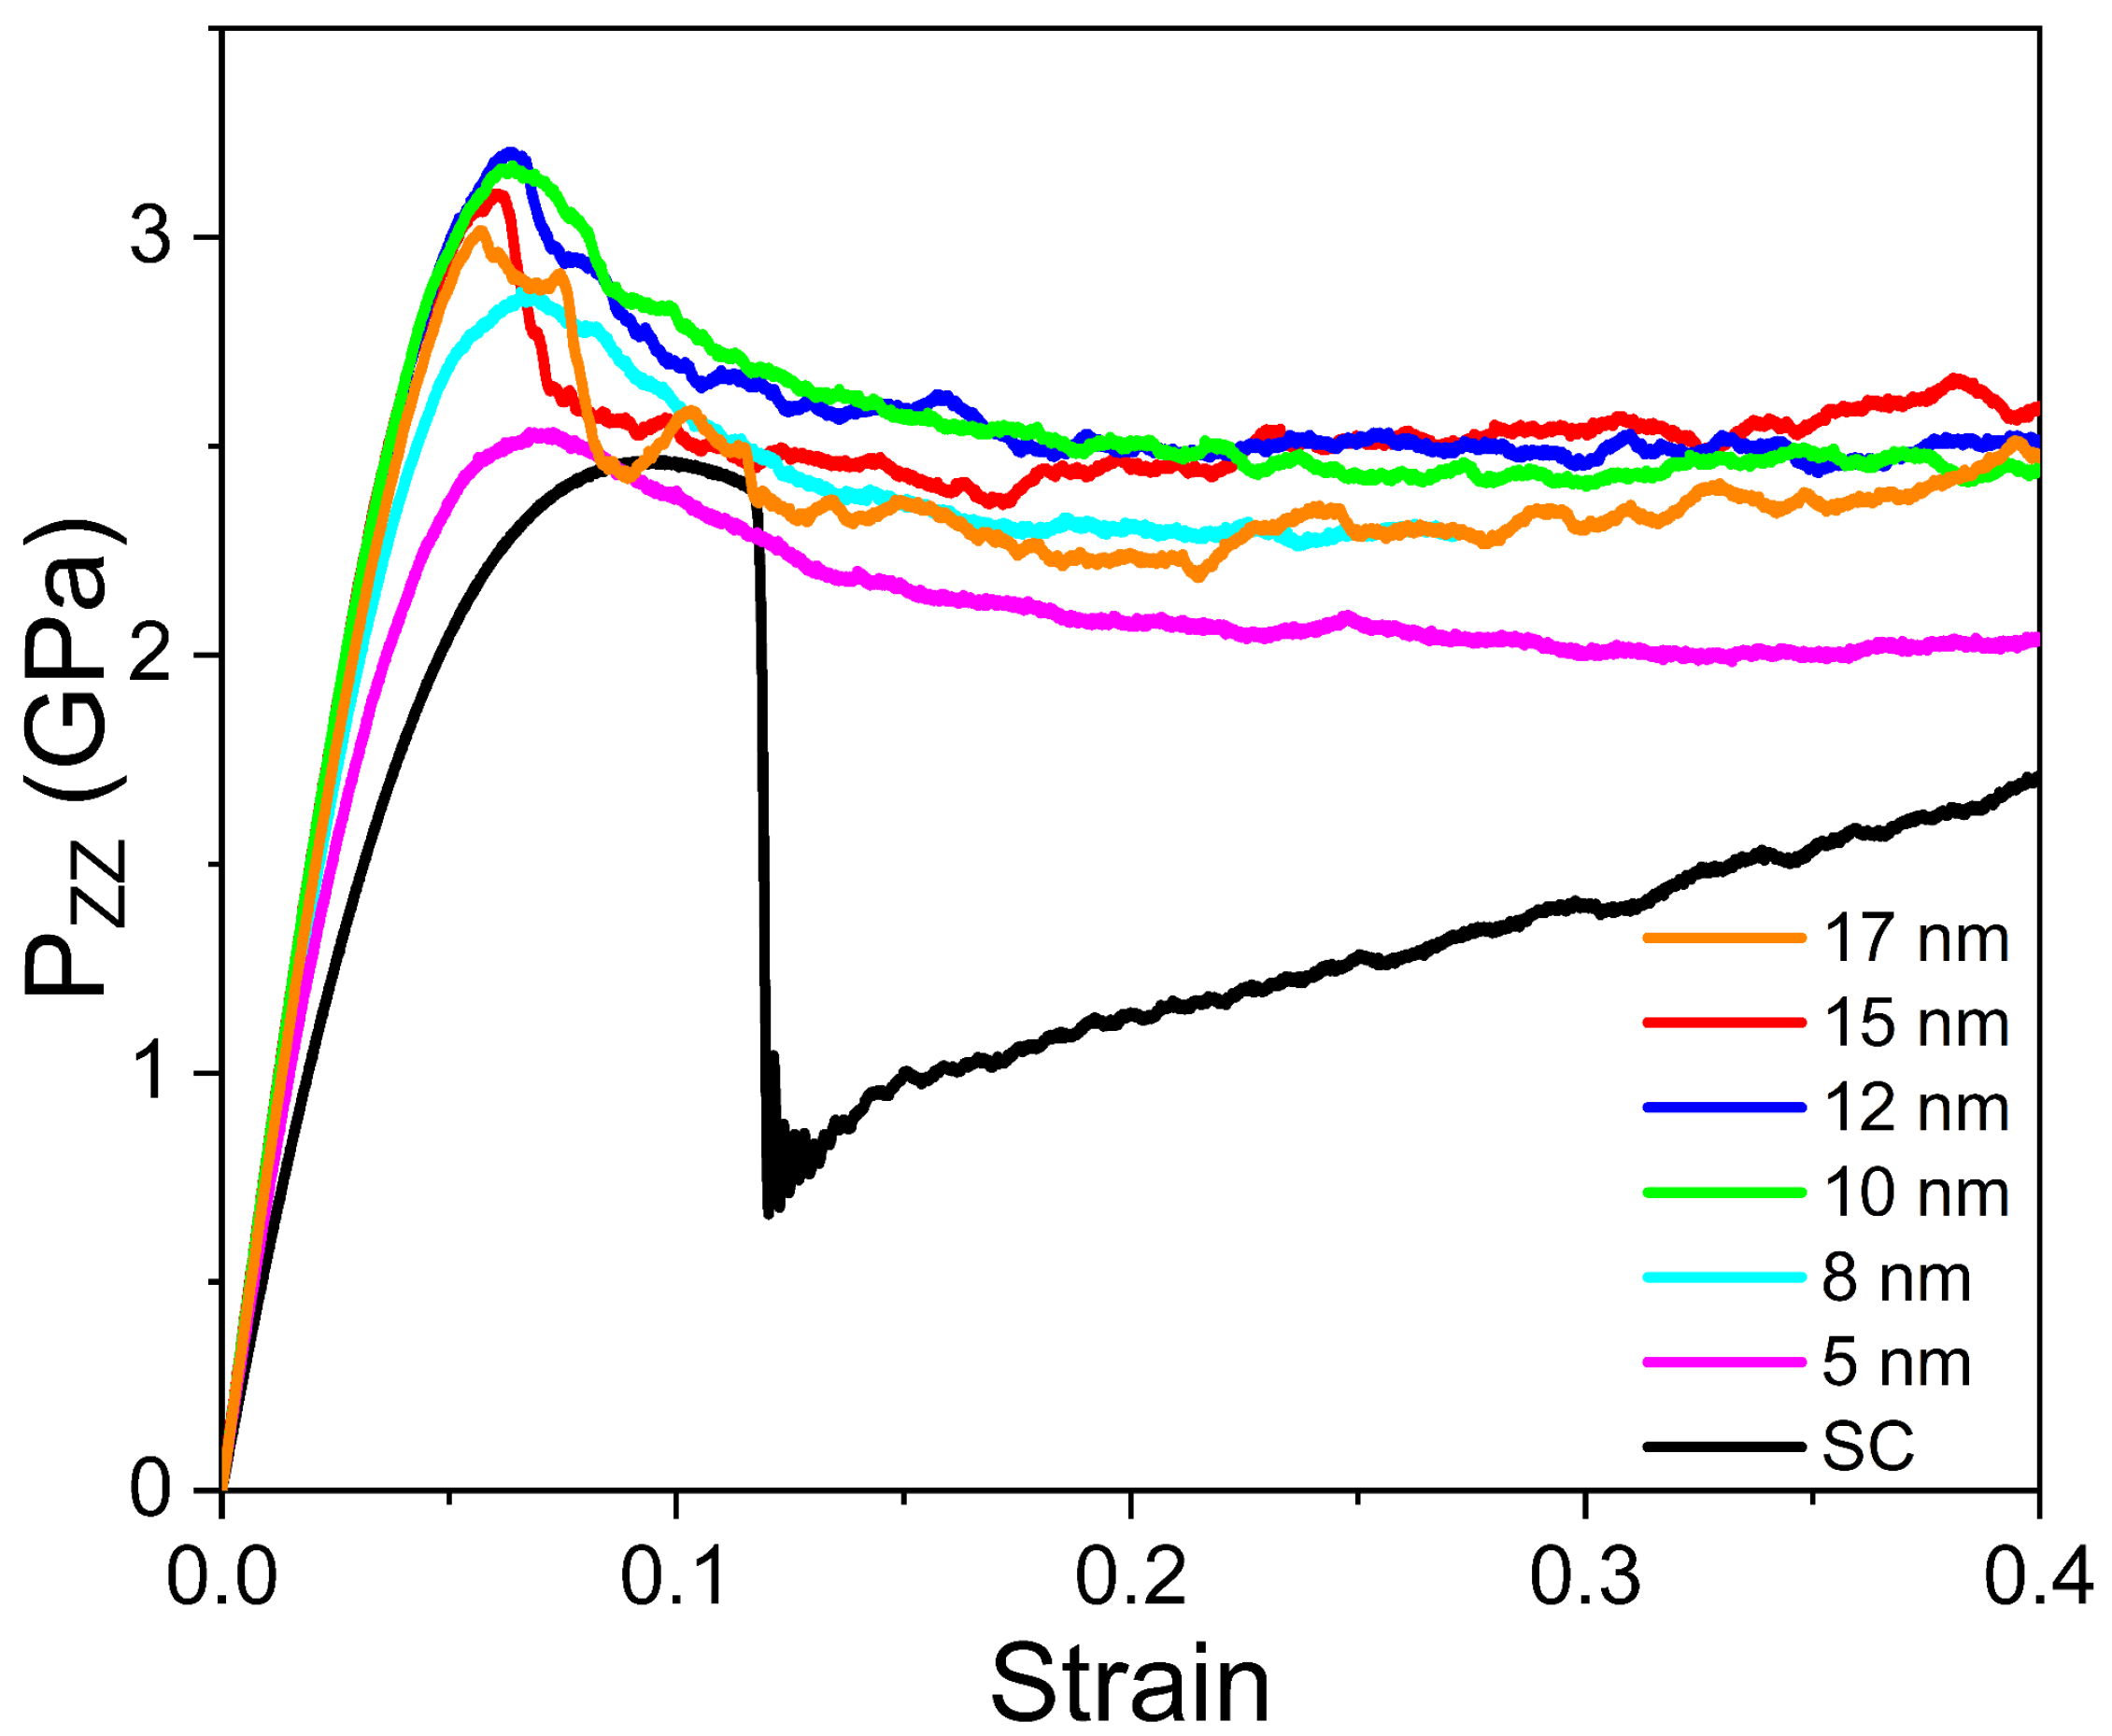
3.1. Stress–Strain Response

Tensile stress–strain plots for all our simulations with different grain sizes, together with the SC case, are shown in Figure 2. These curves present a linear quasi-elastic regime, followed by a non-linear elastic regime, which ends with a stress drop due to dislocation and twin nucleation, and finally a stress plateau. The SC also shows linear and non-linear elastic regimes. Typical interatomic potentials include complex interactions with a force-displacement response, which is generally non-linear even at relatively low strains, despite being completely reversible upon release and, therefore, elastic.
For a nanocrystal, there is always some level of grain boundary activity, which is plastic; however, this is negligible at small strains, and the non-linear response is mostly due to the non-linear elastic behavior of the material. We note the [001] SC presents the lowest peak stress as could be expected from that “soft” direction with many slip systems available for the applied deformation. The nc sample with a grain size of 12 nm presents the highest stress.
For 15 and 17 nm grains and the SC, there is hardening instead of a plateau. Hardening with strain is often assumed to be described by  σ ϵ α . The hardening exponent  α is slightly below 1 for the nc samples. These behaviors are different from the ones obtained for nanograined Ta by Tang and coworkers [20], which observed brittle fracture and grain decohesion. Experimental polycrystal Ta samples with micron-sized grains showed hardening at large strains [62]. Experiments on compression of HfNbTaZrTi showed significant hardening at room temperature [63].
To obtain the elastic modulus, we fit the slope of the stress–strain curve until 0.05 strain—well within the linear regime, for all cases. The results are shown in Figure 3a. The elastic modulus of nc Ta was found to increase with the grain size with  E 100 GPa for 8 nm grains [21]. The elastic modulus for a [001] cubic SC is typically lower than those for other crystalline directions. Therefore, it is expected that nc samples, which include many different crystalline orientations will have a higher elastic modulus, as confirmed by our simulations.
In simulations with purely uniaxial deformation, keeping the lateral boundaries fixed would give much larger values for the elastic modulus. For instance, using the zero lateral pressure conditions from this study, the SC modulus for [001] deformation is 58 GPa. However, using fixed boundaries, we obtain an elastic modulus of 158 GPa. Recently, SC samples of HfNbTaZr with a spherical void under [001] purely uniaxial tension were reported to have an elastic modulus close to 38 GPa [40], much lower than reported here.
This is because that modulus was calculated from the slope of the von Mises stress, which was significantly smaller than the uniaxial stress for those simulations. If experimental values of the elastic modulus are used, and the rule of mixtures is employed to estimate the elastic modulus, a value of 110 GPa is obtained. This rule neglects the role of interfaces softening the modulus, and therefore it is reasonable that it gives a higher value than the one in our simulations.
Nanocrystals can present GB plasticity starting at very low strain. We calculated the yield stress by considering the 0.2% offset method [64,65] with a slope given by E, resulting in the values shown in Figure 3b. If we increase the grain size from 5 to 12 nm, the yield stress increases from 1.28 to 1.77 GPa and then decreases to 1.69 GPa if we continue increasing to 17 nm. For reference, the yield strength for HfNbTaZrTi with a grain size near 100 microns was found to be 0.93 GPa at low strain rate [63], and the yield strength of other bcc HEA falls in the range of 1–1.7 GPa [4]. Using this method, the SC would have a low yield stress of 1.06 GPa, and this is what is shown in Figure 3b. However, the SC actually yields by twinning at a much larger strain and  2 GPa.
The HP relationship can be used to quantify the variation of strength with grain size [9,10,66,67]:
σ y = σ 0 + k d 1 / 2 ,
Here,  σ y is the yield stress  ( G P a ) σ 0 is a baseline “friction” stress  ( G P a ) , k is the stress concentration coefficient  ( G P a n m 1 / 2 ) , and d is the average grain size  ( n m ) . The original model was related to dislocation pile-ups at GBs [66,67]; however, other related formulations have been proposed [9]. The softening observed at small grain sizes is generally attributed to GB activity and named iHP; however, there is no generally accepted equation to describe it. For simplicity, sometimes the HP equation is also used [32,33], and we adopt that approach. We note that the exponent  1 / 2 is sometimes taken as an additional parameter. For instance, compression of bcc Al 0.7 CoCrFeNi HEA nanopillars results in an exponent of 0.33 at room temperature [49]. It was suggested that the HP slope should approach unity at the nanoscale [68].
In Figure 3b,  σ Y 1 and  σ Y 2 represent the HP and the iHP relationships, and their fit parameters are presented in Table 1. The crossover grain size value between HP and iHP appears for a grain size of 12–13 nm for HfNbTaZr. This value is similar to MD simulations results for  C o N i F e A l 0.3 C u 0.7 fcc HEA but lower than the  C o N i F e A l 0.7 C u 0.3 bcc HEA studied by Chen et al. [32].
In what follows, all HP slopes, k, are given in units of GPa/nm 0.5 , adequate for MD; however, in experiments, it is usually given in MPa/ μ m 0.5 . The conversion factor is 31.6 to reach experimental units. Our simulation results for the yield stress found a friction stress of 0.8 GPa with a HP slope  k = 3.7 in MD simulations of nc bcc CoNiFeAl 0.7 Cu 0.3 under tension  k = 6.3 [32], nearly twice our value.
Regarding the experiments, the friction stress for the pure metals in our simulated alloy is around 0.1–0.2 GPa with the HP slope around 6–10, except for Ta with a slope ∼25 [9]. Experimental results for NbTaHfZrTi with micron-sized grains give an HP slope of 7.5–8.5 and a friction stress close to 0.9–1.1 GPa [30,31]. k can be estimated using a model, which requires the shear modulus of the material and the critical stress at the dislocation pile-up at a GB [8]. Assuming this critical stress to be 1 GPa gives k several times larger than our MD result.
The ultimate tensile strength (UTS) also presents a HP-type behavior in Figure 3c with a maximum of 3.2 GPa for a grain size of 12 nm. Fit parameters also appear in Table 1. Figure 3d shows the flow stress as a function of grain size with a maximum at 15 nm. Similar behavior was found in simulations for other fcc HEAs [27,69], and for bcc nc Fe [19]. However, a larger crossover grain size and flow stress were found for other simulated bcc alloys, such as the MPEA (Mo 0.95 W 0.05 ) 0.85 Ta 0.10 (TiZr) 0.05 [33] and the NbMoTaWV HEA [34]. HP and iHP parameters for the flow stress are presented in Table 1. Flow stress can be affected by the short range order (SRO), as seen for a CrCoNi alloy [26]; however, strain did not lead to changes in SRO in our samples. Recently, the flow stress for nc Ta under tension was found to have a maximum value 4 GPa for 8 nm grains [21].
Poisson’s ratio is  ν = 0.4 for the nc samples studied here, which is similar to the single crystal value,  ν = 0.41 [40]. In our simulations,  ν only changes slightly with strain as found for nc Fe [19]. This is larger than the value of  ν = 0.35 for Ta but similar to the values for nc Fe,  ν = 0.38 0.4 . Details on the sample structural evolution that explain the stress–strain curves are discussed below.

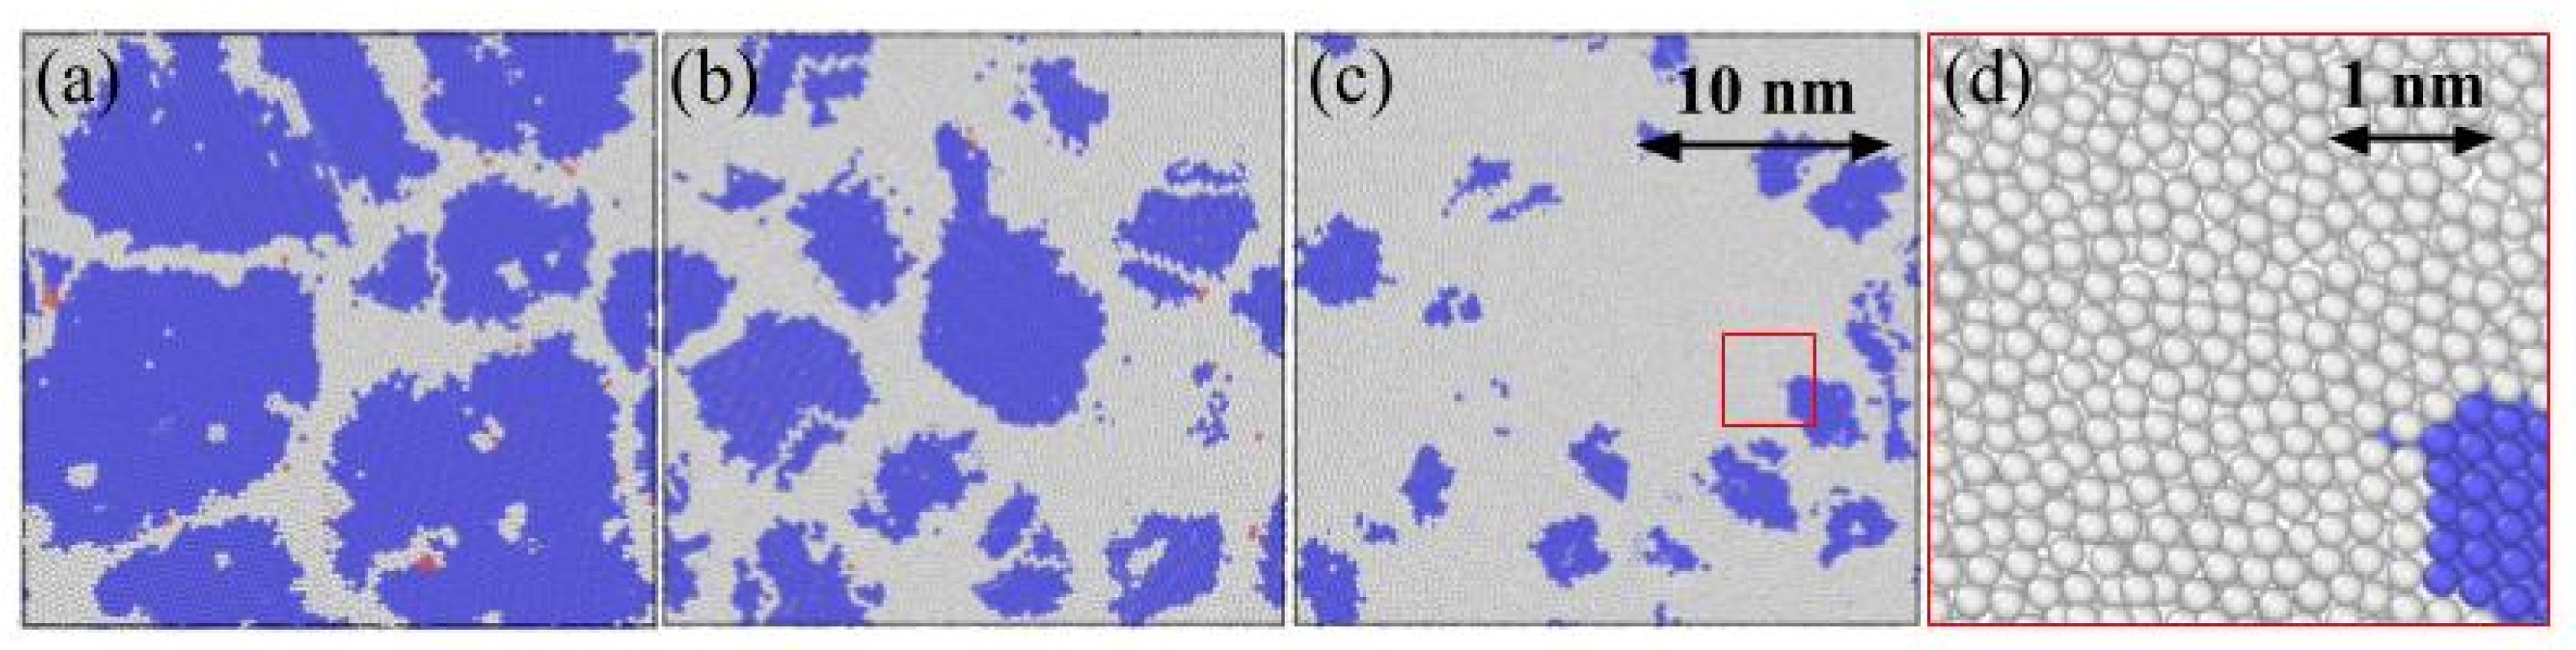
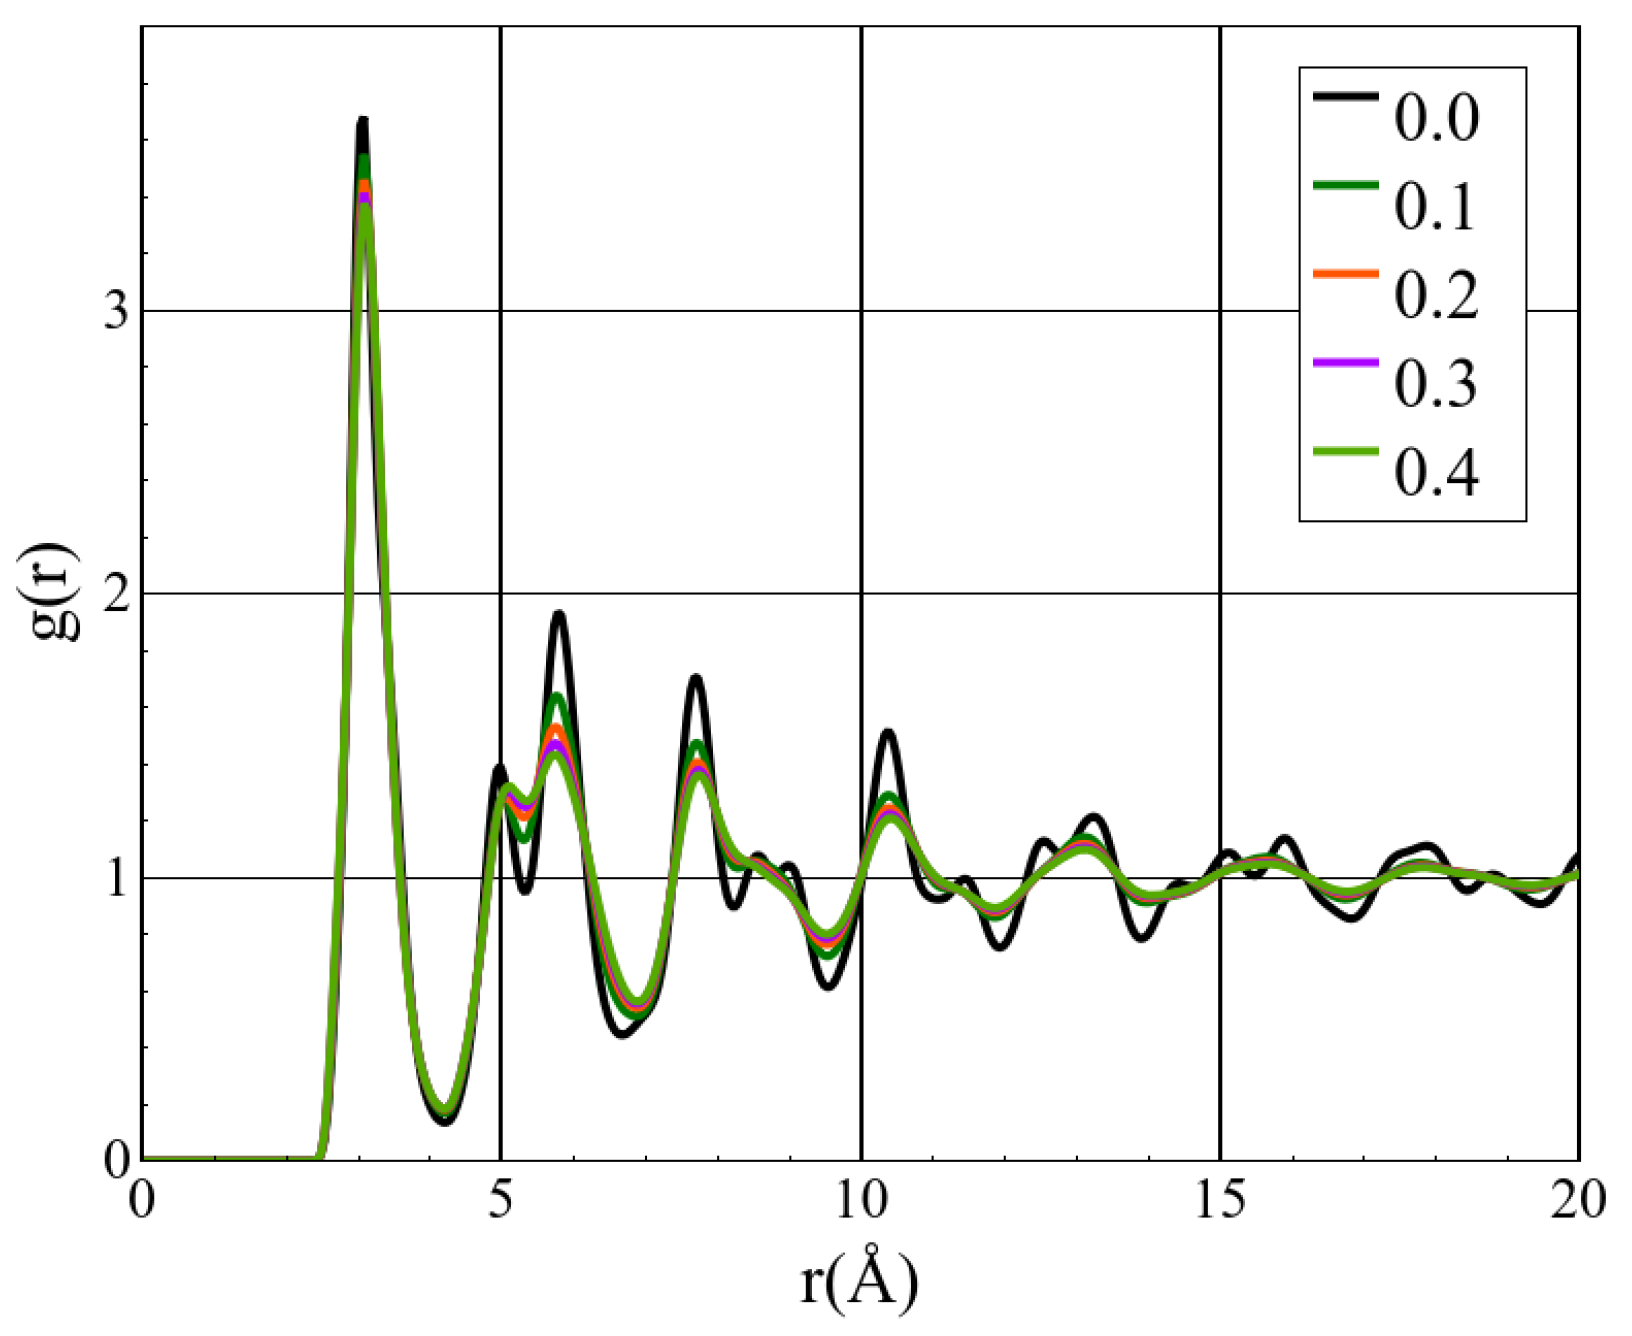
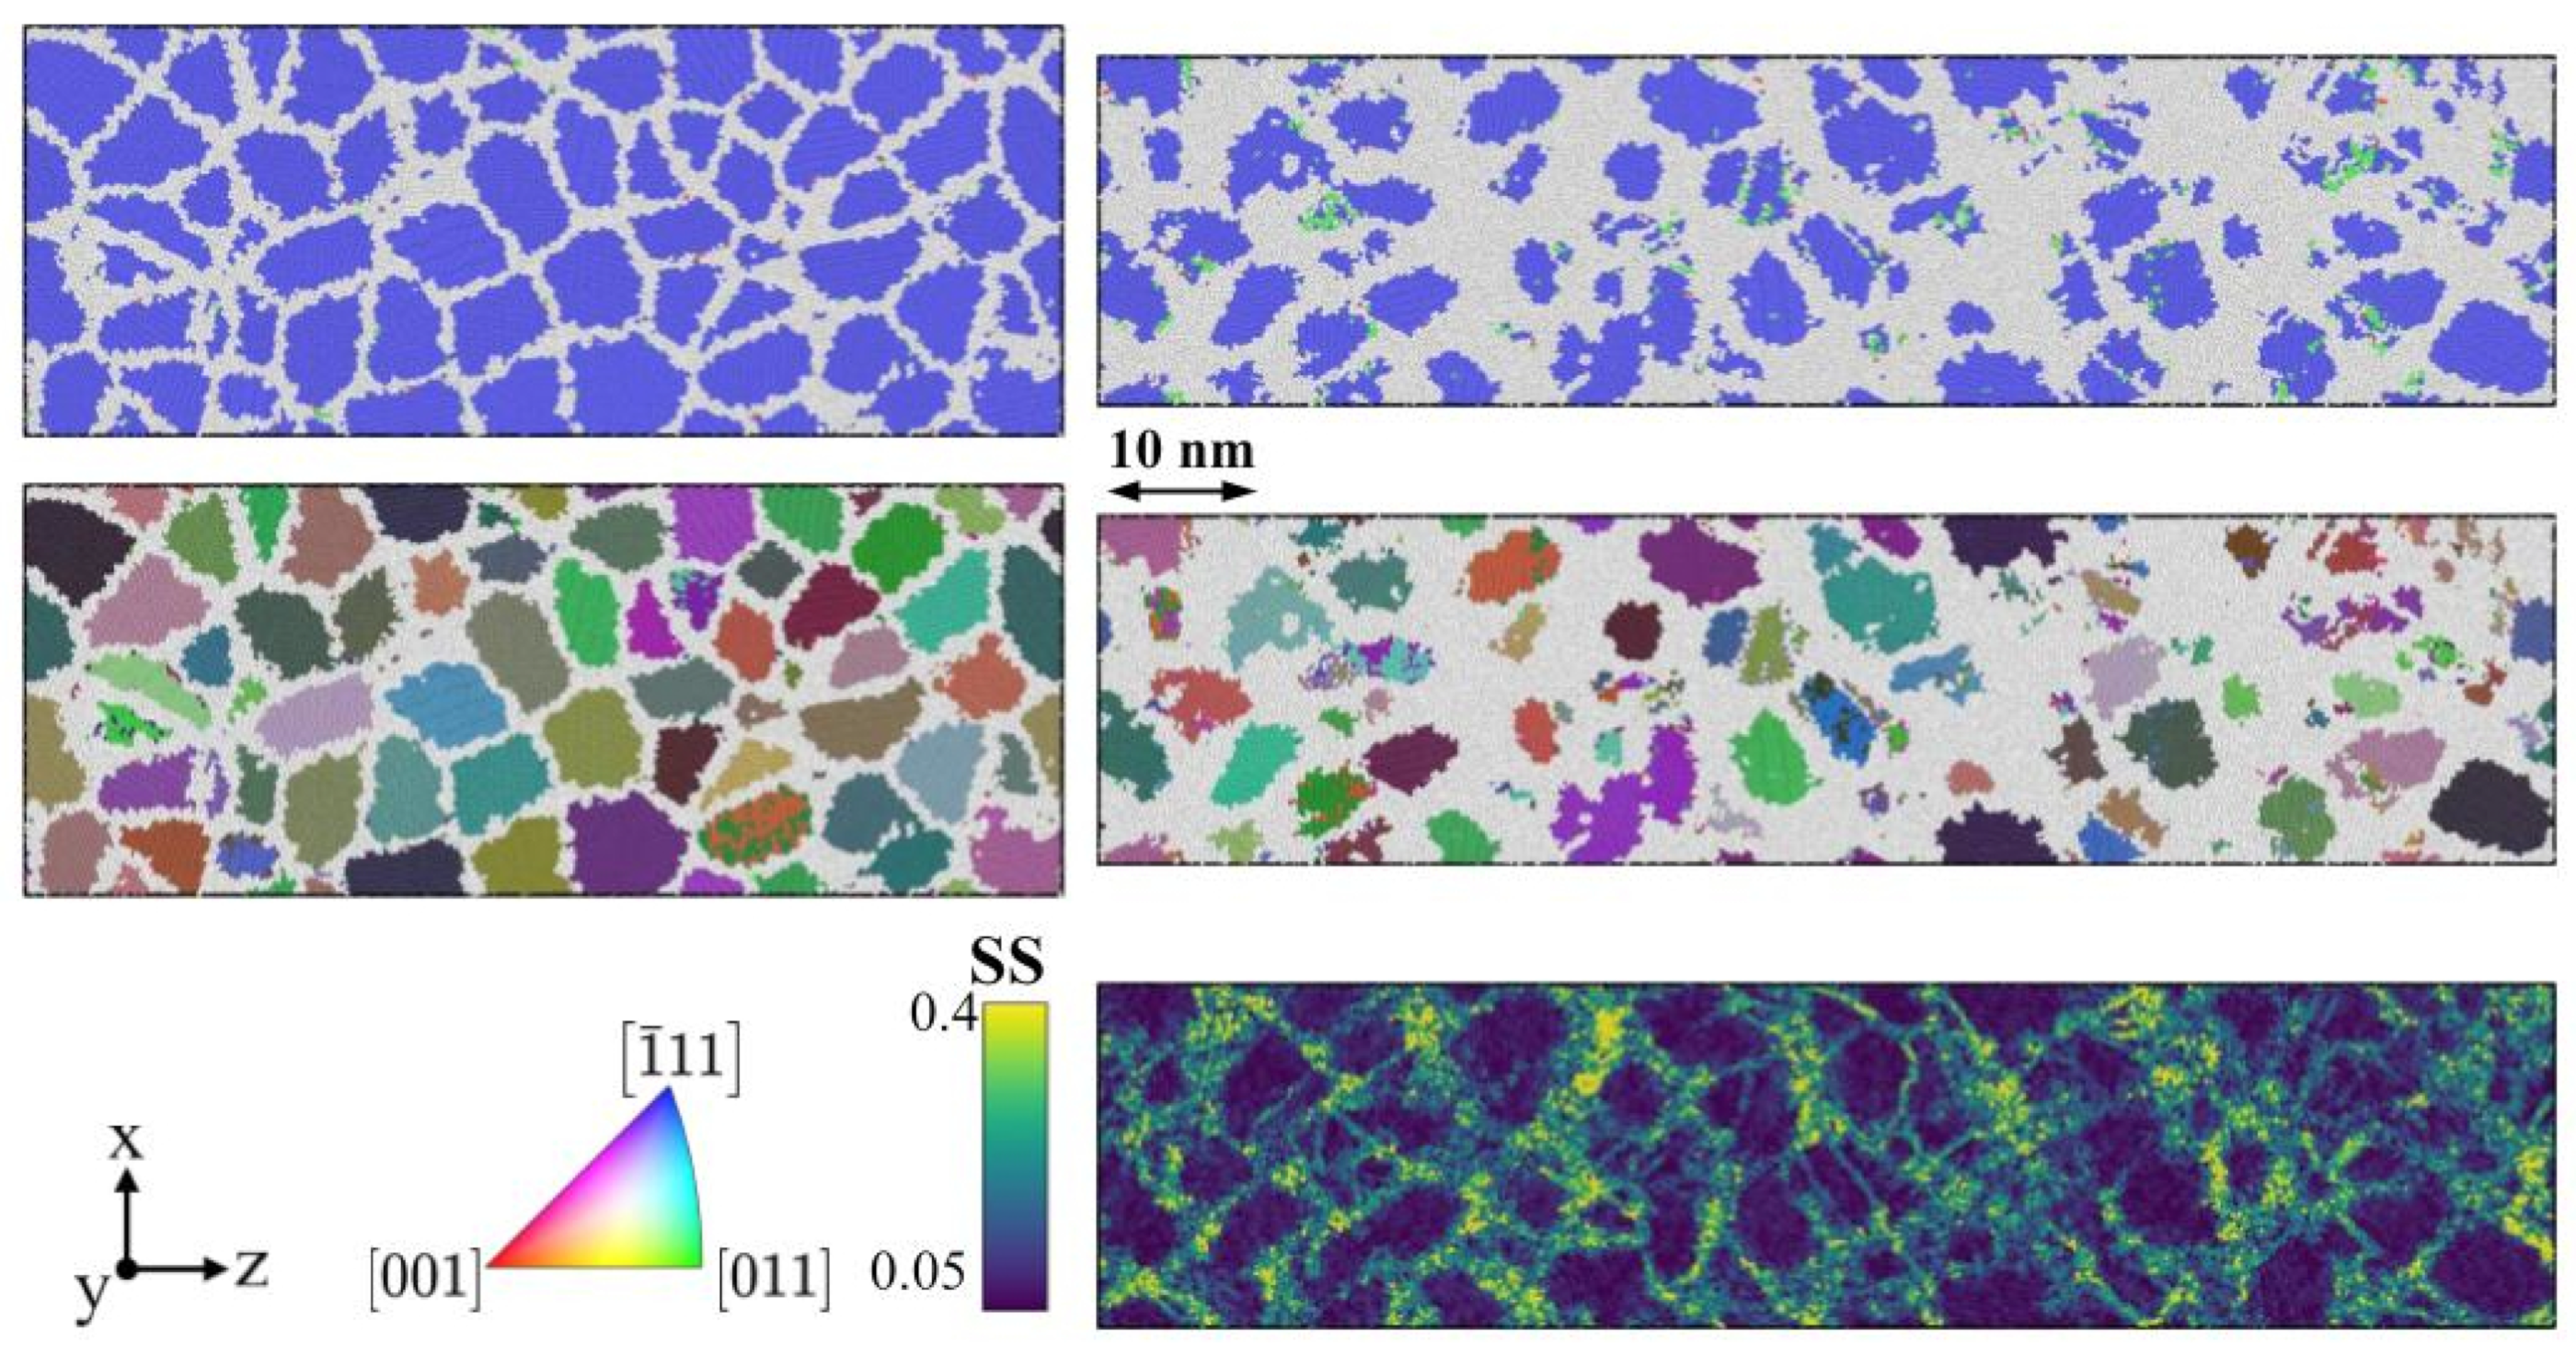
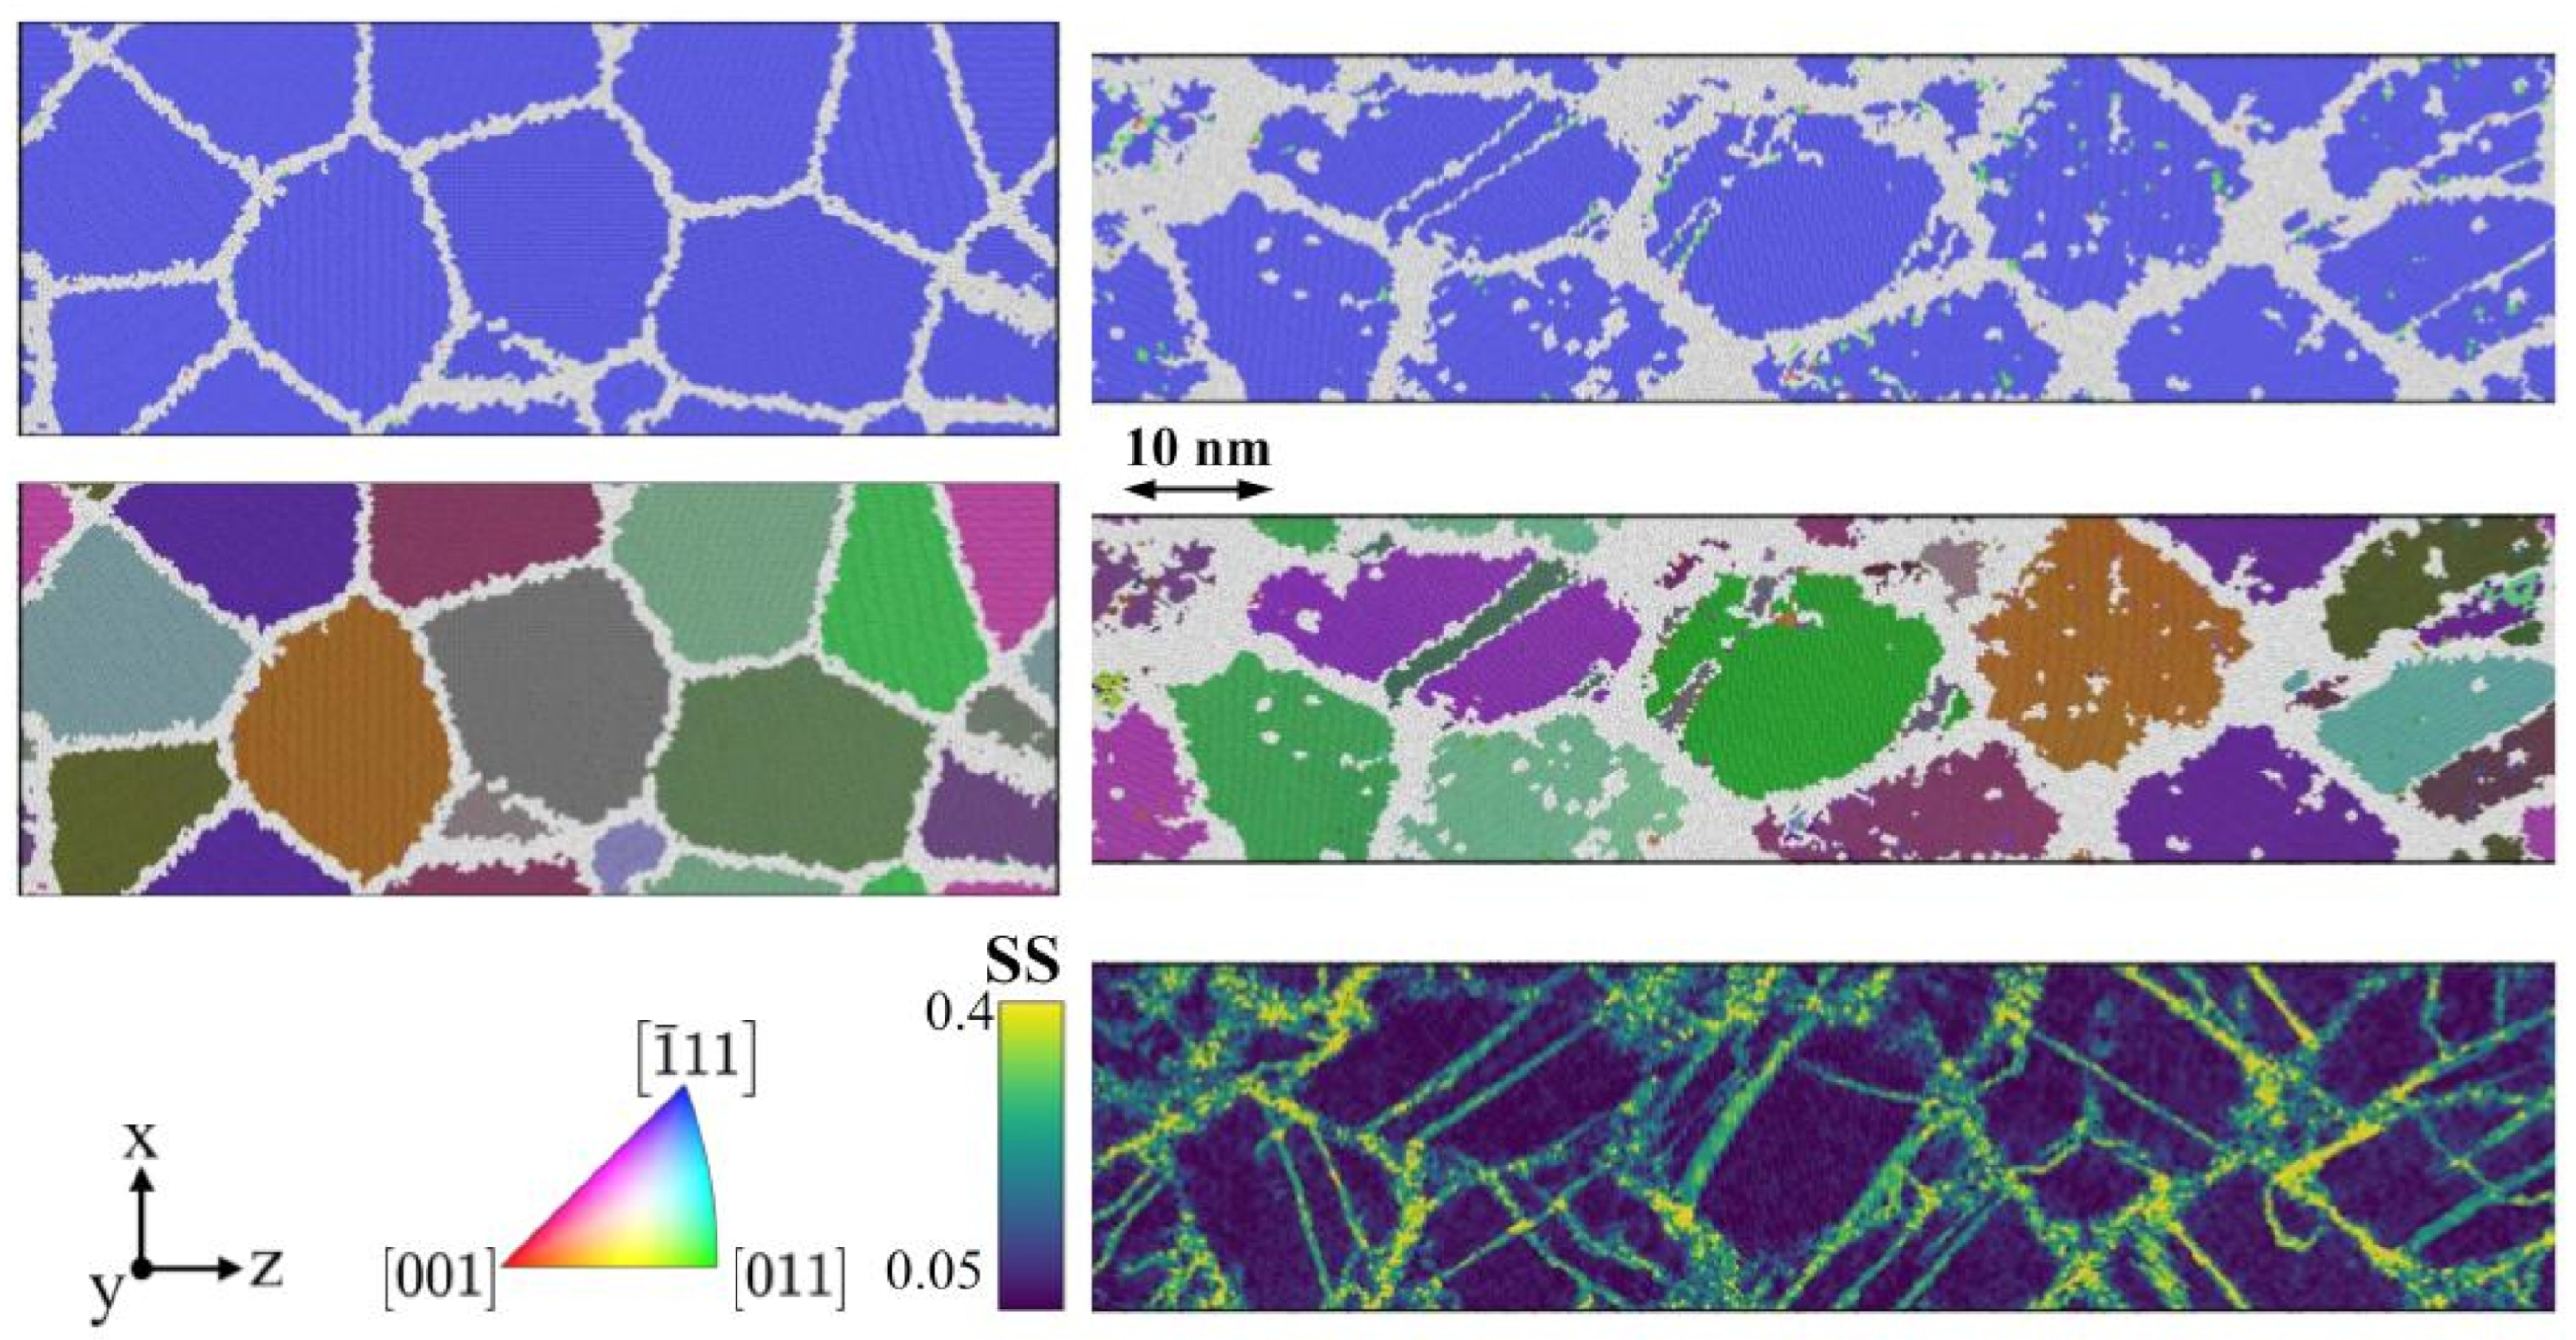
3.2. Sample Amorphization

Figure 4 shows snapshots of selected nanocrystals at 0.4 strain with bcc regions and disordered regions. For an initial grain size of 5 nm, the sample is nearly entirely amorphized at 0.4 strain. The radial distribution function for that 5 nm sample versus strain in Figure 5 shows a clear progression towards amorphization with the crystalline peaks disappearing to give way to a nearly flat g(r) characteristic of the amorphous state. The radial distributions functions in Figure S2 for different grain sizes show that this is not the case for 8 nm and larger grains.
Note the large width of the peaks in g(r), resulting from the lattice distortion due to chemical complexity in the HEA. For this reason, in the analysis that follows, we discard the 5 nm sample to focus on the deformation of samples with larger grains that do not amorphize as much. Other fcc and bcc single component samples are generally stable for a grain size of 5 nm [12,20]; however, GB atoms have been shown to resemble those in a glassy state [50].
In our samples, chemical complexity drives amorphization at this small grain size. For larger grains, this also leads to GB that are typically thicker than for single-component materials. Recently, crystal-to-amorphous phase transformation was observed in fcc CoCrFeNiMn HEAs due to high strain rate deformation [70] or ultrasonic vibrations [71]. Simulated bcc AlCoFeNi samples were observed to amorphize under heating, below melting but at very high temperatures near 1700 K [72].

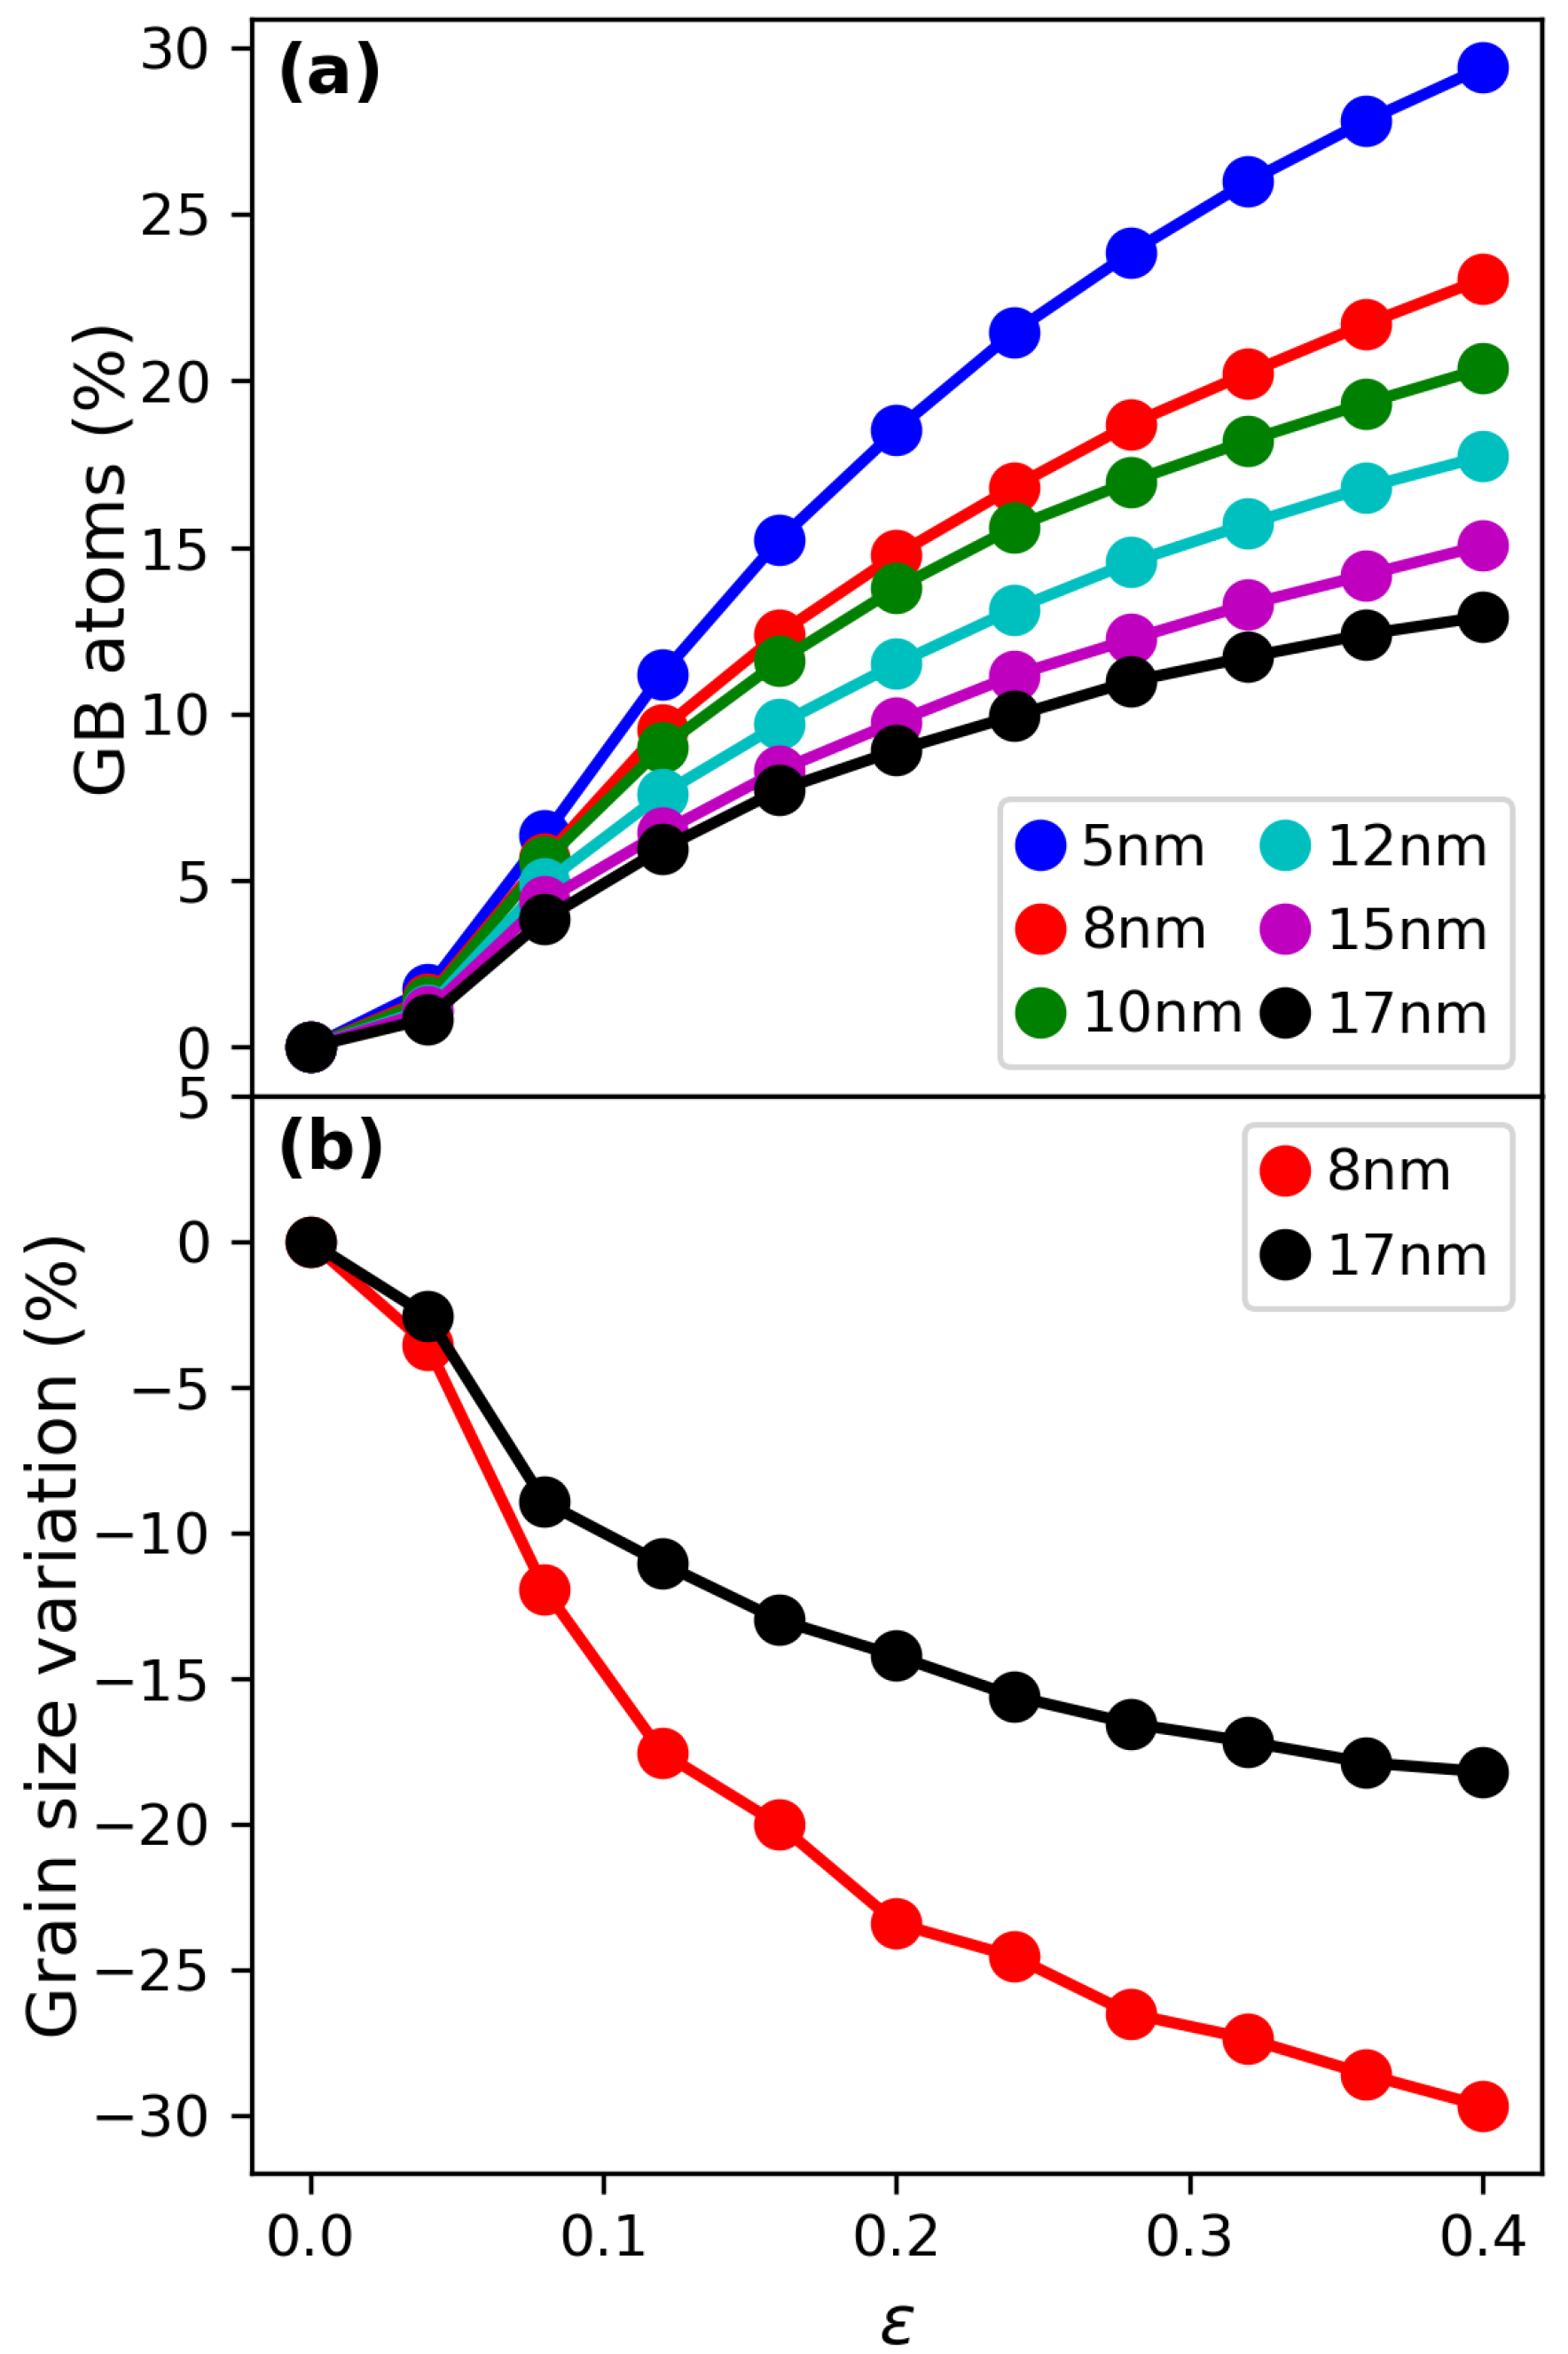
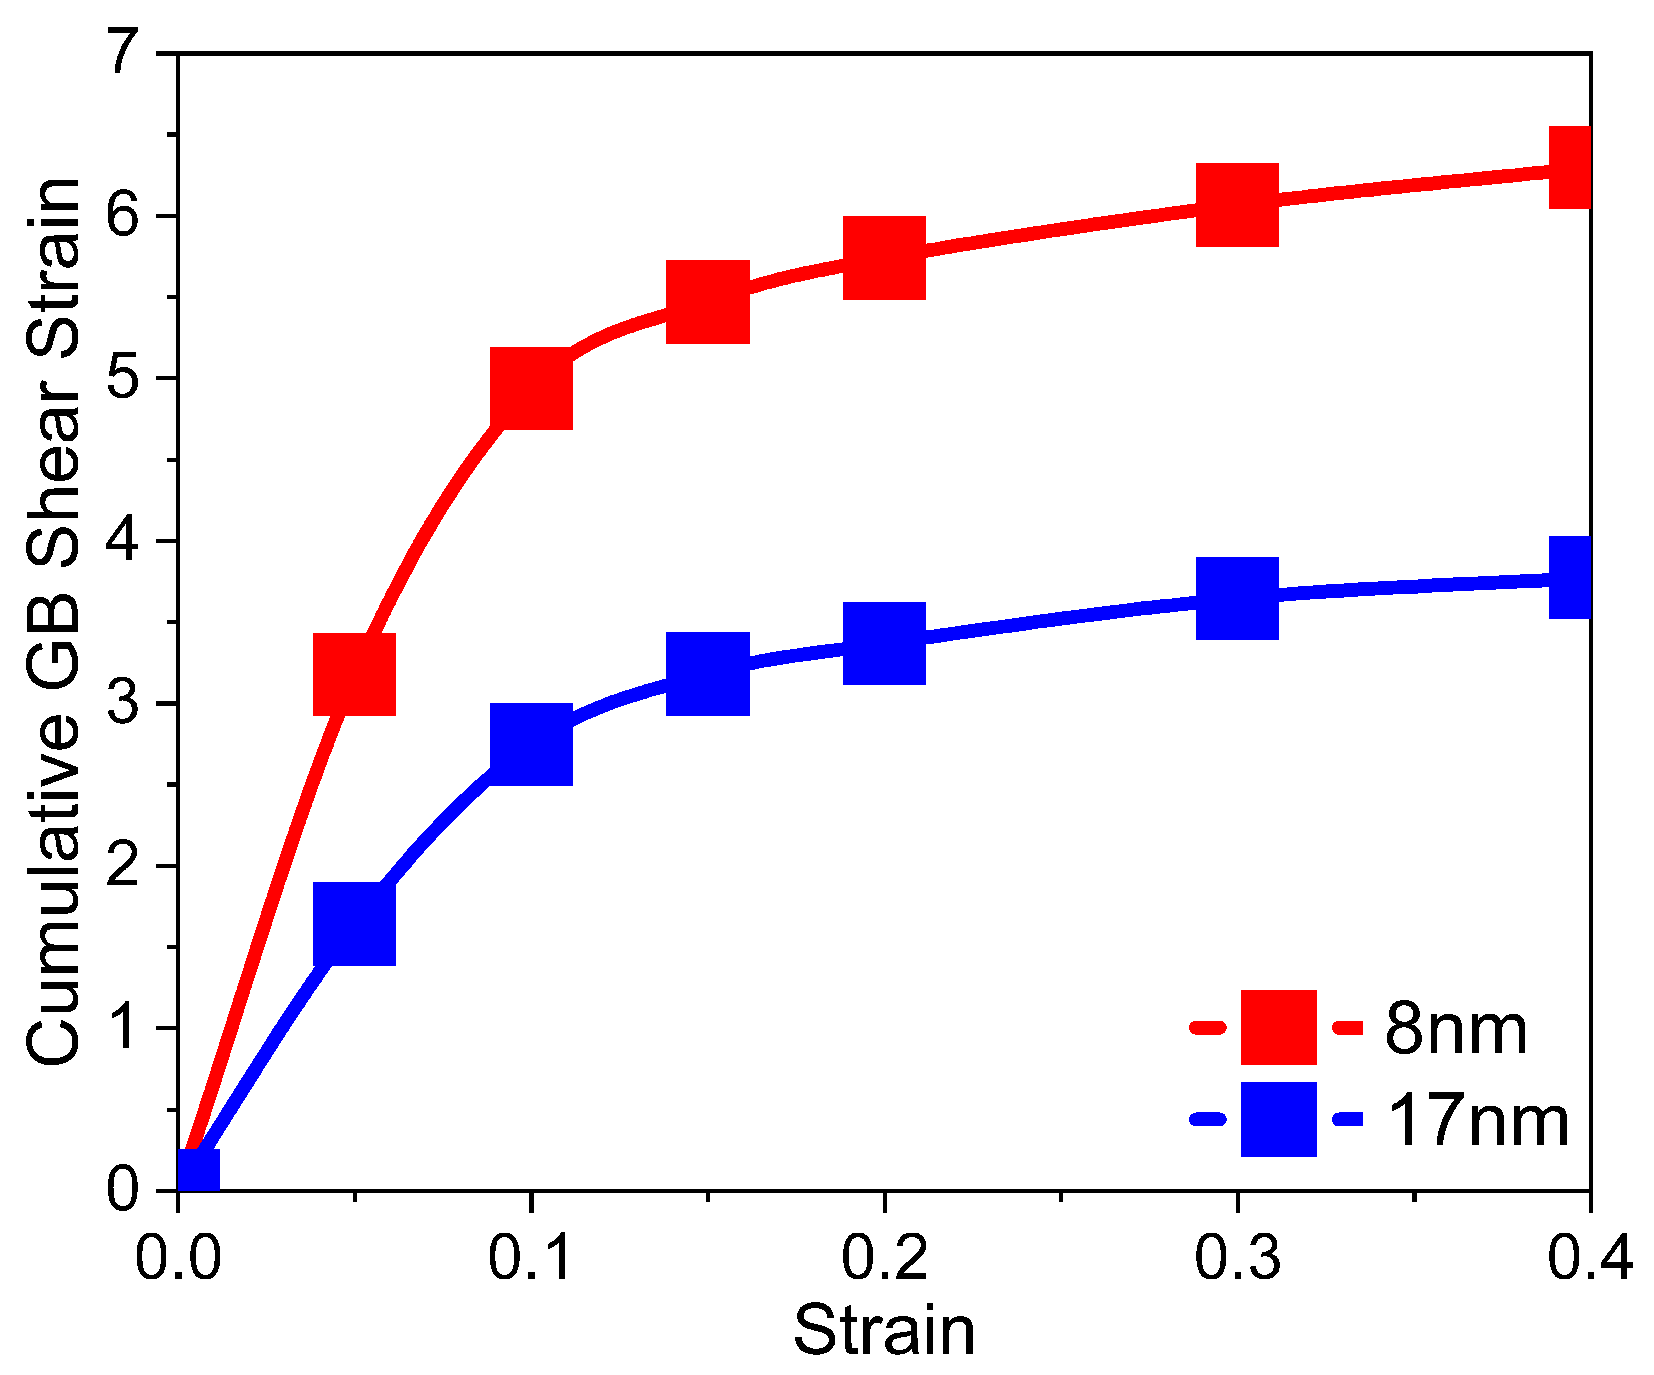
3.3. Grain Boundary Evolution and Plasticity

GB evolution was explored by means of the number of GB atoms as well as grain-size variation. Figure 6a shows that, the smaller the grain size is, the larger the increase in the number of GB atoms. Calculation of grain-size variation results in the curves shown in Figure 6b. As expected, grain-size variation is more noticeable in the case of the 8 nm sample, where a reduction of almost 30% is reached at 0.4 strain. In contrast, the reduction in the 17 nm sample is only of 15%. The number of grains remains unchanged during deformation.
Structural analysis was made along the deformation process. Using polyhedral template matching with an RMSD of 0.1, revealed atoms without any recognizable order. These atoms, which are categorized as “other” atoms, belong primarily to GBs. The increase of these type of atoms along the simulation for structures with 8 and 17 nm grains is shown in Figure S3. The increase in the number of these "other" atoms changes slope around the ultimate stress of the structures. This behavior suggests GB activity during the early stages of plastic deformations, which is later partially replaced by twinning and dislocation plasticity. This is relevant for the grain-size-dependent behavior since the GB fraction is higher for smaller grain sizes.
We do not observe any phase change as recently reported for another refractory HEA, CoNiFeAl 0.7 Cu 0.3 [32]. Using either CNA or PTM, we observe an increase in fcc atoms up to 0.07–0.09 strain, followed by a slow decrease. We find up to 3% fcc atoms for 8 nm samples. In simulations of nanocrystalline bcc NbMoTaWV HEA, up to 2% fcc atoms were found for 5 nm samples [34]. It was argued that these isolated fcc atoms were relevant for plasticity nucleation in the bcc phase. However, because the HEA chemical complexity leads to significant lattice distortion, care must be taken not to over-interpret structural results, such as the presence of supposed fcc or hcp phases, which could be simply isolated atoms misidentified due to limitations of the structure classifier [40]. The onset of plasticity involves lattice distortions, which increase the number of those misidentified atoms as expected.
To quantify the activity in GBs, we performed an analysis similar to the one implemented by Ke [73]. First, we kept only GB atoms and then we performed atomic shear strain calculations using OVITO with the sample at zero strain as reference. In Figure 7, we observe the cumulative shear strain for two samples at different strains. By cumulative, we mean the total atomic shear from all GB atoms. The smaller the grain size is, the larger the GB activity because smaller grains slide and rotate more easily. This higher GB activity in smaller grains was also observed for nc Ta [20].
This analysis is similar to the one performed for an fcc HEA [28], where the number of atoms with shear strain larger than 0.5 was plotted versus strain, finding more such atoms for small grain sizes. A more detailed analysis could involve using microscale kinematic metrics, as it has been done for nc fcc materials [16,18]. For fcc nanocrystals, the segregation of a given alloy element in binary alloys [14,17] or HEAs [74], or when SRO is present [18,26] can modify the mechanical properties. However, our samples did not present segregation of any atom type inside grains or at GBs even at 0.4 strain.

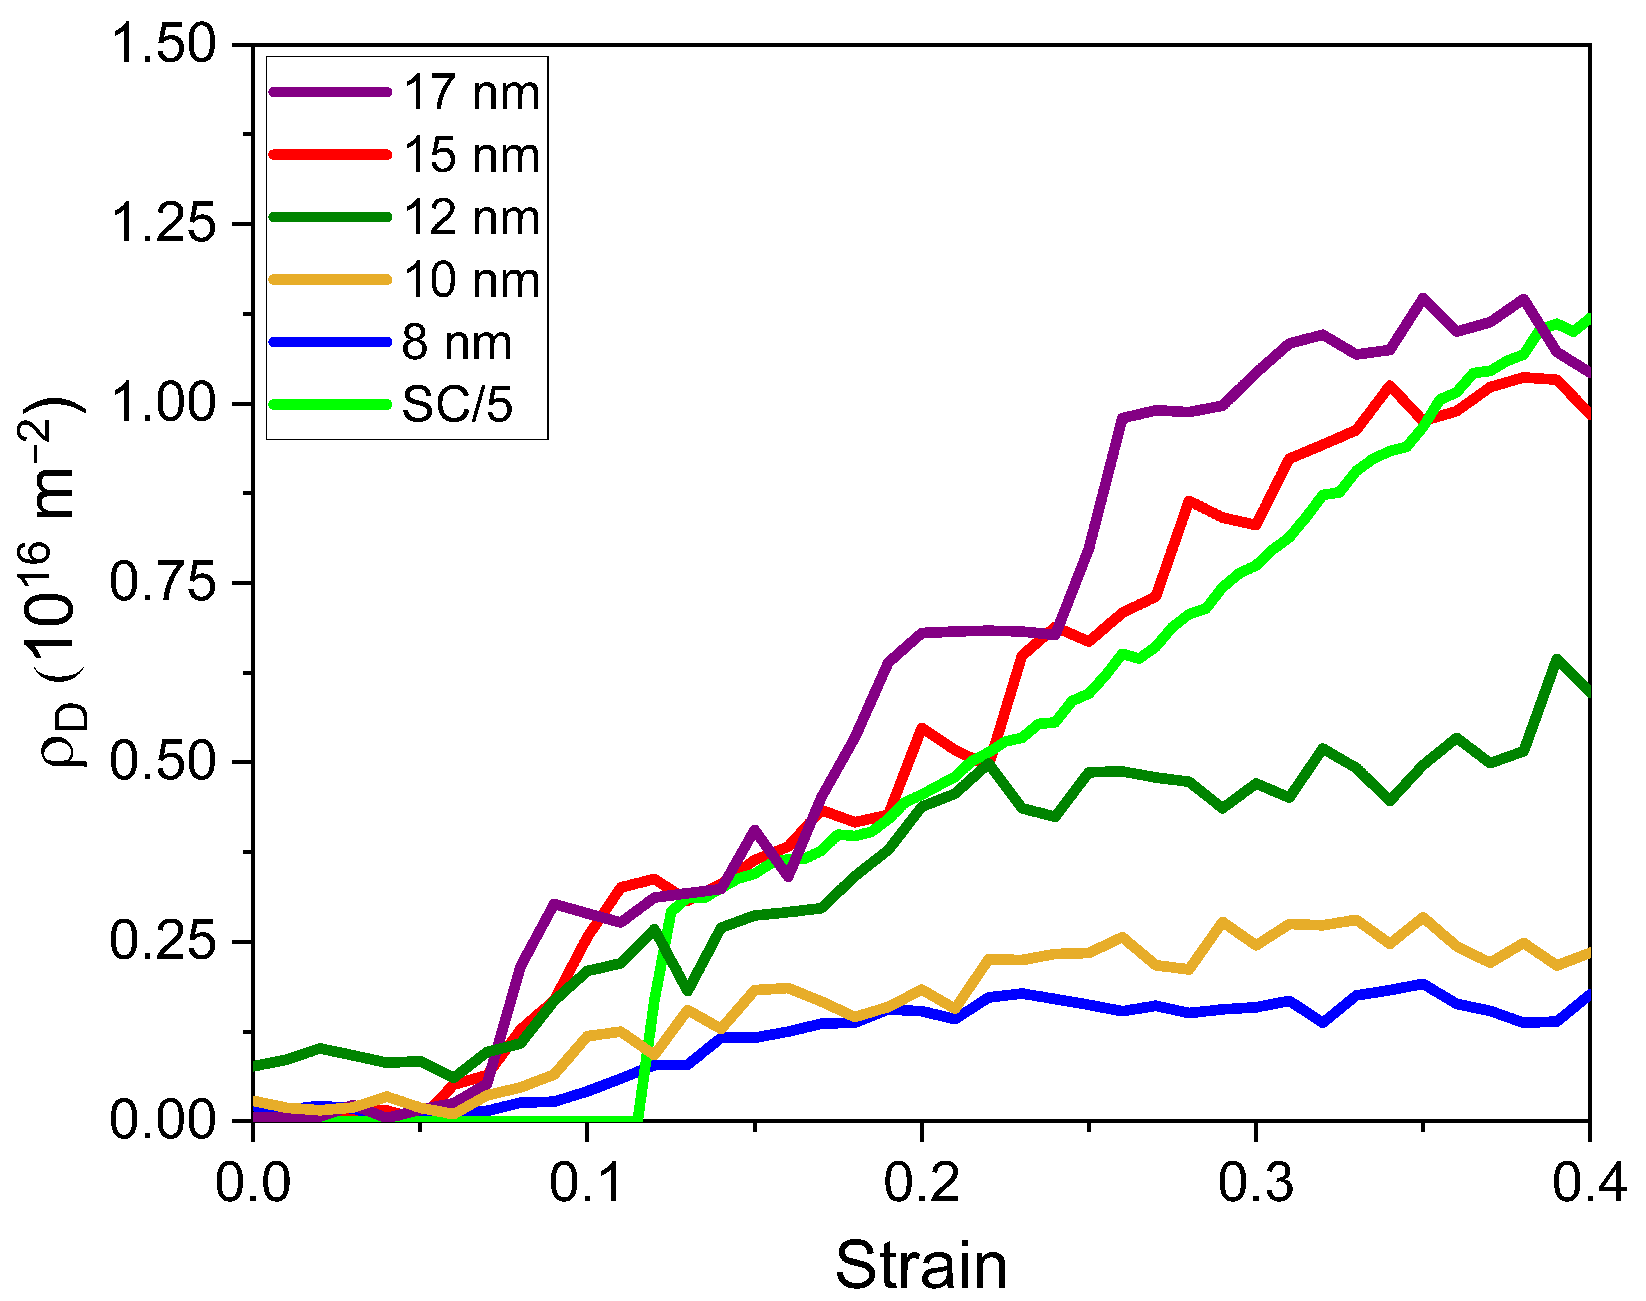
3.4. Dislocation Activity

Dislocations are observed inside grains, as shown in Figure S4, which also shows dislocations inside the single crystal. In Figure 8, we calculate dislocation density for all cases using the formula  ρ = L / V , where L is the total dislocation length obtained using DXA and V is the volume of the sample. Figure 8 shows that the larger the grain size, the higher the dislocation density. This is different if we compare with fcc HEA MD simulations [27,69]. One crucial difference is that fcc nanograins usually deform by emitting mostly a large number of partial dislocations with stacking faults behind [16], while for bcc nanograins, there are full dislocations involved in deformation. We find dislocation densities in the range of  10 15 m 2 10 16 m 2 . This is lower than the ones found for the medium-entropy alloy NbTaZr [35]; however, this could be due to the lower strain rate in our simulations.
Plasticity in bcc metals is usually assumed to be dominated by screw dislocation activity. Edge dislocations have high mobility and the density of edge dislocations is supposed to be negligible with kink-pair nucleation in screw dislocations controlling strength. However, for HEA, local compositional fluctuations reduce edge dislocation mobility [75], leading to similar mobility for edge and screw dislocations at high temperatures [76]. Edge dislocations are often assumed to control plasticity [77,78,79] in refractory HEA.
Experiments for HfNbTaZrTi did show long screw dislocations [4,80], and experiments for HfMoNbTaW suggest that screw dislocations control plasticity up to a critical temperature above 1000 K, when edge dislocations become more relevant [81]. Experiments in HfNbTaZrTi found that deformation was controlled by screw dislocations glide [82]. Edge dislocations in HfNbTaZr have been found to be wavy at high temperatures in MD simulations with the same potential used in this study [39].
DXA in OVITO provides detailed information for all dislocation segments. In this work, we calculate the angle between the dislocation line segment direction and its Burgers vector. Angles are considered modulo  90 . If the angle is less than  30 , the dislocation is assumed to have an edge character, while if the angle is in the range of 60– 90 , the dislocation is assumed to have a screw character. Between  30 and  60 are considered mixed dislocations. The total line length for all segments of a given character is used to obtain dislocation density for that type of dislocation.
We observe that most of the dislocations are screw type. According to Orowan’s equation, the plastic strain will be proportional to dislocation density times dislocation velocity. Dislocation velocities for MoNbTaW were calculated to be about one order of magnitude larger than screw velocities [76]. For a stress level close to 1 GPa, as found in our simulations for large strain, dislocation velocities can be assumed to be several times larger for edge dislocations. Therefore, their contribution would be similar for these simulations, assuming all those dislocations are mobile.
It is not simple to separate mobile from sessile dislocations in atomistic simulations with a large dislocation density. An approximate method was proposed based on plastic heating [83]; however, the current simulations are performed with a thermal bath, and the method cannot be employed. An alternative approximate method was proposed for compressed fcc metals [84]; however, this requires a very high density of saved frames to track the dislocation motion. Such a method might be tested in the future for bcc HEA materials.
MD simulations of fcc CoCrFeMnNi HEA found that, under nanoindentation, a larger fraction of sessile dislocations along with dislocation junctions, were produced in the HEA when compared to Ni [85]. In our simulations, we find a large density of dislocation junctions, which increases with grain size, as expected from the increase in dislocation density. There are, on average, about 0.03 junctions per grain for the 8 nm sample and about 1 junction per grain for the 17 nm sample. Considering only the crystalline bcc volume, we find  3 × 10 4 nm 3 for a grain size of 8 nm and  7 × 10 4 nm 3 for 17 nm.

3.5. Twinning and Misorientation

Models of bcc HEA plasticity usually include dislocation plasticity; however, this work indicates that twinning contributes significantly to plasticity at least for nanograins. Deformation of fcc nanograins usually involves nanotwins [16] due to the emission of partial dislocations in consecutive planes. Twinning proceeds very differently in bcc materials. For instance, Ta crystals display significant twinning, depending on the applied strain rate and temperature [86,87].
Simulations of the nc medium entropy alloy TaNbZr found twinning under tension [35]. Tensile simulations of MoTaTiWZr at  10 10 s 1 reported no twinning [33], despite the fact that twinning might be expected to dominate deformation at those ultra-high strain rates. Surface nucleation of partial dislocations gliding on {112} planes was found to generate twinning in simulations of BCC HEA nanopillars under compression [88]; however, our current DXA analysis does not allow to identify glide on {112} planes.
Figure 9 and Figure 10 show several views of a thin slice for 8 and 17 nm samples. The left column shows the system at zero strain, while the right column is at 0.4 strain. The upper row shows the samples colored by crystal structure from PTM, differentiating crystalline from non-crystalline phases, clusters of point defects or sections of dislocation cores.
Some of the “noise” that can be appreciated inside grains are isolated atoms misidentified as having an fcc structure. The middle row implements an orientation-based filter according to the Inverse Pole Figure (IPF) color reference, allowing for a clear view of twinned regions. Comparing left to right we can see differences between original and final orientations due to grain rotation or twinning. Note that twins appear as bands inside grains and that several twin variants are shown.
Finally, the bottom row colors with atomic shear strain. This helps visualize GB activity and also dislocation glide, even if dislocation cores were already absorbed by a GB and would not appear in the coloring by PTM. Dislocation slip traces appear as thin lines in grain interiors where PTM or IPF do not show any features.
3D pictures of the same snapshots are available in the Supplementary Materials (Figures S5 and S6). A 3D view of IPF for the single crystal is also available (Figure S7). Single crystal samples of HfNbTaZr with a spherical void displayed limited twinning under [001] tension with the void acting as a dislocation source but only strains below 0.20 were reached [40].
Misorientation analysis allows for quantitative detection of twinning both in single and nano-grained crystals. For the single crystal case, Figure 11 shows twinning starting near 0.05 strain with a marked increase in the twin volume fraction (TVF) with strain sustained until the nucleation of dislocations at ∼0.11 strain, which causes a sharp decrease indicating dislocation-induced detwinning and the start of the competition between these two deformation mechanisms.
The nanocrystal samples also include significant twinning, and the twin volume fraction is above 0.3 for the 17 nm grain sample. TVF appears as more than double for the larger grains; however, this might be due to the large fraction of amorphization in the small grain sample. If the TVF is calculated taking into account only the volume of bcc atoms, both 17 and 8 nm show a similar trend with strain, as shown in Figure S8.
However, TVF for 17 nm continues to be larger starting at 0.2 strain, when dislocation activity is also larger for large grains. Therefore, plasticity in the 8 nm sample has to be accommodated by GB activity, as already suggested by Figure 9 and Figure 10. Note that nearly half the grain volume has been twinned for 17 nm grains. Our snapshots display significant similarities with the deformation twins observed at the micron-scale in HfNbTaZrTi under compression [63].

4. Summary and Conclusions

In this work, we analyzed bcc HfNbTaZr samples including single and nano-crystalline systems. We quantified the mechanical response to tensile stress in terms of its deformation mechanisms, including grain boundary activity, dislocations, twinning, and amorphization. We studied crystal structure to discard possible phase changes and used machine learning to quantify grain evolution. Our main results are summarized below.
  • Chemical complexity contributes to disorder at grain boundaries (GBs) and increases the GB thickness, such that the crystalline grains are in fact smaller than indicated by the nominal size given during sample construction.
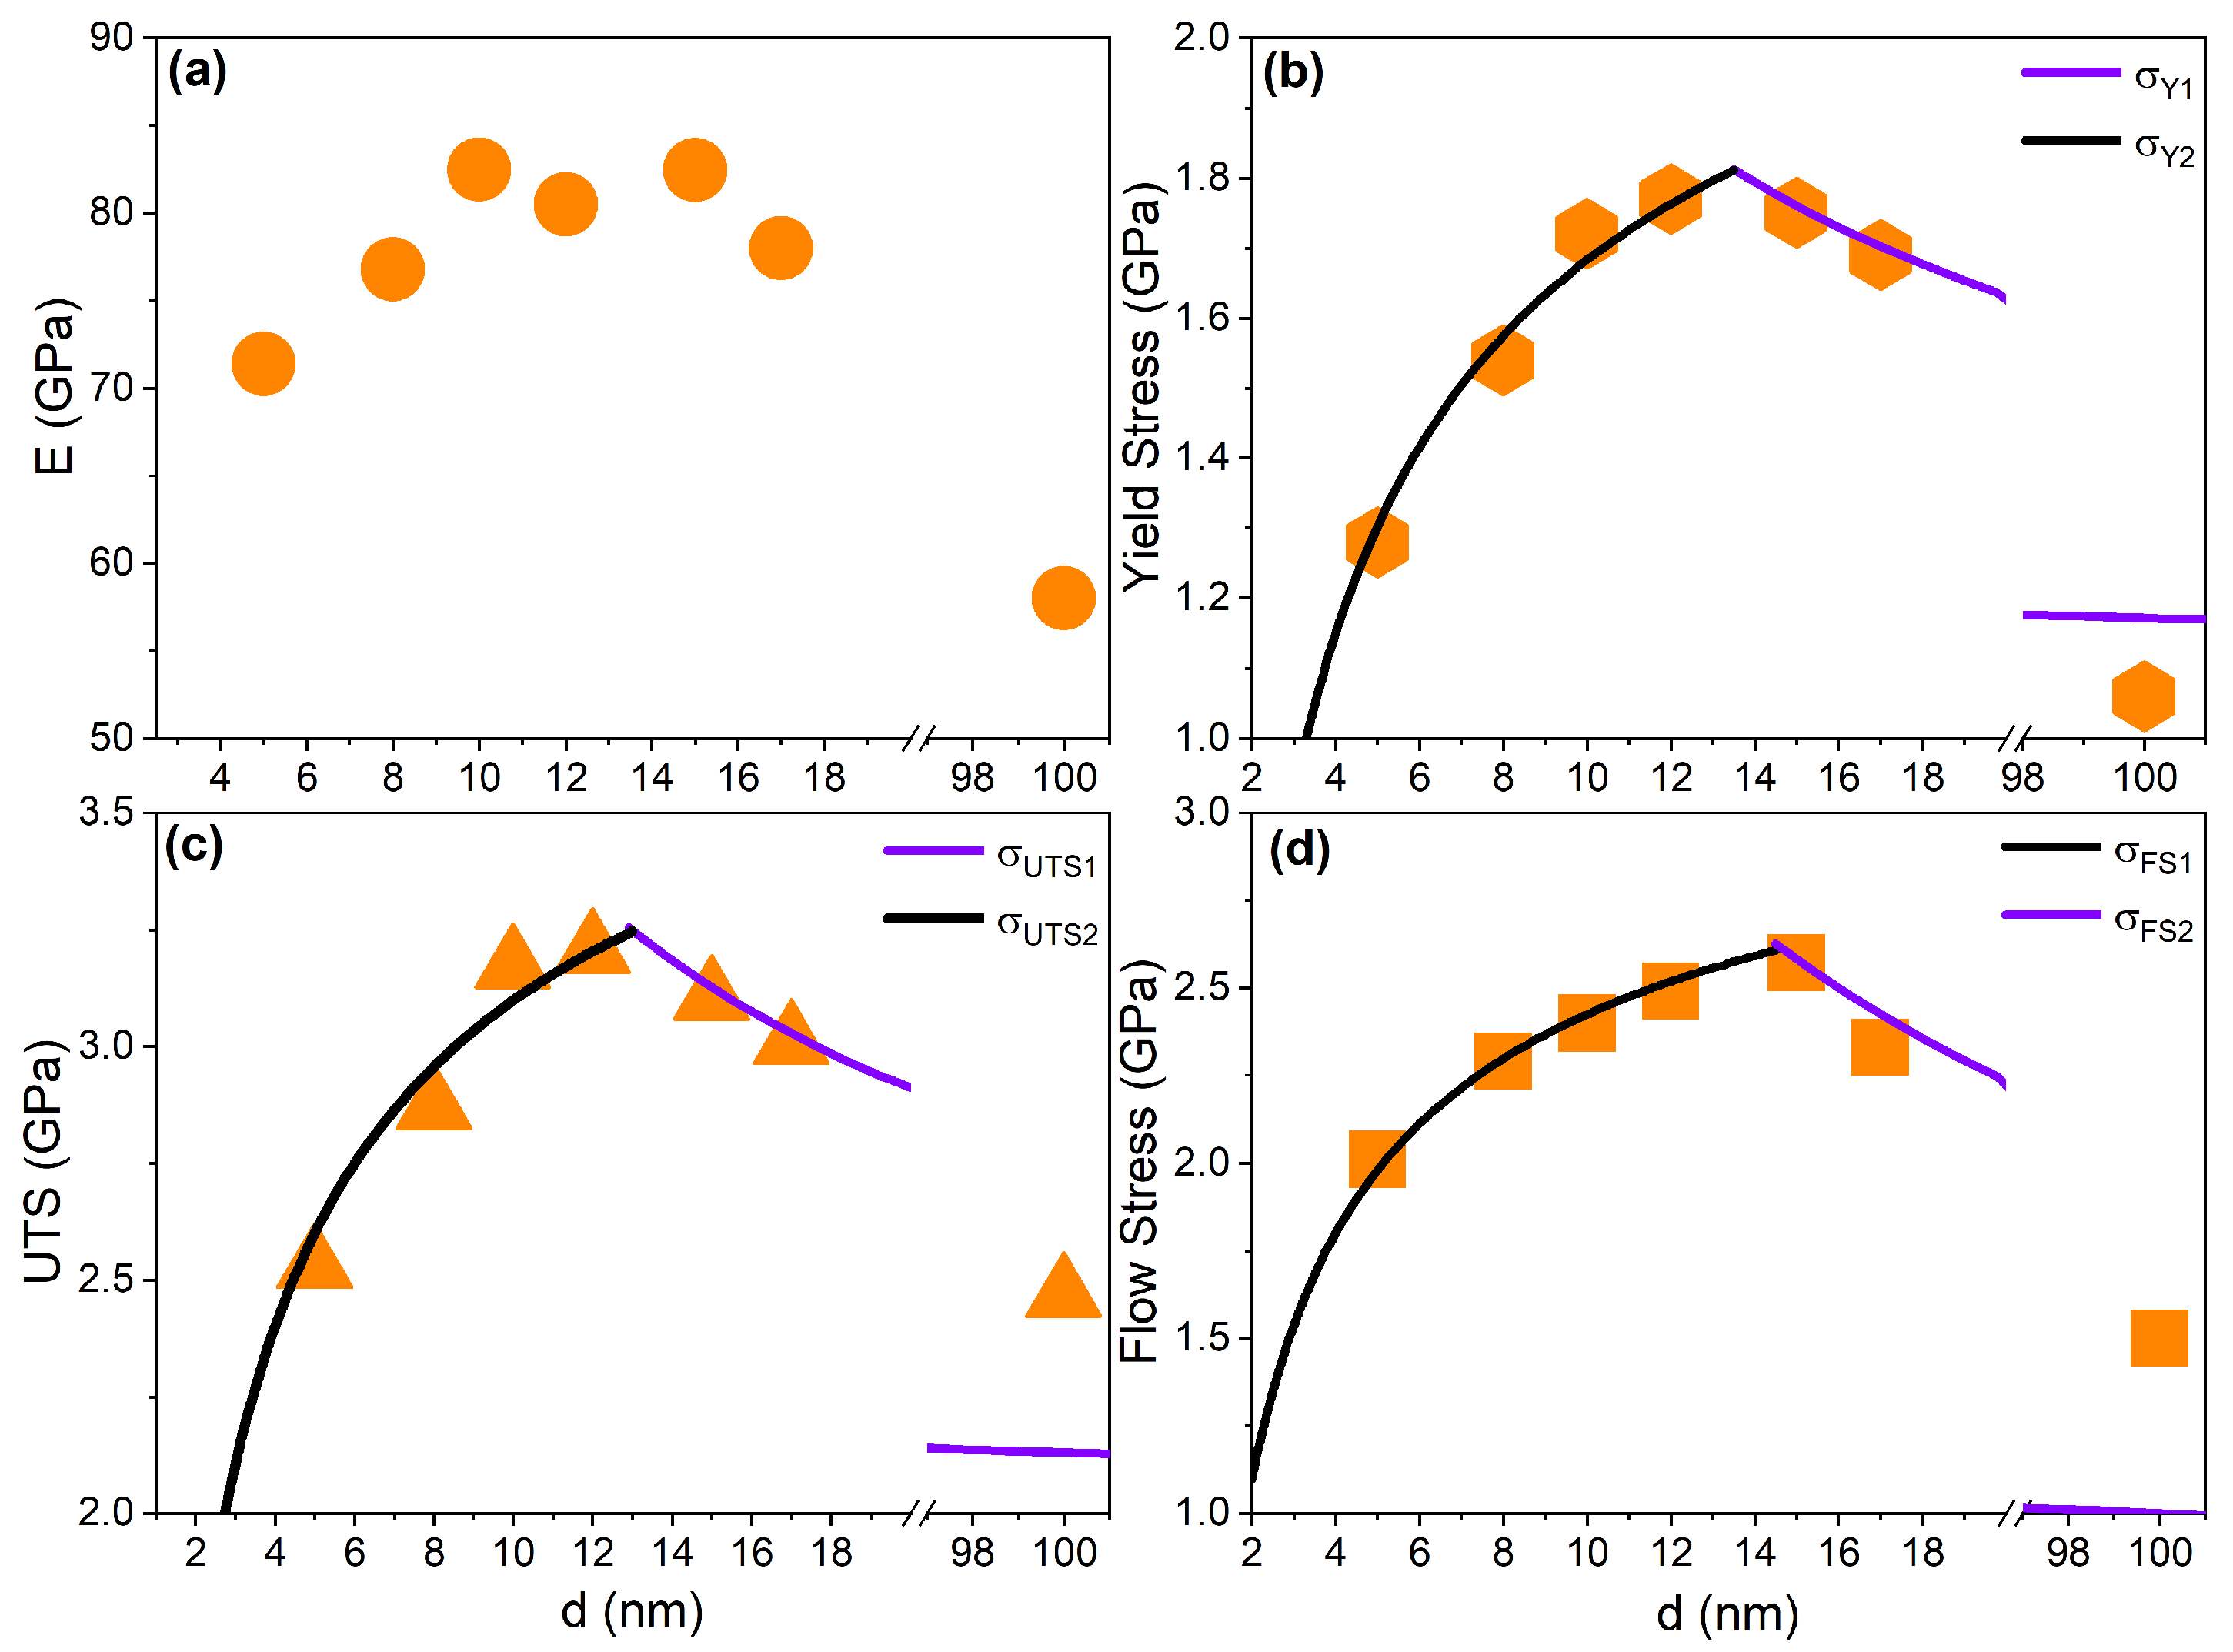
  • The elastic modulus of the nc samples has values around ∼60 GPa. This is significantly smaller than the modulus for Ta, and might help in biomedical applications requiring softer materials than Ta [21].
  • We observe Hall–Petch and Inverse Hall–Petch behavior in this HEA with a crossover value of 12 nm for yield stress and ultimate tensile stress, and 15 nm for flow stress. On the other hand, a very low Hall–Petch slope for the yield stress is observed. This could be related to our grains being pristine without any pre-existing defects. Introducing twins, similar to annealing twins, or dislocations might help tailoring the HP slope.
  • Segregation due to tensile stress is not observed in these simulations for a random HEA, and no phase transformation was observed due to tension. However, the 5 nm grains are amorphized during tensile deformation. We note that the structure identification has to be performed with care, to avoid large “noise” due to lattice distortion in alloys with chemical complexity.
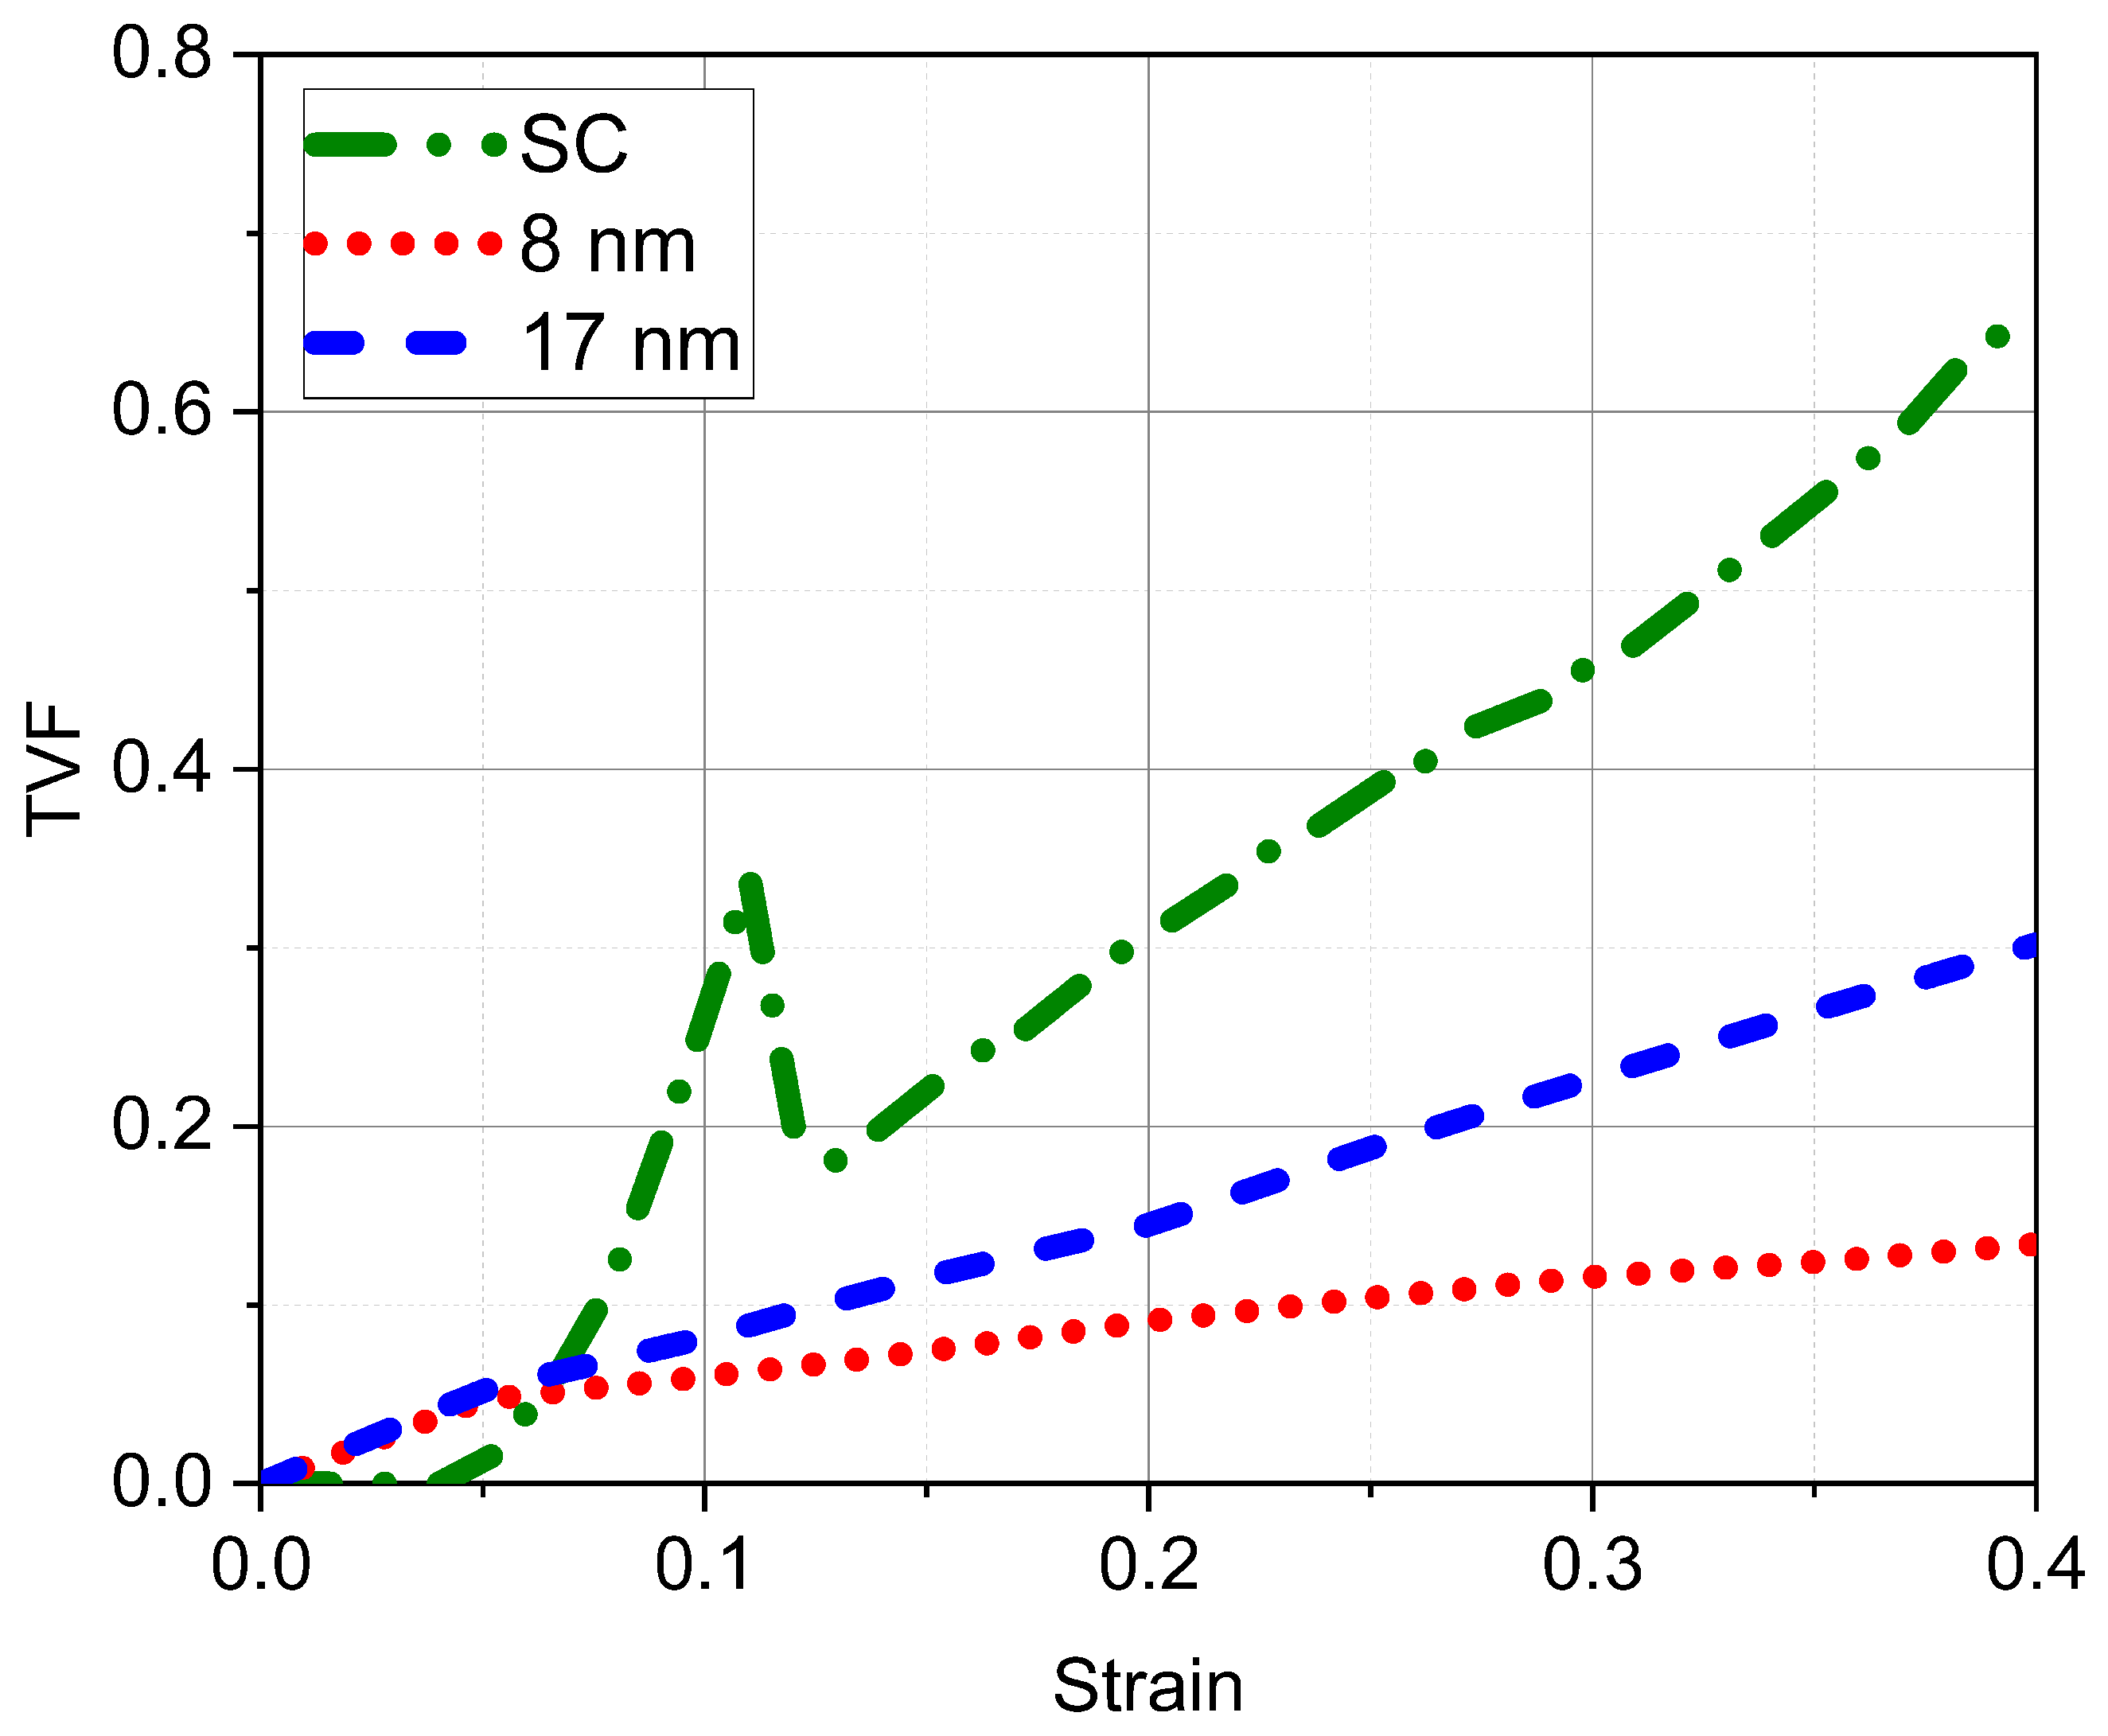
  • At smaller grain sizes, plasticity is mediated strongly by GB activity, such as sliding and rotation, as supported by the faster increase of “amorphous” atoms, the larger cumulative GB shear strain, and the smaller twin volume fraction observed for small grains.
  • At larger grain sizes, plasticity is mostly driven by dislocation activity and twinning. Dislocation densities inside grains, discarding grain boundary dislocations, increase with strain and with grain size. The number of dislocation junctions also increases with grain size.
  • Dislocation analysis was performed to distinguish between their screw or edge character. Screw dislocations play a significant role in plasticity, as determined by our simulations and experimental findings [30]. A twinning-detwinning response was detected in the single crystal, near to threshold for dislocation nucleation. In addition, in nc samples, the large twin volume fraction for large grains signals a competition with dislocations, which will shift depending on temperature and strain rate.
  • Twins were detected using a technique that employs atomic misorientation, allowing a volumetric quantification of twin fraction evolution, alongside different twin variants.
The iHP transition into HP, leading to a maximum yield stress and flow stress, is related to the competition of GB activity with dislocations, as it has been discussed before; however, there is also a significant contribution of twins to plasticity beyond the HP maximum. We note that this study focused on grain sizes below 20 nm. Simulations with much larger grain sizes, requiring much larger samples and a significantly larger computational cost, will be necessary to extrapolate to grain sizes typical of experiments.
There are several issues that could be studied in future works, such as simulations at different temperatures, up to nearly 2000 K, where twinning might become less relevant than dislocations with a significant increase in their mobilities, therefore, controlling the deformation behavior. On the other hand, we only considered random samples without short-range order (SRO), which would be relevant at much higher temperatures [38] and will likely modify mechanical properties [18,26,89].
For bcc alloys, SRO, precipitation, and GB segregation might also shift the balance between GB activity, twinning, and dislocations. Our simulations study a single-phase bcc HEA. However, experiments often involve several phases and microstructure with precipitates, compositional gradients, etc. Models incorporating information from different techniques and different scales will be required to help in the comprehension of experiments towards designing novel, improved HEA [77,90]. We believe that future experimental work for grain sizes below 1 micron, and at large deformation rates, would help comparisons with atomistic simulations, validating alloy potentials for challenging mechanical behavior.

Supplementary Materials

The following supporting information can be downloaded at: https://www.mdpi.com/article/10.3390/cryst13020357/s1. Supporting information contains Figures S1 to S8 and a brief explanation of those figures.

Author Contributions

O.D.: Investigation, Methodology, Visualization, Data Curation, Formal analysis, and Writing—review and editing. F.V.: Methodology, Software, Resources, Data Curation, and Writing—review and editing. D.R.T.: Methodology, Investigation, Visualization, Software, Formal analysis, and Writing—review and editing. N.A.: Methodology, Software, Investigation, Formal analysis, Visualization, Writing—original draft, and Writing—review and editing. J.R.-N.: Methodology, Investigation, Visualization, Formal analysis, and Writing—review and editing. E.M.B.: Conceptualization, Investigation, Methodology, Formal analysis, Writing—review and editing, Supervision, Project administration, and Funding acquisition. All authors have read and agreed to the published version of the manuscript.

Funding

This research was funded by Fondo para la Investigación Científica y Tecnológica (FONCyT, Argentina) under grants PICTO-UM-2019-00048 and PIP-2021-2023 11220200102578CO; SNCAD-MinCyT, Argentina under grant NLHPC/ECM-02, SIIP-UNCUYO under grant 06/M008-T1, and Fondo Nacional de Desarrollo Científico y Tecnológico (FONDECYT, Chile) under Grants #11200038, #1190662, and #11190484.

Institutional Review Board Statement

Not applicable.

Informed Consent Statement

Not applicable.

Data Availability Statement

The datasets used and/or analyzed during the current study are available from the corresponding author upon reasonable request.

Acknowledgments

This research was partially supported by the supercomputing infrastructure of the NLHPC (ECM-02). This work used computational resources from CCAD—Universidad Nacional de Córdoba (https://ccad.unc.edu.ar/, accessed on 15 February 2023), which are part of SNCAD—MinCyT, República Argentina.

Conflicts of Interest

The authors declare that they have no known competing financial interest or personal relationships that could have appeared to influence the work reported in this paper.

Abbreviations

The following abbreviations are used in this manuscript:
bccBody Centered Cubic
fccFace Centered Cubic
CATCrystal Analysis Tool
CNACommon Neighbor Analysis
DXADislocation Extraction Algorithm
EAMEmbedded Atom Method (Inter-atomic Potential)
GBGrain Boundary
HEAHigh Entropy Alloy
HPHall–Petch
iHPInverse Hall–Petch
IPFInverse Pole Figure
MDMolecular Dynamics
MLMachine Learning
ncNanocrystalline
MPEAMulti Principal Element Alloy
PTMPolyhedral Template Matching
RFRandom Forests
RMSDRoot-Mean Square Deviation
SCsingle Crystal
SSShear Strain
TVFTwin Volume Fraction
nTVFnormlized Twin Volume Fraction
UTSUltimate Tensile Stress

References

  1. Yeh, J.W.; Chen, S.K.; Lin, S.J.; Gan, J.Y.; Chin, T.S.; Shun, T.T.; Tsau, C.H.; Chang, S.Y. Nanostructured high-entropy alloys with multiple principal elements: Novel alloy design concepts and outcomes. Adv. Eng. Mater. 2004, 6, 299–303. [Google Scholar] [CrossRef]
  2. Cantor, B.; Chang, I.; Knight, P.; Vincent, A. Microstructural development in equiatomic multicomponent alloys. Mater. Sci. Eng. A 2004, 375–377, 213–218. [Google Scholar] [CrossRef]
  3. Senkov, O.N.; Miracle, D.B.; Chaput, K.J.; Couzinie, J.P. Development and exploration of refractory high entropy alloys—A review. J. Mater. Res. 2018, 33, 3092–3128. [Google Scholar] [CrossRef] [Green Version]
  4. George, E.P.; Raabe, D.; Ritchie, R.O. High-entropy alloys. Nat. Rev. Mater. 2019, 4, 515–534. [Google Scholar] [CrossRef]
  5. Li, Z.; Zhao, S.; Ritchie, R.O.; Meyers, M.A. Mechanical properties of high-entropy alloys with emphasis on face-centered cubic alloys. Prog. Mater. Sci. 2019, 102, 296–345. [Google Scholar] [CrossRef]
  6. Li, W.; Xie, D.; Li, D.; Zhang, Y.; Gao, Y.; Liaw, P.K. Mechanical behavior of high-entropy alloys. Prog. Mater. Sci. 2021, 118, 100777. [Google Scholar] [CrossRef]
  7. Chen, B.; Zhuo, L. Latest progress on refractory high entropy alloys: Composition, fabrication, post processing, performance, simulation and prospect. Int. J. Refract. Met. Hard Mater. 2022, 110, 105993. [Google Scholar] [CrossRef]
  8. Armstrong, R.W. 60 years of Hall–Petch: Past to present nano-scale connections. Mater. Trans. 2014, 55, 2–12. [Google Scholar] [CrossRef] [Green Version]
  9. Cordero, Z.C.; Knight, B.E.; Schuh, C.A. Six decades of the Hall–Petch effect–a survey of grain-size strengthening studies on pure metals. Int. Mater. Rev. 2016, 61, 495–512. [Google Scholar] [CrossRef]
  10. Naik, S.N.; Walley, S.M. The Hall–Petch and inverse Hall–Petch relations and the hardness of nanocrystalline metals. J. Mater. Sci. 2020, 55, 2661–2681. [Google Scholar] [CrossRef] [Green Version]
  11. Hahn, E.N.; Meyers, M.A. Grain-size dependent mechanical behavior of nanocrystalline metals. Mater. Sci. Eng. A 2015, 646, 101–134. [Google Scholar] [CrossRef] [Green Version]
  12. Bringa, E.M.; Caro, A.; Wang, Y.; Victoria, M.; McNaney, J.M.; Remington, B.A.; Smith, R.F.; Torralva, B.R.; Swygenhoven, H.V. Ultrahigh Strength in Nanocrystalline Materials Under Shock Loading. Science 2005, 309, 1838–1841. [Google Scholar] [CrossRef] [Green Version]
  13. Zhou, X.; Feng, Z.; Zhu, L.; Xu, J.; Miyagi, L.; Dong, H.; Sheng, H.; Wang, Y.; Li, Q.; Ma, Y.; et al. High-pressure strengthening in ultrafine-grained metals. Nature 2020, 579, 67–72. [Google Scholar] [CrossRef]
  14. Wu, S.; Kou, Z.; Lai, Q.; Lan, S.; Katnagallu, S.S.; Hahn, H.; Taheriniya, S.; Wilde, G.; Gleiter, H.; Feng, T. Dislocation exhaustion and ultra-hardening of nanograined metals by phase transformation at grain boundaries. Nat. Commun. 2022, 13, 5468. [Google Scholar] [CrossRef]
  15. Zhang, L.; Lu, C.; Tieu, K. A review on atomistic simulation of grain boundary behaviors in face-centered cubic metals. Comput. Mater. Sci. 2016, 118, 180–191. [Google Scholar] [CrossRef]
  16. Gupta, A.; Gruber, J.; Rajaram, S.S.; Thompson, G.B.; McDowell, D.L.; Tucker, G.J. On the mechanistic origins of maximum strength in nanocrystalline metals. NPJ Comput. Mater. 2020, 6, 153. [Google Scholar] [CrossRef]
  17. Sansoz, F.; Ke, X. Hall–Petch strengthening limit through partially active segregation in nanocrystalline Ag-Cu alloys. Acta Mater. 2022, 225, 117560. [Google Scholar] [CrossRef]
  18. Gupta, A.; Jian, W.R.; Xu, S.; Beyerlein, I.J.; Tucker, G.J. On the deformation behavior of CoCrNi medium entropy alloys: Unraveling mechanistic competition. Int. J. Plast. 2022, 159, 103442. [Google Scholar] [CrossRef]
  19. Handrigan, S.M.; Nakhla, S. Examination of critical grain size of isotropic nanocrystalline iron through molecular dynamics analysis. Mol. Simul. 2022, 48, 976–990. [Google Scholar] [CrossRef]
  20. Tang, Y.; Bringa, E.M.; Meyers, M.A. Inverse Hall–Petch relationship in nanocrystalline tantalum. Mater. Sci. Eng. A 2013, 580, 414–426. [Google Scholar] [CrossRef]
  21. Kardani, A.; Montazeri, A.; Urbassek, H.M. Computational Analysis of the Mechanical Properties of Ta/Cu Nanocomposite Dental Implants: On the Role of Incoherent Interfaces. Met. Mater. Int. 2023, 1–13. [Google Scholar] [CrossRef]
  22. Zare Chavoshi, S.; Branicio, P.S.; An, Q. Transition between Hall–Petch and inverse Hall–Petch behavior in nanocrystalline silicon carbide. Phys. Rev. Mater. 2021, 5, 073606. [Google Scholar] [CrossRef]
  23. Huang, A.; Fensin, S.J.; Meyers, M.A. Strain-rate effects and dynamic behavior of high entropy alloys. J. Mater. Res. Technol. 2023, 22, 307–347. [Google Scholar] [CrossRef]
  24. Sun, Z.H.; Zhang, J.; Xin, G.X.; Xie, L.; Yang, L.C.; Peng, Q. Tensile mechanical properties of CoCrFeNiTiAl high entropy alloy via molecular dynamics simulations. Intermetallics 2022, 142, 107444. [Google Scholar] [CrossRef]
  25. Thürmer, D.; Zhao, S.; Deluigi, O.R.; Stan, C.; Alhafez, I.A.; Urbassek, H.M.; Meyers, M.A.; Bringa, E.M.; Gunkelmann, N. Exceptionally high spallation strength for a high-entropy alloy demonstrated by experiments and simulations. J. Alloys Compd. 2022, 895, 162567. [Google Scholar] [CrossRef]
  26. Cao, P. Maximum strength and dislocation patterning in multi–principal element alloys. Sci. Adv. 2022, 8, eabq7433. [Google Scholar] [CrossRef]
  27. Liu, R.; Tang, J.; Jiang, J.; Li, X.; Wei, Y. Stacking fault induced hardening and grain size effect in nanocrystalline CoNiCrFeMn high-entropy alloy. Extrem. Mech. Lett. 2022, 56, 101875. [Google Scholar] [CrossRef]
  28. Vu, T.N.; Pham, V.T.; Fang, T.H. Influences of grain size, temperature, and strain rate on mechanical properties of Al0. 3CoCrFeNi high–entropy alloys. Mater. Sci. Eng. A 2022, 858, 144158. [Google Scholar] [CrossRef]
  29. Jiang, J.; Sun, W.; Luo, N. Atomic insights into effects of temperature and grain diameter on the micro-deformation mechanism, mechanical properties and sluggish diffusion of nanocrystalline high-entropy alloys. Mater. Today Commun. 2022, 33, 104224. [Google Scholar] [CrossRef]
  30. Senkov, O.N.; Pilchak, A.L.; Semiatin, S.L. Effect of Cold Deformation and Annealing on the Microstructure and Tensile Properties of a HfNbTaTiZr Refractory High Entropy Alloy. Metall. Mater. Trans. A 2018, 49, 2876–2892. [Google Scholar] [CrossRef]
  31. Chen, S.; Tseng, K.K.; Tong, Y.; Li, W.; Tsai, C.W.; Yeh, J.W.; Liaw, P.K. Grain growth and Hall–Petch relationship in a refractory HfNbTaZrTi high-entropy alloy. J. Alloys Compd. 2019, 795, 19–26. [Google Scholar] [CrossRef]
  32. Chen, S.; Aitken, Z.H.; Wu, Z.; Yu, Z.; Banerjee, R.; Zhang, Y.W. Hall–Petch and inverse Hall–Petch relations in high-entropy CoNiFeAlxCu1-x alloys. Mater. Sci. Eng. A 2020, 773, 138873. [Google Scholar] [CrossRef]
  33. Roy, A.; Devanathan, R.; Johnson, D.D.; Balasubramanian, G. Grain-size effects on the deformation in nanocrystalline multi-principal element alloy. Mater. Chem. Phys. 2022, 277, 125546. [Google Scholar] [CrossRef]
  34. Ju, S.P.; Li, C.C. Role of Local FCC Structure to the BCC Polycrystalline NbMoTaWV High-Entropy Refractory Alloy under Plastic Deformation. Phys. Status Solidi A 2022, 219, 2100834. [Google Scholar] [CrossRef]
  35. Peng, J.; Li, F.; Liu, B.; Liu, Y.; Fang, Q.; Li, J.; Liaw, P.K. Mechanical properties and deformation behavior of a refractory multiprincipal element alloy under cycle loading. J. Micromechan. Mol. Phys. 2020, 5, 2050014. [Google Scholar] [CrossRef]
  36. Liu, F.; Liaw, P.K.; Zhang, Y. Recent progress with BCC-structured high-entropy alloys. Metals 2022, 12, 501. [Google Scholar] [CrossRef]
  37. Thompson, A.P.; Aktulga, H.M.; Berger, R.; Bolintineanu, D.S.; Brown, W.M.; Crozier, P.S.; in’t Veld, P.J.; Kohlmeyer, A.; Moore, S.G.; Nguyen, T.D.; et al. LAMMPS-a flexible simulation tool for particle-based materials modeling at the atomic, meso, and continuum scales. Comput. Phys. Commun. 2022, 271, 108171. [Google Scholar] [CrossRef]
  38. Maiti, S.; Steurer, W. Structural-disorder and its effect on mechanical properties in single-phase TaNbHfZr high-entropy alloy. Acta Mater. 2016, 106, 87–97. [Google Scholar] [CrossRef]
  39. Mishra, S.; Maiti, S.; Rai, B. Computational property predictions of Ta–Nb–Hf–Zr high-entropy alloys. Sci. Rep. 2021, 11, 4815. [Google Scholar] [CrossRef]
  40. Aquistapace, F.; Vazquez, N.; Chiarpotti, M.; Deluigi, O.; Ruestes, C.J.; Bringa, E.M. Atomistic simulations of ductile failure in a BCC high-entropy alloy. High Entropy Alloy. Mater. 2022, 1–12. [Google Scholar] [CrossRef]
  41. Stukowski, A. Visualization and analysis of atomistic simulation data with OVITO–the Open Visualization Tool. Model. Simul. Mater. Sci. Eng. 2009, 18, 015012. [Google Scholar] [CrossRef]
  42. Tsuzuki, H.; Branicio, P.S.; Rino, J.P. Structural characterization of deformed crystals by analysis of common atomic neighborhood. Comput. Phys. Commun. 2007, 177, 518–523. [Google Scholar] [CrossRef]
  43. Larsen, P.M.; Schmidt, S.; Schiøtz, J. Robust structural identification via polyhedral template matching. Model. Simul. Mater. Sci. Eng. 2016, 24, 055007. [Google Scholar] [CrossRef] [Green Version]
  44. Stukowski, A. Computational Analysis Methods in Atomistic Modeling of Crystals. JOM 2014, 66, 399–407. [Google Scholar] [CrossRef]
  45. Stukowski, A. Structure identification methods for atomistic simulations of crystalline materials. Model. Simul. Mater. Sci. Eng. 2012, 20, 045021. [Google Scholar] [CrossRef] [Green Version]
  46. Lin, Z.; Leveugle, E.; Bringa, E.M.; Zhigilei, L.V. Molecular dynamics simulation of laser melting of nanocrystalline Au. J. Phys. Chem. 2010, 114, 5686–5699. [Google Scholar] [CrossRef]
  47. Nguyen-Trong, D. Z-AXIS deformation method to investigate the influence of system size, structure phase transition on mechanical properties of bulk nickel. Mater. Chem. Phys. 2020, 252, 123275. [Google Scholar] [CrossRef]
  48. Nguyen-Trong, D.; Long, V.C.; Ţălu, Ş. The influence of shape and matrix size on the mechanical properties of the 2D epoxy thin film by Monte Carlo simulation method. AIP Adv. 2023, 13, 015209. [Google Scholar] [CrossRef]
  49. Giwa, A.M.; Aitken, Z.H.; Liaw, P.K.; Zhang, Y.W.; Greer, J.R. Effect of temperature on small-scale deformation of individual face-centered-cubic and body-centered-cubic phases of an Al0.7CoCrFeNi high-entropy alloy. Mater. Des. 2020, 191, 108611. [Google Scholar] [CrossRef]
  50. Wolf, D.; Yamakov, V.; Phillpot, S.; Mukherjee, A.; Gleiter, H. Deformation of nanocrystalline materials by molecular-dynamics simulation: Relationship to experiments? Acta Mater. 2005, 53, 1–40. [Google Scholar] [CrossRef]
  51. Breiman, L. Random Forests. Mach. Learn. 2001, 45, 5–32. [Google Scholar] [CrossRef] [Green Version]
  52. Piaggi, P.M.; Parrinello, M. Entropy based fingerprint for local crystalline order. J. Chem. Phys. 2017, 147, 114112. [Google Scholar] [CrossRef]
  53. Kelchner, C.L.; Plimpton, S.J.; Hamilton, J.C. Dislocation nucleation and defect structure during surface indentation. Phys. Rev. B 1998, 58, 11085–11088. [Google Scholar] [CrossRef]
  54. Steinhardt, P.J.; Nelson, D.R.; Ronchetti, M. Bond-orientational order in liquids and glasses. Phys. Rev. B 1983, 28, 784. [Google Scholar] [CrossRef]
  55. Vimal, M.; Sandfeld, S.; Prakash, A. Grain segmentation in atomistic simulations using orientation-based iterative self-organizing data analysis. Materialia 2022, 21, 101314. [Google Scholar] [CrossRef]
  56. Dai, J.S. Euler–Rodrigues formula variations, quaternion conjugation and intrinsic connections. Mech. Mach. Theory 2015, 92, 144–152. [Google Scholar] [CrossRef]
  57. Mishra, A.; Echeverria, M.J.; Ma, K.; Parida, S.; Chen, C.; Galitskiy, S.; Dongare, A.M. Virtual texture analysis to investigate the deformation mechanisms in metal microstructures at the atomic scale. J. Mater. Sci. 2022, 57, 10549–10568. [Google Scholar] [CrossRef]
  58. Rudd, R.E. High-Rate Plastic Deformation of Nanocrystalline Tantalum to Large Strains: Molecular Dynamics Simulation. Mater. Sci. Forum 2009, 633–634, 3–19. [Google Scholar] [CrossRef] [Green Version]
  59. Ravelo, R.; Germann, T.C.; Guerrero, O.; An, Q.; Holian, B.L. Shock-induced plasticity in tantalum single crystals: Interatomic potentials and large-scale molecular-dynamics simulations. Phys. Rev. B 2013, 88, 134101. [Google Scholar] [CrossRef] [Green Version]
  60. Wang, L.; E, J.C.; Cai, Y.; Zhao, F.; Fan, D.; Luo, S.N. Shock-induced deformation of nanocrystalline Al: Characterization with orientation mapping and selected area electron diffraction. J. Appl. Phys. 2015, 117, 084301. [Google Scholar] [CrossRef]
  61. Allen, M.P.; Tildesley, D.J. Computer Simulation of Liquids; Oxford University Press: Oxford, UK, 2017. [Google Scholar]
  62. Armstrong, R.W. Metal Crystal/Polycrystal Plasticity and Strengths. Metals 2022, 12, 2070. [Google Scholar] [CrossRef]
  63. Senkov, O.N.; Scott, J.M.; Senkova, S.V.; Meisenkothen, F.; Miracle, D.B.; Woodward, C.F. Microstructure and elevated temperature properties of a refractory TaNbHfZrTi alloy. J. Mater. Sci. 2012, 47, 4062–4074. [Google Scholar] [CrossRef]
  64. Rajaram, S.S.; Gupta, A.; Thompson, G.B.; Gruber, J.; Jablokow, A.; Tucker, G.J. Grain-size-dependent grain boundary deformation during yielding in nanocrystalline materials using atomistic simulations. JOM 2020, 72, 1745–1754. [Google Scholar] [CrossRef]
  65. Saffarini, M.H.; Voyiadjis, G.Z.; Ruestes, C.J. Scaling laws for nanoporous metals under uniaxial loading. J. Mater. Res. 2021, 36, 2729–2741. [Google Scholar] [CrossRef]
  66. Hall, E. The deformation and ageing of mild steel: III discussion of results. Proc. Phys. Soc. Sect. B 1951, 64, 747. [Google Scholar] [CrossRef]
  67. Petch, N. The cleavage strength of polycrystals. J. Iron Steel Inst. 1953, 174, 25–28. [Google Scholar]
  68. Armstrong, R.W. Size effects on material yield strength/deformation/fracturing properties. J. Mater. Res. 2019, 34, 2161–2176. [Google Scholar] [CrossRef]
  69. Zhang, L.; Shibuta, Y. Inverse Hall–Petch relationship of high-entropy alloy by atomistic simulation. Mater. Lett. 2020, 274, 128024. [Google Scholar] [CrossRef]
  70. Zhao, S.; Li, Z.; Zhu, C.; Yang, W.; Zhang, Z.; Armstrong, D.E.; Grant, P.S.; Ritchie, R.O.; Meyers, M.A. Amorphization in extreme deformation of the CrMnFeCoNi high-entropy alloy. Sci. Adv. 2021, 7, eabb3108. [Google Scholar] [CrossRef]
  71. Fan, C.; Li, L.; Wen, W.; Li, H.; Fu, J.; Ruan, W.; Ren, S.; Sohrabi, S.; Zhang, Z.; Liang, X.; et al. Rapid amorphization of CrMnFeCoNi high-entropy alloy under ultrasonic vibrations. Mater. Des. 2023, 225, 111575. [Google Scholar] [CrossRef]
  72. Chen, S.; Wang, T.; Li, X.; Cheng, Y.; Zhang, G.; Gao, H. Short-range ordering and its impact on thermodynamic property of high-entropy alloys. Acta Mater. 2022, 238, 118201. [Google Scholar] [CrossRef]
  73. Ke, X.; Ye, J.; Pan, Z.; Geng, J.; Besser, M.F.; Qu, D.; Caro, A.; Marian, J.; Ott, R.T.; Wang, Y.M.; et al. Ideal maximum strengths and defect-induced softening in nanocrystalline-nanotwinned metals. Nat. Mater. 2019, 18, 1207–1214. [Google Scholar] [CrossRef]
  74. Wu, H.H.; Dong, L.S.; Wang, S.Z.; Wu, G.L.; Gao, J.H.; Yang, X.S.; Zhou, X.Y.; Mao, X.P. Local chemical ordering coordinated thermal stability of nanograined high-entropy alloys. Rare Met. 2022. [Google Scholar] [CrossRef]
  75. Liu, X.; Hua, D.; Wang, W.; Zhou, Q.; Li, S.; Shi, J.; He, Y.; Wang, H. Atomistic understanding of incipient plasticity in BCC refractory high entropy alloys. J. Alloys Compd. 2022, 920, 166058. [Google Scholar] [CrossRef]
  76. Yin, S.; Zuo, Y.; Abu-Odeh, A.; Zheng, H.; Li, X.G.; Ding, J.; Ong, S.P.; Asta, M.; Ritchie, R.O. Atomistic simulations of dislocation mobility in refractory high-entropy alloys and the effect of chemical short-range order. Nat. Commun. 2021, 12, 4873. [Google Scholar] [CrossRef]
  77. Rao, S.; Varvenne, C.; Woodward, C.; Parthasarathy, T.; Miracle, D.; Senkov, O.; Curtin, W. Atomistic simulations of dislocations in a model BCC multicomponent concentrated solid solution alloy. Acta Mater. 2017, 125, 311–320. [Google Scholar] [CrossRef] [Green Version]
  78. Lee, C.; Maresca, F.; Feng, R.; Chou, Y.; Ungar, T.; Widom, M.; An, K.; Poplawsky, J.D.; Chou, Y.C.; Liaw, P.K.; et al. Strength can be controlled by edge dislocations in refractory high-entropy alloys. Nat. Commun. 2021, 12, 5474. [Google Scholar] [CrossRef]
  79. Baruffi, C.; Maresca, F.; Curtin, W. Screw vs. edge dislocation strengthening in body-centered-cubic high entropy alloys and implications for guided alloy design. MRS Commun. 2022, 12, 1111–1118. [Google Scholar] [CrossRef]
  80. Couzinié, J.P.; Lilensten, L.; Champion, Y.; Dirras, G.; Perrière, L.; Guillot, I. On the room temperature deformation mechanisms of a TiZrHfNbTa refractory high-entropy alloy. Mater. Sci. Eng. A 2015, 645, 255–263. [Google Scholar] [CrossRef]
  81. Tseng, K.K.; Huang, H.H.; Wang, W.R.; Yeh, J.W.; Tsai, C.W. Edge-dislocation-induced ultrahigh elevated-temperature strength of HfMoNbTaW refractory high-entropy alloys. Sci. Technol. Adv. Mater. 2022, 23, 642–654. [Google Scholar] [CrossRef]
  82. Lilensten, L.; Couzinié, J.P.; Perrière, L.; Hocini, A.; Keller, C.; Dirras, G.; Guillot, I. Study of a bcc multi-principal element alloy: Tensile and simple shear properties and underlying deformation mechanisms. Acta Mater. 2018, 142, 131–141. [Google Scholar] [CrossRef]
  83. Rodriguez-Nieva, J.; Ruestes, C.; Tang, Y.; Bringa, E. Atomistic simulation of the mechanical properties of nanoporous gold. Acta Mater. 2014, 80, 67–76. [Google Scholar] [CrossRef]
  84. Bringa, E.M.; Rosolankova, K.; Rudd, R.E.; Remington, B.A.; Wark, J.S.; Duchaineau, M.; Kalantar, D.H.; Hawreliak, J.; Belak, J. Shock deformation of face-centred-cubic metals on subnanosecond timescales. Nat. Mater. 2006, 5, 805–809. [Google Scholar] [CrossRef]
  85. Alhafez, I.A.; Ruestes, C.J.; Bringa, E.M.; Urbassek, H.M. Nanoindentation into a high-entropy alloy—An atomistic study. J. Alloys Compd. 2019, 803, 618–624. [Google Scholar] [CrossRef]
  86. Tramontina, D.; Erhart, P.; Germann, T.; Hawreliak, J.; Higginbotham, A.; Park, N.; Ravelo, R.; Stukowski, A.; Suggit, M.; Tang, Y.; et al. Molecular dynamics simulations of shock-induced plasticity in tantalum. High Energy Density Phys. 2014, 10, 9–15. [Google Scholar] [CrossRef]
  87. Wei, G.; Xie, H.; Yin, F.; Lu, G. Twinning mechanism asymmetry in body-centered cubic tantalum under [001] uniaxial compression/tension. Phys. Rev. Mater. 2021, 5, 123604. [Google Scholar] [CrossRef]
  88. Aitken, Z.H.; Zhang, Y.W. Revealing the deformation twinning nucleation mechanism of BCC HEAs. MRS Commun. 2019, 9, 406–412. [Google Scholar] [CrossRef]
  89. Chen, S.; Aitken, Z.H.; Pattamatta, S.; Wu, Z.; Yu, Z.G.; Srolovitz, D.J.; Liaw, P.K.; Zhang, Y.W. Simultaneously enhancing the ultimate strength and ductility of high-entropy alloys via short-range ordering. Nat. Commun. 2021, 12, 4953. [Google Scholar] [CrossRef]
  90. Rao, Y.; Baruffi, C.; De Luca, A.; Leinenbach, C.; Curtin, W. Theory-guided design of high-strength, high-melting point, ductile, low-density, single-phase BCC high entropy alloys. Acta Mater. 2022, 237, 118132. [Google Scholar] [CrossRef]
Figure 1. Grain segmentation for the (a) 8 nm and (b) 17 nm samples. (c) Comparison of the real and nominal grain diameters for the nc HEAs and nc Ta at zero strain. Random coloring was used in grains for visualization.
Crystals 13 00357 g001
Figure 2. Stress–strain curves for simulations under tensile loading in different grain-sized noncrystalline samples and the single crystal case. A drop in stress is observed in the single crystal at 0.1 strain, consistent with the simultaneous activation of the dislocation and twinning deformation modes.
Crystals 13 00357 g002
Figure 3. (a) Elastic modulus (E), (b) yield stress, (c) ultimate tensile stress (UTS), and (d) flow stress. A single crystal result is given as having a grain size of 100 nm. Lines indicates a Hall–Petch and inverse Hall–Petch fit.
Crystals 13 00357 g003
Figure 4. Snapshots at 0.4 strain for (a) 17 nm, (b) 8 nm, and (c) 5 nm. (d) Detail of (c) particle distribution evidencing crystalline and non-crystalline structures. Only a slice 0.5 nm thick is shown. PTM (blue = bcc and gray = others).
Crystals 13 00357 g004
Figure 5. Radial distribution functions for a d = 5 nm nanocrystal for several strains. Sample loses long correlation as deformation evolves.
Crystals 13 00357 g005
Figure 6. Variation of (a) average grain diameter and (b) number of GB atoms during the tensile test.
Crystals 13 00357 g006
Figure 7. Cumulative shear strain for atoms in grain boundaries, for d = 8 nm and d = 17 nm. Here, PTM from OVITO was used to select atoms with "other" structure to measure their atomic strain.
Crystals 13 00357 g007
Figure 8. Dislocation density evolution with strain for different grain sizes, together with the single-crystal case. Note that this last case was divided by 5 for better appreciation.
Crystals 13 00357 g008
Figure 9. d = 8 nm. Upper row. PTM (blue = bcc, gray = others). Middle row: Inverse Pole Fraction coloring. Bottom row: Shear strain (SS) Coloring. Reference frame: 0.2 strain. Left column. Frames at zero strain. Right column. Frames at 0.40 strain. Slices are 0.4 nm thick.
Crystals 13 00357 g009
Figure 10. d = 17 nm. Upper row. PTM (blue = bcc, gray = others). Middle row: Inverse Pole Fraction coloring. Bottom row: Shear strain Coloring. Reference frame: 20%. Left column. Frames at zero strain. Right column. Frames at 0.40 strain. Slices are 0.4 nm thick.
Crystals 13 00357 g010
Figure 11. Twin volume fraction (TVF) evolution with strain, for two different grain sizes. The fraction is calculated with respect to the total volume of the sample.
Crystals 13 00357 g011
Table 1. Hall–Petch and Inverse Hall–Petch parameters for HfNbTaZr nc.
σ 0 (GPa)k (GPa nm 1 / 2 )
σ Y 1 0.83.7
σ Y 2 2.6−2.9
σ U T S 1 1.56.3
σ U T S 2 4.3−3.8
σ F S 1 010
σ F S 2 3.5−3.4
Disclaimer/Publisher’s Note: The statements, opinions and data contained in all publications are solely those of the individual author(s) and contributor(s) and not of MDPI and/or the editor(s). MDPI and/or the editor(s) disclaim responsibility for any injury to people or property resulting from any ideas, methods, instructions or products referred to in the content.

