Article

The Effect of Deformation Temperature on the Deformation Mechanism of a Medium-Mn Advanced High-Strength Steel (AHSS)

Research Center for Physical Properties and Microstructure of Metals, Department of Materials and Optoelectronic Science, National Sun Yat-Sen University, Kaohsiung 80424, Taiwan
*
Author to whom correspondence should be addressed.
Crystals 2023, 13(2), 328; https://doi.org/10.3390/cryst13020328
Submission received: 19 January 2023 / Revised: 10 February 2023 / Accepted: 10 February 2023 / Published: 15 February 2023

Abstract

:
The deformation mechanism of a medium-Mn advanced high strength steel (AHSS) over a temperature range from 25 °C to 400 °C has been studied. Scanning electron microscopy (SEM) and transmission electron microscopy (TEM) were used to characterize the microstructures of specimens after the tensile test at different temperatures. Four deformation mechanisms were found, namely deformation-induced martensitic (DIM) transformation, deformation-induced bainitic (DIB) transformation, deformation twinning and dislocation glide. Among these deformation mechanisms, DIM and DIB were very effective mechanisms to contribute work hardening. The product of ultimate tensile strength (UTS) and total elongation (TEL) of the AHSS reached a value higher than 65 GPa%, when these two mechanisms occurred. The highest UTS × TEL value of 84 GPa% was obtained at 150 °C. From the results of the present research, it is suggested that warm working is a good processing route for obtaining a combination of high strength and high ductility in medium-Mn AHSS.

1. Introduction

Medium manganese (Mn) steel, which contains ~3 to 10 wt% Mn, is classified as the third generation advanced high-strength steel (AHSS) [1,2,3]. The medium-Mn AHSS has high-strength and high-elongation, the product of the ultimate tensile strength (UTS) and the total elongation (TEL) is higher than 20 GPa%, and therefore it has attracted intensive attention from the materials community over the last few years [4,5,6,7,8,9,10,11,12]. The combination of the high-strength and the high-elongation of these steels is mainly a result of the high work-hardening rate due to the deformation-induced martensitic (DIM) transformation when it is deformed at room temperature [13,14].
The behavior of DIM transformation, which controls the work hardening of medium-Mn steels, depends on the stability of the austenite grains. In the literature [15,16,17,18,19], researchers studied the effects of the grain size, the shape and the neighboring phases of retained austenite grains on the deformation behavior of transformation-induced plasticity (TRIP) steels, since these factors could affect the stability of the retained austenite grains, and therefore affect the behavior of DIM. The stability of the retained austenite grain is also determined by the stacking fault energy, which depends on the chemical composition of the austenite grains. In the literature [4,8,12,20,21,22,23,24,25,26], the effects of chemical compositions and inter-critical annealing conditions have been studied to obtain the desired deformation behavior to achieve a combination of high-strength and high-elongation of these steels.
The stacking fault energy of closed-packed alloys increases with increasing temperature [27,28], therefore when deformed at elevated temperatures, other deformation mechanisms may replace DIM transformation, and the deformation behavior of the austenite will be changed. Using first generation TRIP steels, Sugimoto et al. [29] studied the tensile behaviors and microstructures of 1.5 wt% Mn steels when deformed at temperatures between 27 °C and 500 °C. By measuring the austenite volume fractions after deformation, they concluded that increasing the deformation temperature from 27 °C caused the amount of DIM transformation to gradually decrease, and eventually the DIM transformation disappeared at temperatures above 250 °C. Above 250 °C, the deformation-induced bainitic (DIB) transformation started, and the amount of DIB gradually increased with increasing deformation temperature. Apart from DIM and DIB, deformation twins were found in the specimens tested at 150 °C, and were frequently seen above 250 °C. No deformation twins were found at room temperature. Wang et al. [30] investigated the effect of deformation temperature on the microstructure and tensile behavior of a TRIP steel. The steel that was studied contained 1.1 wt% Mn, and the deformation temperature range studied was between 25 °C and 450 °C. From the microstructures and volume fractions of the retained austenite measured after the tensile tests, Wang et al. reported that DIM transformation and deformation twining occurred between 25 °C and 150 °C, and within this temperature range, increasing deformation temperature progressively suppressed both DIM transformation and deformation twining. In the temperature range between 150 °C and 300 °C, DIB replaced DIM, and DIB transformation increased with increasing temperature. As the deformation temperature increased above 300 °C, DIB transformation decreased and dislocation activity gradually replaced DIB transformation with increasing temperature.
There are limited studies that focused on temperature dependent deformation mechanisms for medium-Mn AHSS. Sugimoto et al. [31] studied the tensile behavior and microstructures of a medium-Mn AHSS which contained 5 wt% Mn. The deformation temperature range studied was between −70 °C and 300 °C. Surprisingly, these authors found only DIM, but not DIB. The amount of DIM gradually decreased with increasing deformation temperature. Kozłowska et al. [32,33] studied medium-Mn AHSS having Mn content between 3 wt% and 5 wt%. The temperature range studied was between −60 °C and 200 °C. In this temperature range, only DIM was found. Reduction of the TRIP effect due to decreased DIM with increasing deformation temperature was also reported.
Martin et al. [34,35] studied the deformation mechanisms in a high-alloy austenitic steel as a function of the deformation temperature. The composition of the steel used was 6.1 wt% Mn, 6.1 wt%, Ni, 15.5 wt% Cr, 0.9 wt% Si, 0.14 wt% Al, 0.03 wt % N and 0.03 wt% C. These authors reported that when the austenite was deformed below 100 °C, DIM transformation occurred, when deformed between 100 °C and 200 °C, deformation twinning became the dominant deformation mechanism, and at temperatures above 200 °C, dislocation glide replaced twinning as the dominant deformation mechanism.
Medium-Mn AHSS is an important class of structural steel, particular in the automotive industry. Plastic deformation at elevated temperatures is a common working process for steels, it is therefore important to understand the deformation mechanisms at elevated temperatures of medium-Mn AHSS. The aim of the present research was to provide greater metallurgical understanding on this subject.

2. Materials and Methods

The material used in this study was Fe-5% Mn-2% Al-1% Si-0.3% C (all in wt%). A slab of 50 kg was homogenized at 1200 °C for two hours, subsequently it was hot-rolled from 10 cm thickness down to 0.4 cm, and subsequently annealed at 680 °C for one hour. The annealed plate was milled down to 2 mm then cold rolled to 1.5 mm. Inter-critical annealing of the cold-rolled sheet was performed at 725 °C for 0.5 h. Tensile tests were carried out under a constant strain rate of 1 × 10⁻⁵ s−1 using an Instron 5582 universal testing machine. The schematic diagram of tensile test specimens is given in the Supplementary Materials (Figure S1). The dimension of the gauge section of tensile specimens was 20 mm × 4 mm × 1.5 mm. Tensile tests were performed in the temperature range between 25 °C and 400 °C. Scanning electron microscopy (SEM) and electron backscattered diffraction (EBSD) were performed along the transverse direction (TD) of the specimens. Specimens for SEM and EBSD were electro-polished/etched in a solution of 1 part of perchloric acid and 4 parts of acetic acid under 25 V at −5 °C. A Zeiss Supra 55 scanning electron microscope was used, which was equipped with a Schottky-type field emission source. The EBSD system used was AZtec from Oxford Instruments equipped with a NordlysMax detector. EBSD analyses were performed under an acceleration voltage of 20 kV. Thin foils for transmission electron microscopy (TEM) were first sliced from the gauge part of a tensile tested specimen, then mechanically thinned down to about 100 µm thick and finally polished by standard twin-jet polishing method using an electrolyte of 10% perchloric acid and 90% methanol at −30 °C and 12 volts. TEM was carried out using an FEI Tecnai G2 F20 microscope equipped with an Oxford Instruments AZtec Energy dispersive X-ray analysis system. All analyses were operated at 200 kV. To determine austenite volume fraction, a Bruker D8 advance X-ray diffractometer was used. The scan speed of the diffractometer used was 0.02 o/s. TOPAS software was used to calculate the phase volume fraction, in which {111}, {200}, {220} and {311} diffractions were used for the calculation of austenite, and {110}, {200} and {211} diffractions for ferrite calculation.

3. Results

The microstructure after inter-critical annealing consisted of ultrafine-grained ferrite and austenite as shown in Figure 1. In Figure 1a, the bright spots in some ferrite grains resulted from the etching effect, they are not second phase particles. The white stars are registration marks. Figure 1b is the EBSD phase map from the same area of Figure 1a, in which the blue color represents the fcc phase (austenite), the red color represents the bcc phase (ferrite), and the black color represents the unindexed points. The austenite phase fraction was determined to be 45%. In the EBSD analyses, the grains were defined as the areas delineated by boundaries having 15° misorientation, and the average grain size after inter-critical annealing was determined to be 0.75 μm.
Figure 2 shows the engineering stress-strain curves of specimens tested at temperatures between 25 °C and 400 °C, under a constant strain rate of 1 × 10⁻⁵ s−1. Table 1 gives the UTS, TEL and UTS × TEL at each of the test temperatures.
From Table 1, it can be seen that the UTS has the highest value of 1156 MPa at room temperature, and as the temperature increases, it exhibits a gradual decrease followed by an increase to a second peak value of 1137 MPa at 150 °C. For temperatures higher than 150 °C, the UTS decreases continuously with increasing temperature. The TEL firstly increases with increasing temperature up to a peak value of 78% at 100 °C, and then decreases gradually with increasing temperature.
Figure 3 shows the microstructures after tensile tests at room temperature. After 22% elongation, DIM appears in some austenite grains as shown in Figure 3a. These DIM grains appear in forms either extending across the austenite grain or with a pointed tip stopped in the austenite grain interior. All DIMs found in this research are α’ martensite as indexed by EBSD. These DIM grains appear on top of the austenite grain surface in a secondary electron image, because they are relatively inert to the etchant. This is an important image character to differentiate DIM from DIB in the following analyses. In specimens that have been tensile tested to fracture, nearly all austenite grains have transformed to martensite, as shown in Figure 3b, in which only a small fraction of austenite grains remain untransformed, one example being marked by arrow. Figure 3c shows a higher magnification of the area marked by the arrow. Figure 3d is the EBSD phase map of the same area of Figure 3b. It indicates that virtually all the grains are in bcc phase (ferrite or martensite). The unindexed black areas could be due to the strain fields that resulted from the DIM transformation. After being tensile tested at room temperature, the austenite phase fraction decreased from 45% to 4%.
In the specimen tested at 75 °C to fracture, both DIM and the retained austenite were observed, as shown in Figure 4. Some untransformed austenite areas were marked by arrows in Figure 4b. Comparing Figure 3d and Figure 4c, one can find more austenite phase in Figure 4c, indicating that increasing test temperature could suppress DIM transformation. The austenite fraction after tensile test at 75 °C was 15%.
Increasing the tensile test temperatures to 100 °C and 125 °C, the microstructures revealed in Figure 5 changed considerably. Nearly all austenite grains showed a very fine deformation-induced structure, which appeared as a concave structure in the austenite grains. The arrows in Figure 5b mark the areas of untransformed austenite, which exhibited a relatively smooth surface. Figure 5c shows a higher magnification of the area highlighted by the dotted line in Figure 5b, and the white arrow in Figure 5c indicates the untransformed austenite area. We note that in Figure 3a,b, DIMs appeared on top of the austenite grain surfaces, and they had a convex rather than a concave appearance. Figure 5d is the EBSD phase map of Figure 5b. The deformation-induced fine structure has been indexed by the EBSD either as the bcc phase or as being unable to be resolved due to its very fine structure and the strain field in it. The austenite fractions after tensile test at 100 °C and 125 °C dropped to very low values of 5% and 4%, respectively.
For the specimens tested to fracture at 175 °C, deformation-induced structure of concave appearance was found, which was coarser than that formed at 125 °C (see Figure 6). Figure 6b is the EBSD phase map of Figure 6a. The deformation-induced structure was determined to be in bcc phase, e.g., as marked by the yellow arrows in Figure 6a,b, and it might be resultant from the DIB. The amount of the deformation-induced structure is greater than that formed at lower testing temperatures. In Figure 6b, black areas are unindexed points, which might be due to the strain field associated with the DIB transformation. The austenite fraction after the tensile test at 175 °C was 6%. The structure of the DIB was examined by the TEM. The DIB exhibited typical subunit/sheaf morphology of conventional bainite [36], as shown in Figure 7. Figure 7a,b show TEM bright and dark field images, respectively, of a specimen tested at 175 °C to an elongation of 30%. In Figure 7a, the bainite sheaves showed dark diffraction contrast, since it was imaged along the [111] beam direction of bainite. The diffraction pattern of the bainite phase is shown at the upper right corner in Figure 7a. The beam direction of this pattern is [111]. From Figure 7a,b, it was seen that tangle dislocations exist in DIBs, and no evidence of carbide was found. Table 2 shows the results of the chemical composition in DIBs measured at positions 1 to 3 marked in Figure 7a, and as measured by the use of the EDS in the TEM. Noting that carbon is not in the EDS results, due to the high measurement uncertainty of the light element in the TEM by the EDS. The value of each element in Table 2 is a result of normalizing with the sum of the four elements to 100%. After tilting from the beam direction of Figure 7a, a selected area diffraction pattern (SADP) obtained from a larger area, the dotted circle in Figure 7a, included both the austenite matrix and DIB, and showed the orientation relationship (OR) between the DIB and the austenite matrix (see Figure 7c). When the selected area diffraction pattern (SADP) obtained from a larger area included both austenite matrix and DIB, the orientation relationship between the DIB and the austenite matrix can been determined, see Figure 7c. The SADP is from the beam direction [001] of bainite and [011] of austenite, where the red and blue letters are for bainite and austenite, respectively. From Figure 7c, the orientation relationship (OR) between bainite and austenite can be determined to be ( 1 1 ¯ 1 ) γ / /   ( 110 ) α , [ 011 ] γ / / [ 001 ] α , [ 21 1 ¯ ] γ / /   [ 1 ¯ 10 ] α , which is the Nishiyama–Wasserman (N–W) OR [37].
By further increasing the test temperature, the structure of DIBs became coarser, and the EBSD indexing hit rate increased. Figure 8 shows the SEM micrograph and its EBSD phase map of a specimen tested at 200 °C to an elongation of 30%. Figure 8a shows that when deformed at 200 °C, DIBs can grow to several hundred nanometers, as marked by the yellow arrows. In Figure 8b, many fewer unindexed black areas exist due to the coarser DIB structure and the dynamic recovery effect. When tested at 200 °C, twin-like traces began to appear in some austenite grains, as shown in Figure 9. Because of the limitation of the EBSD to identify these fine traces, the TEM was used to verify the formation of deformation twins. Figure 10 shows deformation nano-twins formed in an austenite grain after the specimen was tested at 200 °C to an elongation of 30%. The austenite fraction in a specimen after tensile test to fracture at 200 °C was 15%, which was higher than the value of 6% after tested at 175 °C.
Figure 11a shows the microstructure of a specimen tested at 225 °C to an elongation of 30%. At this temperature, deformation twin traces appear frequently in the austenite grains, as marked by the arrows in Figure 11a. In specimens tested at 225 °C to fracture, apart from the twin traces, a small amount of DIBs was found (see Figure 11b). The austenite fraction after tensile test increased significantly to a value of 36%, which means only approximately 10% of the austenite transformed into bainite during the tensile test. A significant amount of deformation nano-twins in specimens tested at 225 °C to fracture was revealed by the TEM, as shown in Figure 12. In Figure 12a, the TEM bright field image shows a tangle of dislocations and two sets of deformation twins in an austenite grain. Figure 12b shows the SADP from the area marked by the yellow circle in Figure 12a. The weak extra diffraction spots indexed are from two sets of twins, and these two sets of deformation nano-twins can be seen by dark field images, see Figure 12c,d.
No DIB can be found in specimens tested at 300 °C, in which the number of austenite grains containing twin traces decreased (see Figure 13). In specimens tested at 350 °C, not only the number of austenite grains containing twin traces decreased further, but the density of the twin traces within austenite grains also decreased (see Figure 14). Figure 14a shows low density of the twin traces in some austenite grains, as marked by arrows, and Figure 14b shows austenite grains free of twin trace. Figure 15 illustrates an example of the tangle dislocations in an austenite grain. Pearlitic transformation occurred in specimens tested at the highest test temperature, 400 °C, as shown Figure 16.

4. Discussion

Before discussing deformation mechanisms, the identification of DIB will be described, due to the following reasons.
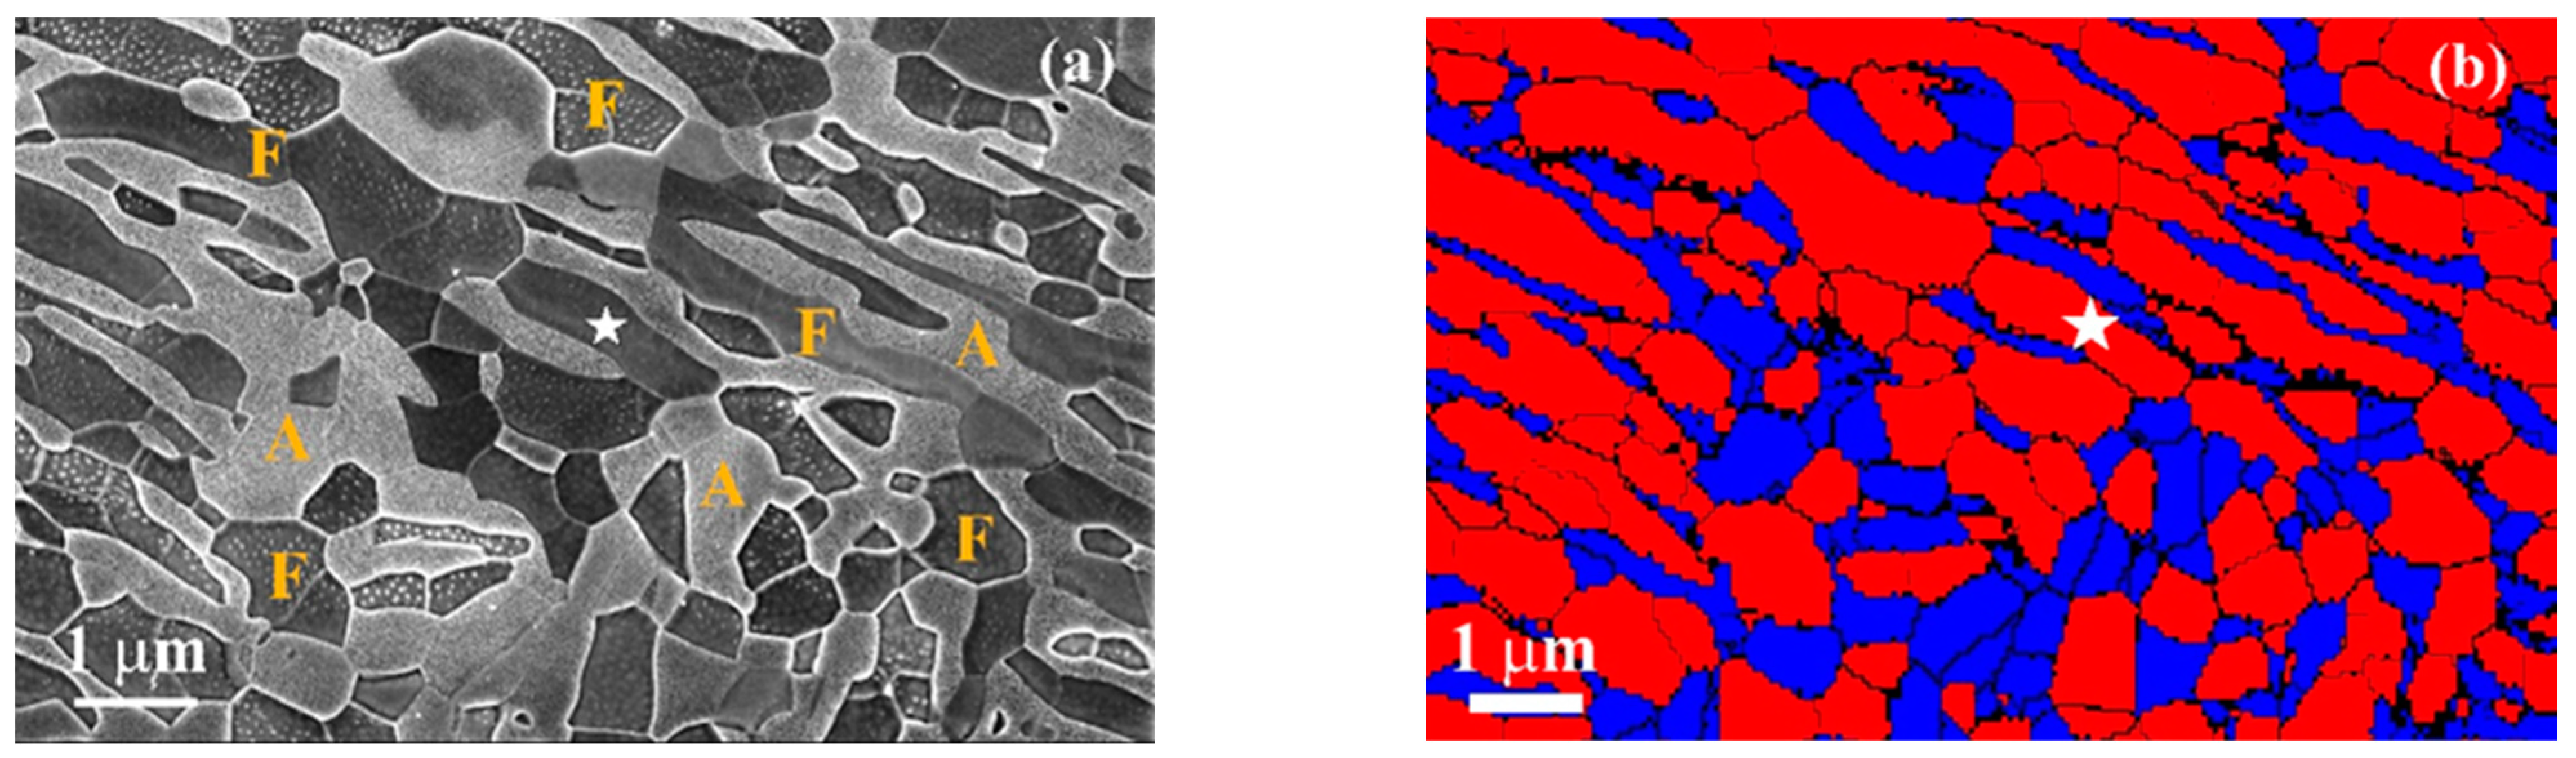
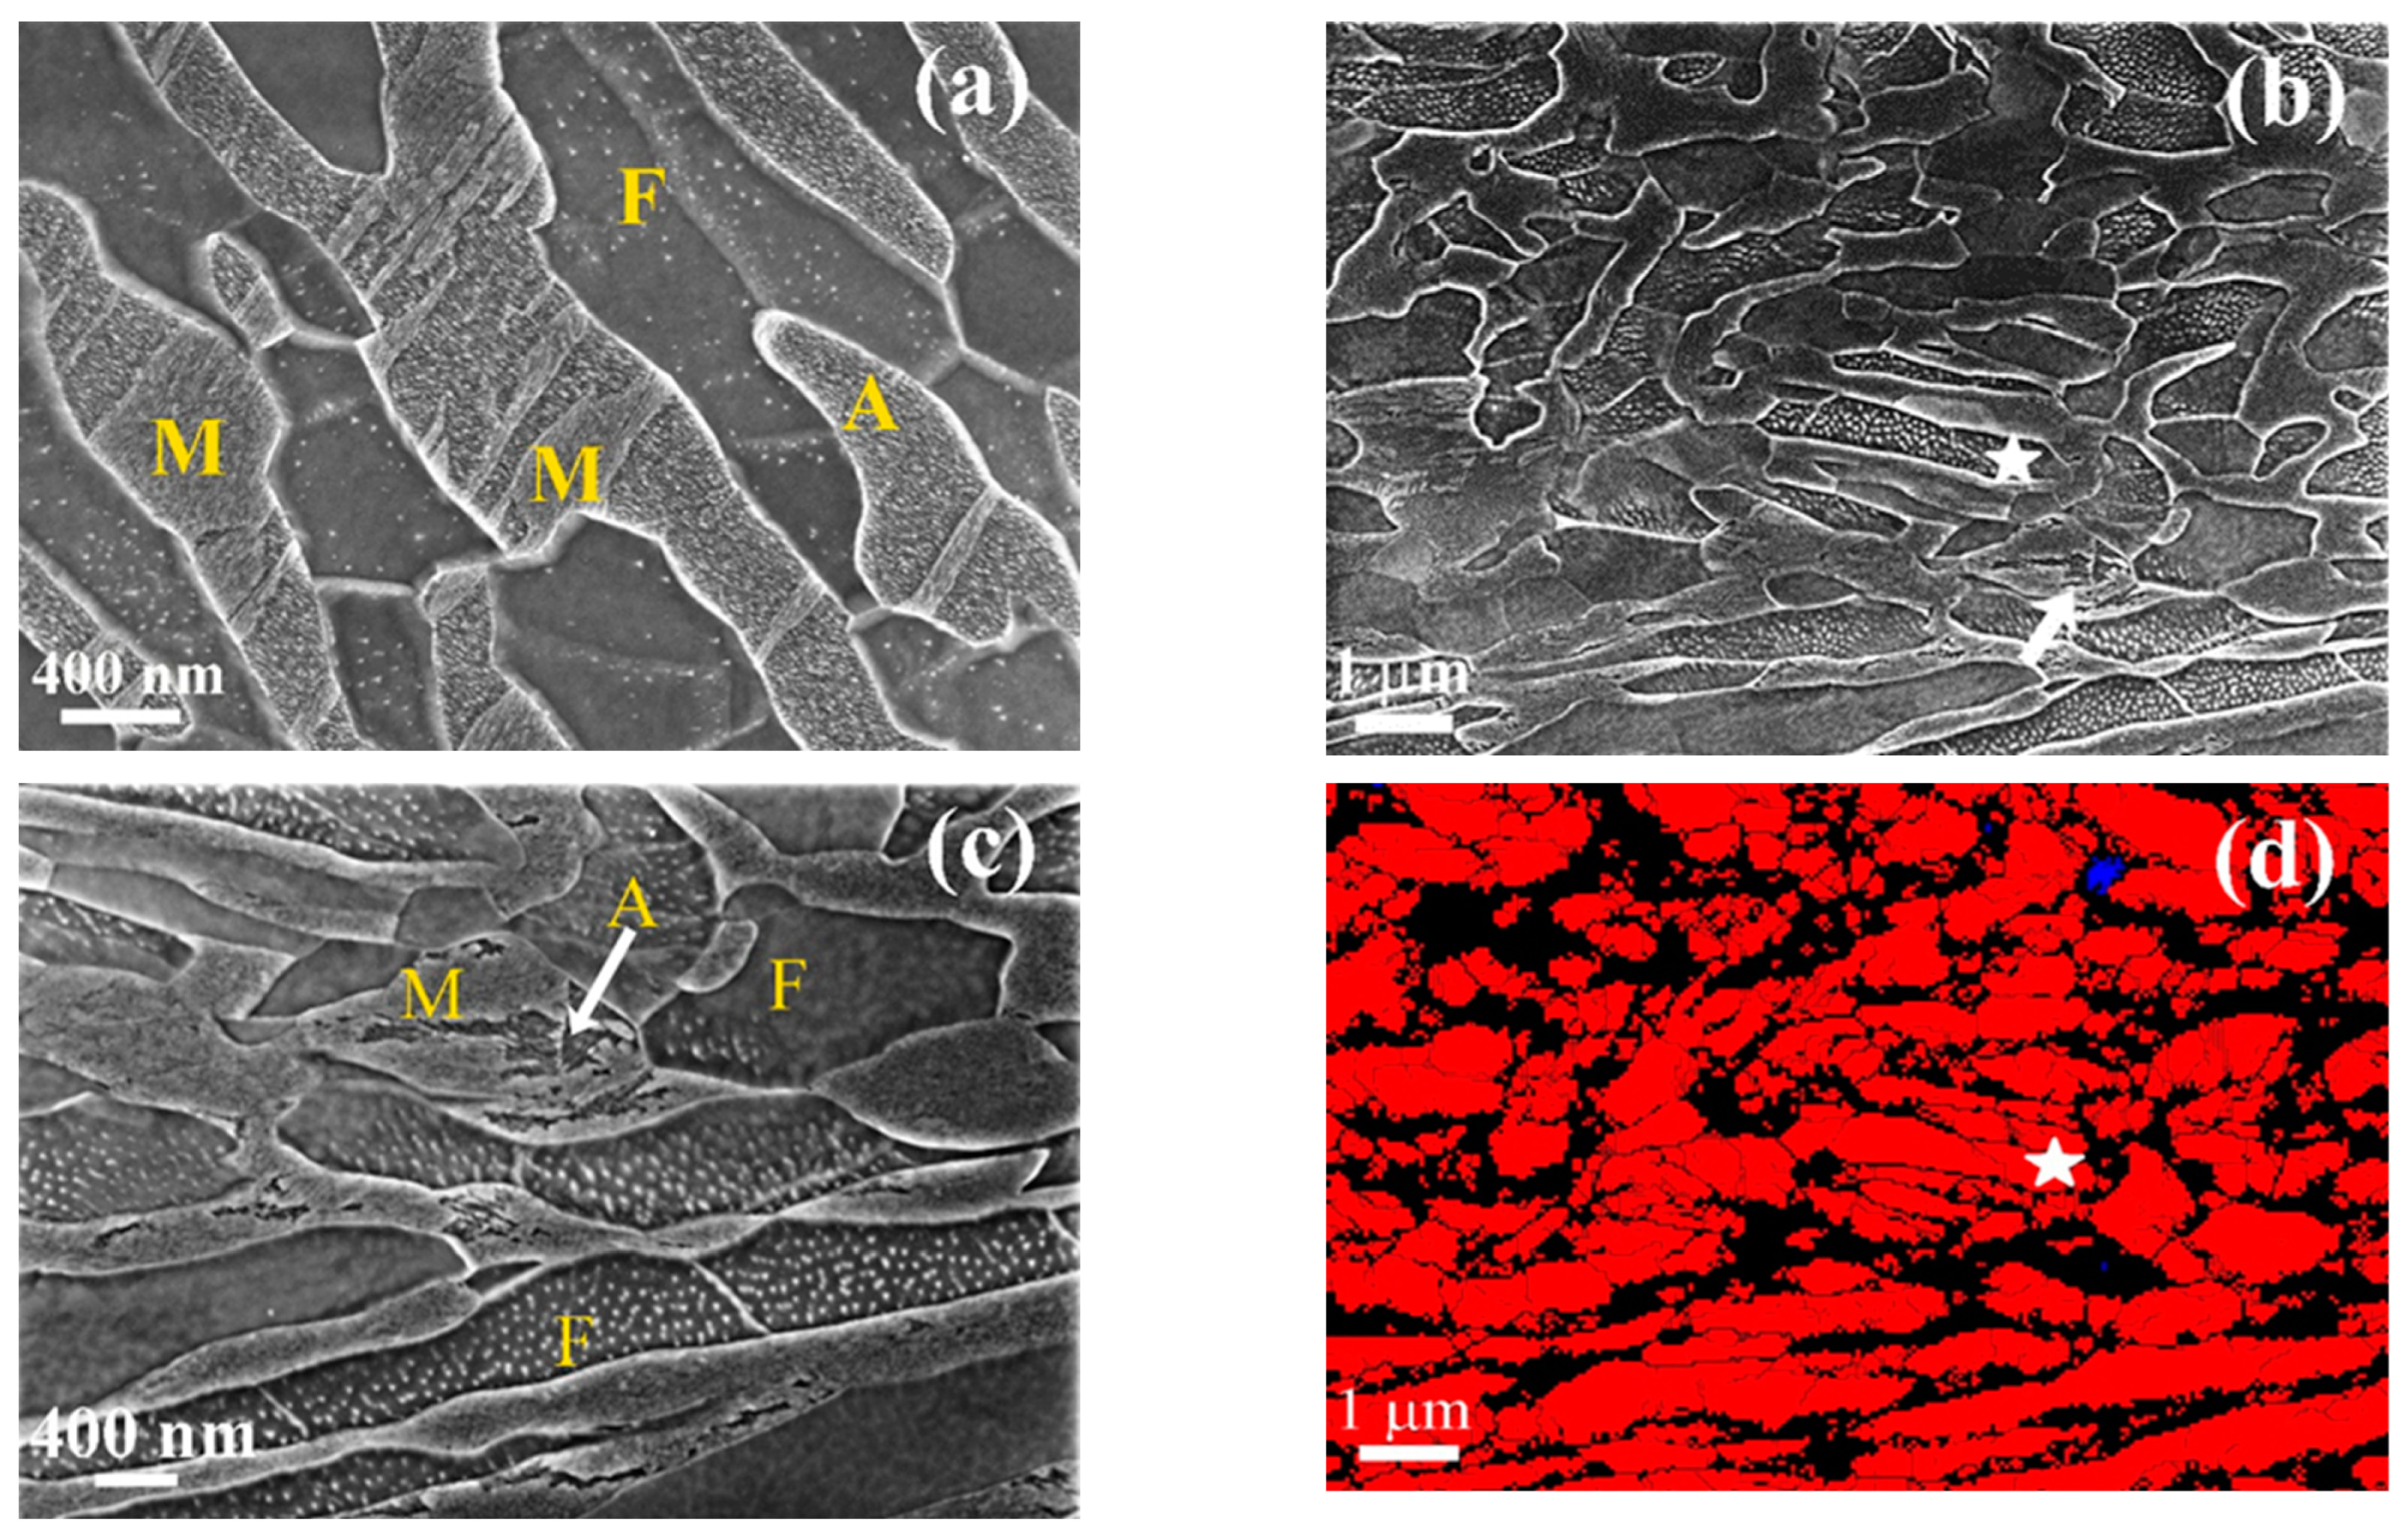
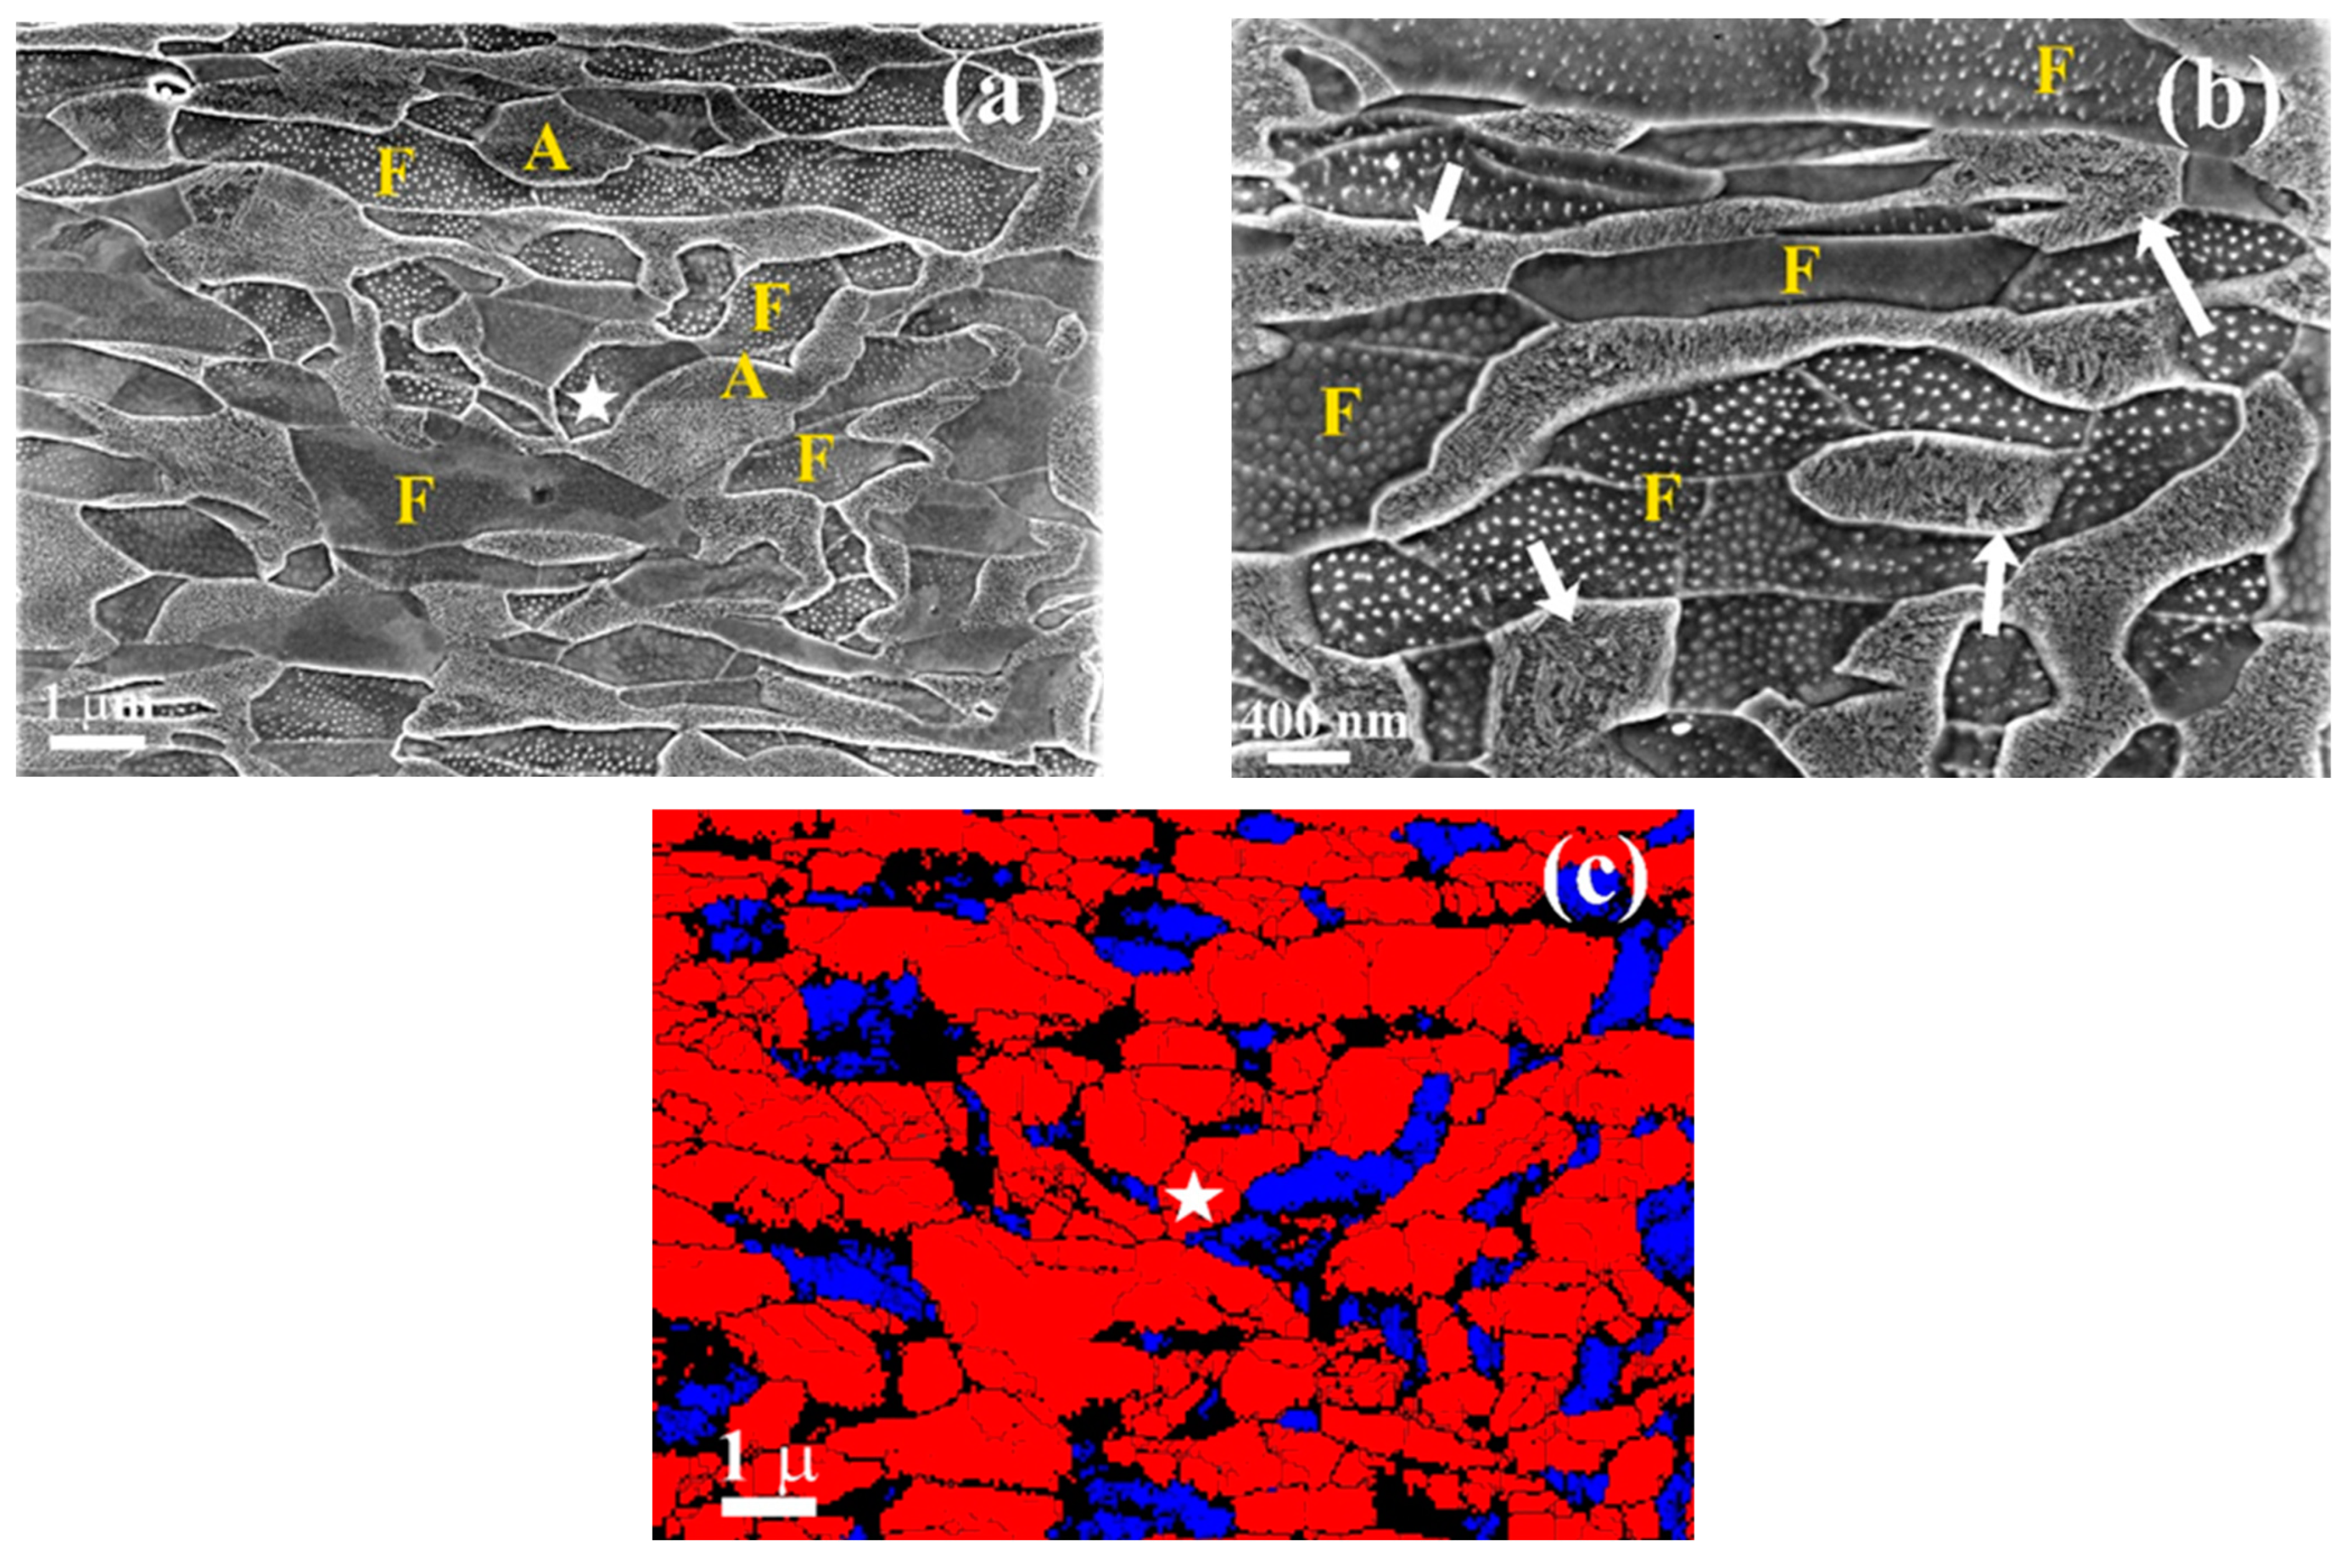
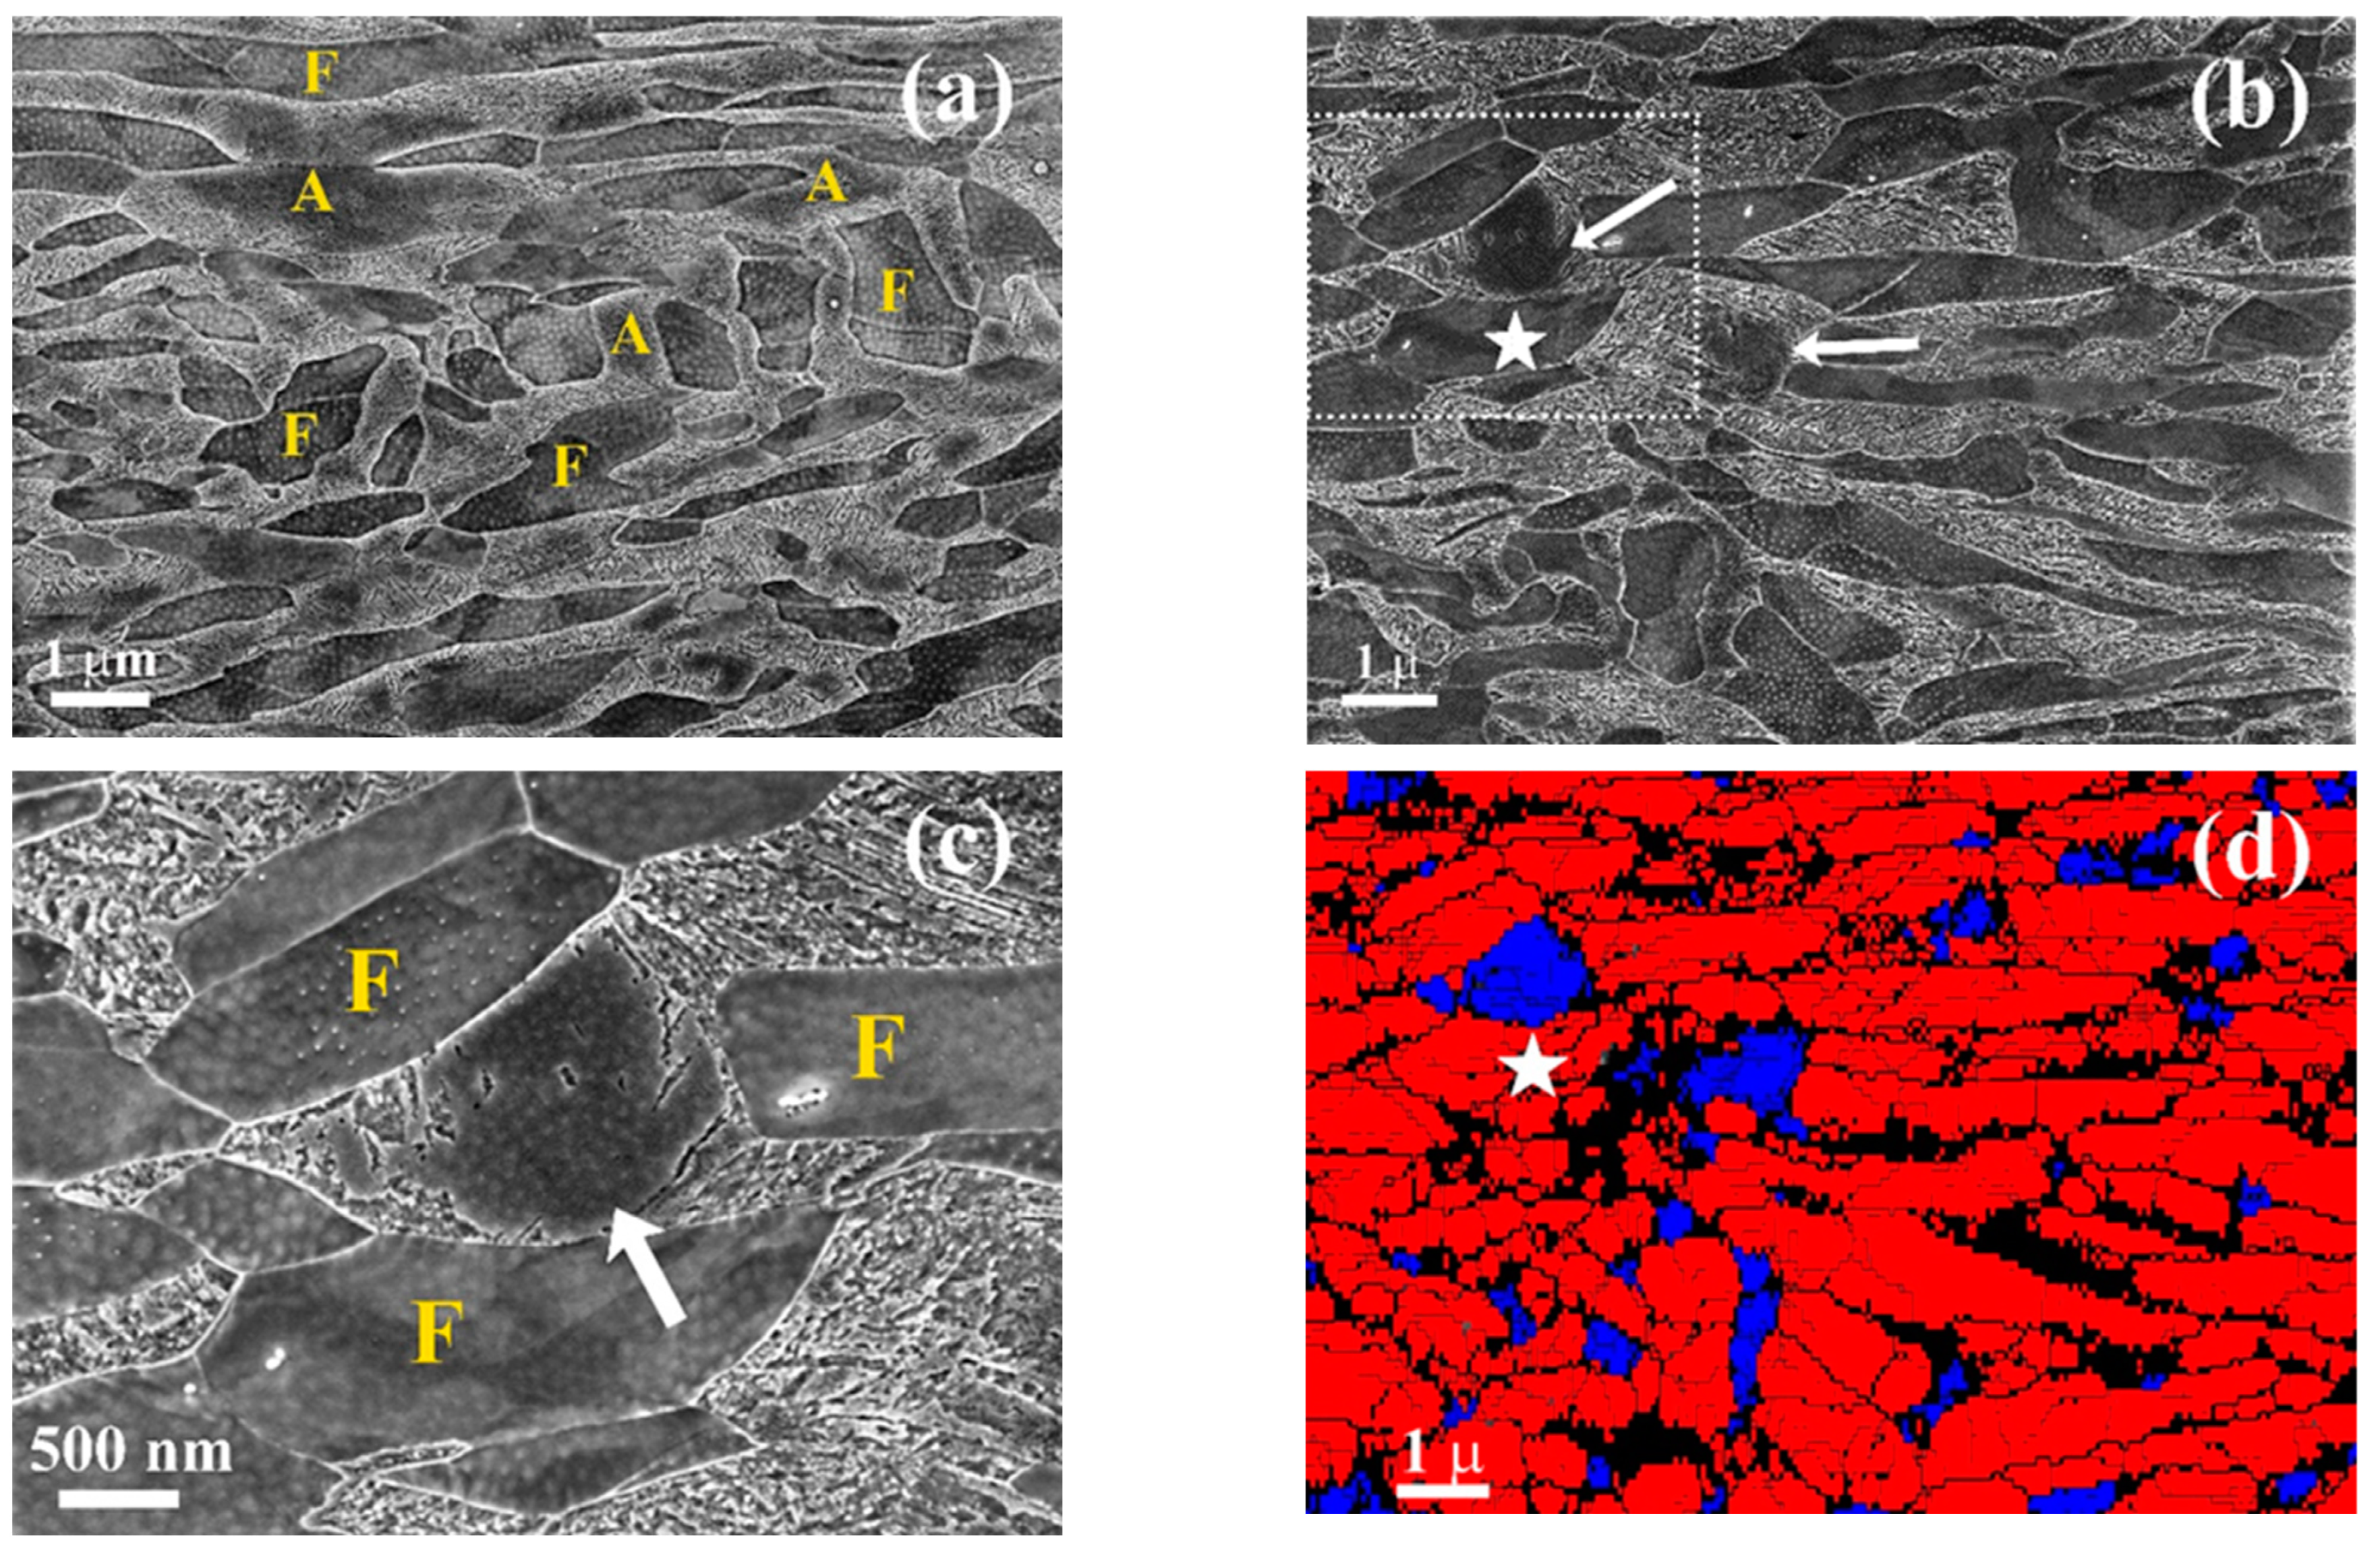
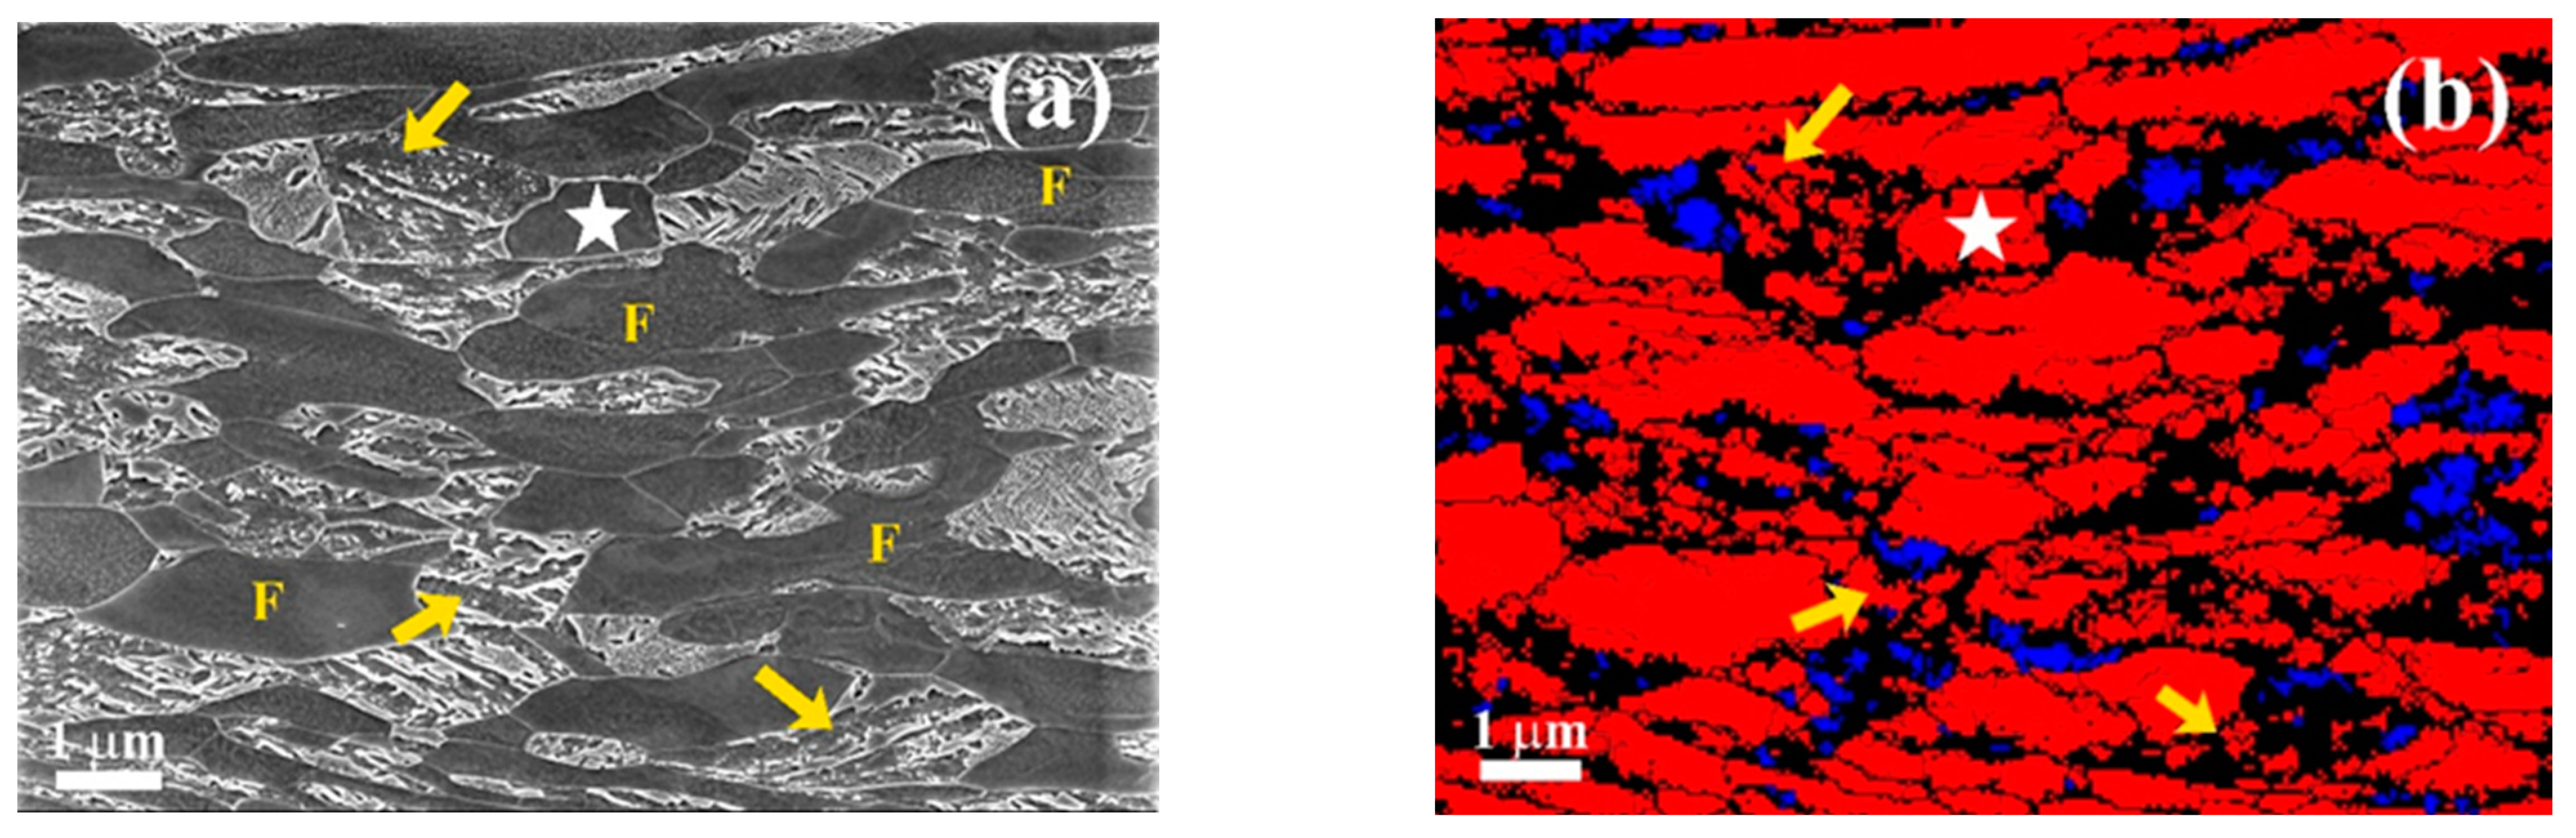
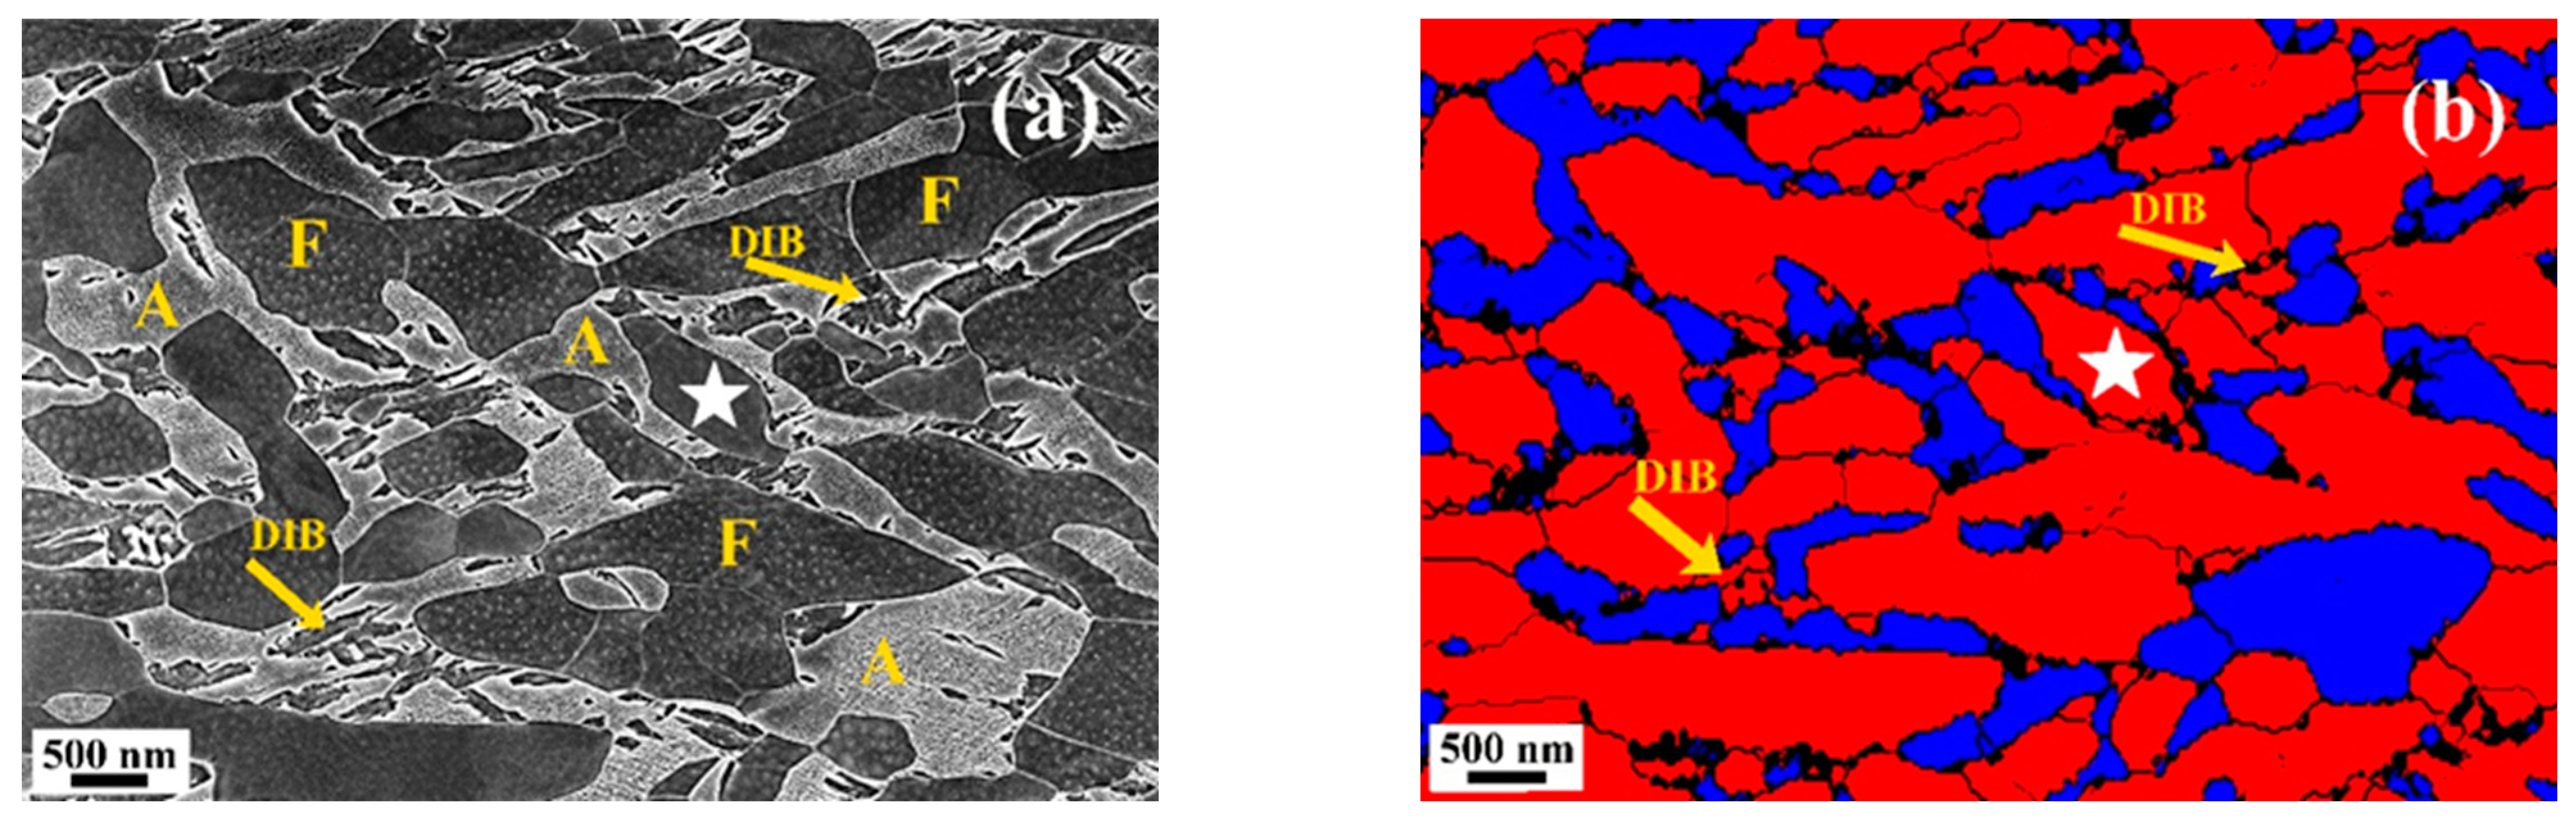
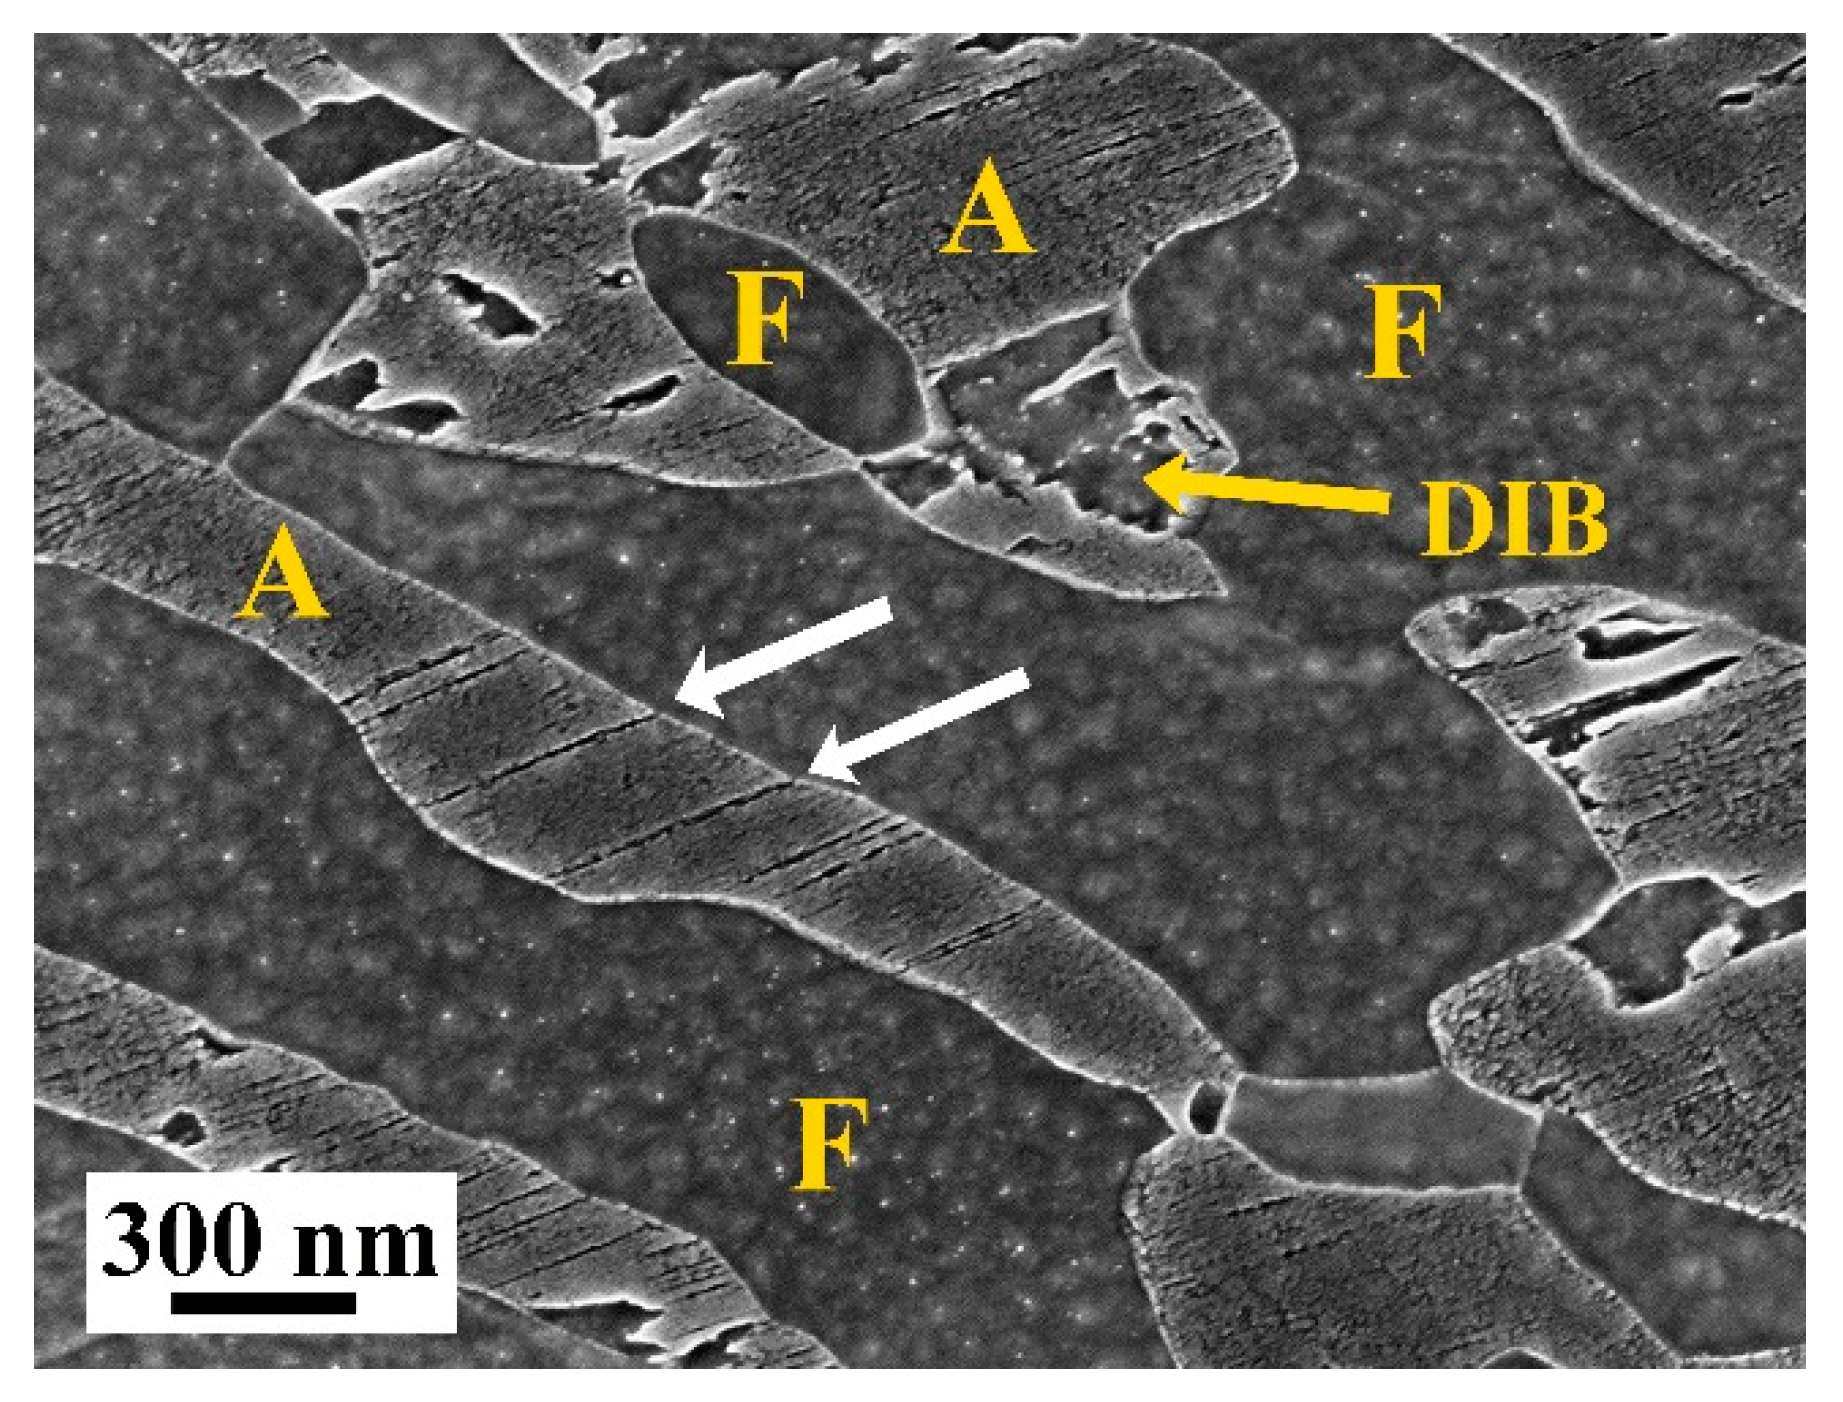
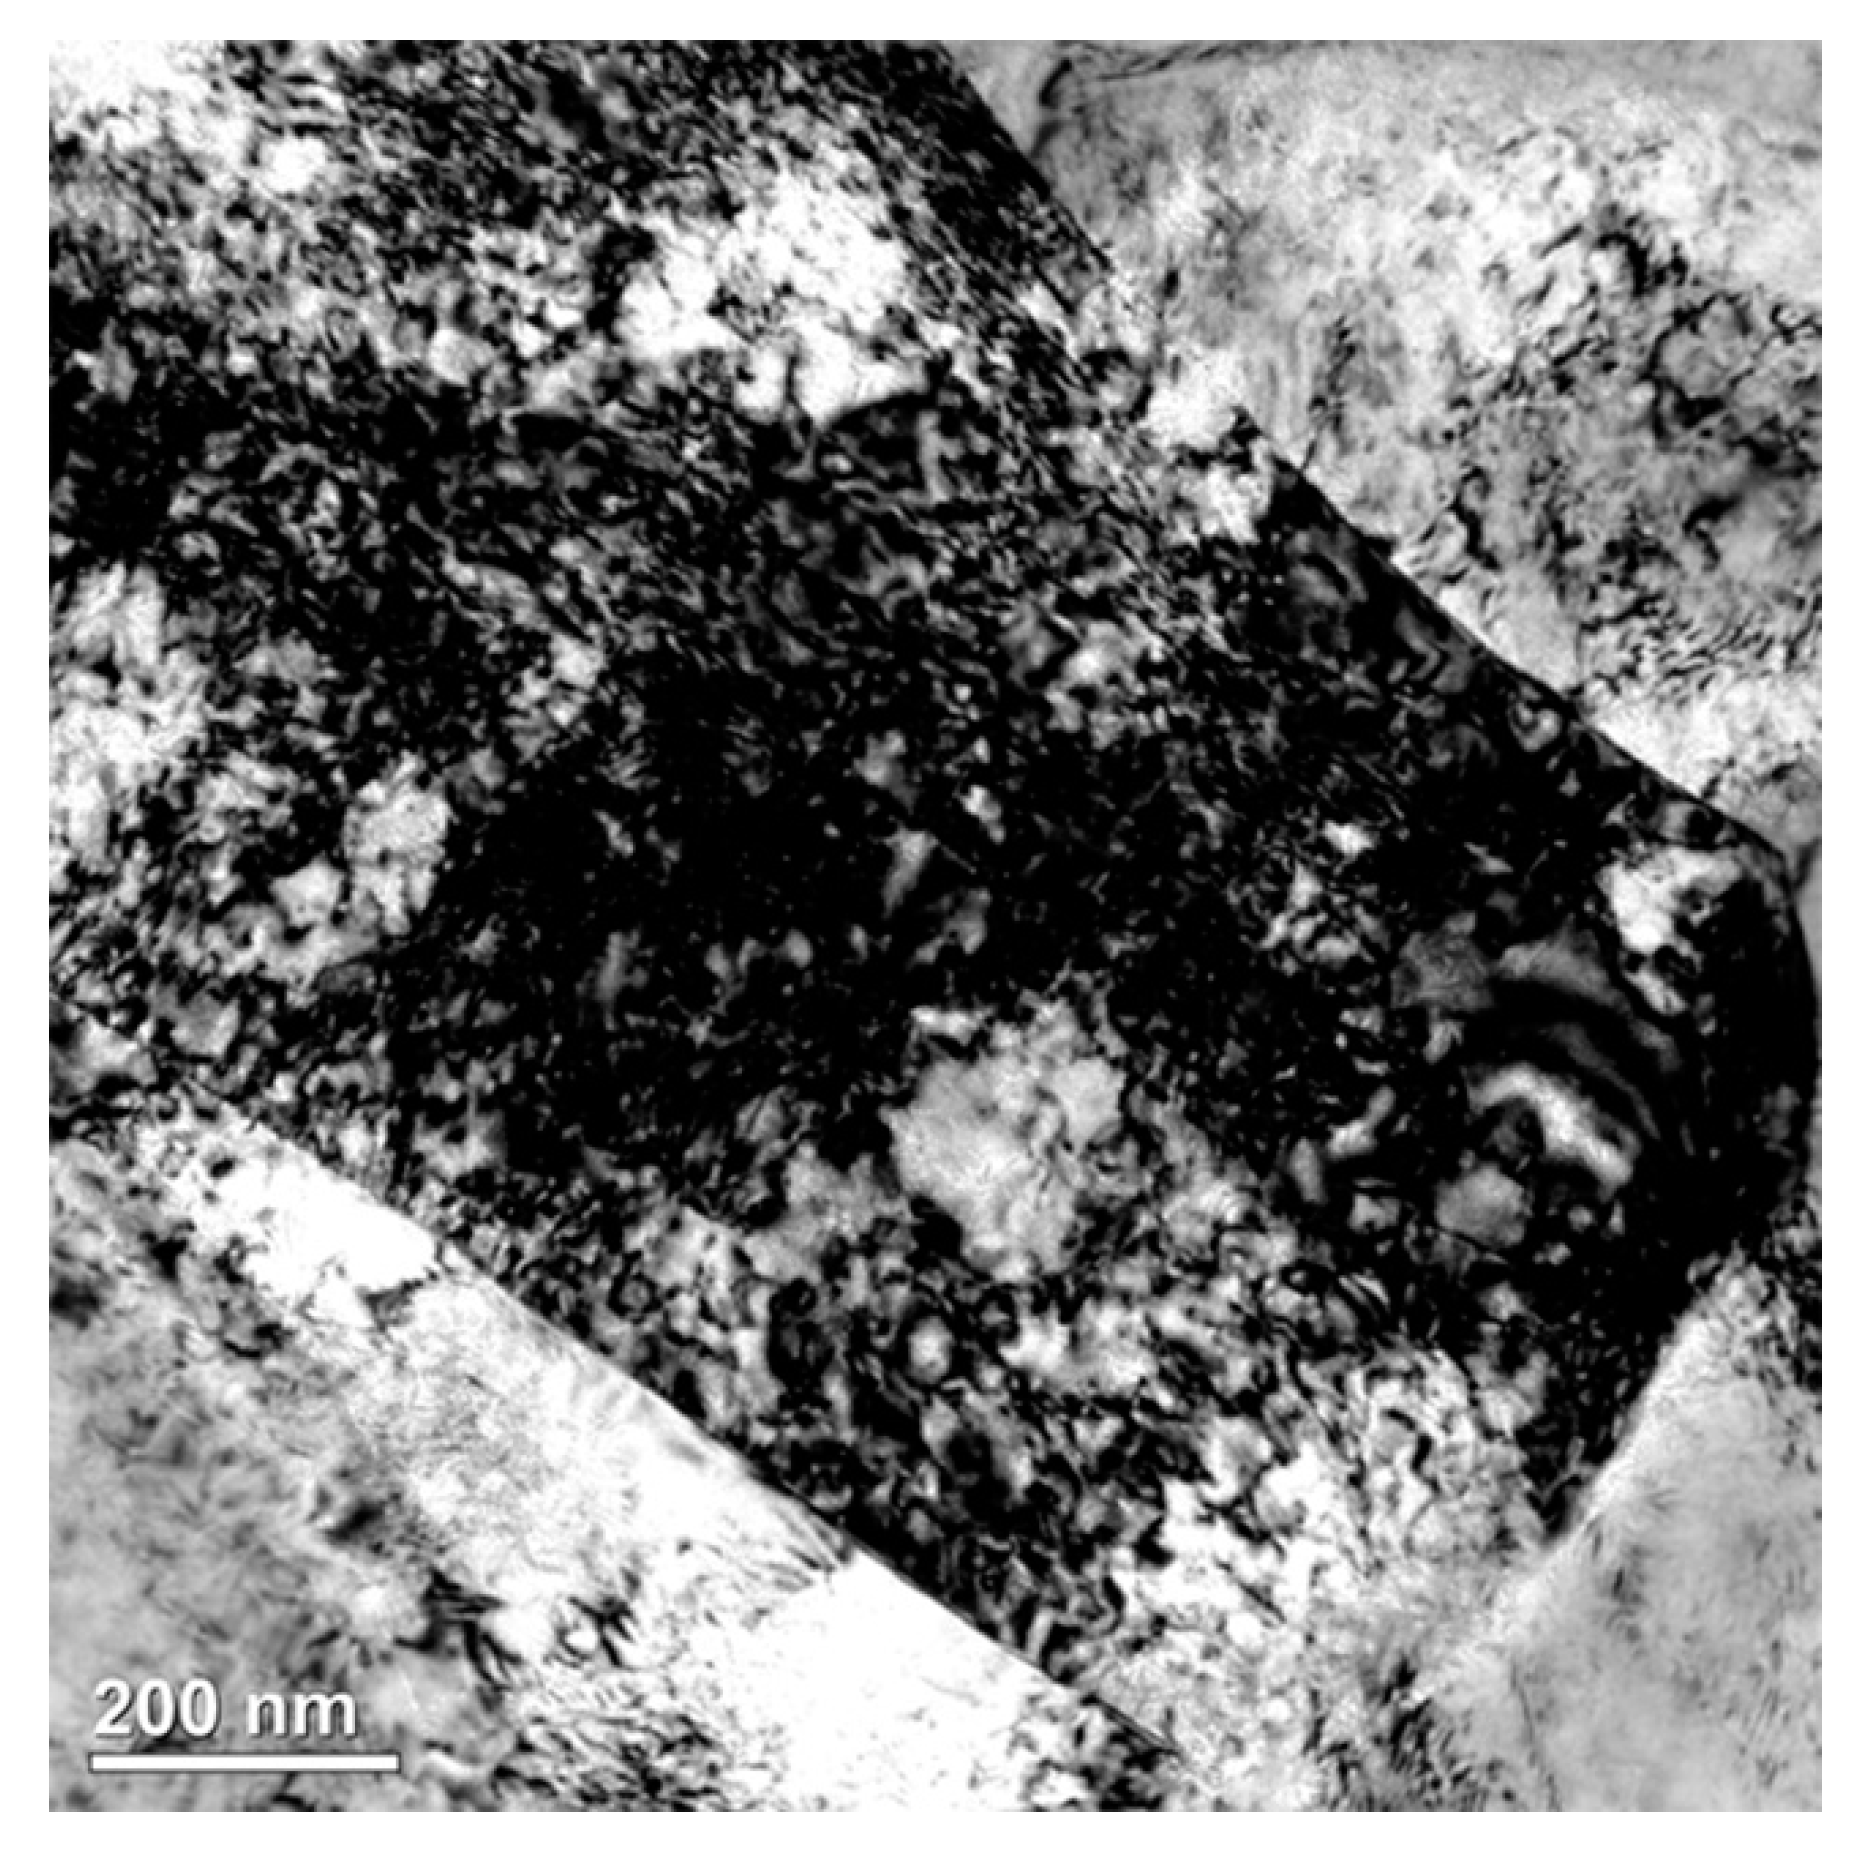
  • It showed a bcc crystal structure in the EBSD analysis.
  • The etching response of DIB is different from that of DIM. After etching, using the austenite grain surface as the reference level, DIB exhibited a concave structure, and DIM showed a convex structure formed in austenite grains by the same etching condition. See Figure 3a and Figure 8a.
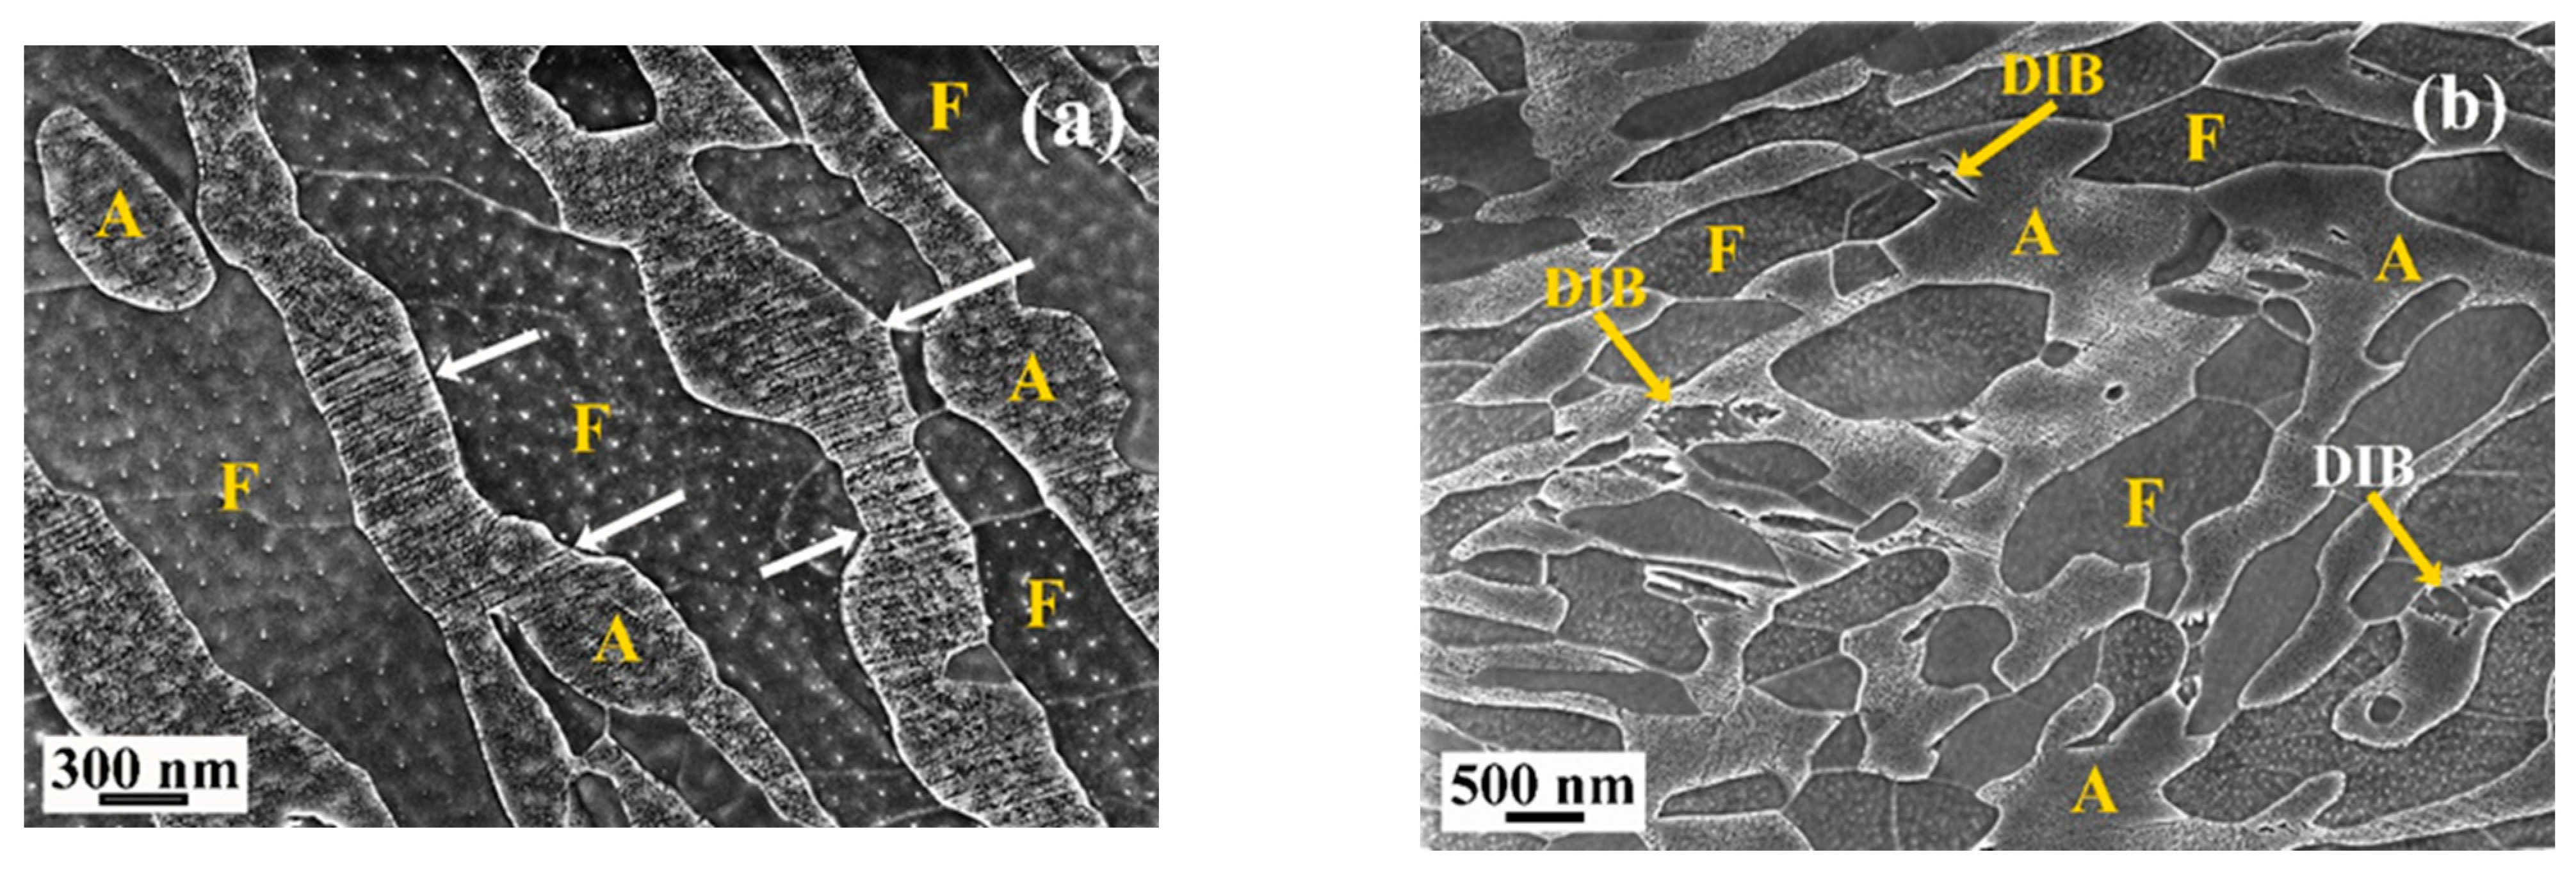
  • The Mn concentration in DIBs is ~7 wt%, which is the same as the Mn concentration in the austenite phase. This means that it is resultant from a displacive mechanism [36], and they are not in the ferrite phase. The Mn concentration of the steel used is 5 wt%. The Mn concentrations measured in the austenite and the ferrite grains were ~7 wt% and ~4 wt%, respectively. The higher Mn concentration in the austenite grains was due to the alloy partitioning during the inter-critical annealing.
A point that needs to be considered is that there was no carbide found in DIB by the TEM. The steel used in this research contained 2 wt% Al and 1 wt% Si. It is well known that the addition of Al and Si can prevent the formation of carbide in bainite and can form carbide-free bainite [38].
There are four deformation mechanisms found after tensile tests at temperatures between 25 °C and 400 °C, namely DIM transformation, DIB transformation, deformation twinning and dislocation glide. DIM and DIB are transformed from austenite, and by measuring austenite fractions after tensile tests, it can indicate the transformation behavior of these two mechanisms. Figure 17 is the plot of the austenite fraction after the tensile test against the test temperature. Figure 17 indicates that nearly all the austenite transformed into DIM at room temperature. Increasing the test temperature to 75 °C, caused the transformation of DIM to be suppressed, since the stability of austenite increased by the increase of austenite stacking fault energy at higher temperatures. Increasing the test temperature suppressed DIM, therefore more austenite remained after the tensile test. However, at temperatures above 75 °C, instead of a continuous increase, austenite fractions first decreased then increased at temperatures above 175 °C, which could be due to the formation of DIB staring at 100 °C. When the test temperature further increased, the stability of austenite increased due to the increase of austenite stacking fault energy at higher temperatures, and deformation by DIB was suppressed until it was replaced by deformation twinning.
When deformed at 200 °C, not only DIB occurred, deformation twins were also operative. This was also due to the increase of austenite stacking fault energy at higher temperatures. The temperature range for the formation of deformation twins was between 200 °C and 350 °C. In the temperature range between 200 °C and 225 °C, apart from the transformation-induced plasticity mechanism (TRIP), twinning-induced plasticity (TWIP) was also involved in the deformation process. In the temperature range between 225 °C and 350 °C, TWIP operated. At temperatures above 350 °C, dislocation plasticity was the sole deformation mechanism. Figure 18 gives the summary of temperature dependence of the four deformation mechanisms. The black color gradient in the figure represents qualitatively the decrease of the intensity of the deformation mechanism.
In the literature [29,30], the formation of DIB has been reported in 1st generation TRIP steels that contained 1.5 wt% and 1.1 wt% Mn. Sugimoto et al. [29] reported DIB formed at deformation temperatures above 250 °C, and Wang et al. [30] reported DIB formed in the temperature range between 150 °C and 300 °C. For medium-Mn TRIP steels, contrary to the present research, Sugimoto et al. [31] and Kozłowska et al. [32,33] reported only DIM was found. It is not clear why DIB does not form in some medium-Mn steels. It might be due to the composition of other alloying elements in a steel. Further research needs to be carried out to elucidate this factor.
Table 1 indicates that both DIM and DIB are very effective work hardening mechanisms. In the temperature range between 25 °C and 200 °C, when these two mechanisms operate, both the UTS and the TEL were very high, and the product of the UTS and the TEL could reach a value higher than 65 GPa%. The highest UTS × TEL obtained was 84 GPa% at 150 °C. At this temperature, intense DIB operates, which results in nearly the same UTS as that at room temperature, but a much higher total elongation. When the test temperature increased from 200 °C to 225 °C, there was a sudden drops of UTS × TEL, from 65 GPa% to 33 GPa%. At 225 °C, deformation twins formed with a small amount of DIB. The work hardening effect of twinning was less effective than that of DIB. The hardening effect of twinning was not able to compensate for the reduction of hardening by the decrease of DIB at this temperature such that a drop of UTS × TEL resulted. The very high UTS × TEL obtained around 150 °C showed that warm working can be a good process for medium-Mn AHSS in obtaining a combination of high-strength and high-ductility.

5. Conclusions

The effect of deformation temperature on the deformation mechanism of a medium-Mn AHSS (Fe-5% Mn-2% Al-1% Si-0.3% C) was studied in the temperature range between 25 °C and 400 °C. Four mechanisms were found, namely deformation-induced martensitic (DIM) transformation, deformation-induced bainitic (DIB) transformation, deformation twinning and dislocation glide. At deformation temperatures below 100 °C, DIM occurred, while DIB took place at deformation temperatures between 100 °C and 225 °C. As the deformation temperature increased, deformation twinning occurred in the range between 200 °C and 350 °C, and dislocation glide became the only operative deformation mechanism above 350 °C. The change of deformation mechanism was due to the change of stacking fault energy of austenite at different temperatures, which in turn changed the stability of austenite.
DIM and DIB are effective work hardening mechanisms. The best UTS × TEL = 84 GPa% was obtained at 150 °C when DIB occurred. The present results suggest that warm working is a potential processing method to obtain high strength and high ductility in medium-Mn AHSS.

Supplementary Materials

The following supporting information can be downloaded at: https://www.mdpi.com/article/10.3390/cryst13020328/s1, Figure S1: Schematic diagram of tensile test specimen.

Author Contributions

Conceptualization—C.-P.C.; methodology—C.-P.C., P.-C.C., T.-T.P., Y.-C.C., J.-M.C.; validation—C.-P.C., P.-C.C., T.-T.P., Y.-C.C., J.-M.C.; formal analysis—C.-P.C., P.-C.C., T.-T.P., Y.-C.C., J.-M.C.; investigation, C.-P.C., P.-C.C., T.-T.P., Y.-C.C., J.-M.C.; resources, C.-P.C.; data curation—C.-P.C.; writing—original draft preparation—C.-P.C.; writing—review and editing—C.-P.C.; supervision—C.-P.C.; project administration—C.-P.C.; funding acquisition—C.-P.C. All authors have read and agreed to the published version of the manuscript.

Funding

This research was funded by Ministry of Science and Technology, Taiwan, grant number MOST 107-2221-E-110-007.

Data Availability Statement

P.C. Chen, MSc thesis, Department of Materials and Optoelectronic Science, National Sun Yat-Sen University, Taiwan, 2021, available online at https://ethesys.lis.nsysu.edu.tw/ETD-db/ETD-search-c/view_etd?URN=etd-0815121-094411 (accessed on 18 January 2023); T.T. Peng, MSc thesis, Department of Materials and Optoelectronic Science, National Sun Yat-Sen University, Taiwan, 2017, available online at https://ethesys.lis.nsysu.edu.tw/ETD-db/ETD-search-c/view_etd?URN=etd-0813117-183848 (accessed on 18 January 2023); Y.C. Chan, MSc thesis, Department of Materials and Optoelectronic Science, National Sun Yat-Sen University, Taiwan, 2020, available online at https://ethesys.lis.nsysu.edu.tw/ETD-db/ETD-search-c/view_etd?URN=etd-0529120-112125 (accessed on 18 January 2023); J.M. Chen, MSc thesis, Department of Materials and Optoelectronic Science, National Sun Yat-Sen University, Kaohsiung 80424, Taiwan, 2020, available online at https://ethesys.lis.nsysu.edu.tw/ETD-db/ETD-search-c/view_etd?URN=etd-0929120-154019 accessed on 18 January 2023).

Acknowledgments

The authors would like to thank Ministry of Science and Technology, Taiwan, for the financial support. Medium Mn steel provided by China Steel Corporation, Kaohsiung, Taiwan, is also acknowledged.

Conflicts of Interest

The authors declare no conflict of interest.

Nomenclature

AAustenite
AHSSAdvanced high strength steel
DIBDeformation-induced bainitic transformation
DIMDeformation-induced martensitic transformation
EBSDElectron backscattered diffraction
EDSEnergy-dispersive X-ray spectroscopy
FFerrite
MMartensite
PPearlite
OROrientation relationship
SADPSelected area diffraction pattern
SEMScanning electron microscopy
TDTransverse direction
TELTotal elongation
TEMTransmission electron microscopy
TRIPTransformation-induced plasticity
TWIPTwinning-induced plasticity
UTSUltimate tensile strength

References

  1. Hance, B. Advanced High-Strength Steel (AHSS) Performance Level Definitions and Targets. SAE Int. J. Mater. Manf. 2018, 11, 505–516. [Google Scholar] [CrossRef]
  2. Lee, Y.K.; Han, J. Current opinion in medium manganese steel. Mater. Sci. Technol. 2015, 31, 843–856. [Google Scholar] [CrossRef]
  3. Merwin, M.J. Microstructure and Properties of Cold Rolled and Annealed Low-Carbon Manganese TRIP Steels. Iron Steel Technol. 2008, 5, 66–84. [Google Scholar]
  4. Luo, H.; Shi, J.; Wang, C.; Cao, W.; Sun, X.; Dong, H. Experimental and numerical analysis on formation of stable austenite during the intercritical annealing of 5Mn steel. Acta Mater. 2011, 59, 4002–4014. [Google Scholar] [CrossRef]
  5. Suh, D.W.; Ryu, J.H.; Joo, M.S.; Yang, H.S.; Lee, K.; Bhadeshia, H.K.D.H. Medium-Alloy Manganese-Rich Transformation-Induced Plasticity Steels. Metall. Mater. Trans. 2013, 44A, 286–293. [Google Scholar] [CrossRef] [Green Version]
  6. Han, J.; da Silva, A.K.; Ponge, D.; Raabe, D.; Lee, S.M.; Lee, Y.K.; Lee, S.I.; Hwang, B. The effects of prior austenite grain boundaries and microstructural morphology on the impact toughness of intercritically annealed medium Mn steel. Acta Mater. 2017, 122, 199–206. [Google Scholar] [CrossRef]
  7. Cai, M.H.; Zhu, W.J.; Stanford, N.; Pan, L.B.; Chao, Q.; Hodgson, P.D. Dependence of deformation behavior on grain size and strain rate in an ultrahigh strength-ductile Mn-based TRIP alloy. Mater. Sci. Eng. A 2016, 653, 35–42. [Google Scholar] [CrossRef]
  8. Li, Z.C.; Ding, H.; Misra, R.D.K.; Cai, Z.H.; Li, H.X. Microstructural evolution and deformation behavior in the Fe-(6, 8.5)Mn-3Al-0.2C TRIP steels. Mater. Sci. Eng. A 2016, 672, 161–169. [Google Scholar] [CrossRef] [Green Version]
  9. Lee, S.; De Cooman, B.C. Tensile Behavior of Intercritically Annealed 10 pct Mn Multi-phase Steel. Metall. Mater. Trans. 2014, 45A, 709–716. [Google Scholar] [CrossRef] [Green Version]
  10. De Cooman, B.C.; Gibbs, P.; Lee, S.; Matlock, D.K. Transmission Electron Microscopy Analysis of Yielding in Ultrafine-Grained Medium Mn Transformation-Induced Plasticity Steel. Metall. Mater. Trans. 2013, 44A, 2563–2572. [Google Scholar] [CrossRef] [Green Version]
  11. Lee, S.; Lee, S.J.; Kumar, S.S.; Lee, K.; De Cooman, B.C. Localized Deformation in Multiphase, Ultra-Fine-Grained 6 Pct Mn Transformation-Induced Plasticity Steel. Metall. Mater. Trans. 2011, 42A, 3638–3651. [Google Scholar] [CrossRef] [Green Version]
  12. Suh, D.W.; Park, S.J.; Lee, T.H.; Oh, C.S.; Kim, S.J. Influence of Al on the Microstructural Evolution and Mechanical Behavior of Low-Carbon, Manganese Transformation-Induced-Plasticity Steel. Metall. Mater. Trans. 2010, 41A, 397–408. [Google Scholar] [CrossRef] [Green Version]
  13. Tamura, I. Deformation-Induced Martensitic Transformation and Transformation-Induced Plasticity in Steels. Metals Sci. 1982, 16, 245–253. [Google Scholar] [CrossRef]
  14. Jacques, P.J. Transformation-induced plasticity for high strength formable steels. Curr. Opin. Solid State Mater. Sci. 2004, 8, 259–265. [Google Scholar] [CrossRef]
  15. Xiong, X.; Chen, B.; Huang, M.; Wang, J.; Wang, L. The effect of morphology on the stability of retained austenite in a quenched and partitioned steel. Scr. Mater. 2013, 68, 321–324. [Google Scholar] [CrossRef]
  16. Sugimoto, K.I.; Misu, M.; Kobayashi, M.; Shirasawa, H. Effects of second phase morphology on retained austenite morphology and tensile properties in a TRIP-aided dual-phase steel sheet. ISIJ Int. 1993, 33, 775–782. [Google Scholar] [CrossRef] [Green Version]
  17. Luo, L.; Li, W.; Wang, L.; Zhou, S.; Jin, X. Tensile behaviors and deformation mechanism of a medium Mn-TRIP steel at different temperatures. Mater. Sci. Eng. A 2017, 682, 698–703. [Google Scholar] [CrossRef]
  18. Lomholt, T.N.; Adachi, Y.; Bastos, A.; Pantleon, K.; Somers, M.A.J. Partial transformation of austenite in Al–Mn–Si TRIP steel upon tensile straining: An in situ EBSD study. Mater. Sci. Technol. 2013, 29, 1383–1388. [Google Scholar] [CrossRef]
  19. Mark, A.F.; Wang, X.; Essadiqi, E.; Embury, J.D.; Boyd, J.D. Development and Characterisation Of Model Trip Steel Microstructures. Mater. Sci. Eng. A 2013, 576, 108–117. [Google Scholar] [CrossRef]
  20. Tomota, Y.; Tokuda, H.; Adachi, Y.; Wakita, M.; Minakaw, N.; Moriai, A.; Morii, Y. Tensile behavior of TRIP-aided multi-phase steels studied by in situ neutron diffraction. Acta Mater. 2004, 52, 5737–5745. [Google Scholar] [CrossRef]
  21. De Moor, E.; Matlock, D.K.; Speer, J.G.; Merwin, M.J. Austenite Stabilization Through Manganese Enrichment. Scr. Mater. 2011, 64, 185–188. [Google Scholar] [CrossRef]
  22. Samek, L.; De Cooman, B.C.; Van Slycken, J.; Verleysen, P.; Degrieck, J. Physical Metallurgy of Multi-Phase Steel for Improved Passenger Car Crash-Worthiness. Steel Res. Int. 2004, 75, 716–723. [Google Scholar] [CrossRef]
  23. Furukawa, T.; Huang, H.; Matsumura, O. Effects of Carbon Content on Mechanical Properties of 5%Mn Steels Exhibiting Transformation Induced Plasticity. Mater. Sci. Technol. 1994, 10, 964–970. [Google Scholar] [CrossRef]
  24. Lee, S.; De Cooman, B.C. On the Selection of the Optimal Intercritical Annealing Temperature for Medium Mn TRIP Steel. Metall. Mater. Trans. 2013, 44A, 5014–5018. [Google Scholar] [CrossRef] [Green Version]
  25. Sugimoto, K.I.; Usui, N.; Kobayashi, M.; Hashimoto, S.I. Effects of Volume Fraction and Stability of Retained Austenite on Ductility of TRIP-Aided Dual-Phase Steels. ISIJ Int. 1992, 32, 1311–1318. [Google Scholar] [CrossRef] [Green Version]
  26. Gibbs, P.J.; De Moor, E.; Merwin, M.J.; Clausen, B.; Speer, J.G.; Matlock, D.K. Austenite Stability Effects on Tensile Behavior of Manganese-Enriched-Austenite Transformation-Induced Plasticity Steel. Metall. Mater. Trans. A 2011, 42, 3691–3702. [Google Scholar] [CrossRef]
  27. Ericsson, T. The Temperature and Concentration Dependence of the Stacking Fault Energy in the Co-Ni System. Acta Metall. 1966, 14, 853–865. [Google Scholar] [CrossRef]
  28. Rémy, L.; Pineau, A.; Thomas, B. Temperature Dependence of Stacking Fault Energy In Close-Packed Metals and Alloys. Mater. Sci. Eng. 1978, 36, 47–63. [Google Scholar] [CrossRef]
  29. Sugimoto, K.I.; Kobayashi, M.; Hashimoto, S.I. Ductility and Strain-Induced Transformation in a High-Strength Transformation-Induced Plasticity-Aided Dual-Phase Steel. Metall. Mater. Trans. 1992, 23A, 3085–3091. [Google Scholar] [CrossRef]
  30. Wang, J.; Yang, Q.; Wang, X.; Zhao, Y.; Wang, L. A Phenomenon of Strain Induced Bainitic Transformation and Its Effect on Strength Enhancement in a Lightweight Transformation-Induced-Plasticity Steel. Mater. Sci. Eng. A 2019, 751, 340–350. [Google Scholar] [CrossRef]
  31. Sugimoto, K.I.; Taninoa, H.; Kobayashi, J. Warm ductility of 0.2% C–1.5% Si–5% Mn TRIP-aided steel. Mater. Sci. Eng. A 2017, 688, 237–243. [Google Scholar] [CrossRef]
  32. Kozłowska, A.; Grajcar, A.; Janik, A.; Radwański, K.; Krupp, U.; Matus, K.; Morawiec, M. Mechanical and Thermal Stability of Retained Austenite in Plastically Deformed Bainite-Based TRIP-Aided Medium-Mn Steels. Arch. Civ. Mech. Eng. 2021, 21, 133. [Google Scholar] [CrossRef]
  33. Kozłowska, A.; Radwański, K.; Matus, K.; Samek, L.; Grajcar, A. Mechanical Stability of Retained Austenite in Aluminum-Containing Medium-Mn Steel Deformed at Different Temperatures. Arch. Civ. Mech. Eng. 2021, 21, 19. [Google Scholar] [CrossRef]
  34. Martin, S.; Wolf, S.; Martin, U.; Krüger, L. Influence of Temperature on Phase Transformation and Deformation Mechanisms of Cast CrMnNi-TRIP/TWIP Steel. Solid State Phenom. 2011, 172–174, 172–177. [Google Scholar] [CrossRef]
  35. Martin, S.; Wolf, S.; Martin, U.; Krüger, L.; Rafaja, D. Deformation Mechanisms in Austenitic TRIP/TWIP Steel as a Function of Temperature. Metall. Mater. Trans. 2016, 47A, 49–58. [Google Scholar] [CrossRef] [Green Version]
  36. Bhadeshia, H.K.D.H. Bainite in Steels; Maney Publishing: Leeds, UK, 2015; pp. 18–19. ISBN 978-1-909662-74-2. [Google Scholar]
  37. Wu, C.L.; Chang, C.P.; Chen, D.; Tu, J.F.; Huang, C.Y. Microstructural Characterization of Deformation-Induced Martensite in an Ultrafine-Grained Medium Mn Advanced High Strength Steel. Mater. Sci. Eng. A 2018, 721, 145–153. [Google Scholar] [CrossRef]
  38. Sharma, S.; Sangal, S.; Mondal, K. Development of New High-Strength Carbide-Free Bainitic Steels. Metall. Mater. Trans. 2011, 42A, 3921–3933. [Google Scholar] [CrossRef] [Green Version]
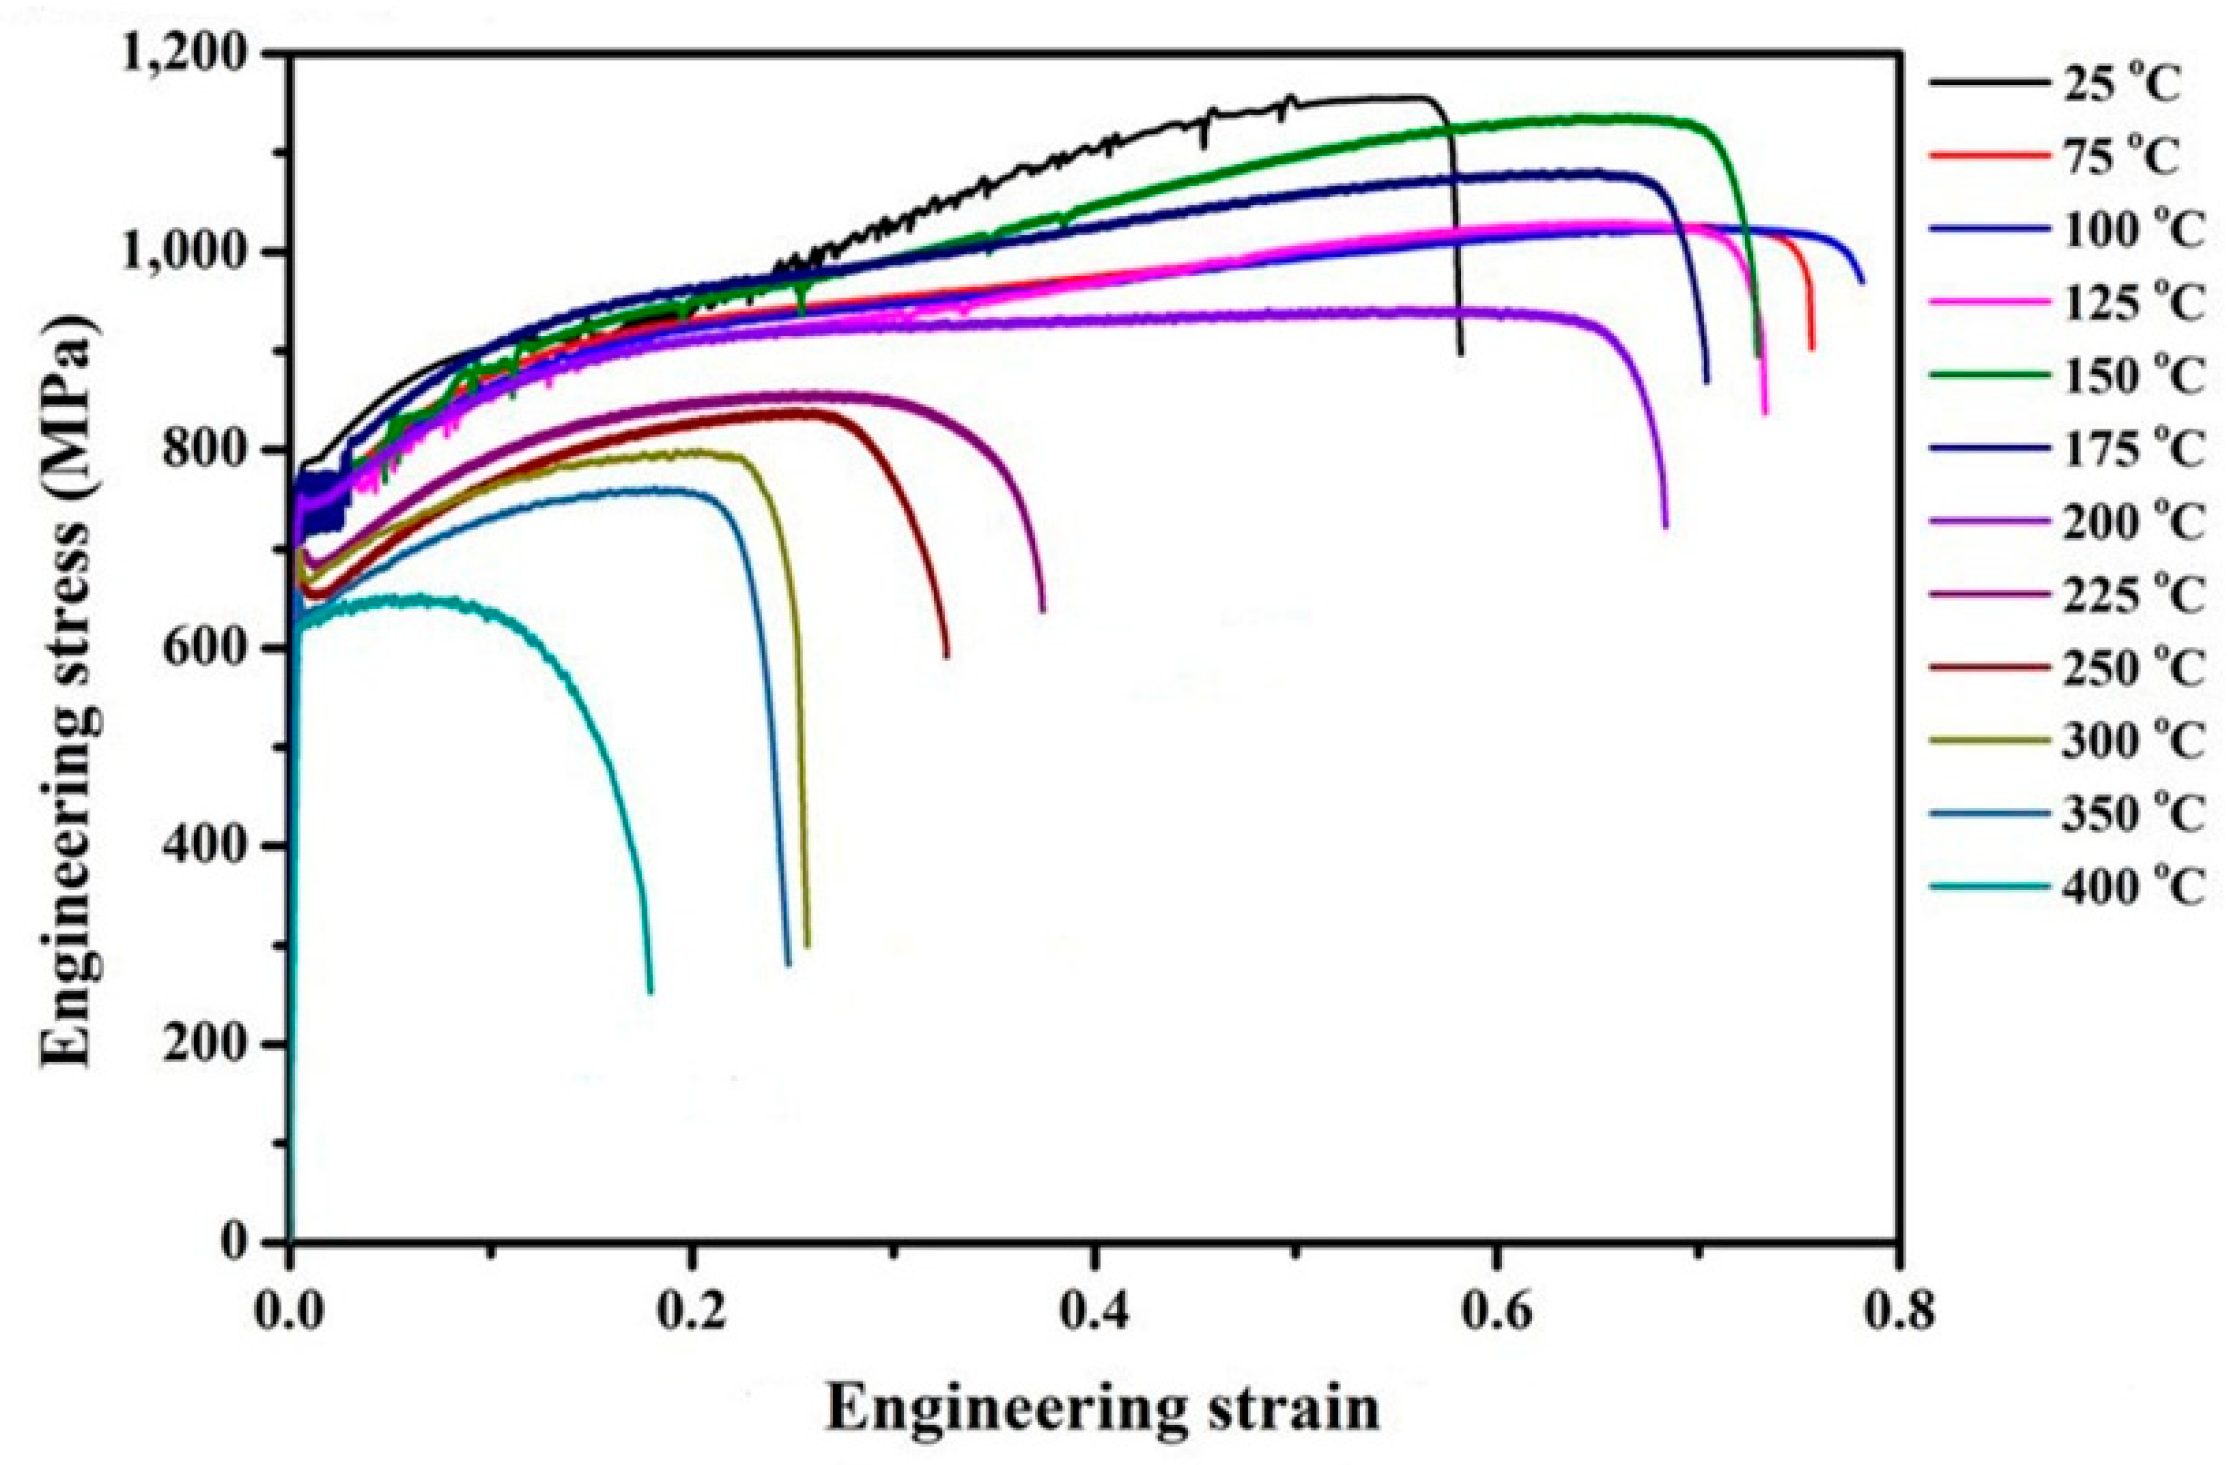
Figure 1. (a) SEM micrograph showing ultrafine-grained dual phase structure, consisting of ferrite and austenite, after inter-critical annealing. F: ferrite, A: austenite. (b) EBSD phase map of (a). Blue color represents fcc phase (austenite), red color represents bcc phase (ferrite), and black color represents unindexed points. White stars are registration marks.
Crystals 13 00328 g001
Figure 2. Engineering stress-strain curves obtained by tensile testing at different temperatures, under a constant strain rate of 1 × 10⁻⁵ s−1.
Crystals 13 00328 g002
Figure 3. Microstructure of a specimen tested at room temperature. (a) SEM micrograph showing DIM formed in some austenite grains after 22% elongation. (b) SEM micrograph showing nearly all austenite grains have transformed into martensite at the end of the tensile test. (c) SEM micrograph with a higher magnification from the area marked by the arrow in (b) showing partially transformed austenite grains. (d) EBSD phase map of (b), showing virtually all grains have been indexed as bcc phase (ferrite or martensite). F: ferrite, A: austenite, M: martensite. Blue color represents fcc phase, red color represents bcc phase, and black color represents unindexed points. White stars are registration marks.
Crystals 13 00328 g003
Figure 4. (a) SEM micrograph showing the microstructure of a specimen tested at 75 °C to fracture. Both DIM and retained austenite were found. (b) SEM micrograph showing some incomplete transformed austenite grains, as marked by arrows. (c) EBSD phase map of (a) showing some areas of retained austenite after tensile test. F: ferrite, A: austenite. Blue color represents fcc phase, red color represents bcc phase, and black color represents unindexed points. White stars are registration marks.
Crystals 13 00328 g004
Figure 5. SEM micrographs showing the microstructures of specimens tested to fracture at (a) 100 °C and (b) 125 °C. Arrows in (b) marked areas of untransformed austenite. (c) is a higher magnification of the area highlighted by the dotted line in (b). The arrow marks an untransformed austenite area. (d) EBSD phase map of (b) showing some areas of retained austenite after the tensile test. F: ferrite, A: austenite. Blue color represents fcc phase, red color represents bcc phase, and black color represents unindexed points. White stars are registration marks.
Crystals 13 00328 g005
Figure 6. (a) SEM micrograph showing the microstructure of a specimen tested to fracture at 175 °C. (b) EBSD phase map of (a). The deformation-induced structure has been indexed to be bcc phase, as marked by yellow arrows. F: ferrite. Blue color represents fcc phase, red color represents bcc phase, and black color represents unindexed points. White stars are registration marks.
Crystals 13 00328 g006
Figure 7. TEM (a) bright field (b) dark field images from a specimen tested at 175 °C to an elongation of 30%. The morphology of DIBs is the typical sheaf morphology of conventional bainite. EDS results from positions 1 to 3 are given in Table 2. The insert SADP in (a) is from the beam direction [111] of bainite. (c) The SADP was from the area marked by the dotted circle in (a) and tilted to the new beam direction. SADP from an area included both DIB and austenite matrix. This SADP is from the beam direction [001] of bainite and [011] of austenite. The red and blue indexes are for bainite and austenite, respectively.
Crystals 13 00328 g007aCrystals 13 00328 g007b
Figure 8. (a) SEM micrograph and (b) EBSD phase map showing the formation of DIBs in a specimen tested at 200 °C to an elongation of 30%. Note the high indexing hit rate of EBSD phase map. F: ferrite, A: austenite. Blue color represents fcc phase, red color represents bcc phase, and black color represents unindexed points. White stars are registration marks.
Crystals 13 00328 g008
Figure 9. SEM micrograph showing the presence of twin-like traces in some austenite grains in a specimen tested at 200 °C to an elongation of 30%, as marked by white arrows. F: ferrite, A: austenite.
Crystals 13 00328 g009
Figure 10. (a) Bright field and (c) dark field TEM images showing the formation of deformation nano-twins in a specimen tested at 200 °C to an elongation of 30%. (b) The SADP from the area marked by dotted circle in (a). The beam direction for the austenite matrix and the twinned area are B = [011] and [ 0 11 ¯ ] , respectively. γ: from austenite phase, γT: from deformation twins.
Crystals 13 00328 g010aCrystals 13 00328 g010b
Figure 11. (a) SEM micrograph showing high density of twin traces, marked by white arrows, in austenite grains after being tested at 225 °C to an elongation of 30%. (b) SEM micrograph showing only a small amount of DIBs in a specimen tested at 225 °C to fracture. F: ferrite, A: austenite.
Crystals 13 00328 g011
Figure 12. (a) TEM bright field image showing the formation of high density of deformation twins and dislocation tangles in an austenite grain in a specimen tested at 225 °C to fracture. (b) SADP from the area marked by the yellow circle in (a). The beam direction is [ 011 ] γ / /   [ 0 11 ¯ ] γ T . γ: austenite phase, γT: primary deformation twins, γT.sec: secondary deformation twins. (c) TEM dark field image showing primary deformation twins. (d) TEM dark field image showing secondary deformation twins.
Crystals 13 00328 g012
Figure 13. SEM micrograph showing no indication of DIB, and only some austenite grains containing twin traces after the specimen was tested to fracture at 300 °C. F: ferrite, A: austenite.
Crystals 13 00328 g013
Figure 14. SEM micrographs of a specimen tested to fracture at 350 °C, showing (a) low density of twin traces, as marked by arrows and (b) austenite grains free of twin trace. F: ferrite, A: austenite.
Crystals 13 00328 g014
Figure 15. TEM bright field image showing tangle dislocations in an austenite grain after tested to fracture at 350 °C.
Crystals 13 00328 g015
Figure 16. SEM micrograph showing the formation of pearlite phase in a specimen tested to fracture at 400 °C. F: ferrite, A: austenite, P: pearlite.
Crystals 13 00328 g016
Figure 17. The relationship between austenite volume fraction after tensile test and the test temperature.
Crystals 13 00328 g017
Figure 18. The deformation mechanisms at different temperature range. The black color gradient represents qualitatively the decrease of the intensity of the deformation mechanism.
Crystals 13 00328 g018
Table 1. Ultimate tensile strength (UTS), total elongation (TEL) and UTS × TEL obtained at different test temperatures.
Test Temperature (°C)UTS (MPa)TEL (%)UTS × TEL (GPa%)
2511565968
7510277779
10010247879
12510557680
15011377484
17510817277
2009427065
2258493933
2508403327
3007952620
3507612519
4006551811
Table 2. EDS results from positions 1, 2 and 3 marked in Figure 7a. The value of each element is a result of normalizing with the sum of the four elements to 100%.
ElementPosition 1Position 2Position 3
Fe88.7%89.4%88.9%
Mn7.3%6.7%7.4%
Al2.2%2.3%2.2%
Si1.7%1.6%1.6%
Disclaimer/Publisher’s Note: The statements, opinions and data contained in all publications are solely those of the individual author(s) and contributor(s) and not of MDPI and/or the editor(s). MDPI and/or the editor(s) disclaim responsibility for any injury to people or property resulting from any ideas, methods, instructions or products referred to in the content.

