


Study on Surface Roughness Improvement of Selective Laser Melted Ti6Al4V Alloy

Abstract
:1. Introduction
2. Materials and Methods
2.1. Materials and Equipment
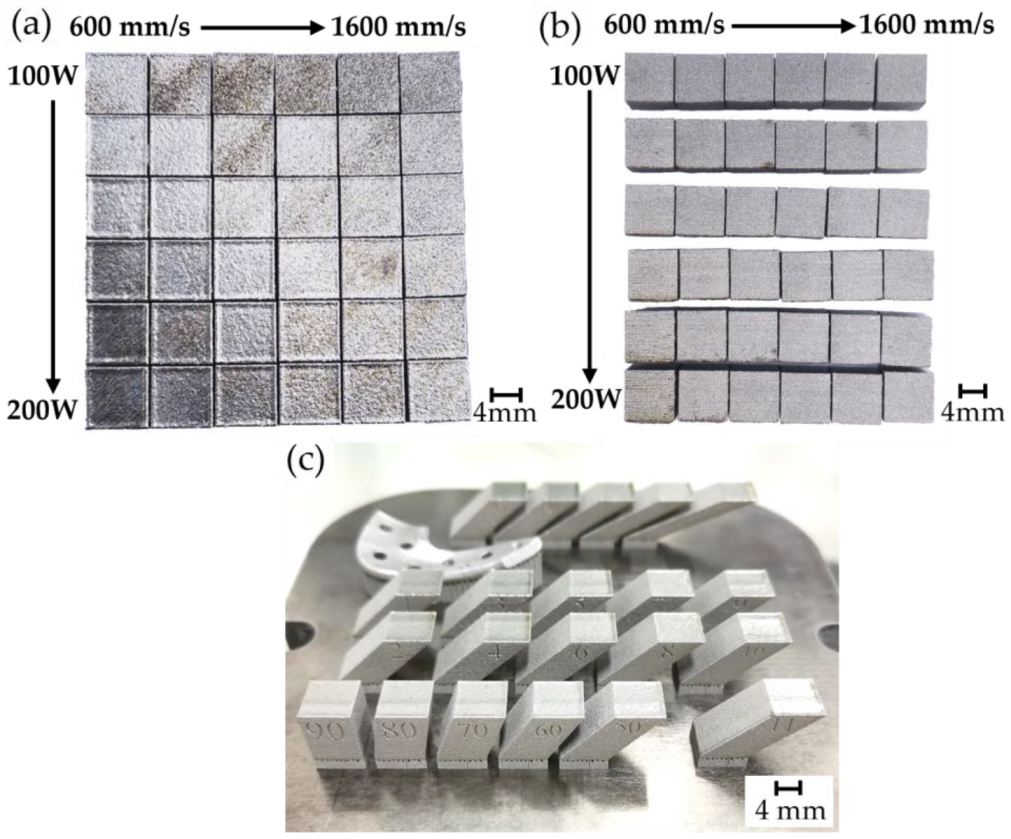
2.2. Experimental Model
2.3. Analysis and Characterization Tools
3. Results and Discussion
3.1. Variations in Morphology and Roughness of Each Surface under Different Parameters
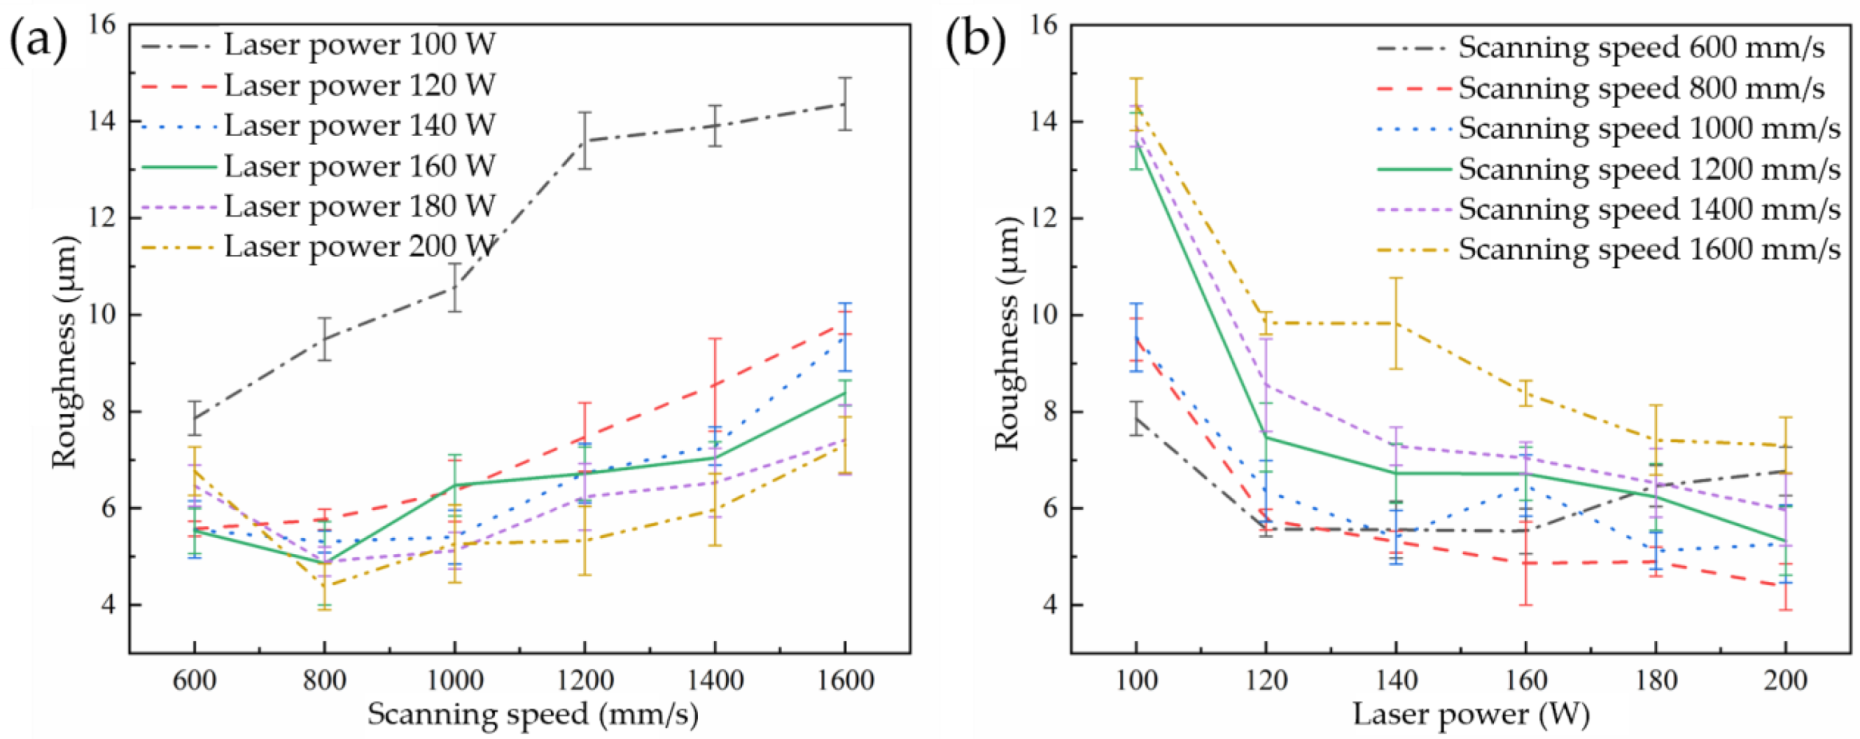
3.1.1. Upper Surface
3.1.2. Vertical Side
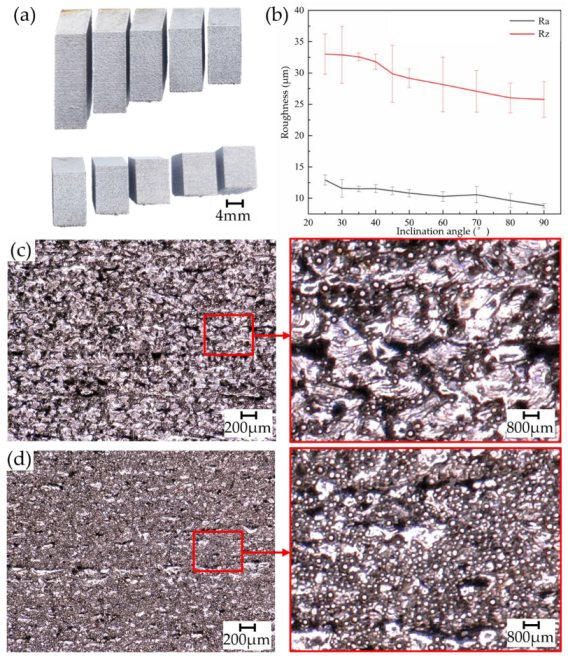
3.1.3. Upper Side
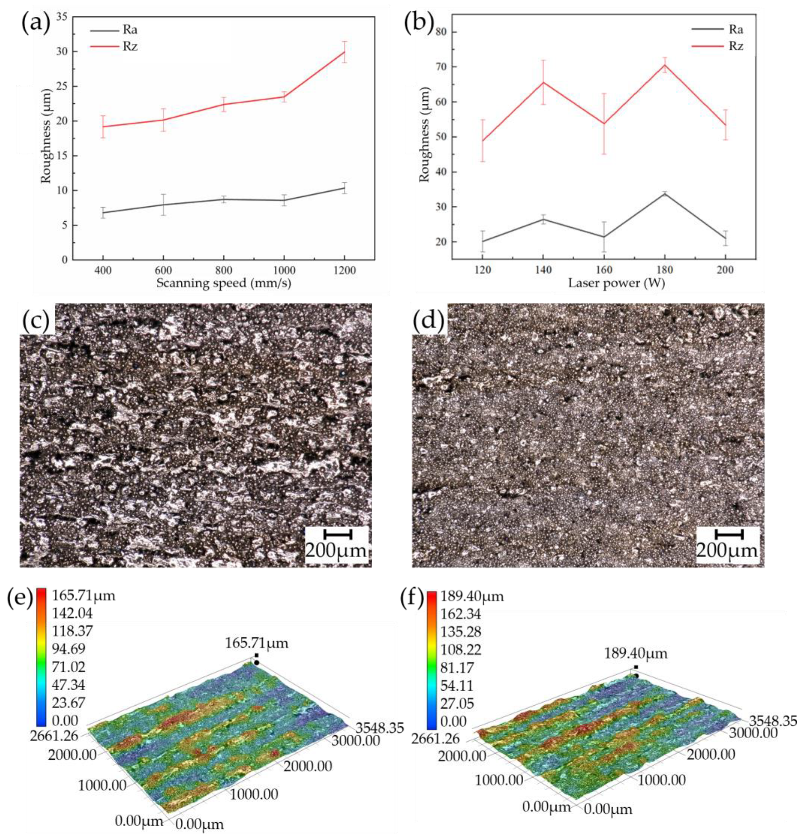
3.1.4. Lower Side
3.2. Surface Quality Improvement Process
3.2.1. Effect of Remelting Process Strategy on the Upper Surface
3.2.2. Impact of Multi-Layer Profile Scanning Strategy on the Surface
4. Conclusions
- (1)
- The USR changes in a parabola with the increase in the LED. The position of the lowest point of the parabola depends on different laser powers. The higher the laser power, the greater the LED at the lowest point. The LED value that minimizes the USR is around 0.22 J/mm. The optimal process parameters are laser power 200 W, scanning speed 800 mm/s.
- (2)
- At low laser power, the difference in VSR at different scanning speeds is small; at high laser power, the difference is large. The reason for this is due to the scanning strategy and the outer bulge phenomenon. When the laser power is 160 W, the roughness of the upper and lower sides increases significantly with the increase in scanning speed.
- (3)
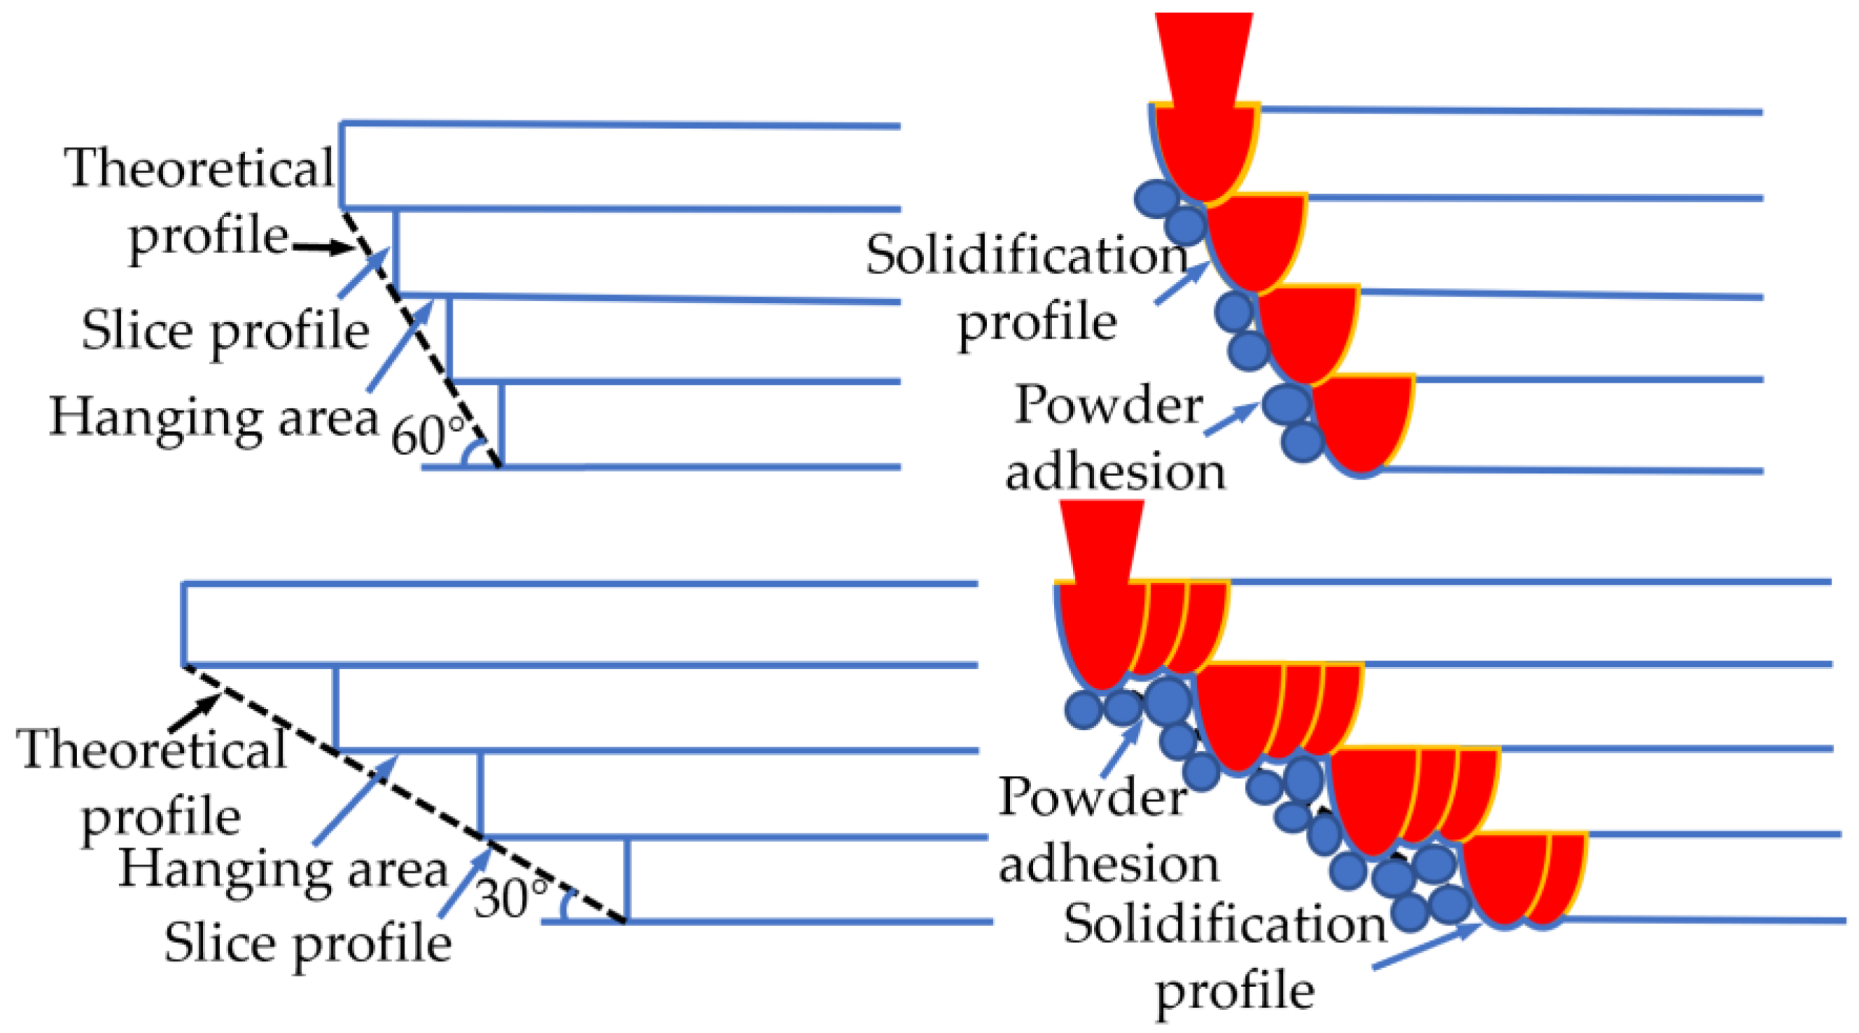
- As the inclination angle increases, the USSR gradually decreases due to the weakening of the step effect. Due to serious powder adhesion and slag hanging on the lower side, the roughness is very large at low inclination angles. As the inclination angle increases, the roughness decreases gradually.
- (4)
- The surface remelting process strategy results in a significant reduction in surface roughness due to the attenuation of waviness and spatter on the upper surface. The multi-layer profile scanning process strategy can effectively reduce the roughness of the specimen side surface. The number of profile scanning layers has different effects on improving the roughness of different side surfaces. The more the number of scanning layers, the lower the roughness of the upper side. The vertical side roughness is the lowest when scanning the 2-layer profile, and the lower side has the lowest roughness when scanning the 1-layer profile.
Author Contributions
Funding
Data Availability Statement
Conflicts of Interest
References
- Lu, B. Additive manufacturing—Current situation and future. China Mech. Eng. 2020, 31, 19. [Google Scholar] [CrossRef]
- Yang, Y.; Chen, J.; Song, C.; Wang, D.; Bai, Y. Current status and progress on technology of selective laser melting of metal parts. Laser Optoelectron. Prog. 2018, 55, 011401. [Google Scholar] [CrossRef]
- Ahmadi, M.; Tabary, S.B.; Rahmatabadi, D.; Ebrahimi, M.; Abrinia, K.; Hashemi, R. Review of selective laser melting of magnesium alloys: Advantages, microstructure and mechanical characterizations, defects, challenges, and applications. J. Mater. Res. Technol. 2022, 19, 1537–1562. [Google Scholar] [CrossRef]
- Abedi, H.; Hanzaki, A.Z.; Azami, M.; Kahnooji, M.; Rahmatabadi, D. The high temperature flow behavior of additively manufactured Inconel 625 superalloy. Mater. Res. Express 2019, 6, 116514. [Google Scholar] [CrossRef]
- Urlea, V.; Brailovski, V. Electropolishing and electropolishing-related allowances for powder bed selectively laser-melted Ti-6Al-4V alloy components. J. Mater. Process. Technol. 2017, 242, 1–11. [Google Scholar] [CrossRef]
- Junfeng, L.; Zhengying, W.; Bingheng, L. Research progress on technology of selective laser melting of titanium and titanium alloys. Laser Optoelectron. Prog. 2018, 55, 011403. [Google Scholar] [CrossRef]
- Brandau, B.; Da Silva, A.; Wilsnack, C.; Brueckner, F.; Kaplan, A.F. Absorbance study of powder conditions for laser additive manufacturing. Mater. Des. 2022, 216, 110591. [Google Scholar] [CrossRef]
- Wang, D.; Wu, S.; Bai, Y.; Lin, H.; Yang, Y.; Song, C. Characteristics of typical geometrical features shaped by selective laser melting. J. Laser Appl. 2017, 29, 022007. [Google Scholar] [CrossRef]
- Uddin, M.; Santifoller, R.; Hall, C.; Schlaefer, T. A Grinding-Burnishing Approach to Enhancing Surface Integrity, Tribological, and Corrosion Behavior of Laser-Cladded AISI 431 Alloys. J. Manuf. Sci. Eng. 2022, 144, 071003. [Google Scholar] [CrossRef]
- Li, Z.; Kucukkoc, I.; Zhang, D.Z.; Liu, F. Optimising the process parameters of selective laser melting for the fabrication of Ti6Al4V alloy. Rapid Prototyp. J. 2018, 24, 150–159. [Google Scholar] [CrossRef]
- Krol, M.; Tański, T. Surface quality research for selective laser melting of Ti-6Al-4V alloy. Arch. Metall. Mater. 2016, 61, 945–950. [Google Scholar] [CrossRef]
- Han, J.; Wu, M.; Ge, Y.; Wu, J. Optimizing the structure accuracy by changing the scanning strategy using selective laser melting. Int. J. Adv. Manuf. Technol. 2018, 95, 4439–4447. [Google Scholar] [CrossRef]
- Sadali, M.F.; Hassan, M.Z.; Ahmad, F.; Yahaya, H.; Rasid, Z.A. Influence of selective laser melting scanning speed parameter on the surface morphology, surface roughness, and micropores for manufactured Ti6Al4V parts. J. Mater. Res. 2020, 35, 2025–2035. [Google Scholar] [CrossRef]
- Oyesola, M.; Mpofu, K.; Mathe, N.; Fatoba, S.; Hoosain, S.; Daniyan, I. Optimization of selective laser melting process parameters for surface quality performance of the fabricated Ti6Al4V. Int. J. Adv. Manuf. Technol. 2021, 114, 1585–1599. [Google Scholar] [CrossRef]
- Xiao, Z.; Lei, Y.; Hu, Z.; Chen, C.; Chen, B.; Zhu, H. Influence of rescanning parameters on selective laser melting of Ti6Al4V. J. Manuf. Process. 2022, 82, 530–542. [Google Scholar] [CrossRef]
- Chen, Z.; Wu, X.; Tomus, D.; Davies, C.H. Surface roughness of selective laser melted Ti-6Al-4V alloy components. Addit. Manuf. 2018, 21, 91–103. [Google Scholar] [CrossRef]
- Feng, Y.; Ma, H.; Ge, X. Computer evaluation of surface roughness parameters based on Origin. Hebei J. Ind. Sci. Technol. 2014, 31, 433–435. [Google Scholar] [CrossRef]
- Wang, D.; Dou, W.; Ou, Y.; Yang, Y.; Tan, C.; Zhang, Y. Characteristics of droplet spatter behavior and process-correlated mapping model in laser powder bed fusion. J. Mater. Res. Technol. 2021, 12, 1051–1064. [Google Scholar] [CrossRef]
- Ag, S. Installation and Operation, The RTC 4 PC Interface Board for Real Time Control of Scan Heads and Lasers; ScanLab: Nakuru, Kenya, 2006; pp. 16–28. [Google Scholar]
- Strano, G.; Hao, L.; Everson, R.M.; Evans, K.E. Surface roughness analysis, modelling and prediction in selective laser melting. J. Mater. Process. Technol. 2013, 213, 589–597. [Google Scholar] [CrossRef]
- Gusarov, A.; Kovalev, E. Model of thermal conductivity in powder beds. Phys. Rev. B 2009, 80, 024202. [Google Scholar] [CrossRef]
- Tian, Y.; Tomus, D.; Rometsch, P.; Wu, X. Influences of processing parameters on surface roughness of Hastelloy X produced by selective laser melting. Addit. Manuf. 2017, 13, 103–112. [Google Scholar] [CrossRef]
- Snyder, J.C.; Thole, K.A. Understanding laser powder bed fusion surface roughness. J. Manuf. Sci. Eng. 2020, 142, 071003. [Google Scholar] [CrossRef]
- Temmler, A.; Comiotto, M.; Ross, I.; Kuepper, M.; Liu, D.; Poprawe, R. Surface structuring by laser remelting of 1.2379 (D2) for cold forging tools in automotive applications. J. Laser Appl. 2019, 31, 022017. [Google Scholar] [CrossRef]
- Ramos, J.A.; Bourell, D.L.; Beaman, J.J. Surface characterization of laser polished indirect-SLS parts. In Proceedings of the 2002 International Solid Freeform Fabrication Symposium, Austin, TX, USA, 5–7 August 2002. [Google Scholar] [CrossRef]
- Sih, S.S.; Barlow, J.W. The prediction of the emissivity and thermal conductivity of powder beds. Part. Sci. Technol. 2004, 22, 427–440. [Google Scholar] [CrossRef]
- Shi, W.; Wang, P.; Liu, Y.; Han, G. Experiment of process strategy of selective laser melting forming metal nonhorizontal overhanging structure. Metals 2019, 9, 385. [Google Scholar] [CrossRef]
- Wan, L.; Xia, Z.; Song, Y.; Zhang, X.; Liu, F.; Fu, G.; Shi, S. Parameter optimization of selective laser melting fabricated titanium alloy using skin-core and triple contour scanning strategy. J. Laser Appl. 2020, 32, 042001. [Google Scholar] [CrossRef]


| Element | C | O | N | H | Fe | Al | V | Ti |
| Mass fraction/% | 0.02 | 0.11 | 0.02 | 0.0034 | 0.19 | 6.5 | 3.9 | bal |
| Process Parameters | Value | |||
|---|---|---|---|---|
| Parameter Set 1 | Parameter Set 2 | Parameter Set 3 | Parameter Set 4 | |
| Scanning speed/(mm/s) | 600, 800, 1000, 1200, 1400, 1600 | 400, 600, 800, 1000, 1200 | 800 | 1000 |
| Laser power/W | 100, 120, 140, 160, 180, 200 | 120, 140, 160, 180, 200 | 160 | 160 |
| Layer thickness/mm | 0.03 | 0.03 | 0.03 | 0.03 |
| Scanning space/mm | 0.08 | 0.08 | 0.08 | 0.08 |
| Full Name | Abbreviation |
|---|---|
| Upper Surface Roughness | USR |
| Vertical Side Roughness | VSR |
| Upper Side Surface Roughness | USSR |
| Lower Side Roughness | LSR |
| Line Energy Density | LED |
Disclaimer/Publisher’s Note: The statements, opinions and data contained in all publications are solely those of the individual author(s) and contributor(s) and not of MDPI and/or the editor(s). MDPI and/or the editor(s) disclaim responsibility for any injury to people or property resulting from any ideas, methods, instructions or products referred to in the content. |
© 2023 by the authors. Licensee MDPI, Basel, Switzerland. This article is an open access article distributed under the terms and conditions of the Creative Commons Attribution (CC BY) license (https://creativecommons.org/licenses/by/4.0/).
Share and Cite
Wang, D.; Lv, J.; Wei, X.; Lu, D.; Chen, C. Study on Surface Roughness Improvement of Selective Laser Melted Ti6Al4V Alloy. Crystals 2023, 13, 306. https://doi.org/10.3390/cryst13020306
Wang D, Lv J, Wei X, Lu D, Chen C. Study on Surface Roughness Improvement of Selective Laser Melted Ti6Al4V Alloy. Crystals. 2023; 13(2):306. https://doi.org/10.3390/cryst13020306
Chicago/Turabian StyleWang, Di, Jiale Lv, Xiongmian Wei, Dong Lu, and Chen Chen. 2023. "Study on Surface Roughness Improvement of Selective Laser Melted Ti6Al4V Alloy" Crystals 13, no. 2: 306. https://doi.org/10.3390/cryst13020306