Next Article in Journal
Reactive Spark Plasma Sintering and Thermoelectric Properties of Zintl Semiconducting Ca14Si19 Compound
Next Article in Special Issue
Temperature Induced Monoclinic to Orthorhombic Phase Transition in Protonated ZSM-5 Zeolites with Different Si/Al Ratios: An In-Situ Synchrotron X-ray Powder Diffraction Study
Previous Article in Journal
Green Route Synthesis and Molecular Docking of Azines Using Cellulose Sulfuric Acid under Microwave Irradiation
 
 
Correction published on 15 March 2024, see Crystals 2024, 14(3), 277.
Article

The Crystal Structure of Calcium Sebacate by X-ray Powder Diffraction Data

1
Dipartimento di Scienze e Innovazione Tecnologica, Università del Piemonte Orientale, Viale T. Michel 11, 15121 Alessandria, Italy
2
Nova Res s.r.l., Via D. Bello 3, 28100 Novara, Italy
*
Author to whom correspondence should be addressed.
Crystals 2023, 13(2), 261; https://doi.org/10.3390/cryst13020261
Submission received: 28 December 2022 / Revised: 19 January 2023 / Accepted: 21 January 2023 / Published: 2 February 2023 / Corrected: 15 March 2024
(This article belongs to the Special Issue Young Crystallographers Across Europe)

Abstract

:
Sodium sebacate salts have several industrial applications as additives, lubricants, and a metal self-healing promoter in general industry, and some derivatives also have wide applications in cosmetics and pharmaceutical fields. Calcium sebacate formation and precipitation can be detrimental for the systems where sodium sebacate is used. It is thus important to investigate their crystallization features. Sodium and calcium sebacate were prepared, purified, and crystallized with different approaches to carry out a full X-ray diffraction powder diffraction structural analysis since suitable single crystals cannot be obtained. The calcium sebacate crystal structure was solved by simulated annealing. Calcium ions form layers connected by straight “all trans” sebacate molecules, a conformation that is also suggested by Fourier-transform infrared spectroscopy FTIR data. Water molecules are caged within calcium layers. The crystal structure is characterized by the calcium layers bent by 10.65 ° with respect to the plane where sebacate chains lie, different from other dicarboxilic salts, such as cesium suberate, where the layers are perpendicular to the cation planes. The sodium sebacate crystal structure resulted in being impossible to be solved, despite several crystallization attempts and the different data collection approaches. FTIR spectroscopy indicates marked differences between the structures of calcium and sodium sebacate, suggesting a different type of metal coordination by carboxyls. Calcium sebacate shows a bis-bidentate chelating and bridging configuration ( N a 2 ( C ( κ 1 κ 1 ) μ 3 C a r b ), while for sodium sebacate, FTIR spectroscopy indicates an ionic interaction between sodium and the carboxyls. A thermogravimetric analysis TGA was carried out to assess the hydration states of the two salts. Calcium sebacate shows, as expected, a total weight loss of ca. 7%, corresponding to the single water molecule located in the crystal structure, while sodium sebacate shows no weight loss before total combustion, indicating that its structure is not hydrated. Scanning electron microscopy SEM images show different morphologies for calcium and sodium salts, probably a consequence of the different interactions at the molecular lever suggested by FTIR and TGA. The used approach can be extended to fatty acid salt in general, a still under-explored field because of the difficulty of growing suitable single crystals.

1. Introduction

Sebacate salts have several industrial applications as a polymer additive [1], lubricant, and anti-corrosive in general industry [2]. Sebacate esters have wide applications in cosmetics and pharmaceutical fields [3,4]. Sodium sebacate is the more widely used derivative in the aqueous environment, being rather soluble (198 g L 1 ). A typical application is as a self-healing promoter in coolant liquid formulation [5,6]. Conversely, calcium sebacate, produced by an ion exchange in calcium-rich environments, shows a much decreased solubility (2 g L 1 ), and thus, its formation and precipitation can be detrimental for the systems where sodium sebacate is used in water-based solutions. The industry interest of sebacate salts is further indicated by an active patent on their production [7].
With these applications and related problems in mind, it is important to investigate the crystallization features of sodium and calcium sebacate. In fact, the crystal structures of the title compound is still unknown because of the extreme difficulty or impossibility of growing suitable single crystals. Neutral and salt forms of fatty acids were, in fact, studied only in the very limited cases where single crystals were available. Some monocarboxilic salts, with typically a heavy metal cation, can be found within the Cambridge Crystallographic Data Centre CCDC database (strontium caprylate [8], silver [9], strontium [10], and potassium [11] laurate, for instance), but most among these hits report only the unit cell, while the crystal structure is not available. Among dicarboxilic ones, more recently, the organic salts of suberate with an imidazolium cation [12] and bis(benzylammonium) dodecanedioate [13] are reported. The available crystal structures of salts with inorganic cations are: potassium caprate [14], cesium [15], rubidium [16], and potassium [17] suberate. Concerning the calcium cation, only a synchrotron X-ray powder diffraction study allowed the structure solution of its stearate salt [18]. Besides some fully organic sebacate salts [19], some sebacate salts with an inorganic cation are available. Concerning alkaline salt, only heavy metal salts (e.g., cesium [15] and rubidium [20]) are available. Surprisingly, within group II, only magnesium sebacate is available [21]. Some transition metal salts can be found in databases [22,23,24,25,26,27], but the crystallography features of calcium and sodium sebacate are totally unknown. No structures of fatty acid salts are available by transmission electron microscopy [28,29,30], a possible alternative when single crystals are not available. However, organic hydrated salts can be very unstable under an electron beam, and cryo-EM could be necessary, and therefore, X-ray powder diffraction was chosen.
Sodium and calcium sebacate salts were thus prepared, purified, and crystallized with different approaches to carry out a full X-ray powder diffraction structural analysis. The calcium sebacate crystal structure was solved by simulated annealing. FTIR data was used to investigate the organic chain conformation, while optical and electron microscopy was used to reveal the morphology in the different crystallization conditions. TGA data allowed the estimation of the water amount and the thermal stability of the two salts.

2. Materials and Methods

2.1. Materials and Synthesis

All of the chemicals were purchased from Sigma-Aldrich (Merck KGaA, Darmstadt, Germany ).

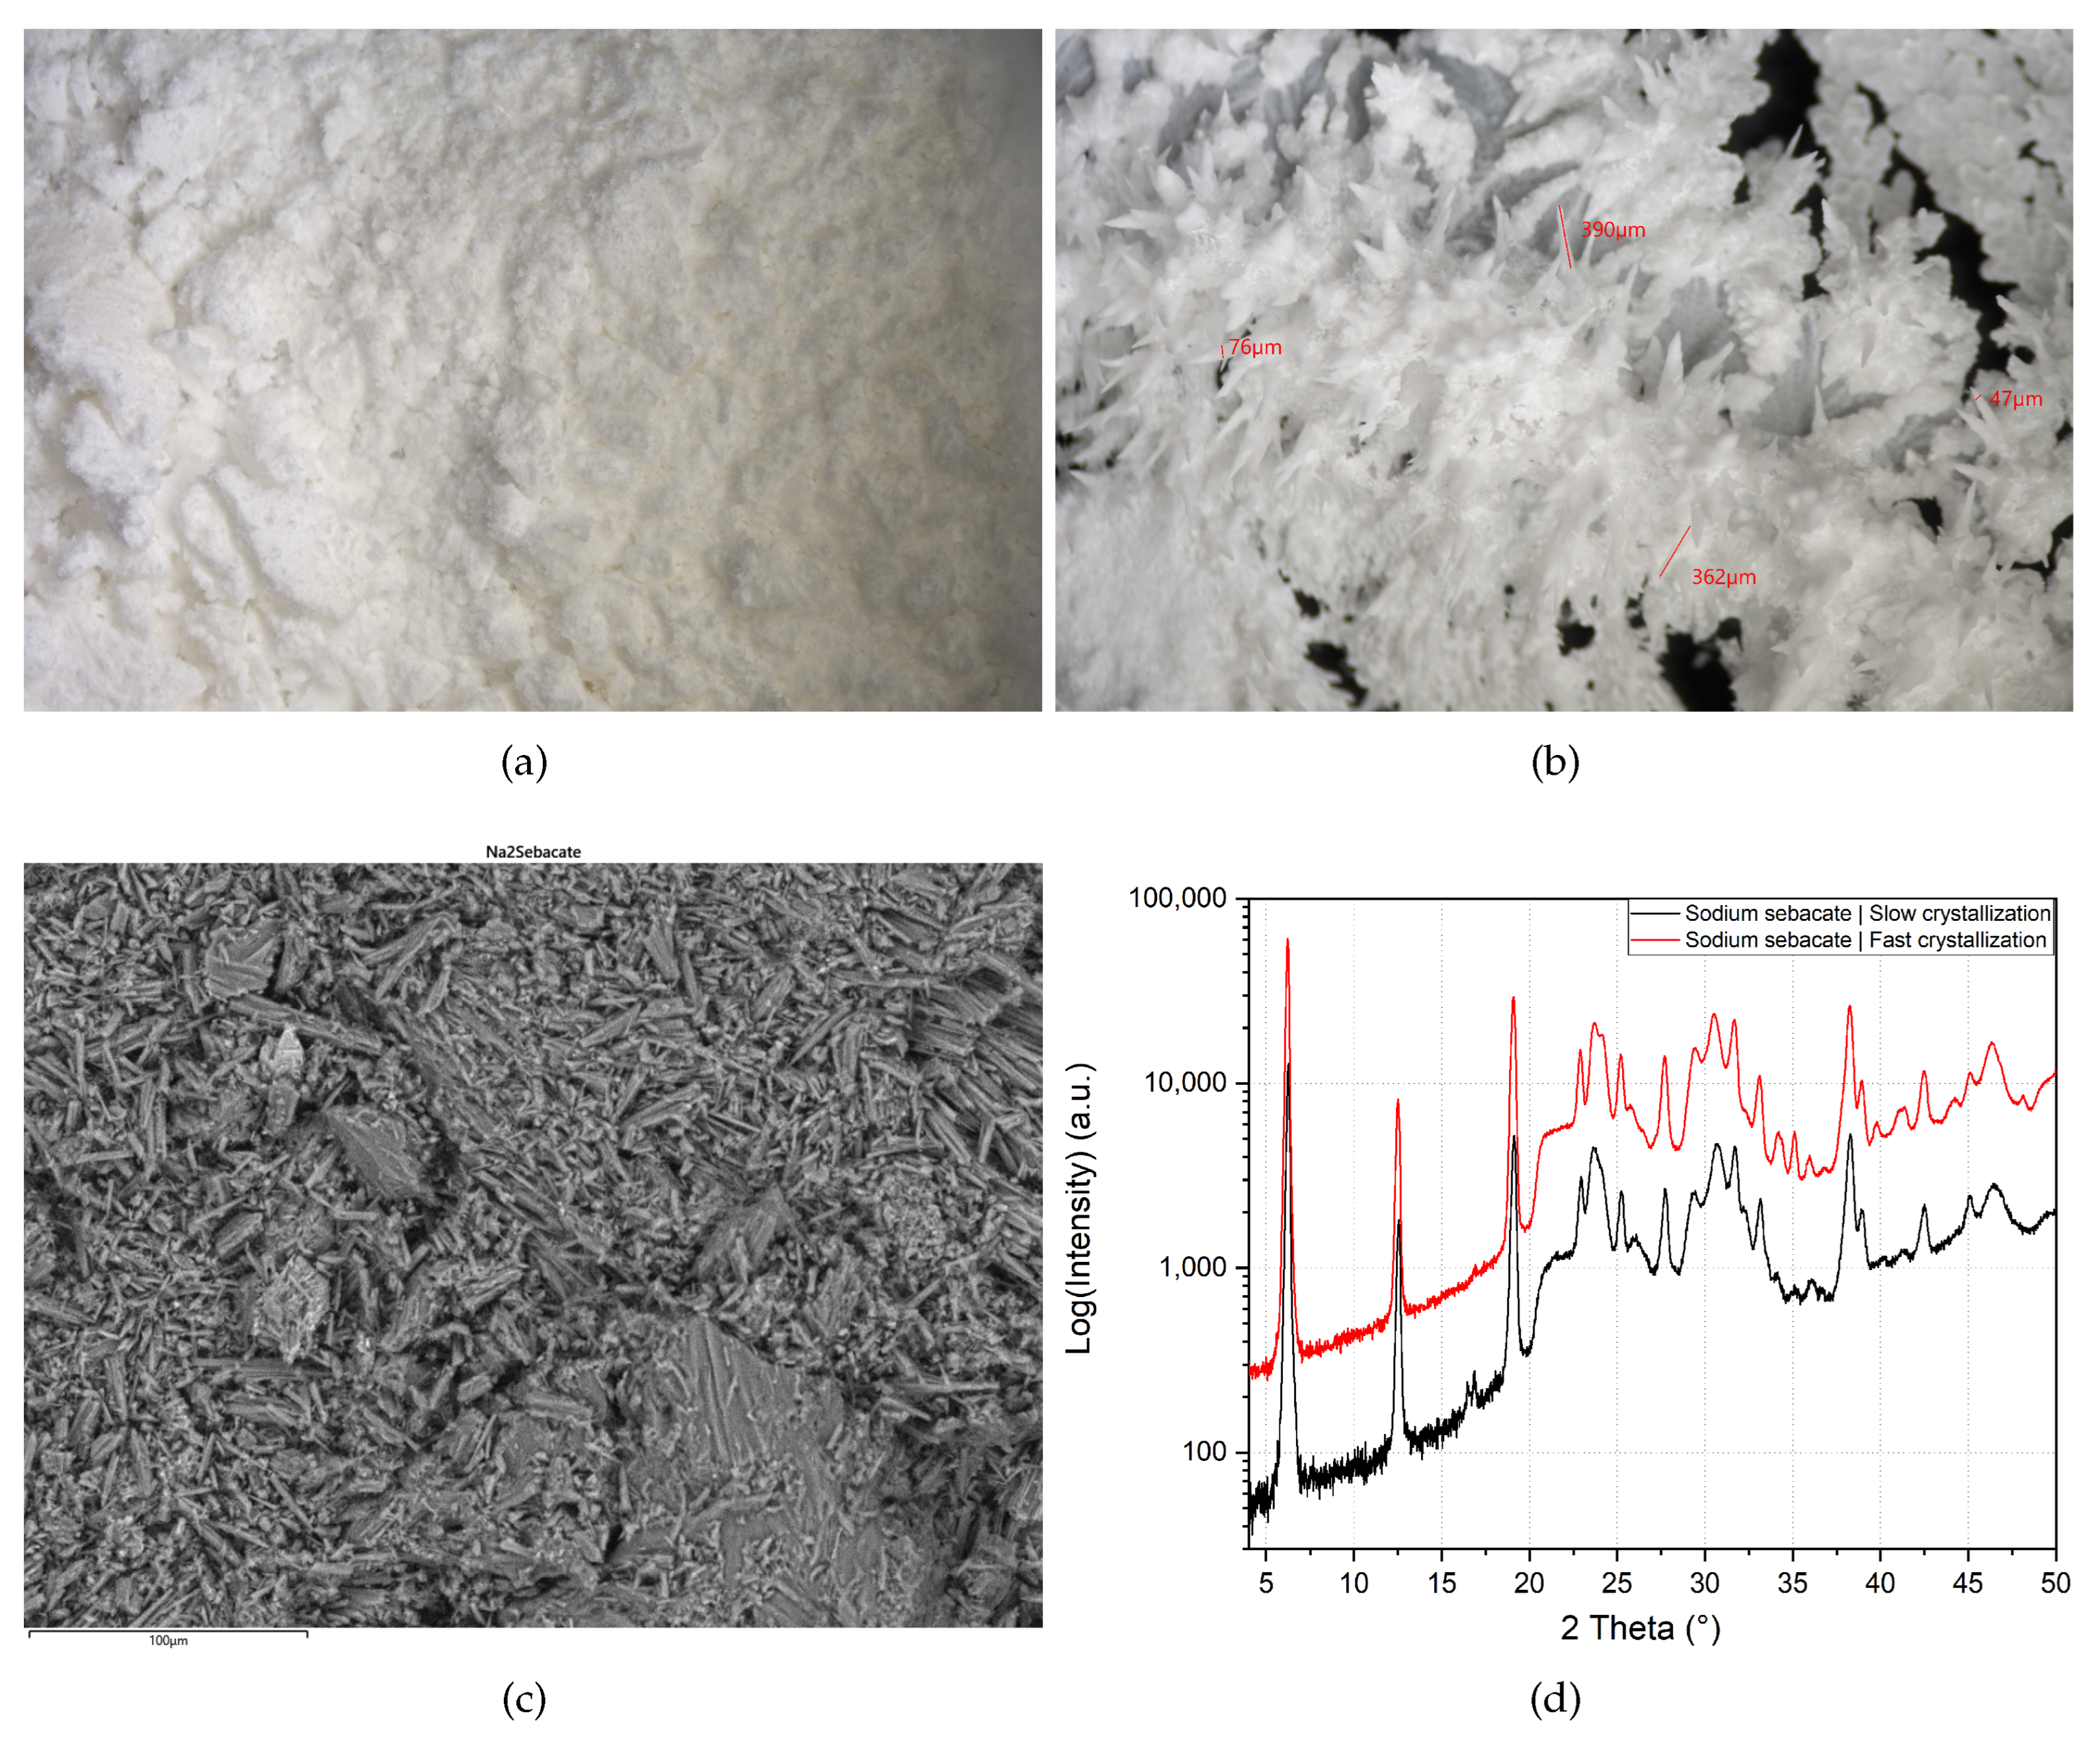
2.1.1. Sodium Sebacate

A total of 1.99   g of NaOH pellets were dissolved in 100 mL deionized water in a 250 mL beaker with a magnetic stirrer without heating. The temperature was raised from room temperature to about 40 ° C . When the solution became transparent, 5.38   g of solid pure sebacic acid were added in small amounts while stirring. The formation of sodium sebacate is fast, and if the additions are small and with a proper time interval, a transparent solution with no remaining solid is obtained because Na2sebacate solubility in water is high (198.8 g L 1 ). If residual solid remains (sebacic acid is insoluble in water) and the pH is close to 7, a NaOH pellet (ca. 0.1   g ) can be added to complete the conversion or the liquid can be filtered to obtain a pure transparent sodium sebacate solution. The solution was divided into two batches. The first one was concentrated by heating at 90 ° C to obtain a saturated solution. When the solution started to assume a whitish color, heating was stopped, and the solution was subjected to slow overnight cooling and evaporation. The remaining white powder was dried at 80 ° C for 15 min and gently ground by hand in an agate mortar. The second batch was divided into two further batches and allowed to evaporate overnight in a beaker and in a Petri dish.

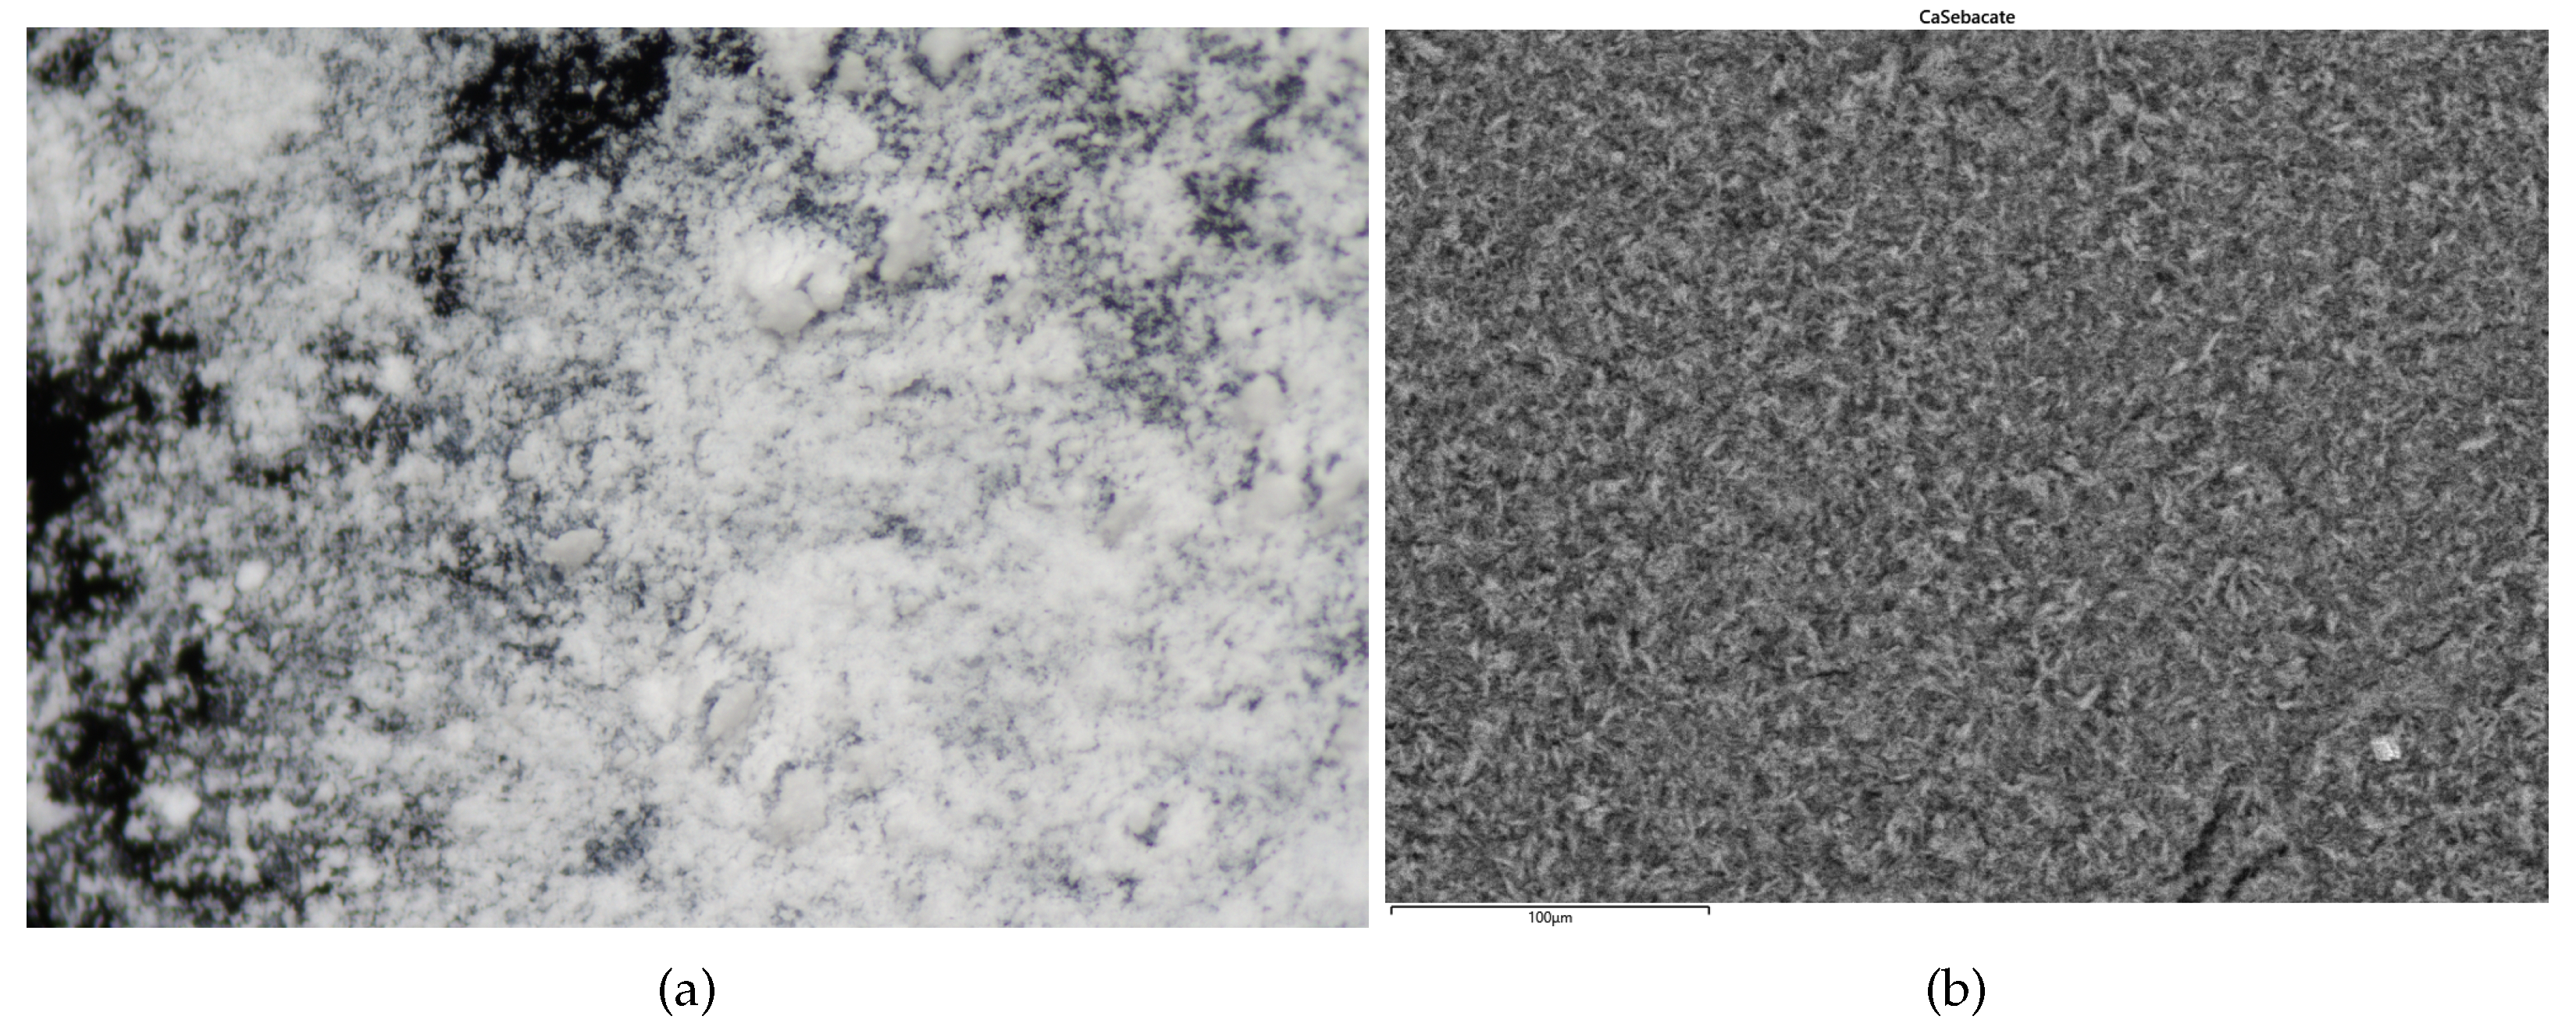
2.1.2. Calcium Sebacate

A total of 100 mL of sodium sebacate solution was prepared as described in the previous section. In total, 3.67   g of CaCl2·2H2O (dihydrated calcium chloride) was dissolved in 40 mL of deionized water. A total of 100 mL of sodium sebacate transparent solution was placed onto the stirrer, and the 40 mL of CaCl2 solution was added. The mixture became abruptly white and creamy, and it was stirred for 10 min. The samples were dried on a heater at the temperature of 80 ° C for three hours. Since the reaction is:
Na 2 C 10 H 16 O 4 + CaCl 2 + H 2 O Ca C 10 H 16 O 4 · H 2 O + 2 NaCl
the solid is a mixture of calcium sebacate and NaCl. The presence of NaCl was detected by X-ray diffraction (XRPD), and it was the proof of the successful exchange. Since calcium sebacate is poorly soluble in water (1.52 g L 1 ), contrary to NaCl, the sample was subsequently dispersed in water and filtered on a Buckner funnel with a cellulose membrane filter (mesh 0.45 μm) to eliminate NaCl. After three washing steps, the sample was transferred to the heater for two hours at 80 ° C to have a dry sample. Once dry, the sample was gently ground by hand in an agate mortar.

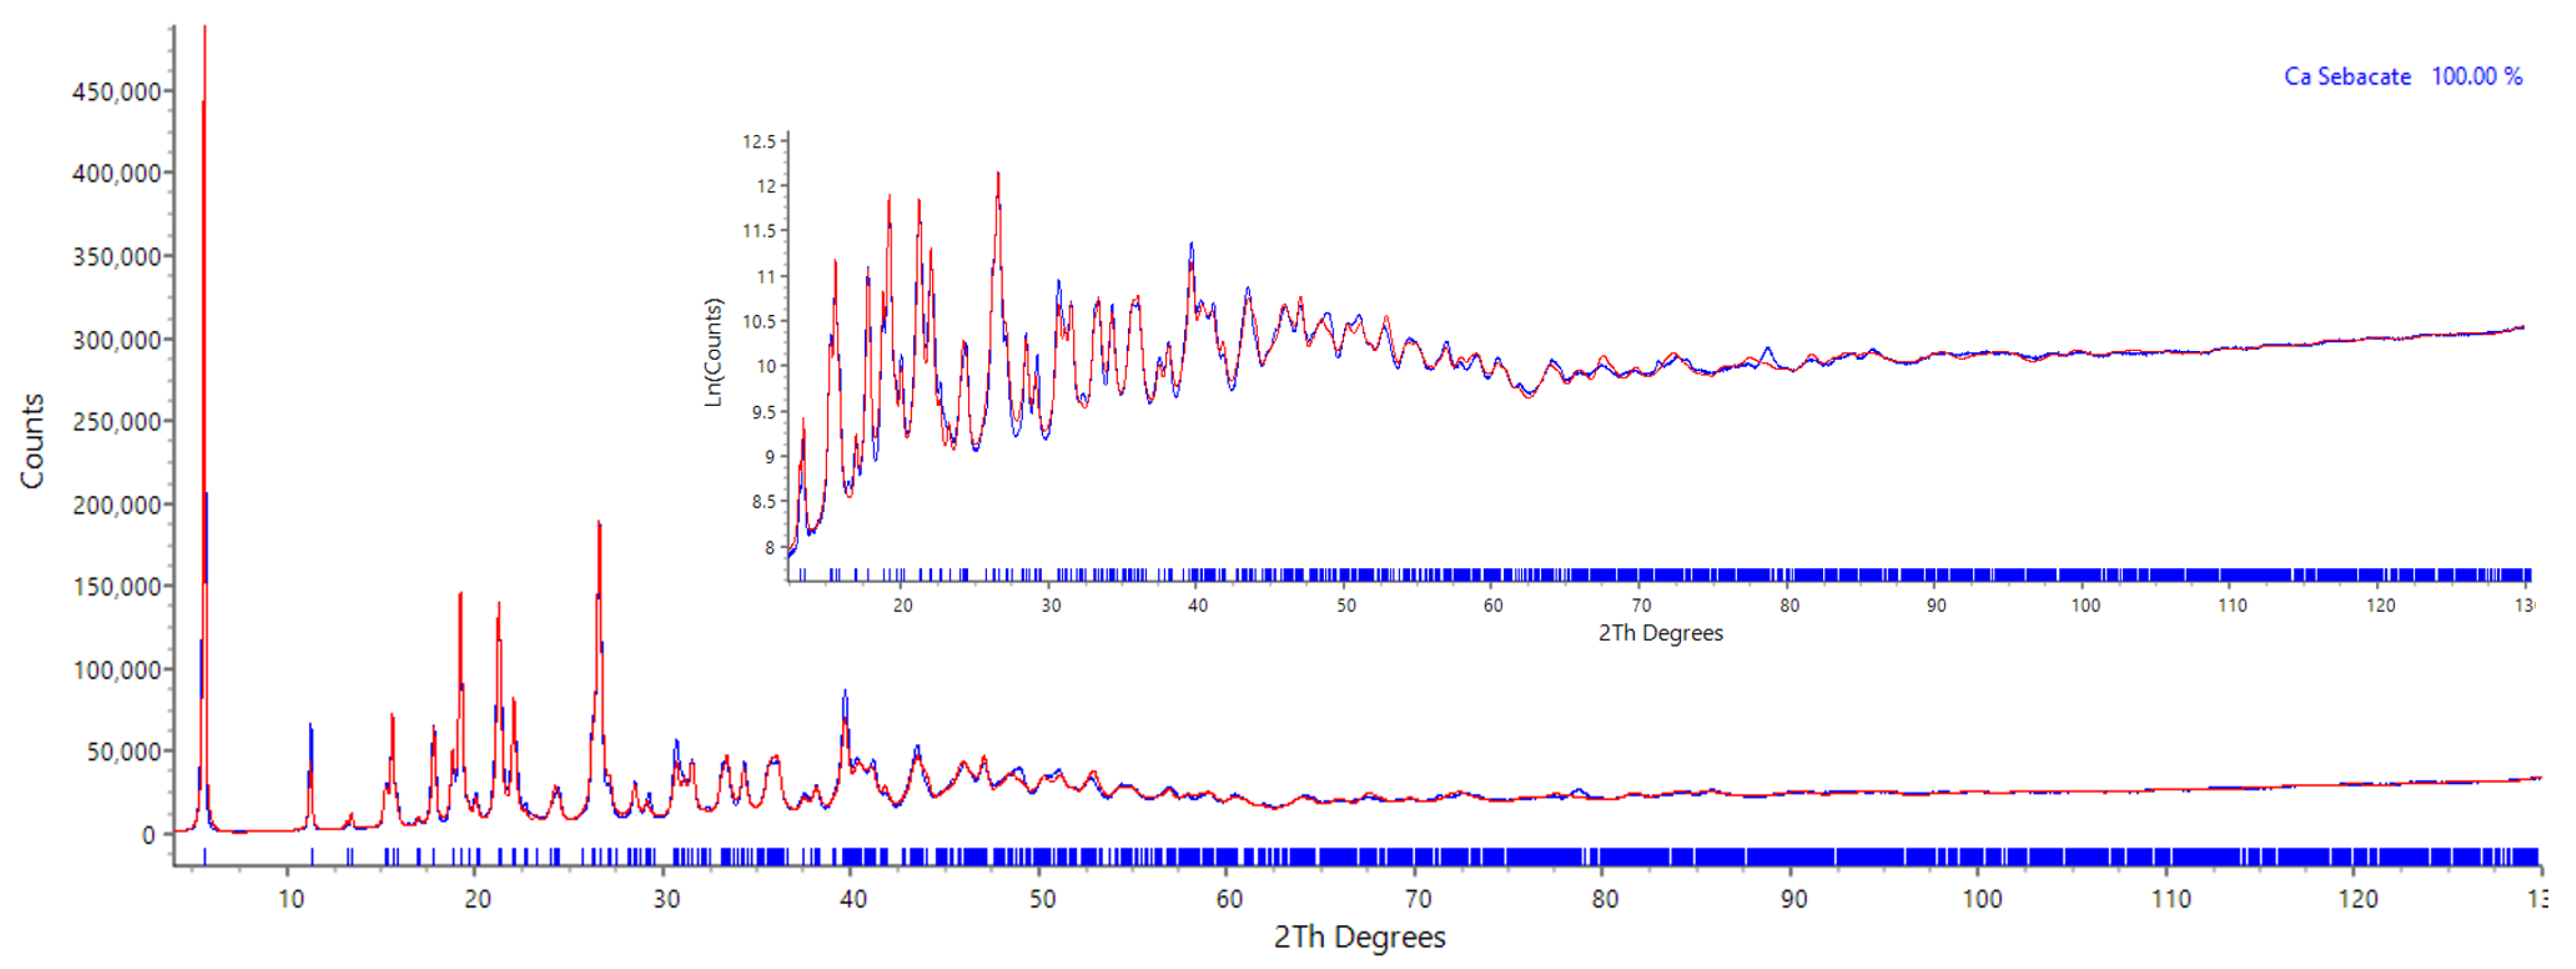
2.2. Structure Solution by X-ray Powder Diffraction

The calcium sebacate and sodium sebacate samples were characterized with a Bruker D8 Advance diffractometer, equipped with a copper K α X-ray source and a LynxEye XE-T detector. The measurement conditions of the source were set at 40 m A of current and 40 k V of electric potential. The radius of the goniometer was set in the standard measurement conditions at 280 m m . The XRPD measurement of the samples took place in two separate steps—the first one for indexing with high accuracy on peak width resolutions and the second one being a high resolution measurement for the structure solution where the intensity was much more relevant once the unit cell was known. For the indexing, the diffractometer was operated in Debye–Scherrer geometry with a capillary stage. Göbel mirrors with a 1 m m focusing hole were used as primary optics, along with planar 0.6   m m slits. The aforementioned Soller slits were mounted on both primary and secondary optics. The samples were placed in a 0.7   m m glass capillary. Overnight measurements were carried out with a total time of approximately 18 h in a range of 2 θ from 2–70 ° , a step-size of 0.01 °/step, and an irradiation time of 5 s/step. For structure solutions and final Rietveld refinement, the data collection was performed in Bragg–Brentano geometry, and variable width slits were used as primary optics in order to keep the portion of the irradiated sample constant at 17 m m . Soller slits with an angle of 2.5   ° were used on both primary and secondary optics to reduce the effect of axial divergence. Patterns were collected in an angular range from 2–130 ° in 2 θ , with a step-size of 0.02 °/step and a collection time of 4 s/step. Before attempting indexation and crystal structure solution, all the available literature on crystal structures were checked for experimental sodium and calcium sebacate experimental patterns to exclude homology with already-published structures [15,19,20,21,22,23,24,25,26,27]. After this unsuccessful check, indexation was attempted using all the available datasets for both crystal structures by EXPO2014 [31] and Topas 7 [32,33]. Cell parameters were calculated exploiting both the N-TREOR09 and the DICVOL06 algorithms, while the space groups were selected by evaluating the agreement factors and the absence of non-indexed reflections. The structure solution was carried out in parallel on Topas and EXPO, with the simulated annealing method in direct space. The starting molecular model was a fully or partially rigid-body system. In the first case, all bonds in the sebacate chain were prevented from rotating, and Ca2+ or Na+ was bound to sebacate. In other models, the ions were free to move independently, and the carboxyl group could rotate. All these models converged to the final selected crystal structure for the calcium sebacate structure. Once this structure was found, the software was gradually left to work, removing constraints and using restraints. The sebacate chain maintained a linear structure, and the overall crystal structure remained unchanged. Hydrogen atoms were refined in the model in an expected position, e.g., looking to crystallochemistry for H bonded to aliphatic C and an H-bond for hydroxyls. The same approach, with many more attempts, was used for sodium sebacate, but no satisfying solution was found, as detailed in the results section. The final TOPAS Rietveld refinement was run with soft restraints on carboxyl oxygen of the sebacate atoms, while all the carbon atoms were treated as a rigid body block, and translation and rotation parameters were refined. Calcium atoms were free to move, and 3 different isotropic thermal factors were refined for Ca, carbon atoms, and the water molecule. Crystallographic data are available in the electronic Supplementary File (ESI), and the crystal structure data have been submitted to CCDC with deposition number 2225055.

2.3. Ft-Infrafred Spectroscopy Characterization

FTIR analysis was performed on a Nicolet iN10 by Thermo Fischer Scientific, exploiting the transmission setup. Samples were dispersed in analytical grade KBr and then compressed into a pellet suitable for the analysis. Spectra of the air background were taken before each measurement. Spectra were collected with a resolution of 8 cm−1 in a wave number range spanning from 4000 cm−1 to 400 cm−1 and a total number of acquisitions equal to 64 scans.

2.4. Electron and Optical Microscopy

A Hitachi FLEXSEM 1000 equipped with AZtecOne Oxford EDS 30 mm2 detector was used for electron microscopy observation and EDS analysis. A tungsten filament was used as the electron source at 15 k V . Calcium and sodium sebacate powders were measured without coating. A STEMI 508 microscope with 2× frontal optics, Zeiss fiber optics halogen bulb, and 20 MPx SONY sensor camera were used to collect optical images with high resolution.

2.5. Termogravimetric Analysis

Thermogravimetric analysis (TGA/DTGA) of the samples was carried out under air flow (50 mL min) on a Setaram LABSYS evo instrument. Samples were heated from 30 °C to 500 °C with a temperature ramp of 10 °C min−1.

3. Results and Discussion

3.1. Crystallization Studies and Morphological Features

The crystallization of sodium and calcium sebacate is very different because of the markedly different solubility. Sodium sebacate solution can be subjected to slow evaporation or can be concentrated to induce a faster crystallization. Calcium sebacate (very poorly soluble) crystallization in water can be controlled only by slowing the CaCl2 solution addition to the sodium sebacate concentrated solution. Surprisingly, the relatively fast (few seconds) of calcium sebacate, followed by drying, as detailed in the experimental section, was enough to obtain a polycrystalline material suitable for crystal structure solution by X-ray powder diffraction.
Sodium sebacate was crystallized, with time spanning from a few seconds to overnight crystallization. The morphology is very dependent on the crystallization time (Figure 1a,b). Surprisingly, despite the different morphology, the X-ray powder diffraction patterns are very similar (Figure 1d).
The calcium sebacate powder was rather uniform, as revealed by optical and electron microscopy (Figure 2), indicating a micron/sub-micron average particle size, confirming that standard single crystal determination is impossible. EDX analysis confirmed the purity of the samples. X-ray powder diffraction data were collected in both the Bragg–Brentano and Debye–Scherrer geometries. Calcium sebacate showed a well-defined powder pattern but with a certain degree of preferred orientation, evidenced by the intensity changes between Bragg–Brentano and rotating capillary data.
The pattern is that typical of a layered structure with intense basal peaks and broad bands related to the superimposed peaks due to the other two crystallographic directions. By comparing the collected diffraction patterns with those belonging to calcium sebacate, the unit cell of sodium sebacate has the longest edge shorter than that of calcium sebacate, having the basal reflection at higher angles (Figure S2 in the ESI file). The absence of peaks between 10–20° in the sodium sebacate pattern suggests a completely different crystal structure and a larger degree of preferred orientation. Optical microscopy indicated that slow crystallization of sodium sebacate allows the formation of dendrites with improved crystallinity. Despite the many attempts, this morphology, coupled to the lighter nature of a sodium ion, made impossible to find a reliable unit cell and solve the crystal structure.

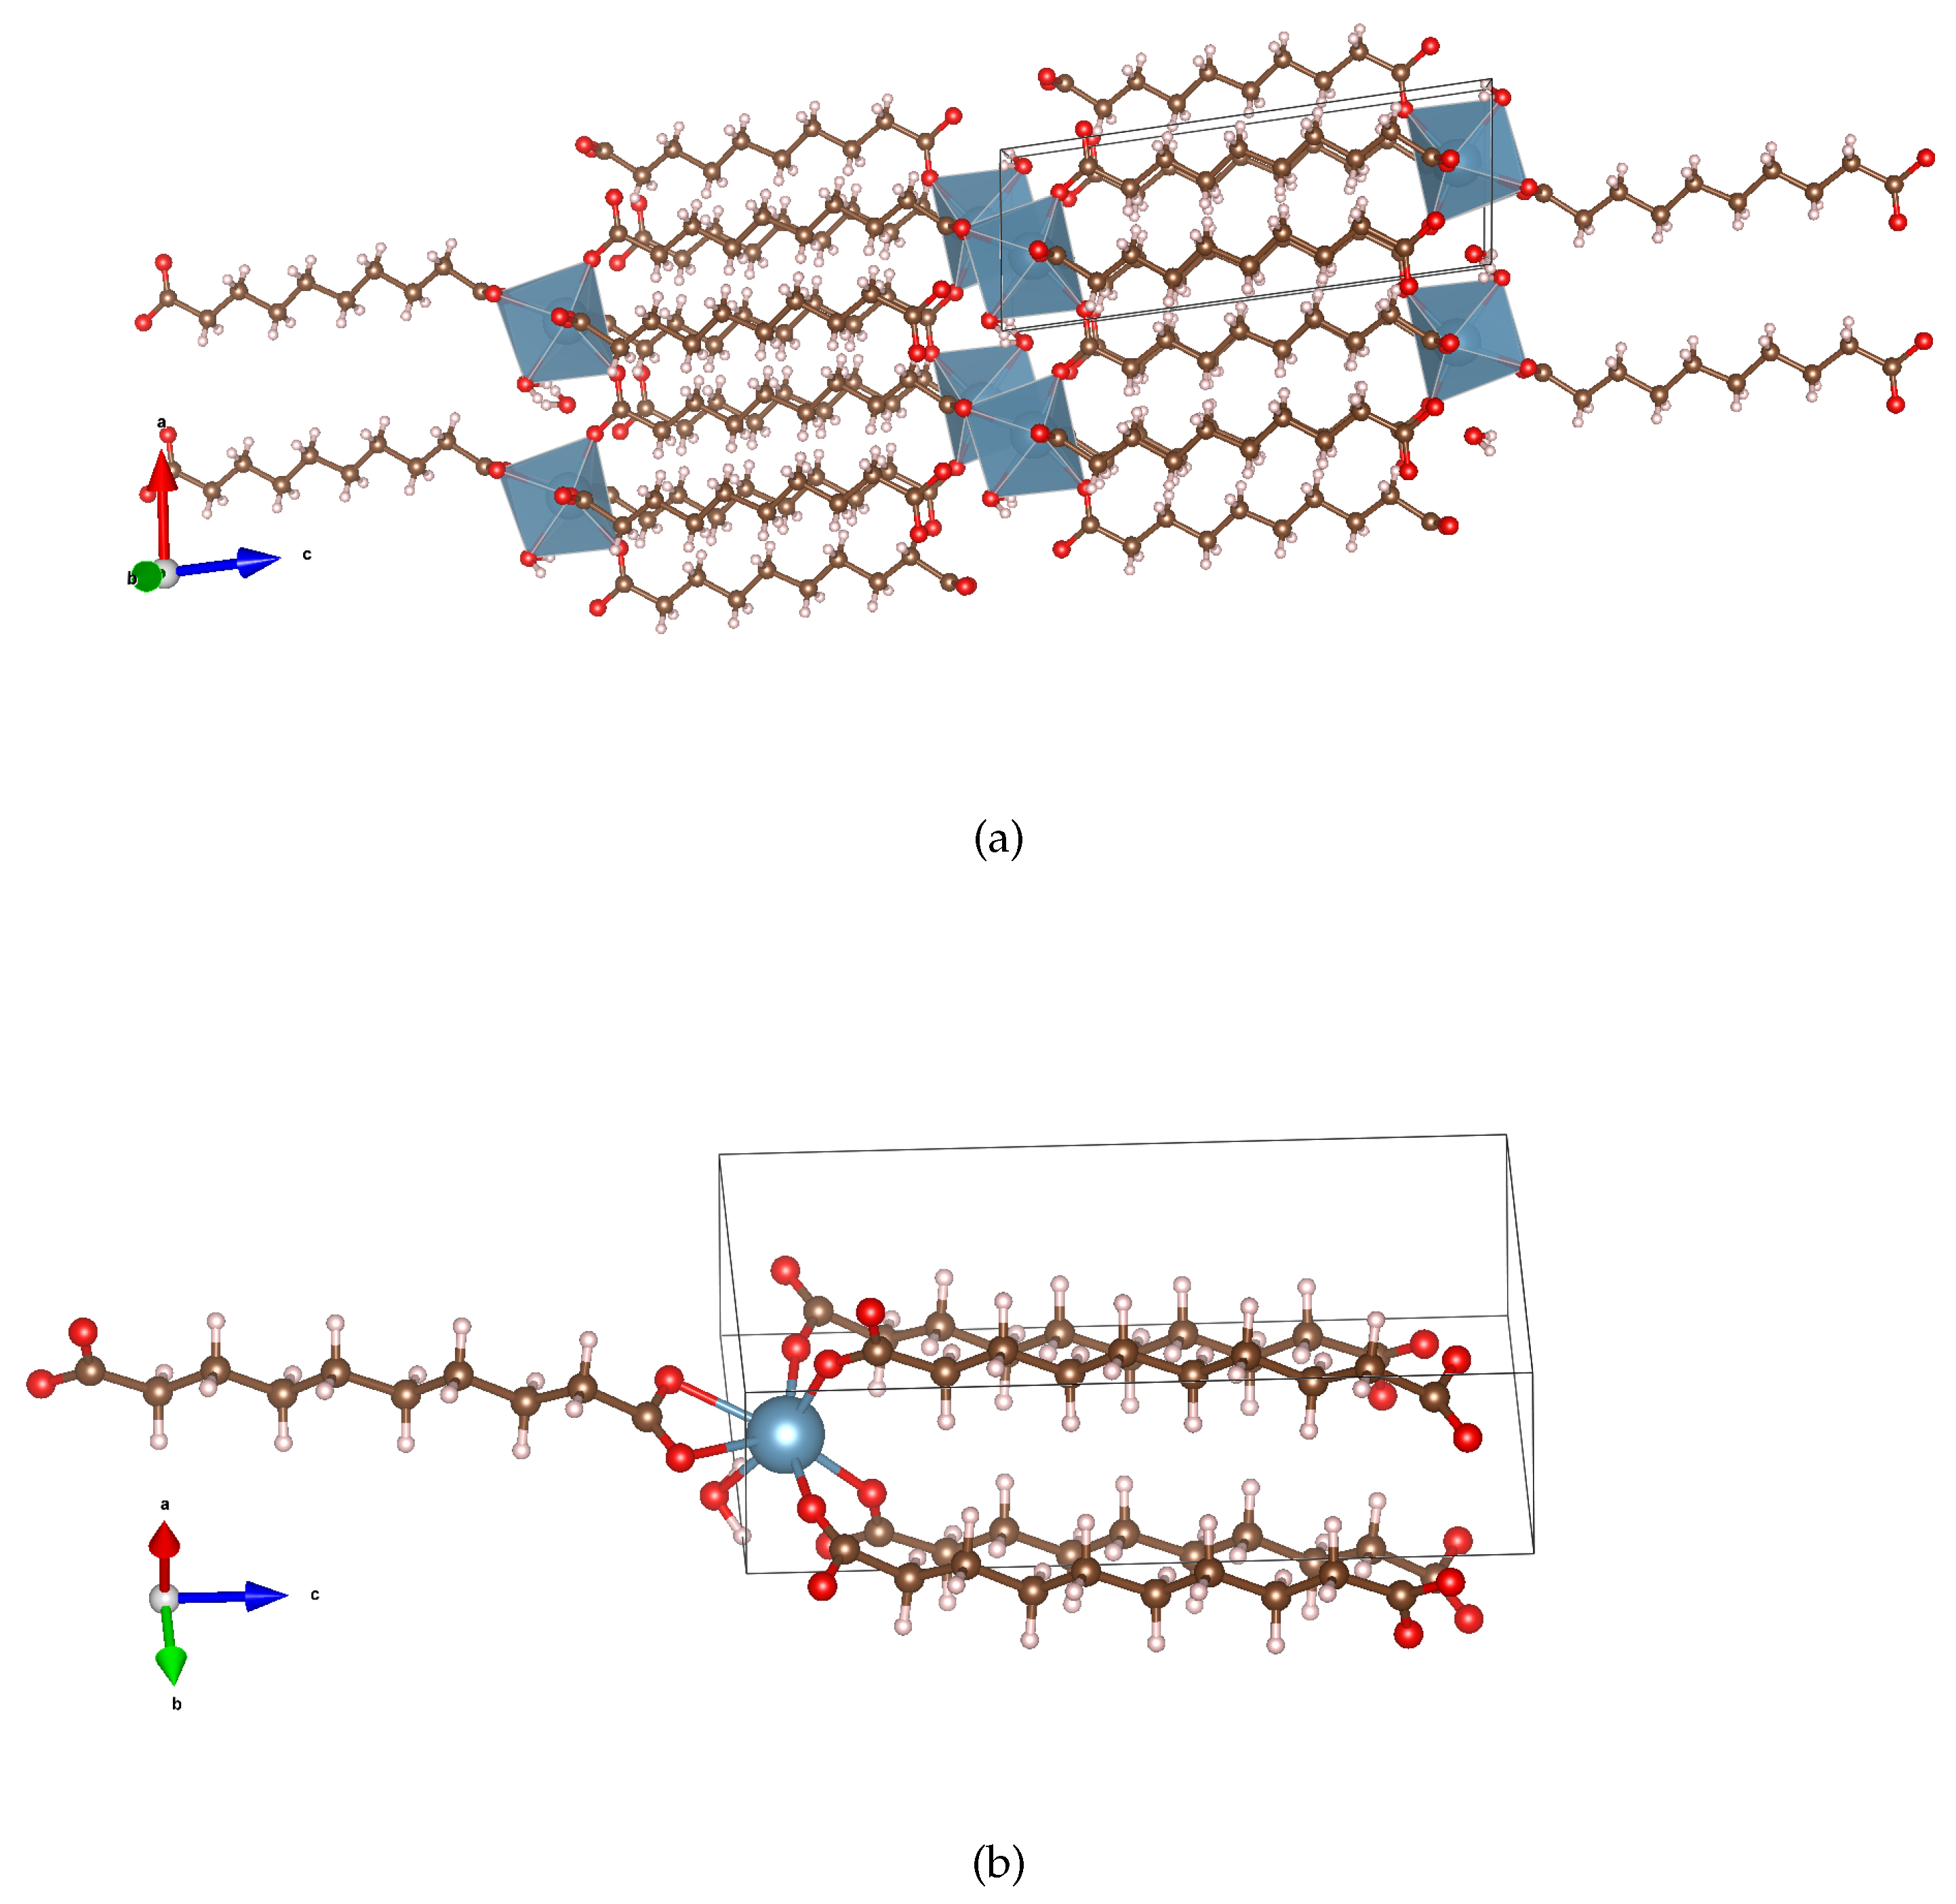
3.2. Crystal Structure of Calcium Sebacate

The crystal unit cell of calcium sebacate, obtained by the Rietveld refinement in Figure 3, is: a = 5.8633(4) Å, b = 6.8363(6) Å, c = 16.059(1) Å, alpha = 79.34( 1 )   ° , beta = 81.318( 9 )   ° , gamma = 82.834( 6 )   ° , volume = 622.2(1) Å 3 , space group P-1. A calcium sebacate crystal structure has many peculiarities with respect to the available crystal structures, mostly solved by single crystal diffraction. At first, it crystallizes in the triclinic P-1 space group, while most (more than 60% of deposited structures) are monoclinic, except for manganese coformers (CCDC 873148, 170435 [26,27]), lantanium (CCDC 873148 [25]), uranium (triclinic, CCDC 614227 [23]), and nickel (orthorombic, CCDC 728231 [22]). Concerning the crystal packing, the straight sebacate molecules are parallel and organized in layers, bent by 10.65   ° with respect to the inorganic chains (Figure 4a,b). Conversely, most sebacate salts, as cesium sebacate (CCDC 1030954 [15]), show perfectly perpendicular organic and inorganic layers, as in magnesium (CCDC 824344 [21]) or nickel [22] cases. Additionally, Me+ (Rb, CCDC 1032805 [20]) and Me3+ (Tb, CCDC 745638 [24]) salts show this perpendicular packing. The very heavy Me3+ (La and U) salts shows a more complex packing, with organic layers organized in two groups of layers—one perpendicular to inorganic cation planes and the other bent by 8 ° . Manganese sebacate shows the most peculiar packing, with a crossed X-like packing of organic chains bent 17 ° with respect to the inorganic layers (orthorombic coformer, visible along c axis [27]). Cobalt sebacate (CCDC 731682 [26]) is almost, but not exactly, perpendicular. These differences in the packing are related to the coordination and hydration of the cation in each structure. In calcium sebacate, only a water molecule is located within the crystal structure, and the cations are directly connected to opposite sebacate moieties. The chemically parent Ni2+ sebacate is completely different, with organic/inorganic layers separated by water layers. Mg2+ sebacate is in between, with a layer of water molecules connected to the cation. Differently, in both manganese sebacate coformers, the cation is tri-hydrated and forms double layers of hydrated cations. Lanthanum and uranium also form a complex layer with high coordination numbers.
A bond valence sum calculation was carried out by EXPO, according to Brese and O’Keeffe and Brown [34,35] for Ca2+ and the coordinating oxygen, and a global instability index ( G i i ) was calculated. The G and V values were computed manually, also using others’ proposed sets of parameters [36,37,38,39]. G i i below 0.1 were obtained (see Table S4 in the ESI file for all the details of the calculations), confirming that Ca−O distances and Ca2+ coordination are consistent with crystal chemical rules. It is important to underline that the final refinement was carried out without any constrain (as in a single crystal) on the Ca atom coordinates. These findings fully validate the obtained crystal structure.

3.3. Spectroscopic and Thermal Analysis

FTIR spectroscopy was used to investigate the conformation features of the organic chains. FTIR, in fact, assesses that the vibrational modes associated to the −CH2− and CCO moieties are sensitive to the trans/gauche conformation along the C−C bonds, and thus are indicative of a straight or folded organic chain.
Filopoulou et al. [40] provided an accurate assignation of FTIR spectra of fatty acid and their salts. Abreu et al. [41] studied palmitic acid in five different solvents from apolar hexane (favoring folded gauche conformations) to high dipole propanone (favoring the all-trans straight conformation); a systematic trend in the −CH2− scissoring band intensities from apolar to polar solvents was observed. Since gauche conformation is possible ( 2 8 ), the surface to be explored is much more complicated, and this can explain the difficulty of solving its crystal structure. Although sodium and calcium sebacate spectra generally share similar features, significant differences can be observed regarding the carboxylate (Figure 5). Double-splitting is observed for calcium sebacate at 1579 cm−1 and 1545 cm−1 ( ν a s COO) and 1430 cm−1 and 1414 cm−1 ( ν s COO), indicating two different densities in the coordination structure, confirming the bis-bidentate chelating and bridging configuration ( ( κ 2 ) ( κ 1 κ 1 ) μ 3 C a r b ) seen in the XRPD structure [40,42] (Figure 4b). A similar coordination is found in the structure of magnesium sebacate, but in the case of calcium sebacate, the presence of only one water molecule in the structure makes the calcium bridging coordination different, and thus, the crystal structure [21] (local structures are reported in Figure S3 in the ESI file for an easy comparison). Sodium sebacate shows carboxylate maxima at 1563 cm−1 and 1416 −1 for a ( ν a s COO) and ( ν s COO), and this can be correlated with its ionic structure.
TGA analysis (Figure 6) was carried out to assess the hydration states of the two salts. Calcium sebacate showed, as expected, a total weight loss of ca. 7%, corresponding to the single water molecule located in the crystal structure before total combustion at 450 °C. Dehydration occurs in two separate steps, which can be explained by two disordered water locations, with different stability, not distinguishable by the powder diffraction data refinement, but suggested by the short distance between two equivalent crystallographic water molecules. Sodium sebacate showed no weight loss before total combustion, indicating that its solid form is not hydrated, despite being crystallized by a water solution. A dehydrated species should, in theory, make structural resolution via simulated annealing easier because of a smaller number of molecules in the asymmetric unit. However, the preferred orientation suggested by the needle morphology coupled to the broad band observed in the XRPD pattern, resulted in both indexing and structure solution being impossible.

4. Conclusions

The crystallization features of sodium and calcium sebacate were investigated by a multi-technique characterization approach, exploiting XRPD, FTIR, SEM, and TGA analysis. The calcium sebacate crystal structure was solved by X-ray powder diffraction data. The structure was confirmed to be a mono hydrate from the thermogram, which shows a total weight loss of about 7% before total combustion, corresponding to one molecule of water. The packing of calcium sebacate is characterized by layers of organic chain in straight “all trans” conformation, alternating with Ca2+ cations connected by sebacate chains, forming an angle of 10.65   ° with inorganic layers. Water molecules are encaged within calcium layers with two possible water locations, explaining the weight loss characterized by a two-step process. The structure of calcium sebacate is characterized by the P-1 space group and a cationic center, which simultaneously coordinate two chains belonging to different sebacate layers. This conformation confers rigidity to the structure and occurs only in a few cases of monoclinic structures (rubidium, terbium, and cobalt sebacate) and in almost all those fatty acid triclinics known to scientific literature (lantanium sebacate, uranium sebacate). The sodium sebacate structure solution from XRPD data resulted impossible to be solved, probably because of its morphology being more prone to preferred orientation. However, FTIR and TGA data suggested a different sebacate conformation and the formation of an anhydrous salt (TGA) with a completely different packing. Moreover, SEM images revealed the morphology of the sodium sebacate, which appears to be made up of small needles and, therefore, potentially prone to exhibit strong preferential orientations. Future attempts using an area detector for 2D data collection are envisaged to verify and average the preferred orientation effect. The used approach has very promising applications in the structural investigation of further fatty acid salts that are of interest to various disciplinary and/or industrial fields.

Supplementary Materials

The following supporting information can be downloaded at: https://www.mdpi.com/2073-4352/13/2/261/s1, Figure S1: Plot of the calcium sebacate structure with atom labels; Figure S2: plot of the XRPD of calcium sebacate vs sodium sebacate; Figure S3: details of calcium coordination and magnesium coordination in calcium sebacate vs magnesium sebacate; Table S1: crystal data and structure refinement for calcium sebacate; Table S2: atomic table for the structure of calcium sebacate; Table S3: bond distances for the title structure; Table S4: BVS and GII calculated for calcium and coordinating oxygen atoms.

Author Contributions

Conceptualization, L.P. and M.M.; data curation, M.L., L.P. and M.M.; formal analysis, M.L. and L.P.; funding acquisition, L.P. and M.M.; investigation, M.L., L.P. and M.M.; methodology, M.L., L.P. and M.M.; validation, L.P.; writing—original draft, M.L. and M.M.; writing—review and editing, L.P. All authors have read and agreed to the published version of the manuscript.

Funding

Project 288–105 by FINPIEMONTE within the Programma Pluriennale Attività Produttive 2015/2017 Misura `3.1 “Contratto d’insediamento” (Università del Piemonte Orientale).

Data Availability Statement

Crystallographic information of the title compound were deposited on CCDC’s database. The associated Refcode is 2225055.

Conflicts of Interest

The authors declare no conflict of interest.

References

  1. Liu, T.; Li, Z.; Jiang, T.; Xi, S.; Li, Y.; Guo, J.; Huang, M.; Algadi, H.; Ye, X.; Jiang, Q. Improvement of thermodynamic properties of poly(butanediol sebacate-butanediol terephthalate) (PBSeT) composites based on the dispersion of PCaCO3@tannic acid formed by complexation of tannic acid and Ti. Adv. Compos. Hybrid Mater. 2022, 5, 2787–2800. [Google Scholar] [CrossRef]
  2. Norwitz, G.; Gordon, H. Determination of lithium stearate in sebacate-based lubricants by atomic absorption. Talanta 1973, 20, 905–907. [Google Scholar] [CrossRef] [PubMed]
  3. Liang, S.; Cook, W.D.; Chen, Q. Physical characterization of poly(glycerol sebacate)/Bioglass® composites. Polym. Int. 2011, 61, 17–22. [Google Scholar] [CrossRef]
  4. Poucher, W. Perfumes, Cosmetics and Soaps: Modern Cosmetics; Springer: New York, NY, USA, 2013. [Google Scholar]
  5. Argade, G.; Chilukuri, A.; Perry, J.; Viers, M.; Steenhoek, J.; Debusk, J.; Wang, C.; Trobaugh, C. Corrosion Behavior of Alloyed Cast Iron in Ethylene Glycol-Based Engine Coolants at Elevated Temperature. Coatings 2021, 11, 357. [Google Scholar] [CrossRef]
  6. Huy, V.V.; Quang, H.D.; Katolik, A.; Dan, N.T.; Gaidar, S.M. The Development of Corrosion Inhibitor Used in the Automotive Coolant. Russ. J. Appl. Chem. 2021, 94, 1577–1584. [Google Scholar] [CrossRef]
  7. Guo, Z. Di-Potassium (Natrium) Sebacate and Producing Technique. China Patent Number CN1324000C, 25 March 2005. [Google Scholar]
  8. STANLEY, E. Structure of Strontium Caprylate Hydrate. Nature 1964, 203, 1375–1376. [Google Scholar] [CrossRef]
  9. Vand, V.; Aitken, A.; Campbell, R.K. Crystal structure of silver salts of fatty acids. Acta Crystallogr. 1949, 2, 398–403. [Google Scholar] [CrossRef]
  10. Morley, W.M.; Vand, V. Crystal Structure of Strontium Laurate. Nature 1949, 163, 285. [Google Scholar] [CrossRef]
  11. Lomer, T.R. The unit-cell dimensions of potassium soaps. Acta Crystallogr. 1952, 5, 11–14. [Google Scholar] [CrossRef]
  12. Garbarczyk, J.; Pogorzelec-Glaser, K. Crystal structure of imidazolium decanedioate, C18H31N2O6. Z. Für Krist.—New Cryst. Struct. 2003, 218, 601–602. [Google Scholar] [CrossRef]
  13. Mo, L.; Jin, S.; Zhang, W.; Guo, J.; Liu, H.; Wang, D. The crystal structures of ten supramolecular adducts of benzylamine and organic acids. J. Mol. Struct. 2020, 1205, 127538. [Google Scholar] [CrossRef]
  14. Lewis, E.L.V.; Lomer, T.R. The refinement of the crystal structure of potassium caprate (form A). Acta Crystallogr. Sect. B Struct. Crystallogr. Cryst. Chem. 1969, 25, 702–710. [Google Scholar] [CrossRef]
  15. Power, S.; Hughes, D.S.; Hursthouse, M.B.; Threlfall, T.L. CCDC 1030954: Experimental Crystal Structure Determination. 2014. Available online:. (accessed on 18 January 2023).
  16. Power, S.; Hughes, D.S.; Hursthouse, M.B.; Threlfall, T.L. CCDC 1030950: Experimental Crystal Structure Determination. 2014. Available online: https://doi.org/10.5517/CC13LSGY (accessed on 18 January 2023).
  17. Niitsoo, L.; Sarson, J.; Hughes, D.S.; Hursthouse, M.B.; Threlfall, T.L. CCDC 1032808: Experimental Crystal Structure Determination. 2014. Available online: https://doi.org/10.5517/CC13NQDW (accessed on 18 January 2023).
  18. Lelann, P.; Bérar, J.F. Synchrotron high resolution powder study of molecular packing in hydrate calcium stearate. Mater. Res. Bull. 1993, 28, 329–336. [Google Scholar] [CrossRef]
  19. Sandhu, B.; Fonari, M.S.; Sawyer, K.; Timofeeva, T.V. A series of crystalline solids composed of aminopyridines and succinic, fumaric, and sebacic acids. J. Mol. Struct. 2013, 1052, 125–134. [Google Scholar] [CrossRef]
  20. Niitsoo, L.; Sarson, J.; Hughes, D.S.; Hursthouse, M.B.; Threlfall, T.L. CCDC 1032805: Experimental Crystal Structure Determination. 2014. Available online: https://doi.org/10.5517/CC13NQ9S (accessed on 18 January 2023).
  21. Mesbah, A.; Aranda, L.; Steinmetz, J.; Rocca, E.; François, M. Crystal structure and phase transition of bis-aqua-sebacato magnesium Mg(C10H16O4)2(H2O)2. Solid State Sci. 2011, 13, 1438–1442. [Google Scholar] [CrossRef]
  22. Zhao, G.L.; Shen, J.B.; Xian, H.D. CCDC 728231: Experimental Crystal Structure Determination. 2011. Available online: https://doi.org/10.5517/CCSFSB9 (accessed on 18 January 2023).
  23. Borkowski, L.A.; Cahill, C.L. Crystal Engineering with the Uranyl Cation I. Aliphatic Carboxylate Coordination Polymers: Synthesis, Crystal Structures, and Fluorescent Properties. Cryst. Growth Des. 2006, 6, 2241–2247. [Google Scholar] [CrossRef]
  24. Xie, Y.; Bai, F.Y.; Xing, Y.H.; Wang, Z.; Pu, Z.F.; Ge, M.F. Lanthanide(III) Coordination Polymers with Longer-Spanning Flexible Ligand: Synthesis, Crystal Structure and Luminescence Property. J. Inorg. Organomet. Polym. Mater. 2010, 20, 258–263. [Google Scholar] [CrossRef]
  25. Zeng, X.Z.; Zhang, A.Y.; Bu, D.; Li, Y.W. CCDC 873148: Experimental Crystal Structure Determination. 2013. Available online: https://doi.org/10.5517/CCY9L2W (accessed on 18 January 2023).
  26. Guan, Q.Y.; Shi, P.; Shen, J.B.; Xian, H.D.; Zhao, G.L. Synthesis and Crystal Structures of Transition metal(II) Coordination Polymers Constructed by Flexible Sebacic Acid. J. Chem. Res. 2013, 37, 131–135. [Google Scholar] [CrossRef]
  27. Zheng, Y.Q.; Zhou, S.Q.; Lin, J.L. Crystal structure of triaquasebacatomanganese(II), Mn(H2O)3(C10H16O4). Z. Für Krist.—New Cryst. Struct. 2001, 216, 275–276. [Google Scholar] [CrossRef]
  28. Khakurel, K.P.; Angelov, B.; Andreasson, J. Macromolecular Nanocrystal Structural Analysis with Electron and X-Rays: A Comparative Review. Molecules 2019, 24, 3490. [Google Scholar] [CrossRef]
  29. Gruene, T.; Mugnaioli, E. 3D Electron Diffraction for Chemical Analysis: Instrumentation Developments and Innovative Applications. Chem. Rev. 2021, 121, 11823–11834. [Google Scholar] [CrossRef] [PubMed]
  30. Mu, X.; Gillman, C.; Nguyen, C.; Gonen, T. An Overview of Microcrystal Electron Diffraction (MicroED). Annu. Rev. Biochem. 2021, 90, 431–450. [Google Scholar] [CrossRef]
  31. Altomare, A.; Cuocci, C.; Giacovazzo, C.; Moliterni, A.; Rizzi, R.; Corriero, N.; Falcicchio, A. EXPO2013: A kit of tools for phasing crystal structures from powder data. J. Appl. Crystallogr. 2013, 46, 1231–1235. [Google Scholar] [CrossRef]
  32. Coelho, A. TOPAS and TOPAS-Academic: An optimization program integrating computer algebra and crystallographic objects written in C++. J. Appl. Crystallogr. 2018, 51, 210–218. [Google Scholar] [CrossRef]
  33. Coelho, A. TOPAS-Academic V7. Available online: http://www.topas-academic.net (accessed on 18 January 2023).
  34. Brese, N.E.; O’Keeffe, M. Bond-valence parameters for solids. Acta Crystallogr. Sect. B Struct. Sci. 1991, 47, 192–197. [Google Scholar] [CrossRef]
  35. Brown, I.D. Recent Developments in the Methods and Applications of the Bond Valence Model. Chem. Rev. 2009, 109, 6858–6919. [Google Scholar] [CrossRef]
  36. Zheng, H.; Langner, K.M.; Shields, G.P.; Hou, J.; Kowiel, M.; Allen, F.H.; Murshudov, G.; Minor, W. Data mining of iron(II) and iron(III) bond-valence parameters, and their relevance for macromolecular crystallography. Acta Crystallogr. Sect. D Struct. Biol. 2017, 73, 316–325. [Google Scholar] [CrossRef]
  37. Yee, T.A.; Suescun, L.; Rabuffetti, F.A. Bond valence parameters for alkali– and alkaline-earth–oxygen pairs: Derivation and application to metal-organic compounds. J. Solid State Chem. 2019, 270, 242–246. [Google Scholar] [CrossRef]
  38. Gagné, O.C.; Hawthorne, F.C. Comprehensive derivation of bond-valence parameters for ion pairs involving oxygen. Acta Crystallogr. Sect. B Struct. Sci. Cryst. Eng. Mater. 2015, 71, 562–578. [Google Scholar] [CrossRef]
  39. Allmann, R. Beziehungen zwischen Bindungslangen und Bindungsstarken in Oxidstrukturen. Monatshefte Fur Chem. 1975, 106, 779–793. [Google Scholar] [CrossRef]
  40. Filopoulou, A.; Vlachou, S.; Boyatzis, S.C. Fatty Acids and Their Metal Salts: A Review of Their Infrared Spectra in Light of Their Presence in Cultural Heritage. Molecules 2021, 26, 6005. [Google Scholar] [CrossRef] [PubMed]
  41. Abreu, D.; Filho, P.F.; Pinheiro, G.; Freire, P.; Moreira, S.; dos Santos, A.; de Sousa, F. Polymorphism at hexadecanoic-acid crystals investigated through structural and vibrational studies. Vib. Spectrosc. 2022, 121, 103402. [Google Scholar] [CrossRef]
  42. Lu, Y.; Miller, J.D. Carboxyl Stretching Vibrations of Spontaneously Adsorbed and LB-Transferred Calcium Carboxylates as Determined by FTIR Internal Reflection Spectroscopy. J. Colloid Interface Sci. 2002, 256, 41–52. [Google Scholar] [CrossRef]
Figure 1. Optical images of fast (a) and slow (b) crystallization of sodium sebacate; SEM image (c) and XRPD pattern (d) of sodium sebacate (black: slow crystallization, red: fast crystallization).
Crystals 13 00261 g001
Figure 2. Optical (a) and electron (b) microscopy images of calcium sebacate.
Crystals 13 00261 g002
Figure 3. Rietveld structural refinement (red) of calcium sebacate experimental XRPD data (blue).
Crystals 13 00261 g003
Figure 4. (a): packing of the title compound. (b): a detail of the distorted tetrahedral coordination of the calcium ion, operated by a water molecule and by carboxylic oxygen atoms.
Crystals 13 00261 g004
Figure 5. Transmission FT-Infrared spectra of calcium sebacate (black) and sodium (red)sebacate.
Crystals 13 00261 g005
Figure 6. TGA analysis of calcium sebacate (black) and sodium sebacate (red).
Crystals 13 00261 g006
Disclaimer/Publisher’s Note: The statements, opinions and data contained in all publications are solely those of the individual author(s) and contributor(s) and not of MDPI and/or the editor(s). MDPI and/or the editor(s) disclaim responsibility for any injury to people or property resulting from any ideas, methods, instructions or products referred to in the content.

