Article

A New Non-linear Stilbazolium Derivative Crystal of 4-[2-(3 Methoxy-phenyl)-vinyl]-1-methyl-pyridinium+ Iodide (MMPI): Analysis of Its Structural, Surface, Optical and NLO Properties

by
Nandhini Krishnan
1 and
Kalainathan Sivaperuman
2,*
1
School of Advanced Sciences, Vellore Institute of Technology, Vellore 632014, India
2
Centre for Nanotechnology Research, Vellore Institute of Technology, Vellore 632014, India
*
Author to whom correspondence should be addressed.
Crystals 2023, 13(1), 138; https://doi.org/10.3390/cryst13010138
Submission received: 22 December 2022 / Revised: 30 December 2022 / Accepted: 5 January 2023 / Published: 12 January 2023

Abstract

:
New organic stilbazolium family of 4-[2-(3 methoxy-phenyl)-vinyl]-1-methyl-pyridinium+ iodide (MMPI) was successfully synthesized using the condensation reaction method. The recrystallization process was carried out to improve the purity of the synthesized material, and MMPI and grown into a single crystal by the solvent evaporation method. The solubility of the (MMPI) material was taken at different temperatures with a mixture of solvent Methanol: Acetonitrile (1:1). The grown MMPI crystal structure and cell parameters were solved via single crystal X-ray diffraction analysis. The structural formation of the title material was also confirmed by Nuclear Magnetic Resonance spectroscopic (NMR) studies. The experimental vibrational bands in the synthesized material have been assigned by Fourier Transform Infrared (FT-IR) spectrum analysis. From the optical analysis, the grown crystal’s lower cut-off wavelength, transmittance range, and optical band gap were calculated. Chemical etching analysis was carried out on the grown crystal surface (MMPI) to study the surface property of the grown MMPI crystal. Along with etching, atomic force microscope (AFM) and scanning electron microscope (SEM) were also used to analyses the grown MMPI crystal surface. Hirshfeld surface analysis was used to analyses the intermolecular interactions. HOMO and LUMO energies were calculated theoretically using the Gaussian View 6 programmer. The chemical activity was evaluated via the molecular electrostatic potential using the density functional theory (DFT) method. The third-order nonlinear optical parameters of the title crystal were evaluated at He-Ne laser (632.8 nm) source with the single beam Z-scan technique. In addition, it shows significant reverse saturable absorption and self-defocusing.

1. Introduction

In the last few years, organic molecular crystals which exhibit high nonlinearity have attracted huge interest in science and technology because of their potential uses, such as ultrafast optical communication, high-speed information processing, data storage, optoelectronics, optical limiting, logic devices, optical switching, chemical sensing and photonics [1,2,3]. While organic nonlinear materials have delocalized π-conjugated systems, they have stronger nonlinear responses than their inorganic counterparts [4]. The main advantage of organic materials over inorganic counterparts is that organic molecules have strong intramolecular charge transfer and the structure can be changed based on demand via chemical synthesis [5]. The major cause of nonlinear is the stilbazolium cation which is the most attractive chromophore. Due to their highly aligned and stable orientation of the NLO chromophore in the crystal system, organic stilbazolium crystals have a strong polarization effect, which in turn enhances the nonlinearity of the crystal. Since they contain a conjugated D-π-A structure, the presence of hydrogen bonds produces a high delocalization of electronic charge transition. One of the primary characteristics of stilbazolium derivatives is their strong intermolecular charge transfer transition, which makes them a strong candidate for organic NLO materials and gives strong optical nonlinearities. Due to these important features, stilbazolium derivatives are used in various domains, notably frequency conversion, electro-optical modulation, Terahertz (THz), and photonics technologies [6]. Ionic organic materials have attracted much attention over the past few years due to their photonics applications, high photochemical stability and thermal stability [7]. The most popular and widely studied ionic crystal is DAST (4-N,N-dimethylamino-4′-N’-methyl-stilbazolium tosylate) and its family crystals [8]. The nonlinear optical susceptibility and crystal structure of stilbazolium salts may be modified by varying the substituents on the counter anion. Strong Coulombic interactions are required to form highly polar ionic organic stilbazolium crystals [9]. The stilbazolium cation contains an ethylenic bridge (C=C); this is one of the major factors of the high NLO response of the DAST derivative. This double bond connects the electron-donating and accepting groups. To create a carbon-carbon bond in an olefine bridge, many reactions have been reported, namely Knoevenagel condensation, Wittig reaction or Wittig–Horner– Emmons condensations and Suzuki coupling reaction [10,11].
So far, no report available on the stilbazolium derivative single crystal with iodide (I) anion has been found in the literature survey. This present article discusses in detail the synthesis, growth and examination of the various physical and chemical properties of the MMPI crystal for the first time. The structure of this new stilbazolium family MMPI crystal was solved and deposited in the CCDC database (2131739). The single crystal structure investigation confirms the centrosymmetric crystal of MMPI. It is significant to note that these characteristics are related to the centrosymmetric nature (i.e) third-harmonic generation (THG). Various physicochemical behaviours such as FTIR, UV-Vis-NIR spectroscopy, Photoluminescence, Atomic force microscopy, Chemical etching study, Scanning electron microscopy, Hirshfeld surface, HOMO-LUMO, Molecular electrostatic potential were carried out to identify the potential application of the grown crystal in various fields such as optoelectronic, nonlinear optics and photonics.

2. Materials and Methods

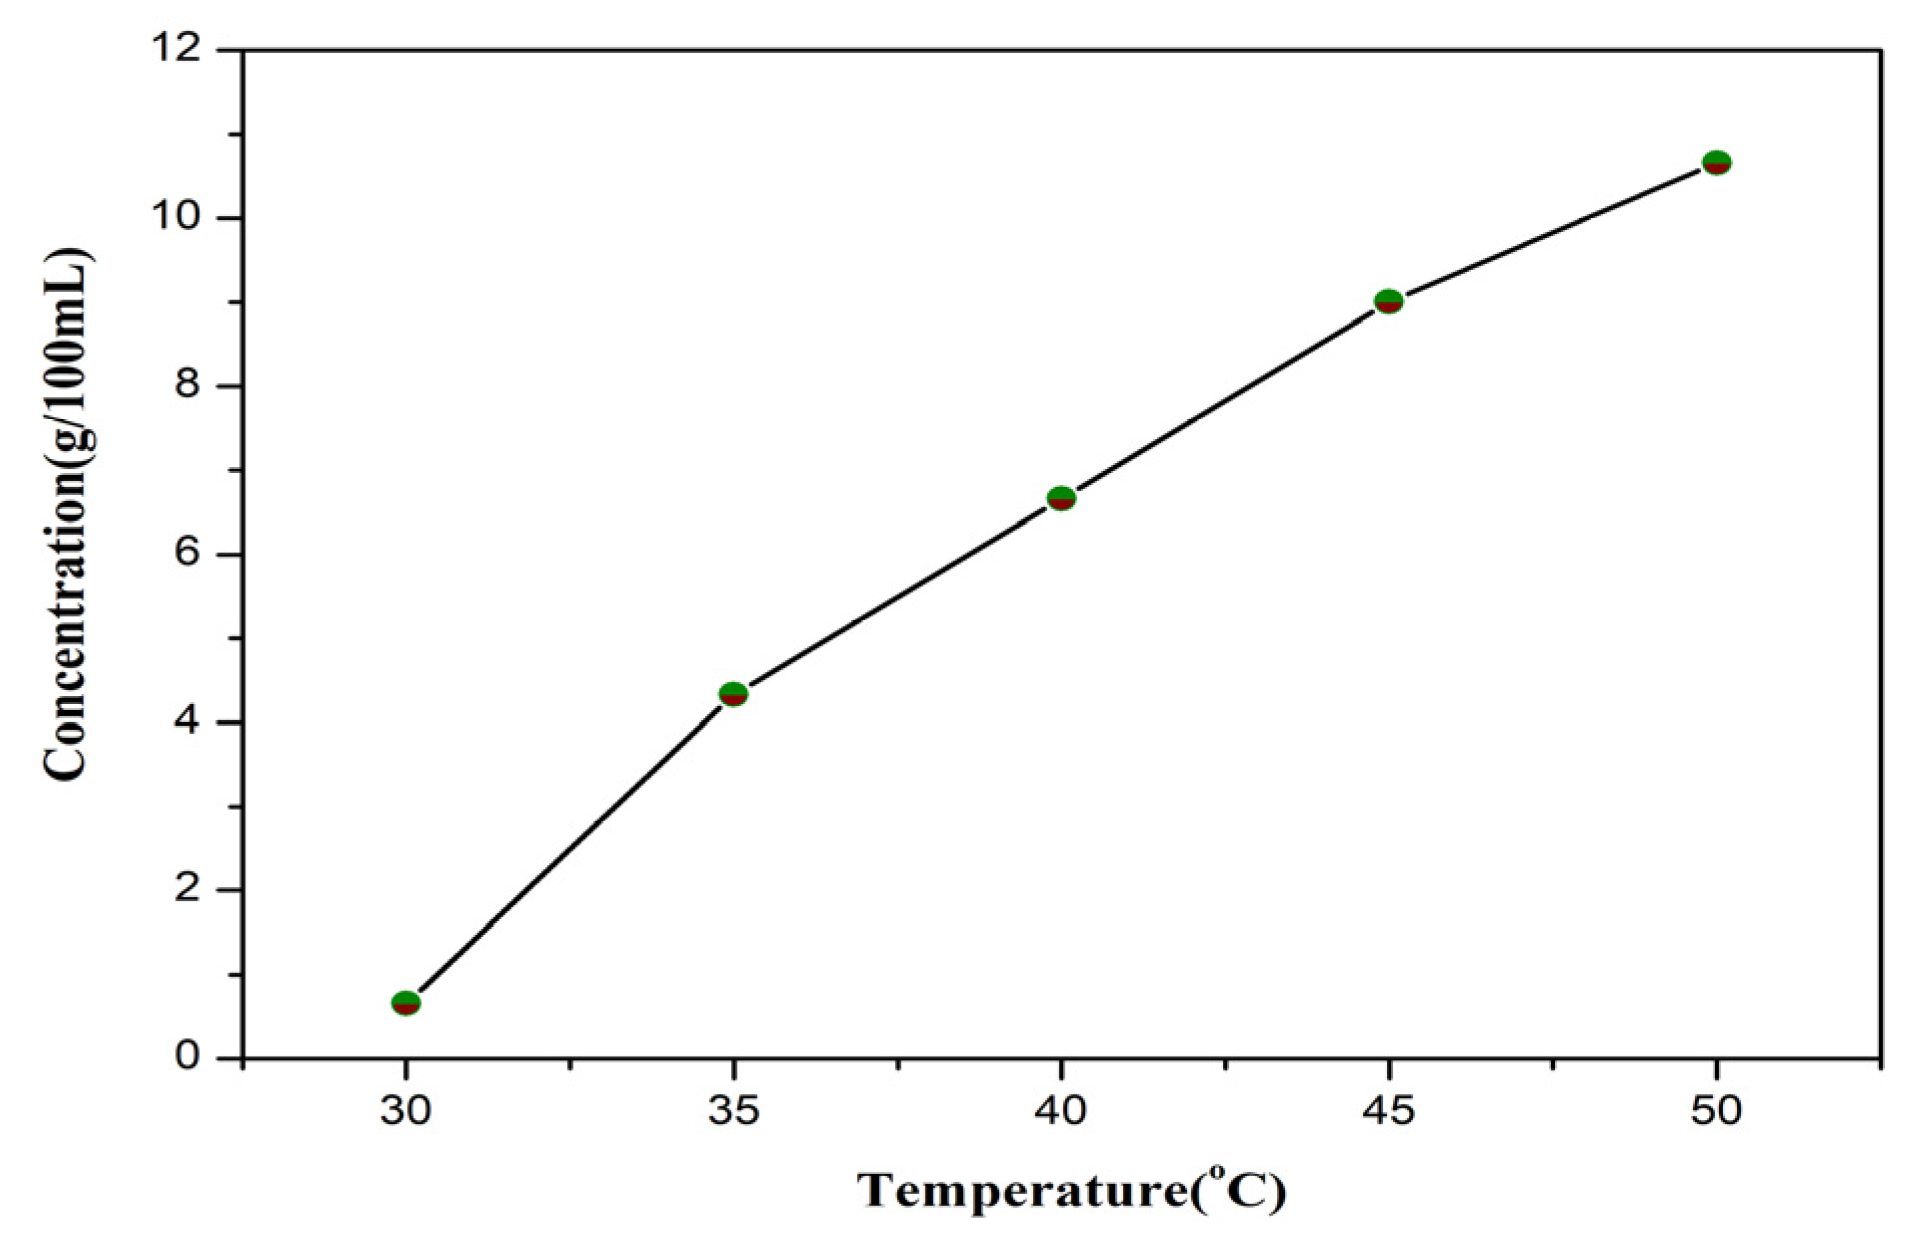
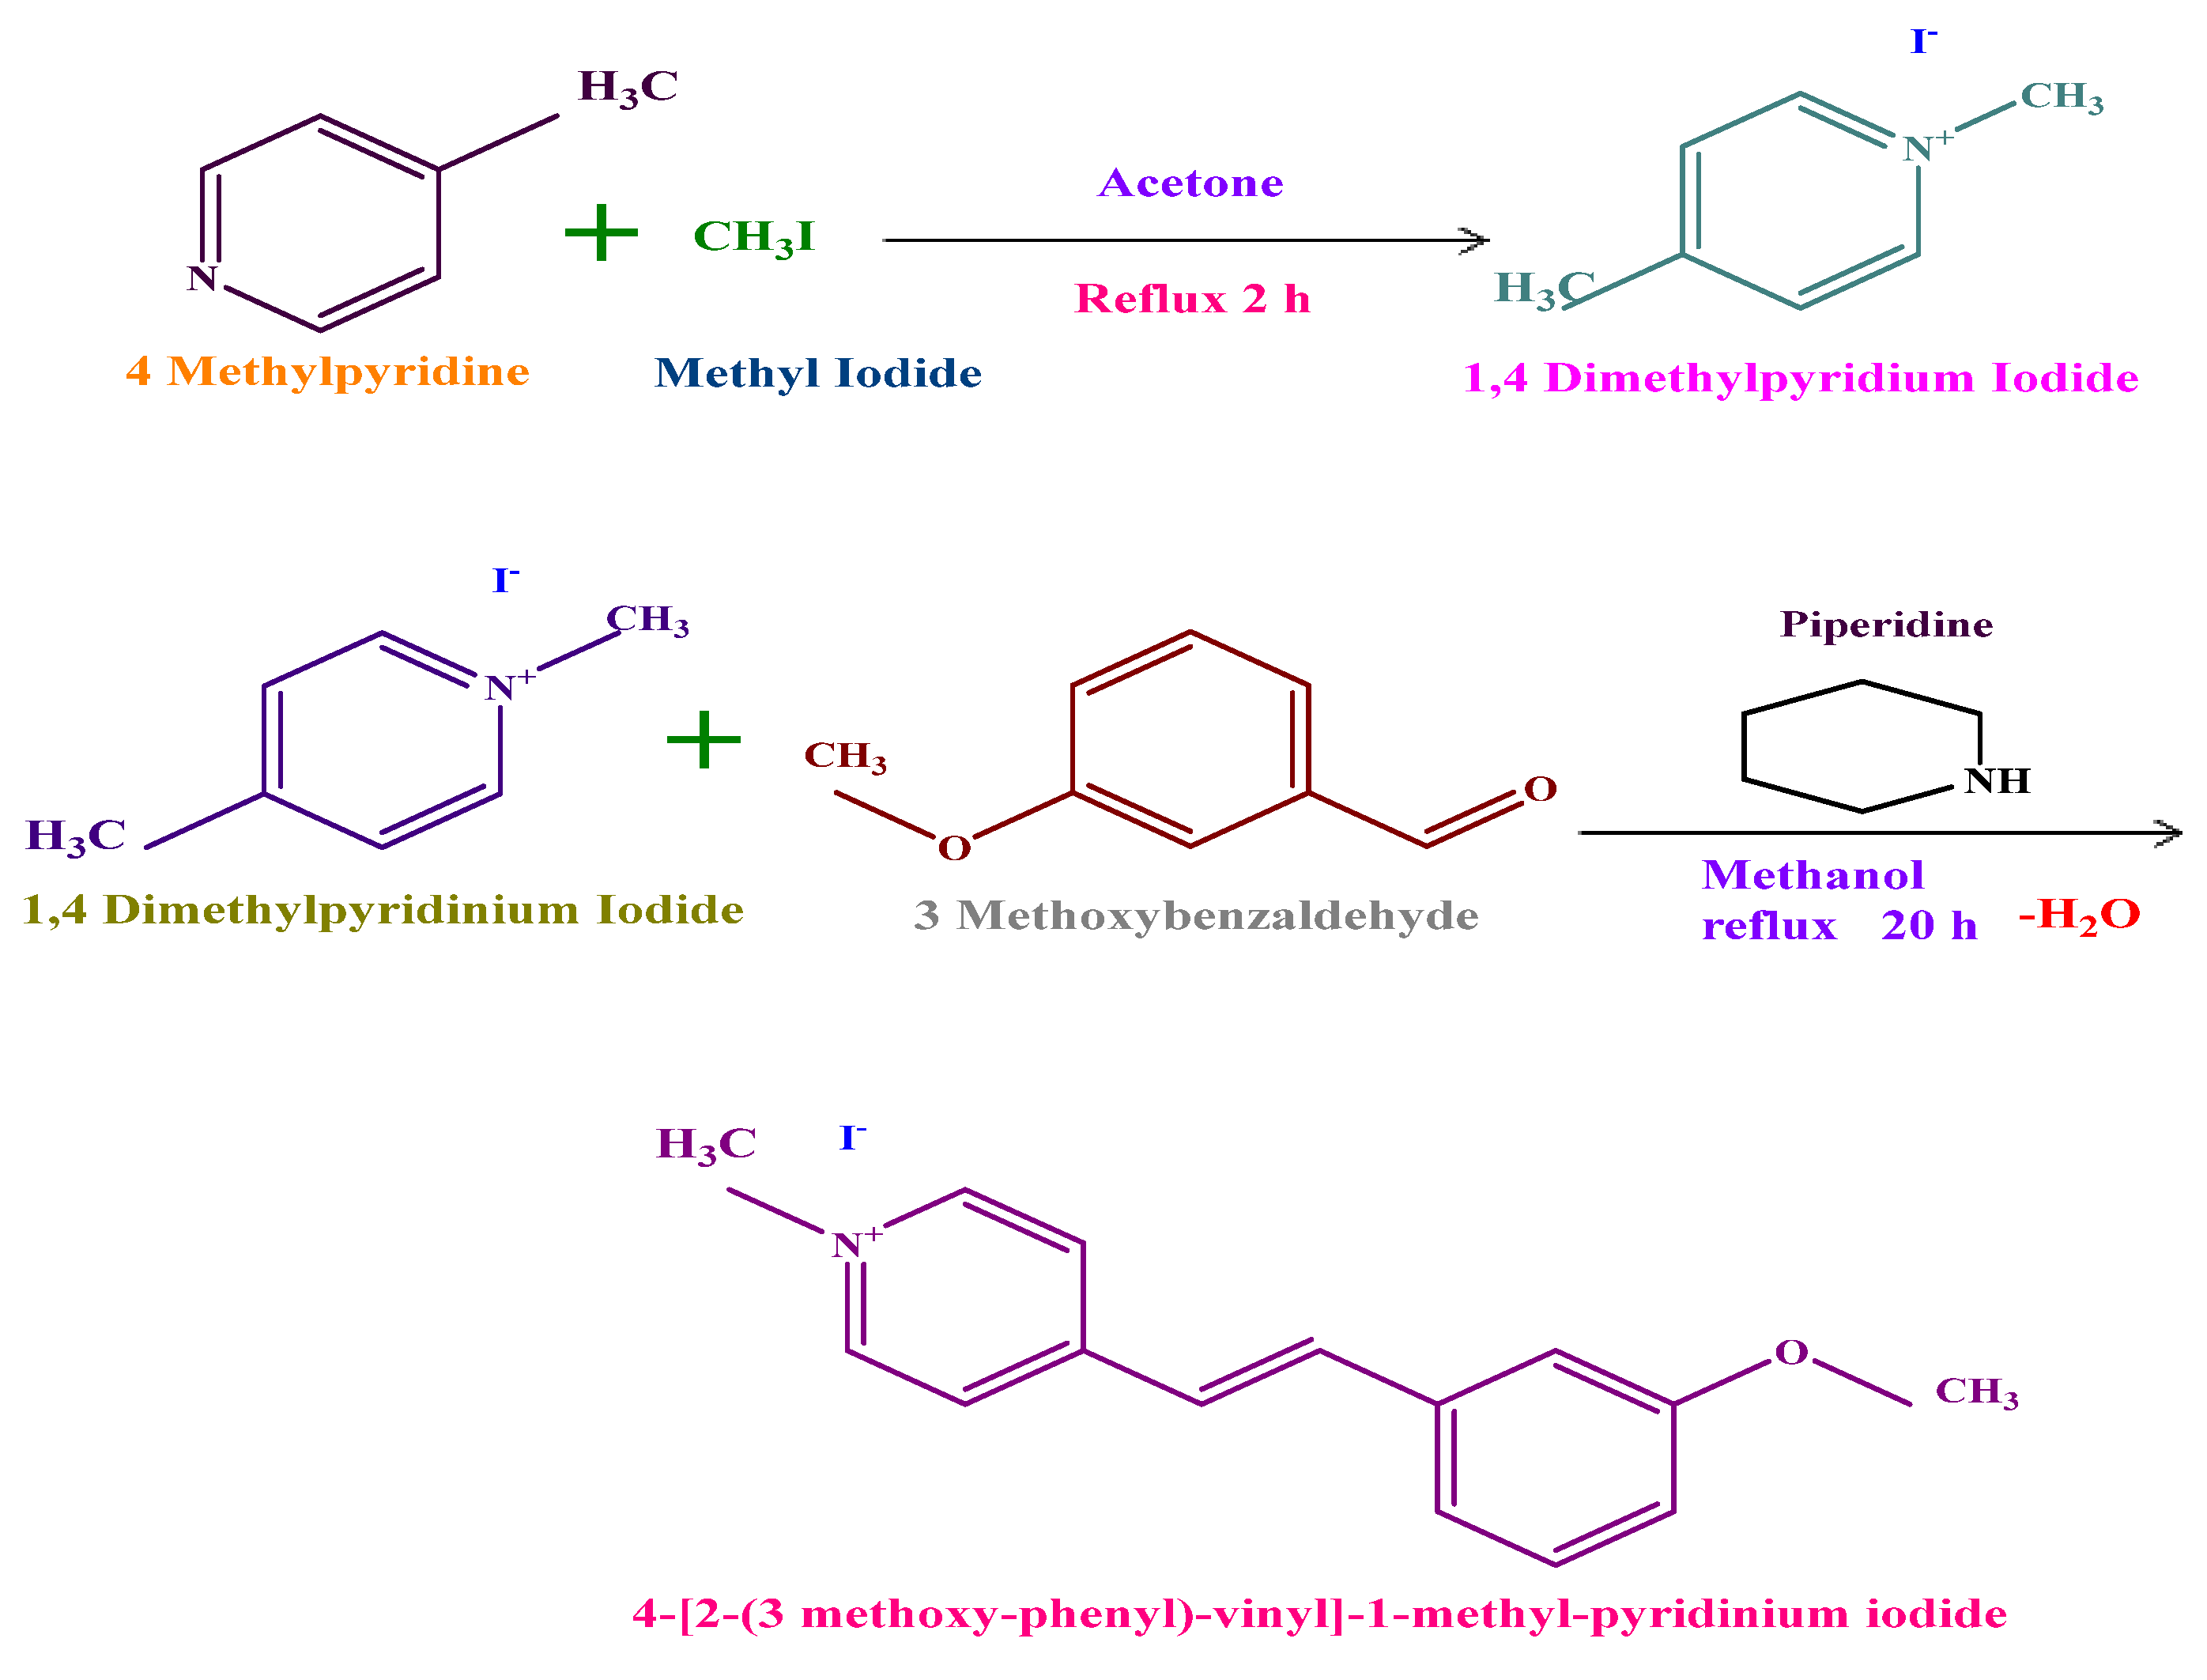
Material Synthesis, Solubility and Crystal Growth

The process of the title material synthesis involves two steps; Step I involved preparing 1,4-dimethylpyridinium+ iodide from purified materials 4 methylpyridine (purity 99%, 1.3 mL, 10 mmol) and iodomethane (purity 99%, 1.98 mL, 10 mmol) in acetone solvent (purity 99.9%, 30 mL). The mixture solution was placed in a 500 mL RBF (round bottom flask) connected with a condenser and refluxed for two hours at 45 °C; as a result, a pale-yellow precipitate was formed. The obtained 1,4 dimethylpyridium+ iodide material was dried with the help of a hot air oven.
In step II, the ionic title material is 4-[2-(3 methoxy-phenyl)-vinyl]-1-methyl-pyridinium+ iodide was synthesized from the equimolar ratio of 1,4 dimethyl pyridinium+ iodide (10 mmol, 2.35 g) and 3 methoxy benzaldehyde (purity 98%, 10 mmol, 1.36 g) taken in hot methanol (purity 99.9%, 30 mL) with piperidine catalysis is added (purity 99%, 0.98 mL, 10 mmol) to the mixture solution and the mixture solution is refluxed at 80 °C for 20 h. As an end product red precipitate is formed. The filtered precipitate was washed off with diethyl ether solvent to eliminate the unreacted starting materials. The final material has been successfully recrystallized multiple times using Methanol and Acetonitrile (1:1) solvent. The reaction scheme for MMPI synthesis is shown in Scheme 1.
To grow a good quality optical single crystal, details about the solubility are essential. To find the appropriate solvent for MMPI crystal, solubility analysis was carried out with different pure and mixed solvents, namely water, acetone, methanol, Acetonitrile, Dimethyl sulfoxide, Methanol-Acetonitrile, Methanol-Dimethyl sulfoxide. Among all the above-mentioned solvents, the title compound is highly soluble in Methanol-Acetonitrile (1:1). With this solvent mixture, the solubility investigation was done for the pure MMPI salt for five various temperatures (30 °C to 50 °C) with a 5 °C interval. The MMPI material was initially added to 100 mL of a combination of methanol and acetonitrile (1:1). Then the solution was kept inside in the ultra-cryostat bath, which has a control precision of (±0.01 °C) and stirred continuously with the help of motorized magnetic stirrer for 1 h at 30 °C. Supersaturation condition is achieved through this continuous stirrer. Then 3 mL solution was taken out and dried; from the dried powder, the solubility of the pure MMPI material was calculated through gravimetrical analysis. The exact manner was followed for other temperatures (30 °C, 35 °C, 40 °C, 45 °C and 50 °C). Figure 1 shows the solubility curve of MMPI powder. It exhibits a positive solubility temperature gradient [12,13,14]. Based on the solubility information, a saturation solution was prepared for the crystal growth process at 30 °C. After a continuous stirrer for 3 h, the mixture was filtered and transferred to the petri dish. After that, the petri dish was covered with aluminium foil, and a few holes were made in it to allow the solvent to evaporate. The MMPI single crystal was obtained in 30 days after the evaporation of the solvent. Good quality MMPI crystal was obtained, which is depicted in Figure 2.

3. Results & Discussion

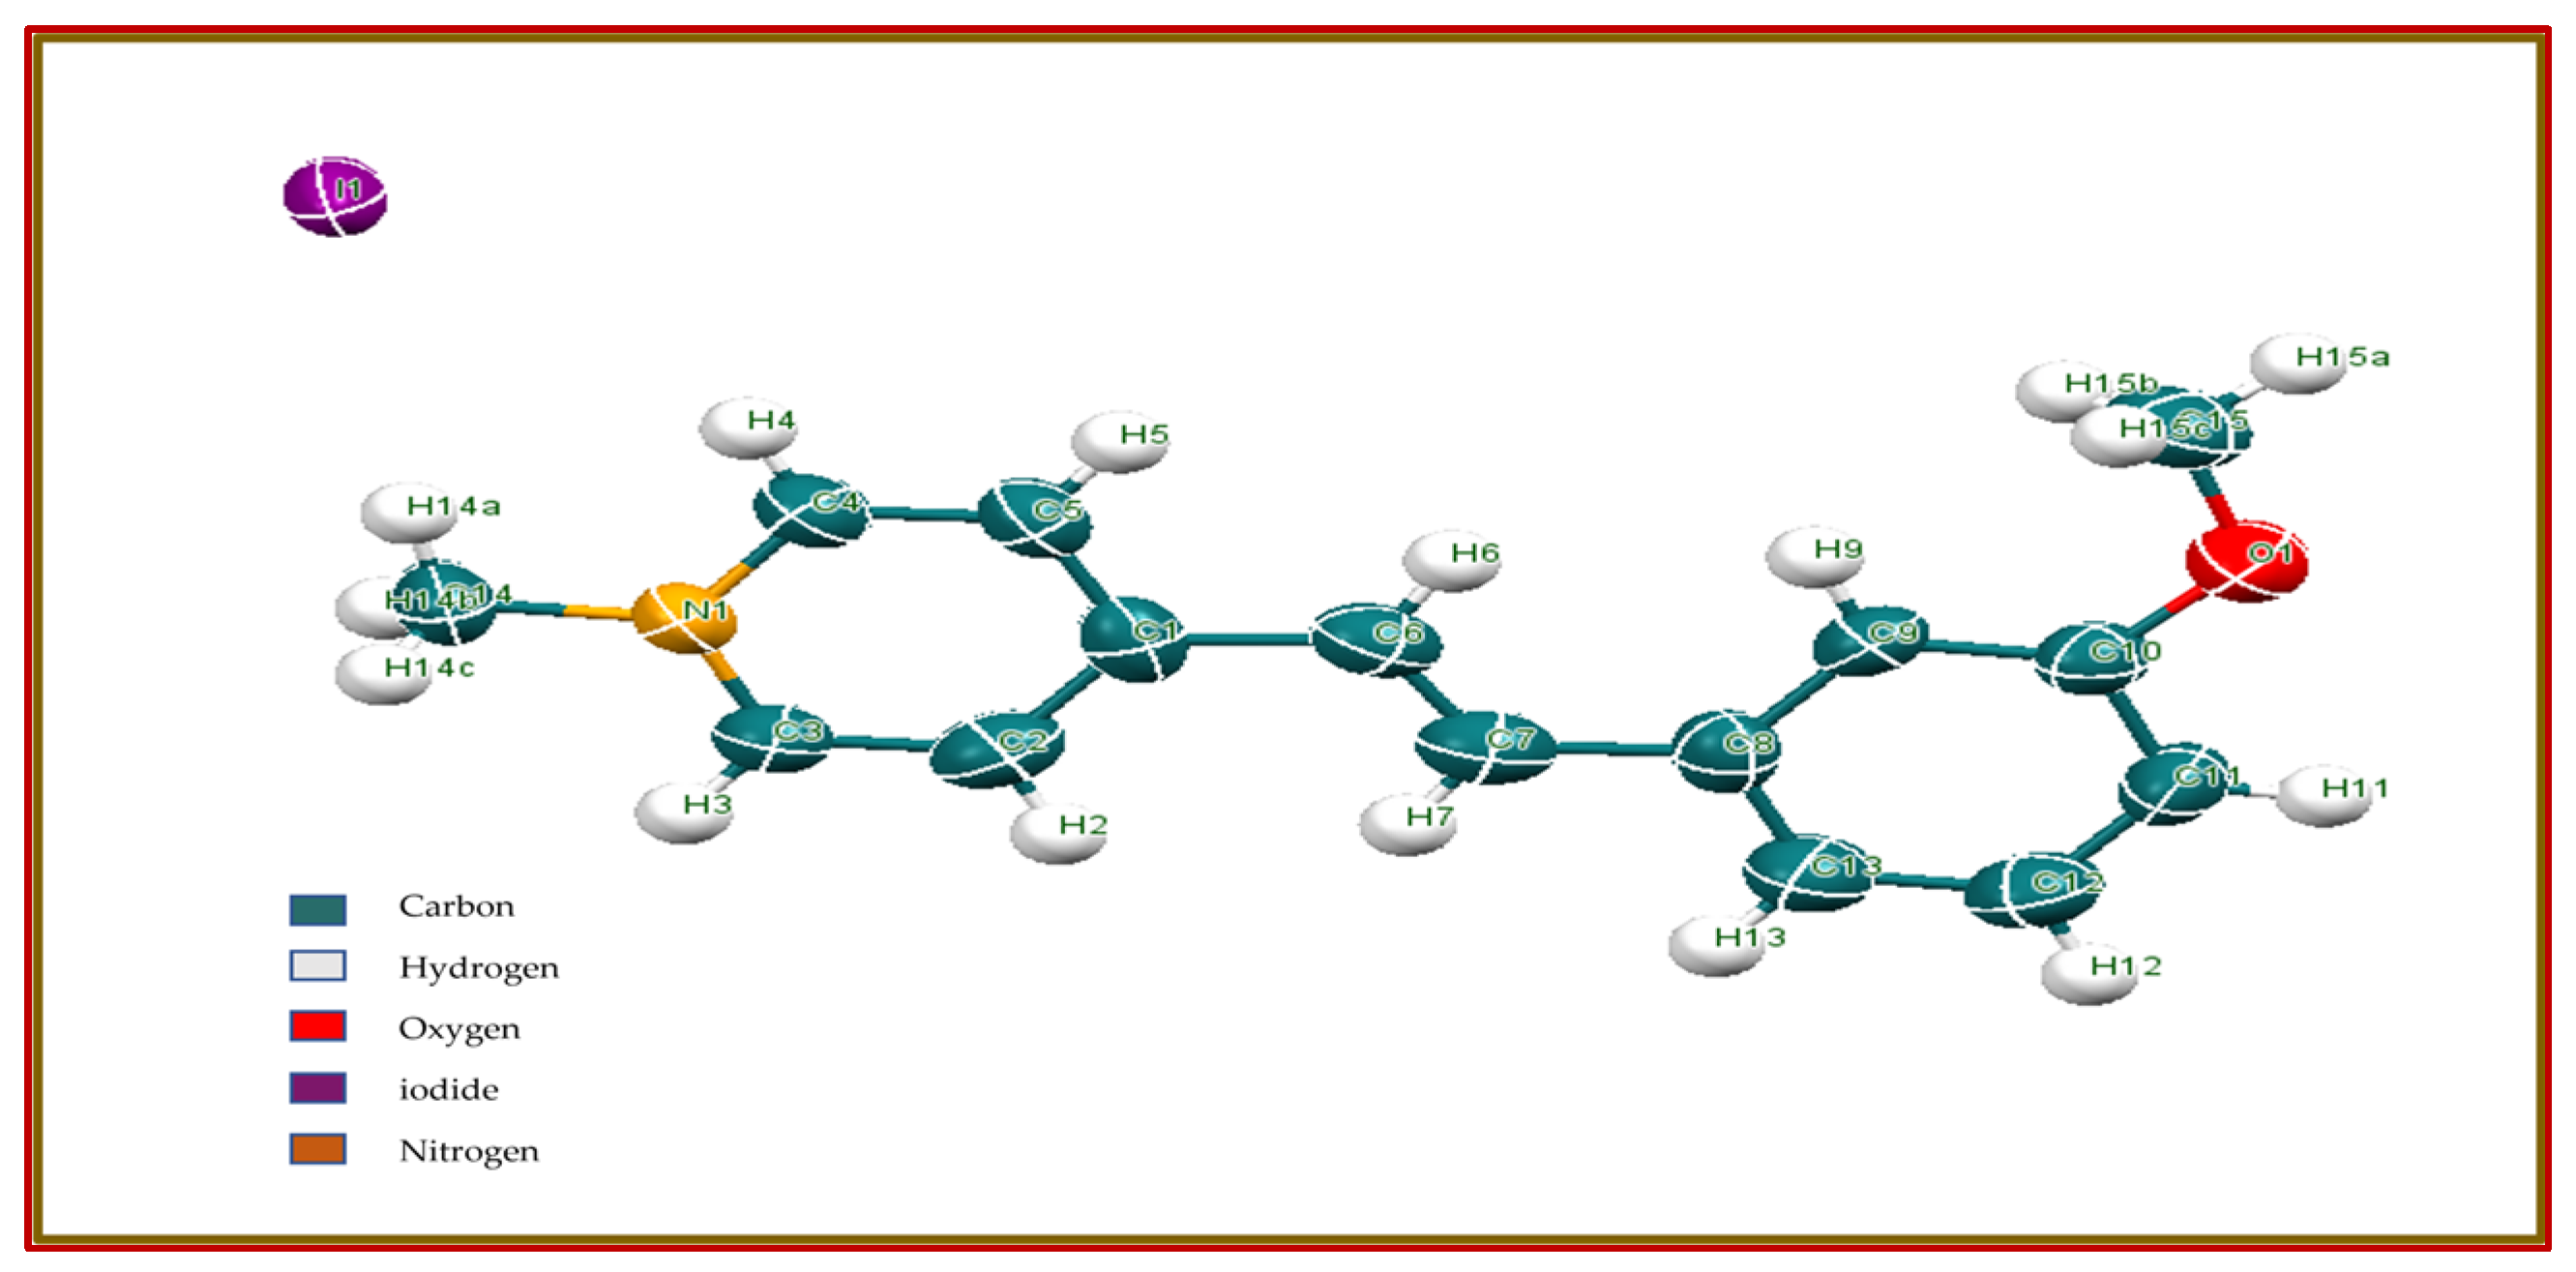
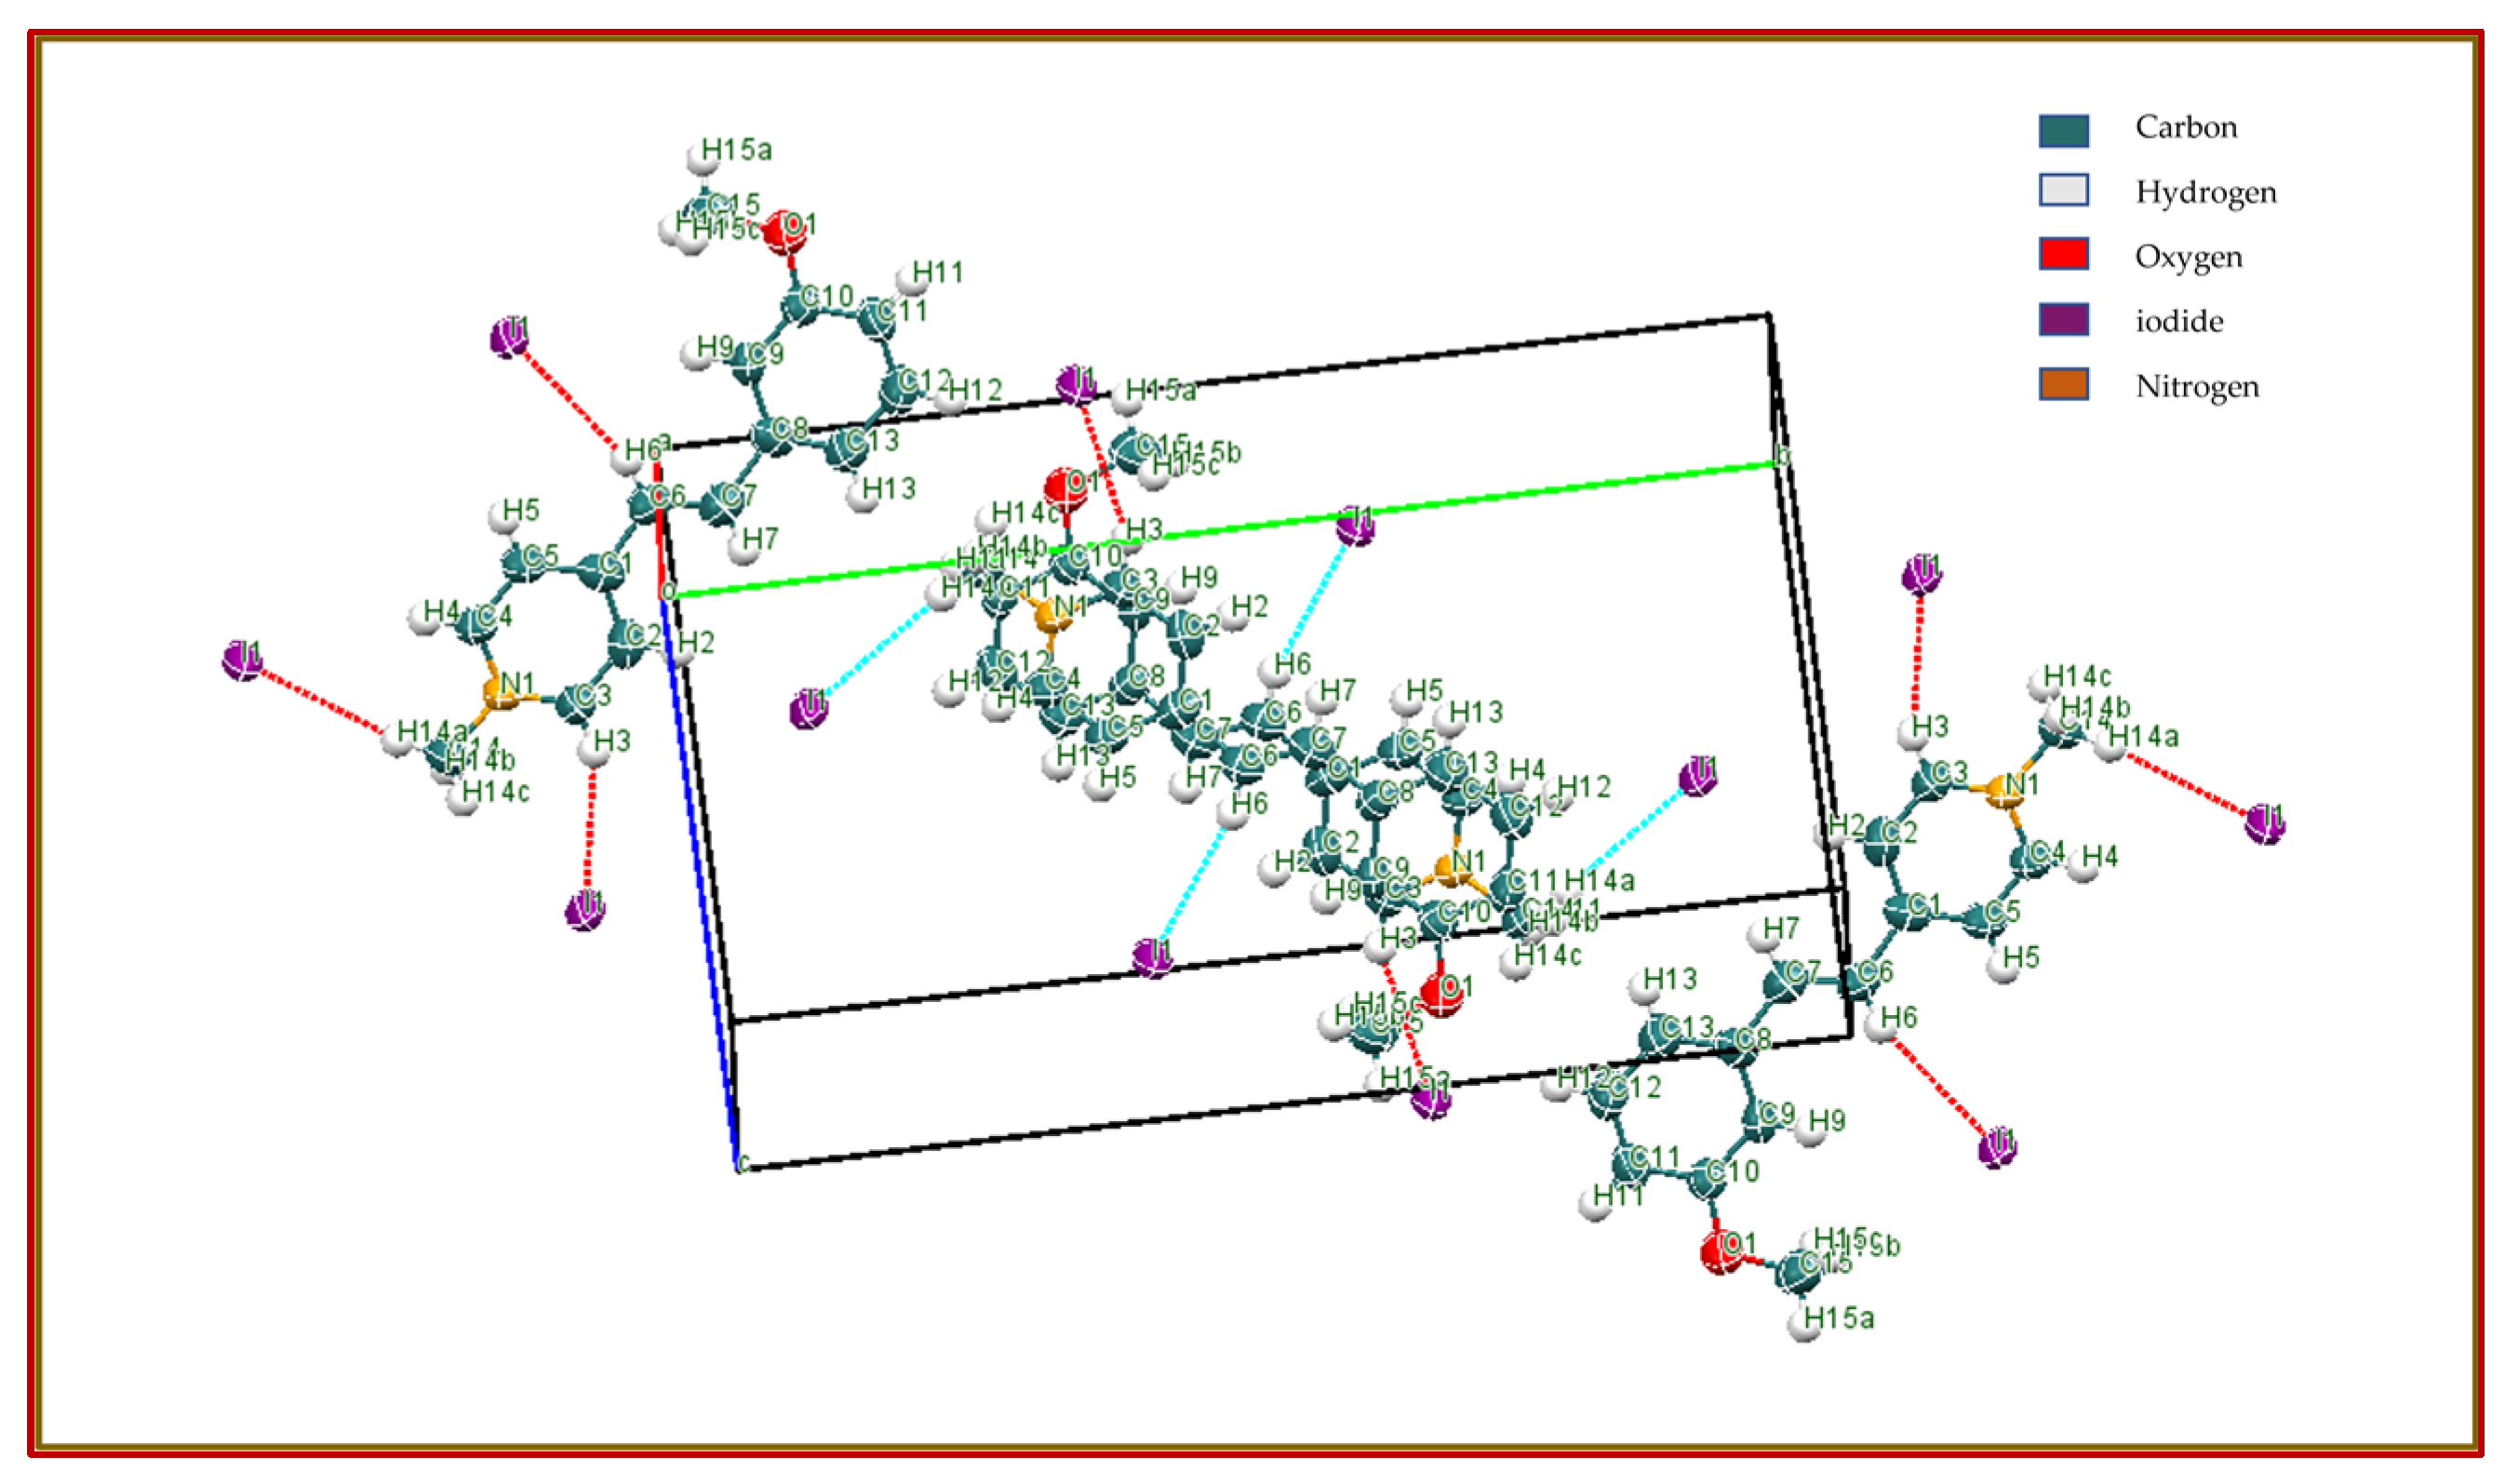
3.1. Single Crystal X-ray Diffraction Analysis

The structure of MMPI crystal was investigated via single crystal X-ray diffraction analysis by the BRUKER D8 QUEST. The title crystal of dimension (0.300 mm × 0.320 mm × 0.350 mm) was used for X-ray crystallographic study. Then the obtained MMPI crystallographic data were deposited in the Cambridge crystallographic data centre (CCDC), and the CCDC reference No is 2131739. The chromophores in the MMPI crystal structure appeared in a centrosymmetric fashion through the (P121/C1) space group, the calculated lattice constant values a = 6.8601(6) Å, b = 19.7111(16) Å, c = 10.8400(8) Å, α and γ = 90°, β = 91.207(3)°. The crystal volume of the title crystal is 1465.5(2) Å3 with Z = 4. Crystal structural data and refinement details are shown in Table 1. The ORTEP image of the MMPI crystal is revealed in Figure 3. The title ionic crystal consists of the cation part of 4-[2-(3 methoxy-phenyl)-vinyl]-1-methyl-pyridinium] [C15H16NO+] and the anion part of iodide [I]. In the crystal structure, the cation exists in the Trans E configuration of double bond C7=C6, (C=C) with a length 1.295(9) Å of the central vinyl group, which is confirmed by torsion angle C8, C7, C6, C1=179.9(5). The methoxy groups C15 and O1 on the benzene ring are essentially coplanar with torsion angle C15-O1-C10-C11 = 178.4(6) and C15-O1-C10-C9 = −1.9(9). The selected bond lengths and angles are shown in Table 2, and the torsion angle is shown in Table 3. Figure 4 displays the packing diagram of the MMPI crystal. The cation is connected to the iodide(I) anion via stabilised C-H…I interactions.

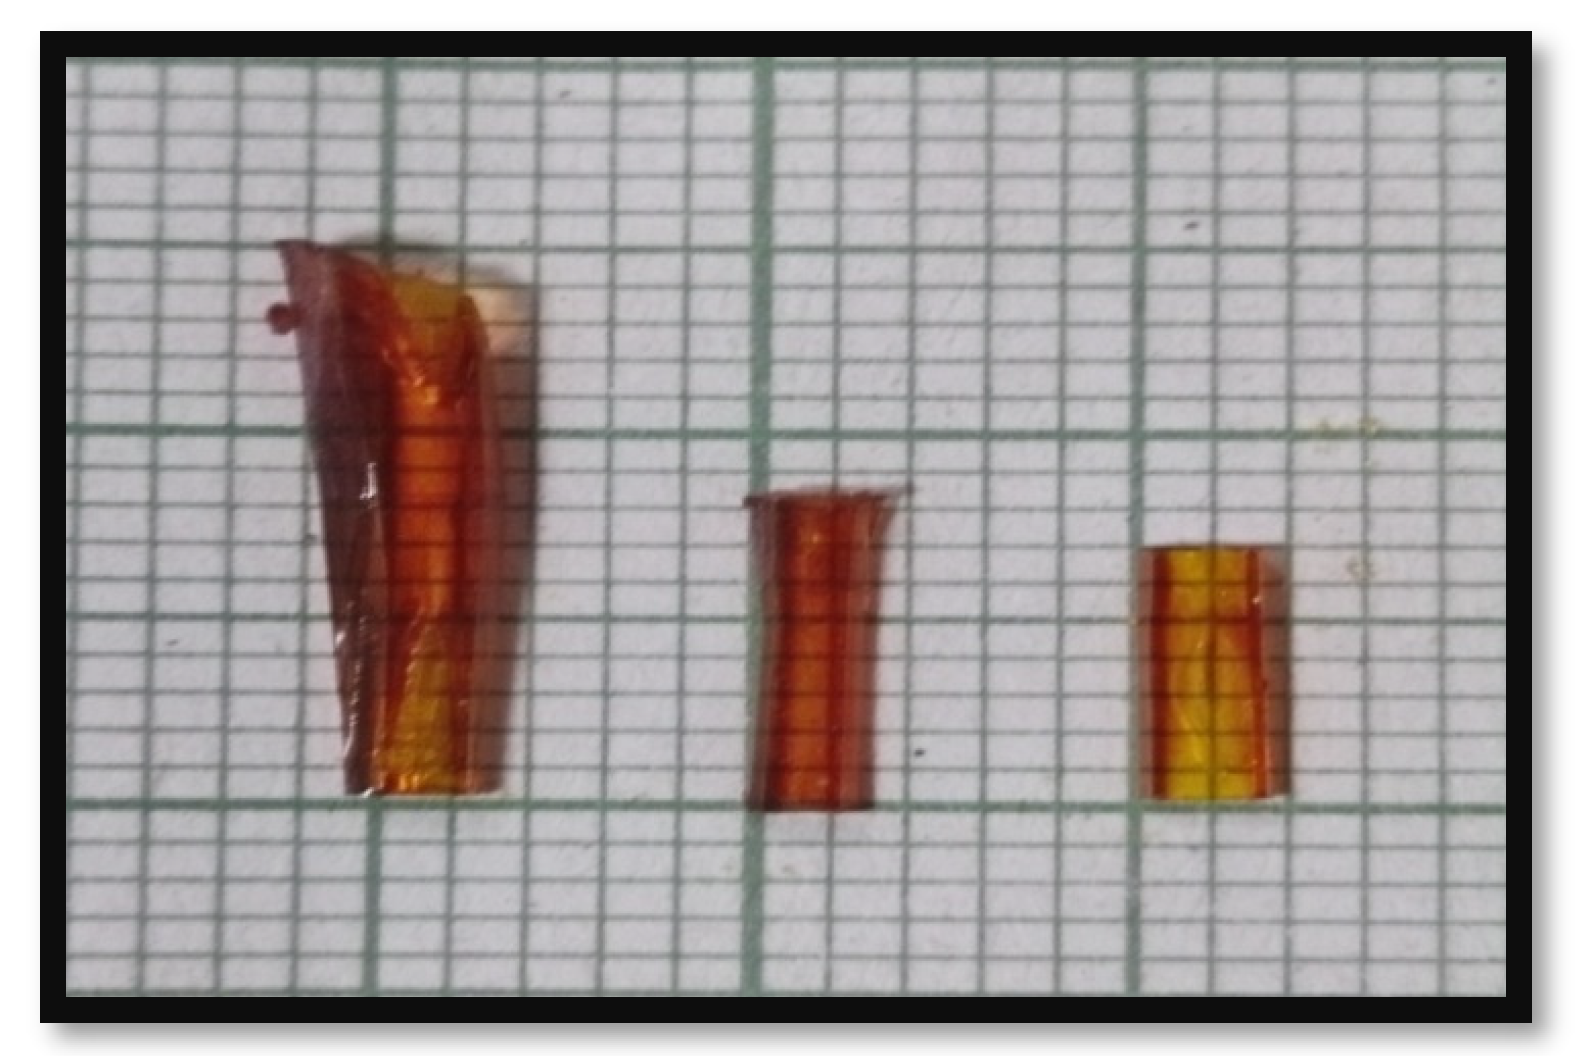
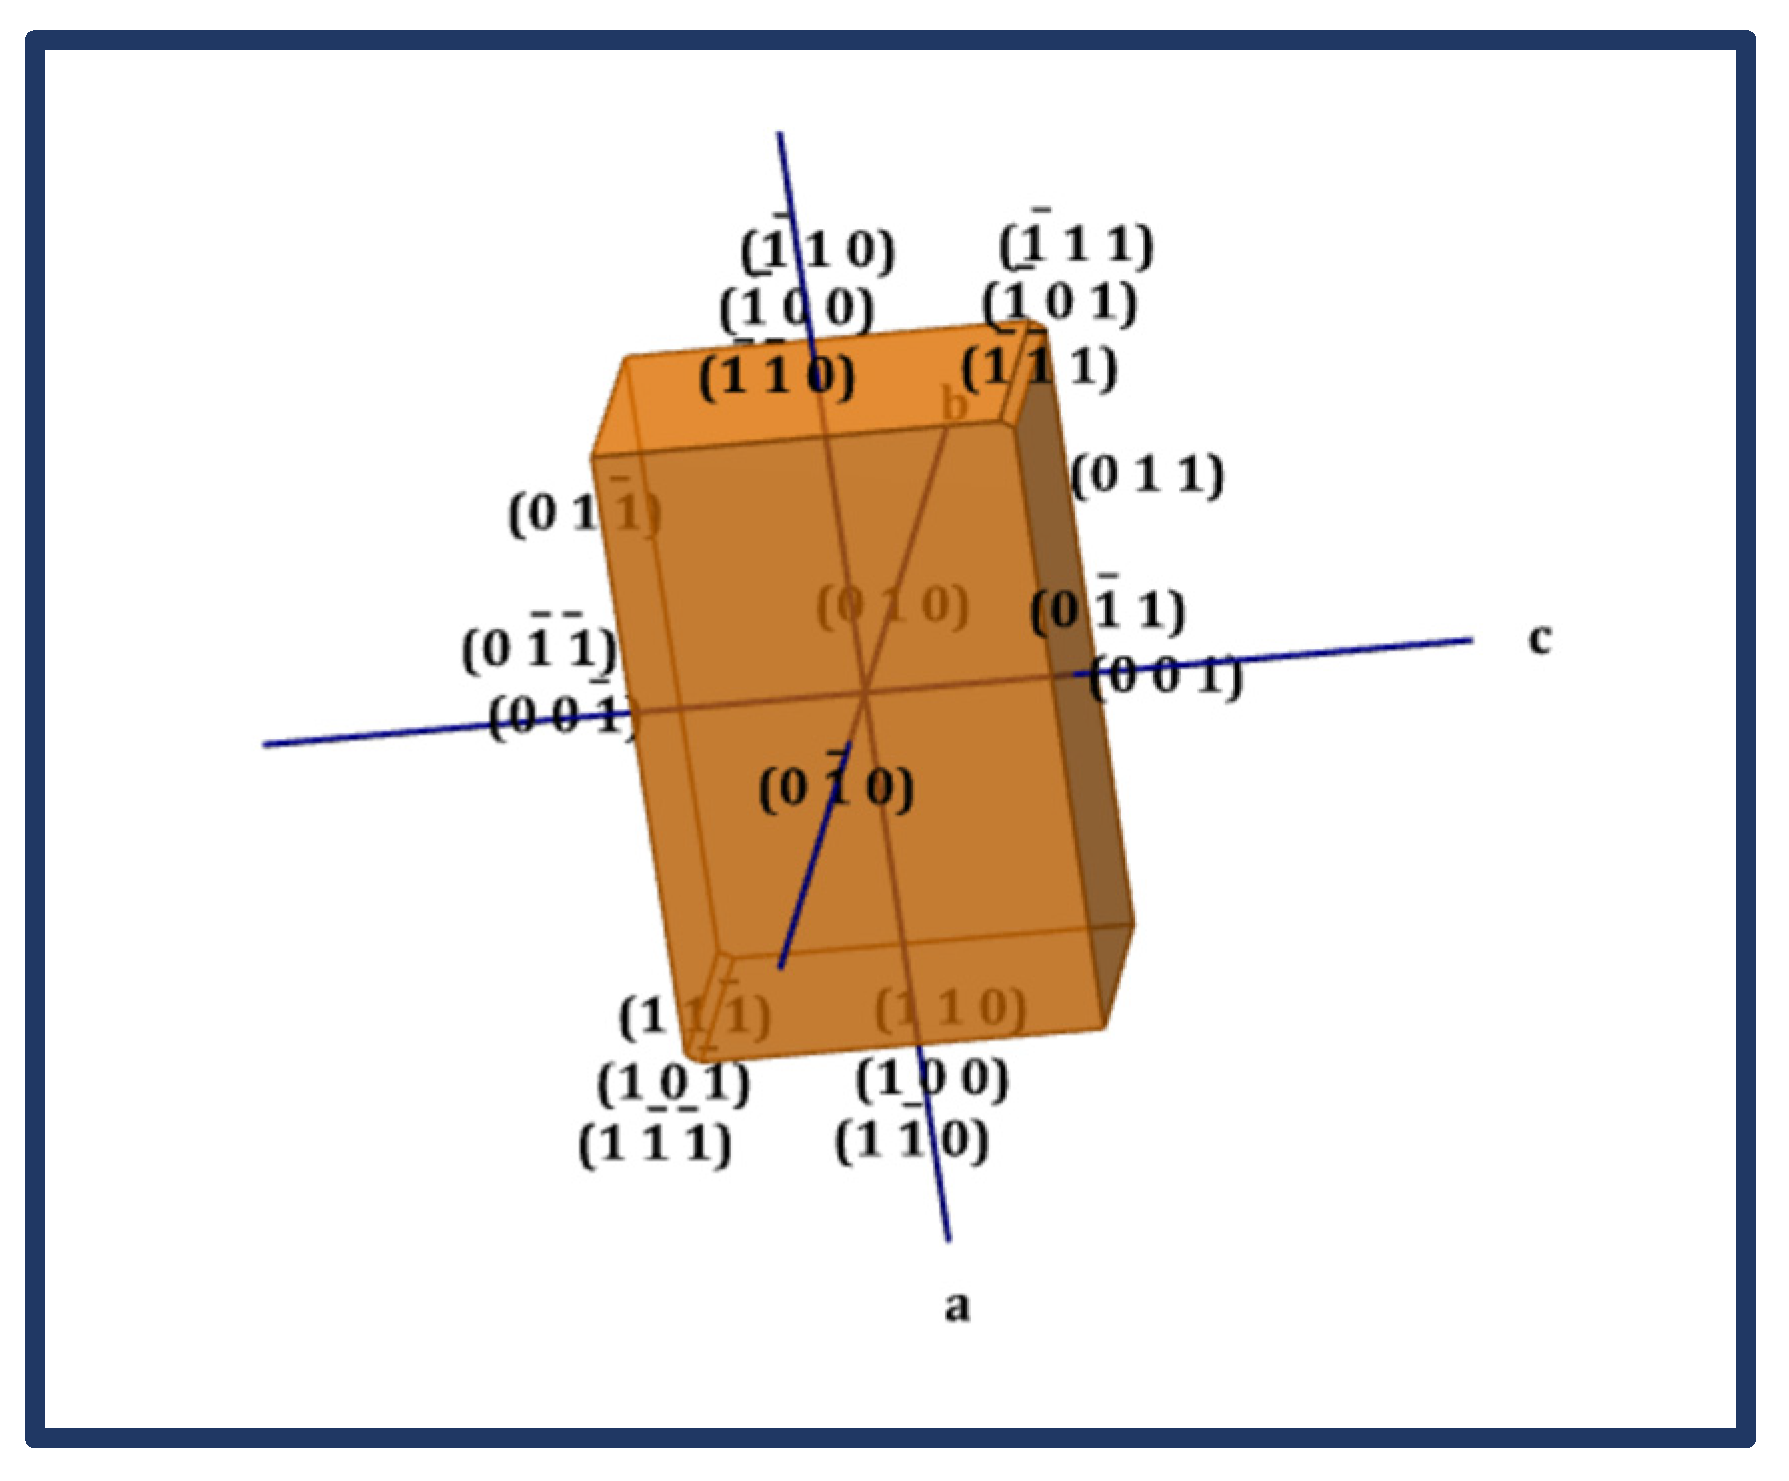
3.2. Morphology Studies

The grown MMPI crystal’s Morphology is shown in Figure 5. The morphology diagram of the MMPI is generated and indexed by using WinXmorph software [16,17]. The input file is the CIF file collected from the single crystal XRD analysis. There are twenty crystal faces: (0 0 1), (0 0 −1), (0 −1 0), (0 1 0), (1 1 0), (1 −1 0), (1 1 −1), (1 −1 −1), (−1 0 1), (1 0 −1), (−1 1 1), (−1 −1 1), (1 0 0), (−1 0 0), (1 0 −1), (0 1 1), (0 −1 1), (0 −1 −1), (−1 0 −1) and (−1 −1 0). The crystallographic a-axis exhibits a higher growth rate for MMPI crystal compared to b, c direction.

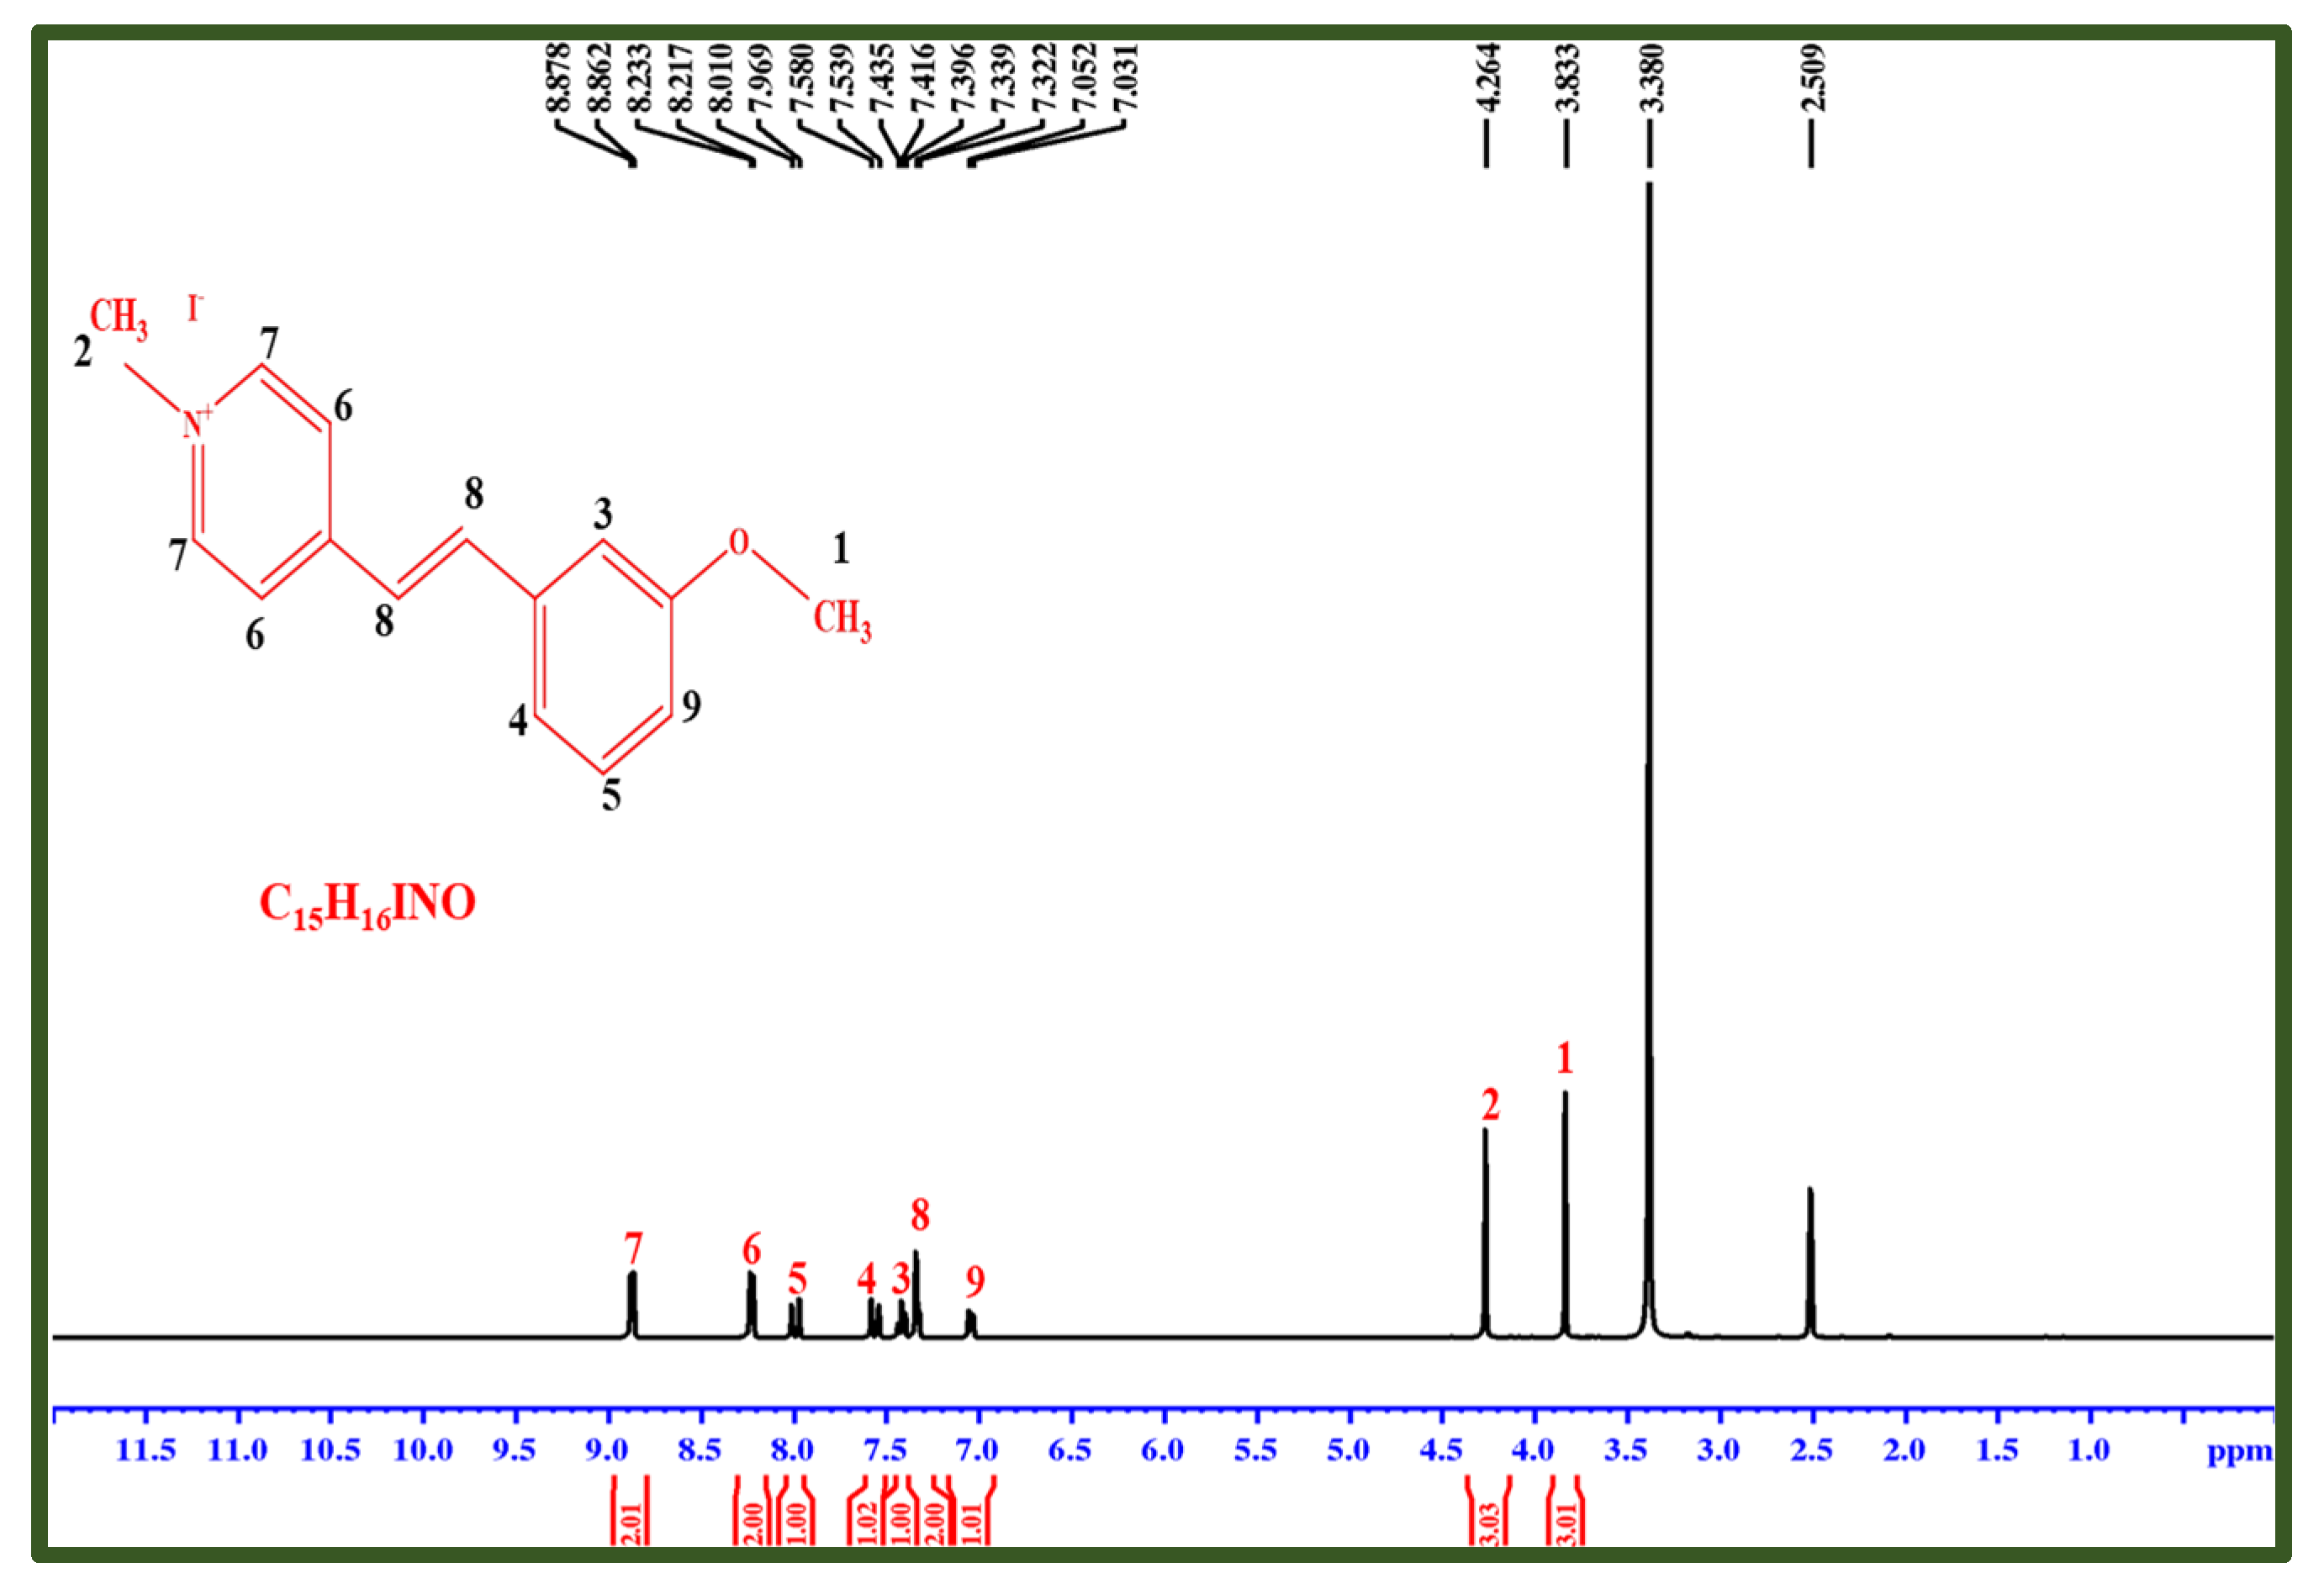
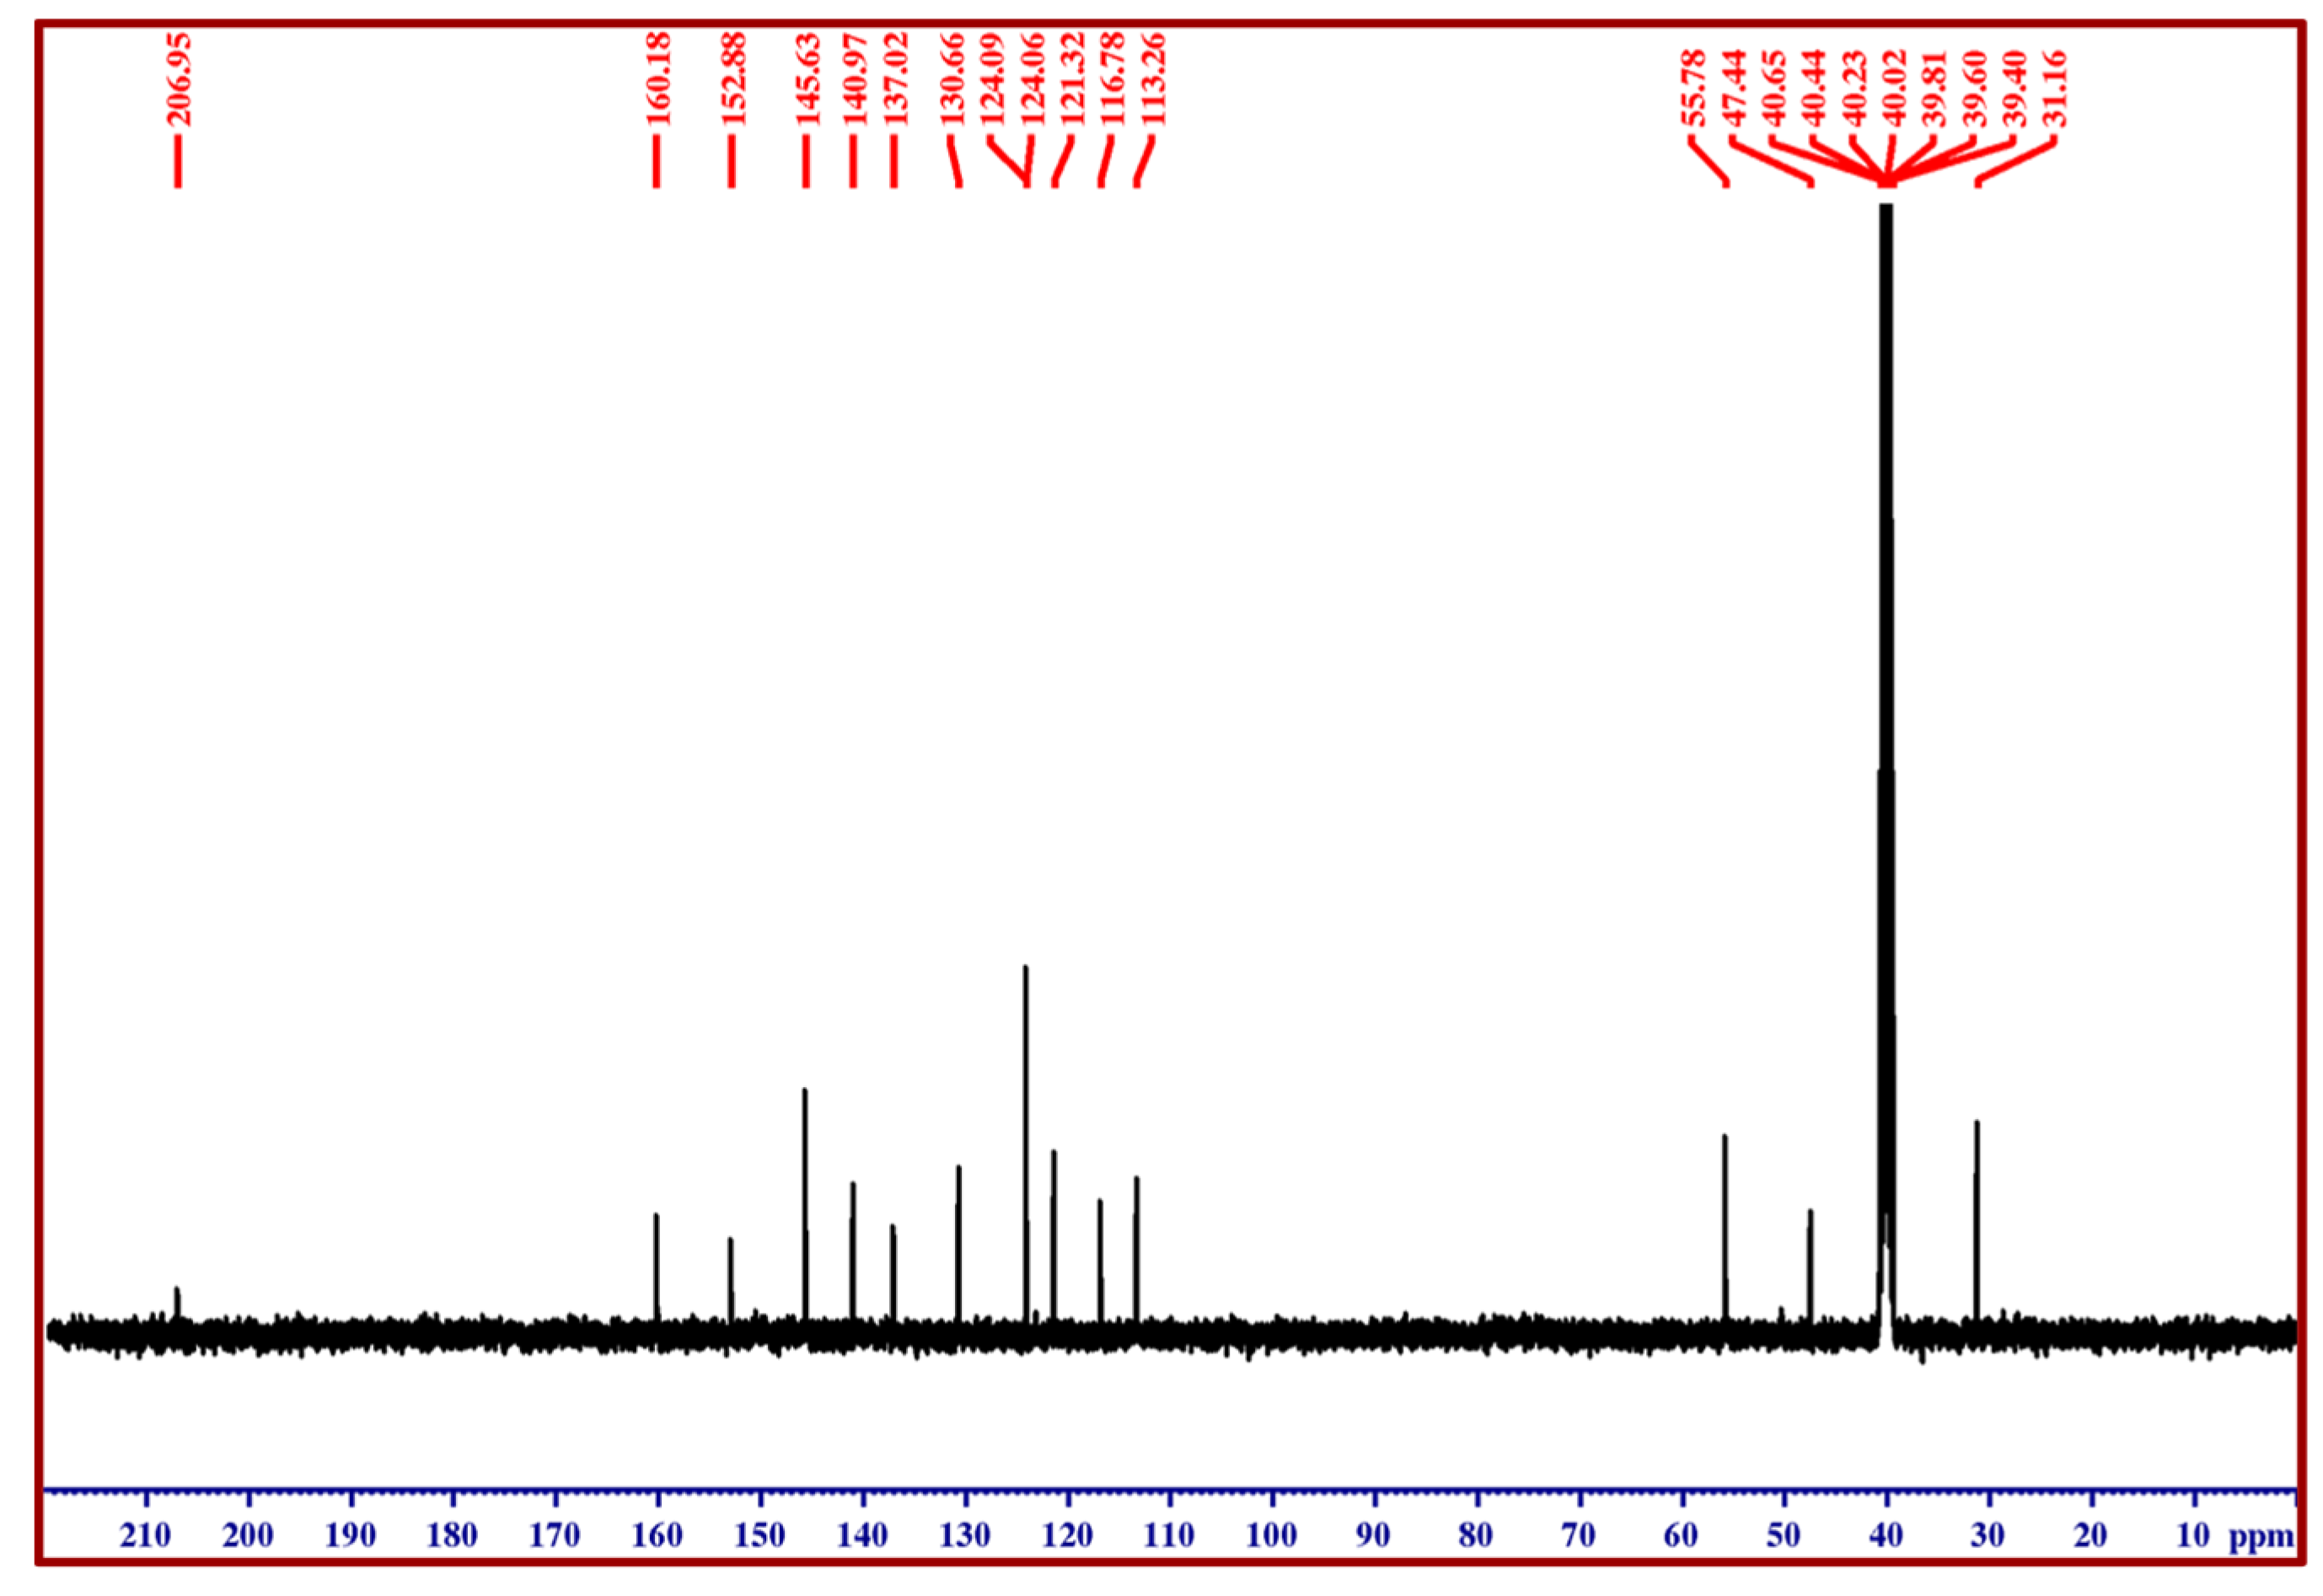
3.3. 1H NMR and 13C NMR Studies

The NMR spectrum investigation is one of the fundamental analytical techniques for investigating and evaluating organic compounds. Both the 1H and 13C NMR was carried out through a BRUKER instrument operating with a frequency of 400 MHz. The obtained proton NMR spectra of MMPI crystal are portrayed in Figure 6. The single peak observed around 2.5 represents the DMSO-d6 solvent, and the singlet emerged at 3.380 ppm, indicating the water in DMSO-d6. The chemical signal of the methoxy group (O-CH3) in the aromatic ring exhibits a singlet at 3.833(1), and the pyridine ring methyl group shows its characteristic peak at 4.264 (N-CH3) (2). The chemical shifts at 7.031 and 7.052(9) indicate the one hydrogen atom in the aromatic ring. In the olefin structure (HC=CH) [18], the two hydrogen atoms are represented by the doublet chemical shift that was observed at 7.322 and 7.339(4). The triplet chemical signal observed at 7.396, 7.416 and 7.435(3) ppm are due to the one hydrogen atom of the methoxy group. Doublet chemical shifts are found to be 7.539, and 7.580(5) represents the one hydrogen atom in the aromatic ring. The single proton of the methoxy group is represented by the doublet chemical shift seen at 7.969 and 8.010(6). Doublet peaks found at 8.217, 8.233, 8.862 and 8.878(7) signifies to the four hydrogen atoms presented in the pyridine ring (C5H4N). The proton NMR spectral analysis ascertains that the MMPI crystal is formed.
The carbon NMR spectrum was recorded from 0 to 220 ppm (shown in Figure 7). The peaks at 31.16 and 47.44 ppm represent the methyl group carbon atoms [19]. The peaks at 124.06, 145.63 and 152.88 ppm were assigned to the pyridine ring carbon atoms. The nine peaks observed at 55.78, 113.26, 116.78, 121.32, 130.66, 137.02, 140.97, 160.18, and 206.95 ppm stands for the vinyl group and aromatic ring carbon atoms. All the proton and carbon chemical shifts are listed in Table 4. All the observed chemical shifts confirmed the formation of the title crystal.

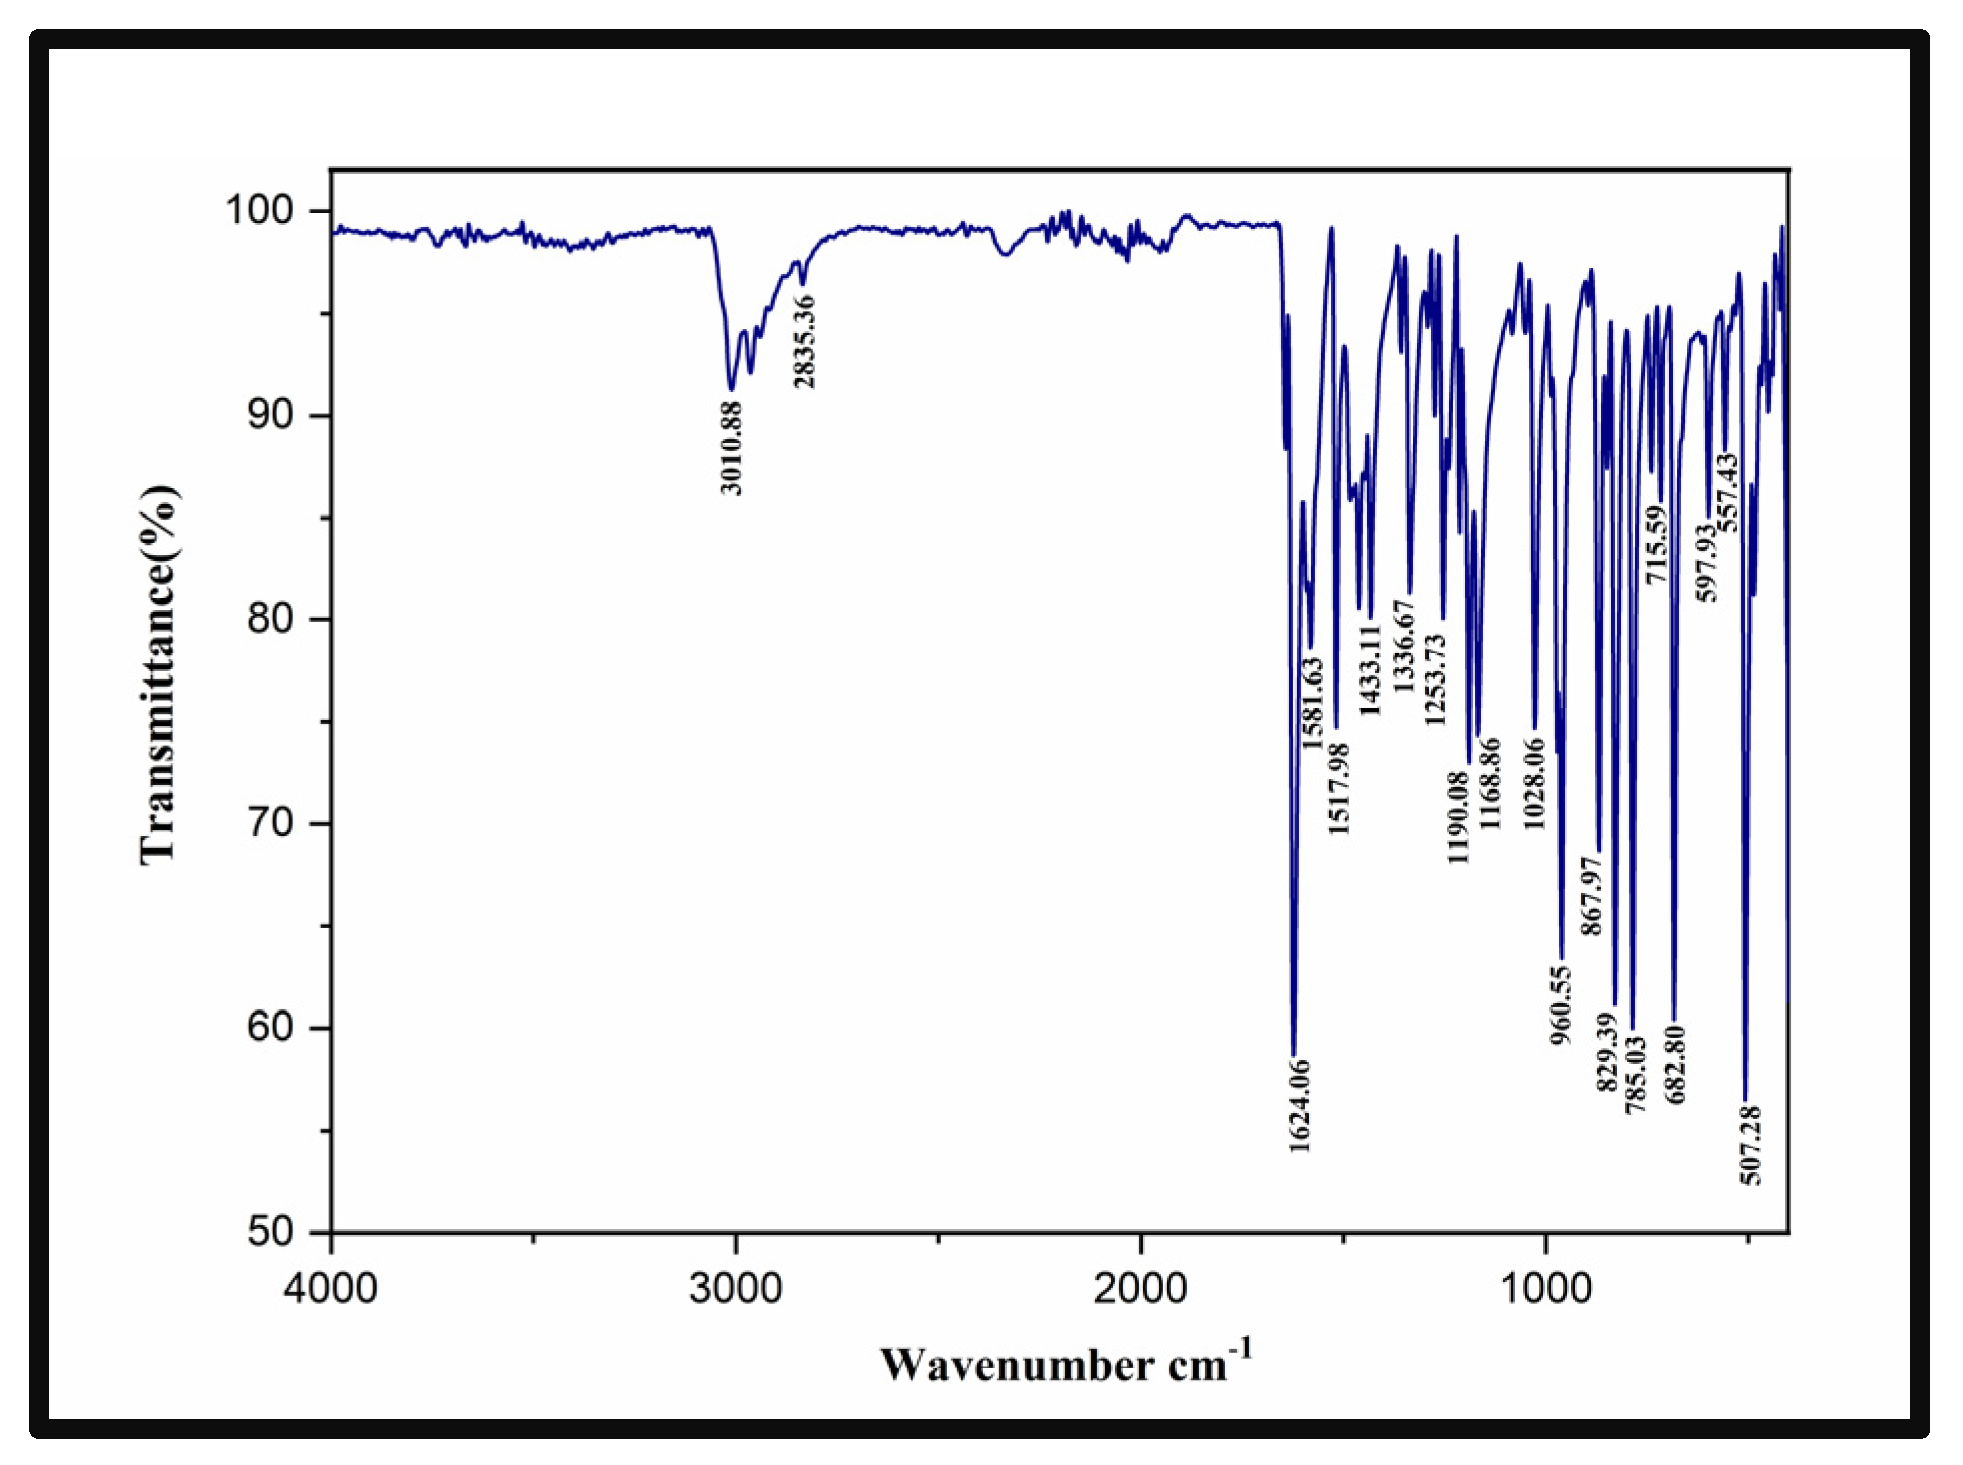
3.4. Fourier Transform Infrared Spectroscopy Study

The FTIR spectra of MMPI crystal were recorded in the wavenumber region of 4000 to 400 cm−1, which is depicted in Figure 8. The peak at 3010.88 cm−1 is attributed to the aromatic C–H stretching [20]. The alkyl C–H stretching shows its characteristic peak at 2835.36 cm−1. The signal that appeared at 1624.06 cm−1 shows the CH=CH stretch in the MMPI compound [21]. The stilbazolium chromophore (C–C=C–C) in-plane stretching vibration exhibits peaks at 1581.63 and 1517.98 cm−1. The observed bands at 1432 cm−1 represent the CH3 bending [22]. The absorption peak at 1336.67 cm−1 corresponds to the C–N stretching mode. The O–CH3 stretching vibrations raised by the methoxy group emit their characteristic peak at 1028.06 cm−1. The peak at 960.55 cm−1 is assigned to the C–H stretching vibrations of the pyridinium ring. The vibration of the 1, 4 distributed aromatic ring C-H is recorded at 829.39 cm−1. The pyridine ring and aromatic ring of the out-of-plane bending vibration was typically shown in the IR spectra between 1000 and 675 cm−1 [23]. The peaks observed at 785.03 cm−1 and 715.59 cm−1 are assigned to the C–H out-of-plane bending vibrations. The phenyl ring of the C–C–C mode corresponds to the peaks at 597.93, 557.43, and 507.28 cm−1. The FT-IR assignments are provided in Table 5. The multiple vibrational bands present in the MMPI were analyzed, and the interpretation confirms that the crystal structure has been formed.

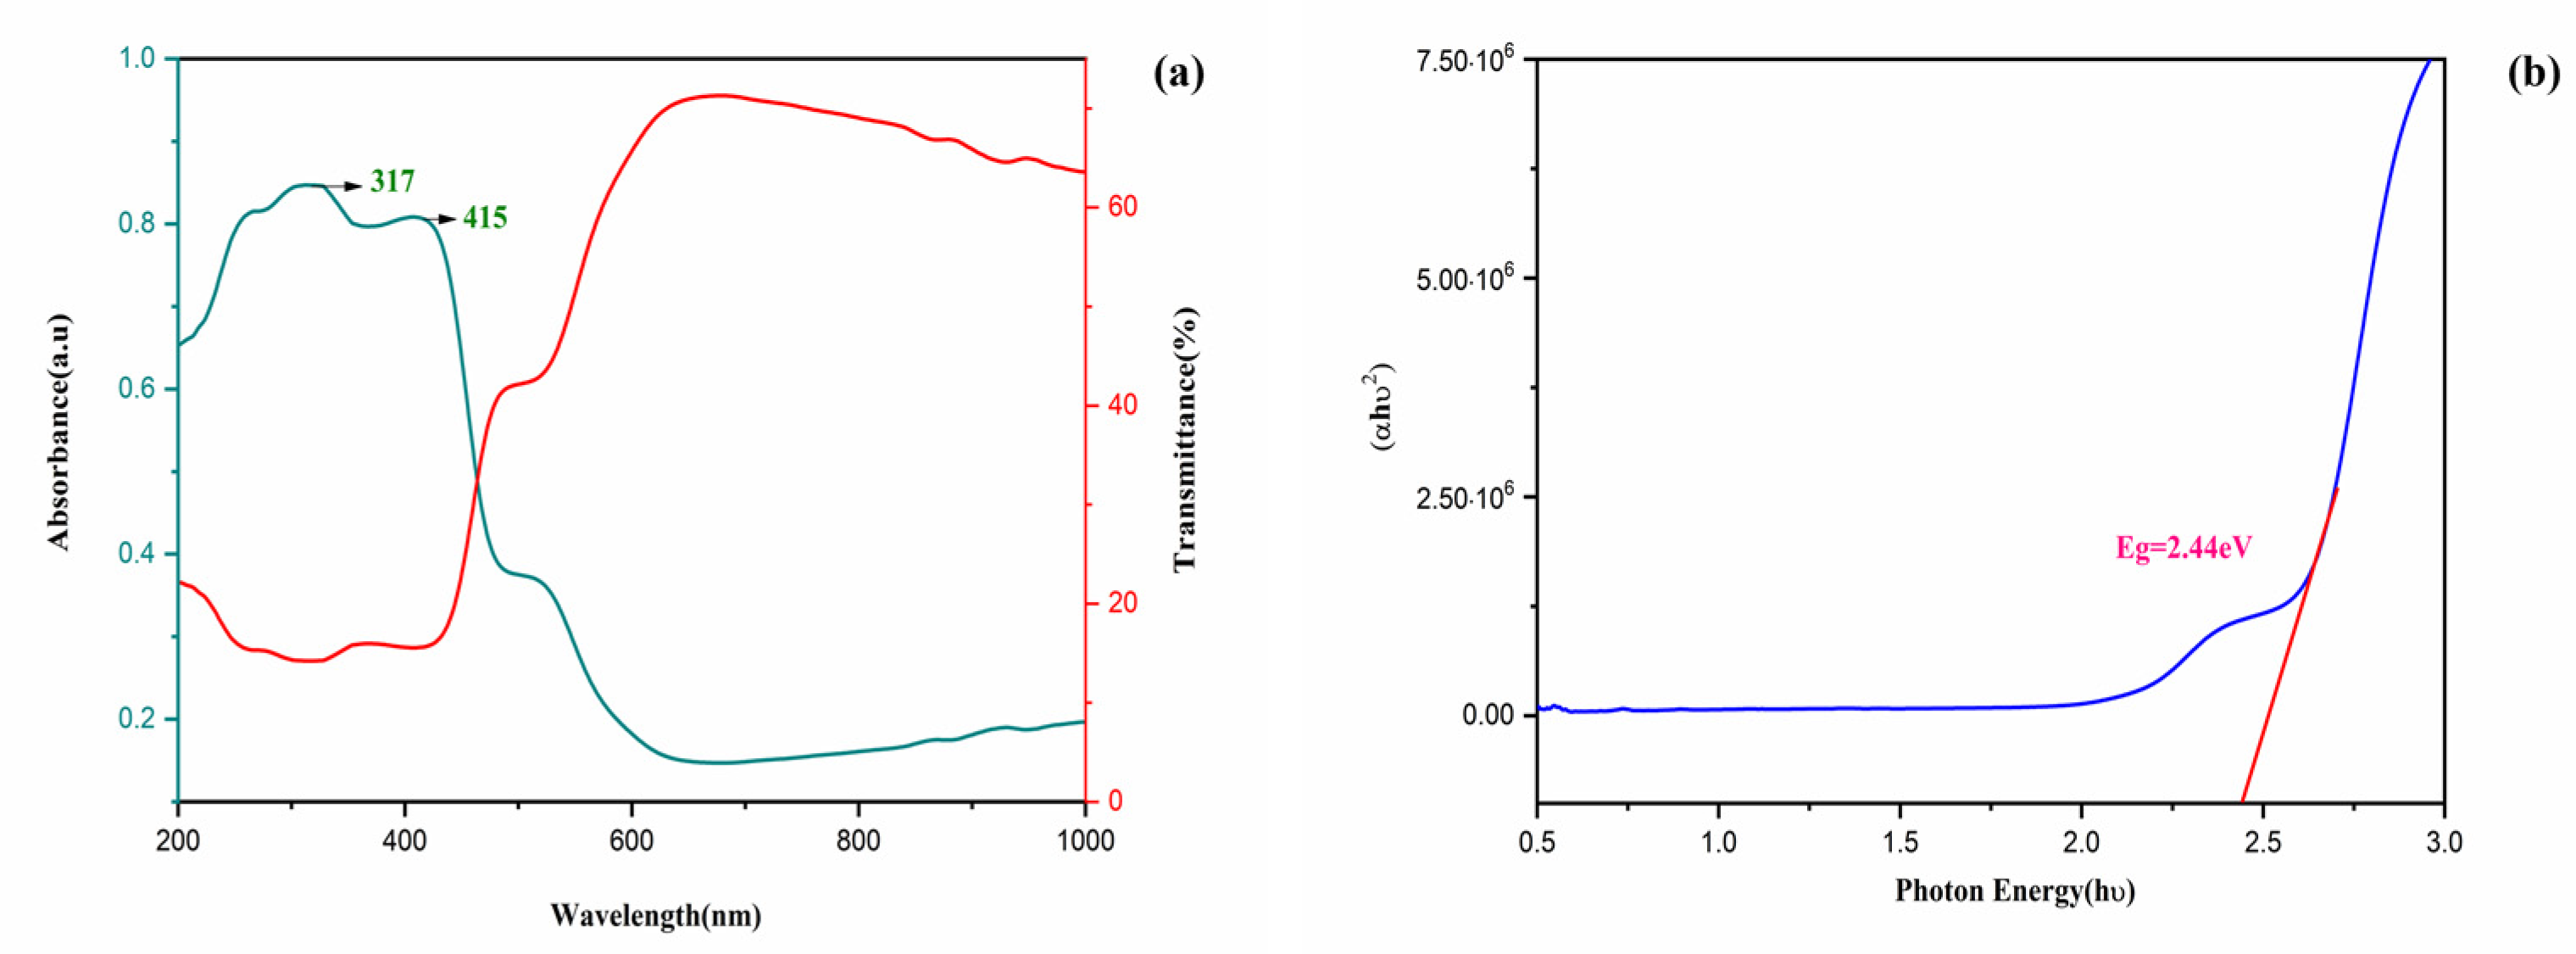
3.5. Linear Absorption Analysis

The optical absorption or transmittance window and cutoff wavelength are crucial factors that influence optoelectronic transitions. A significant structure usually produced by the UV-Vis study is that the transition of the electrons from the π(bonding) and π* (antibonding) orbitals between the ground state to excited energy states is induced by the absorption of UV and visible light [24,25]. The absorbance and transmittance nature were studied through the UV-Vis-NIR spectroscopy technique. The obtained UV-Vis-NIR spectra are depicted in Figure 9a. In the absorption spectrum, two peaks were observed. The n-π* electronic transition allows an absorption peak to appear at 317 nm; another absorption peak observed at 415 nm is due to π-π* electronic transition, which arises from the stilbazolium chromophore in the molecule [26]. From Figure 9a, the grown MMPI crystal exhibits the maximum transmittance throughout the Vis and NIR regions, with around 70% transmittance rate. The transparency windows are One of the greatest strength characteristics of the materials indicated for the NLO applications [24].
This demonstrates that the MMPI crystal’s optical transition is provided with a direct band gap naturally. Tauc’s plot relation estimates an Eg value of 2.43 eV to allow for direct transition. Extrapolation of the plot ((αhυ)2 vs photon energy(hυ)) is represented in Figure 9b.

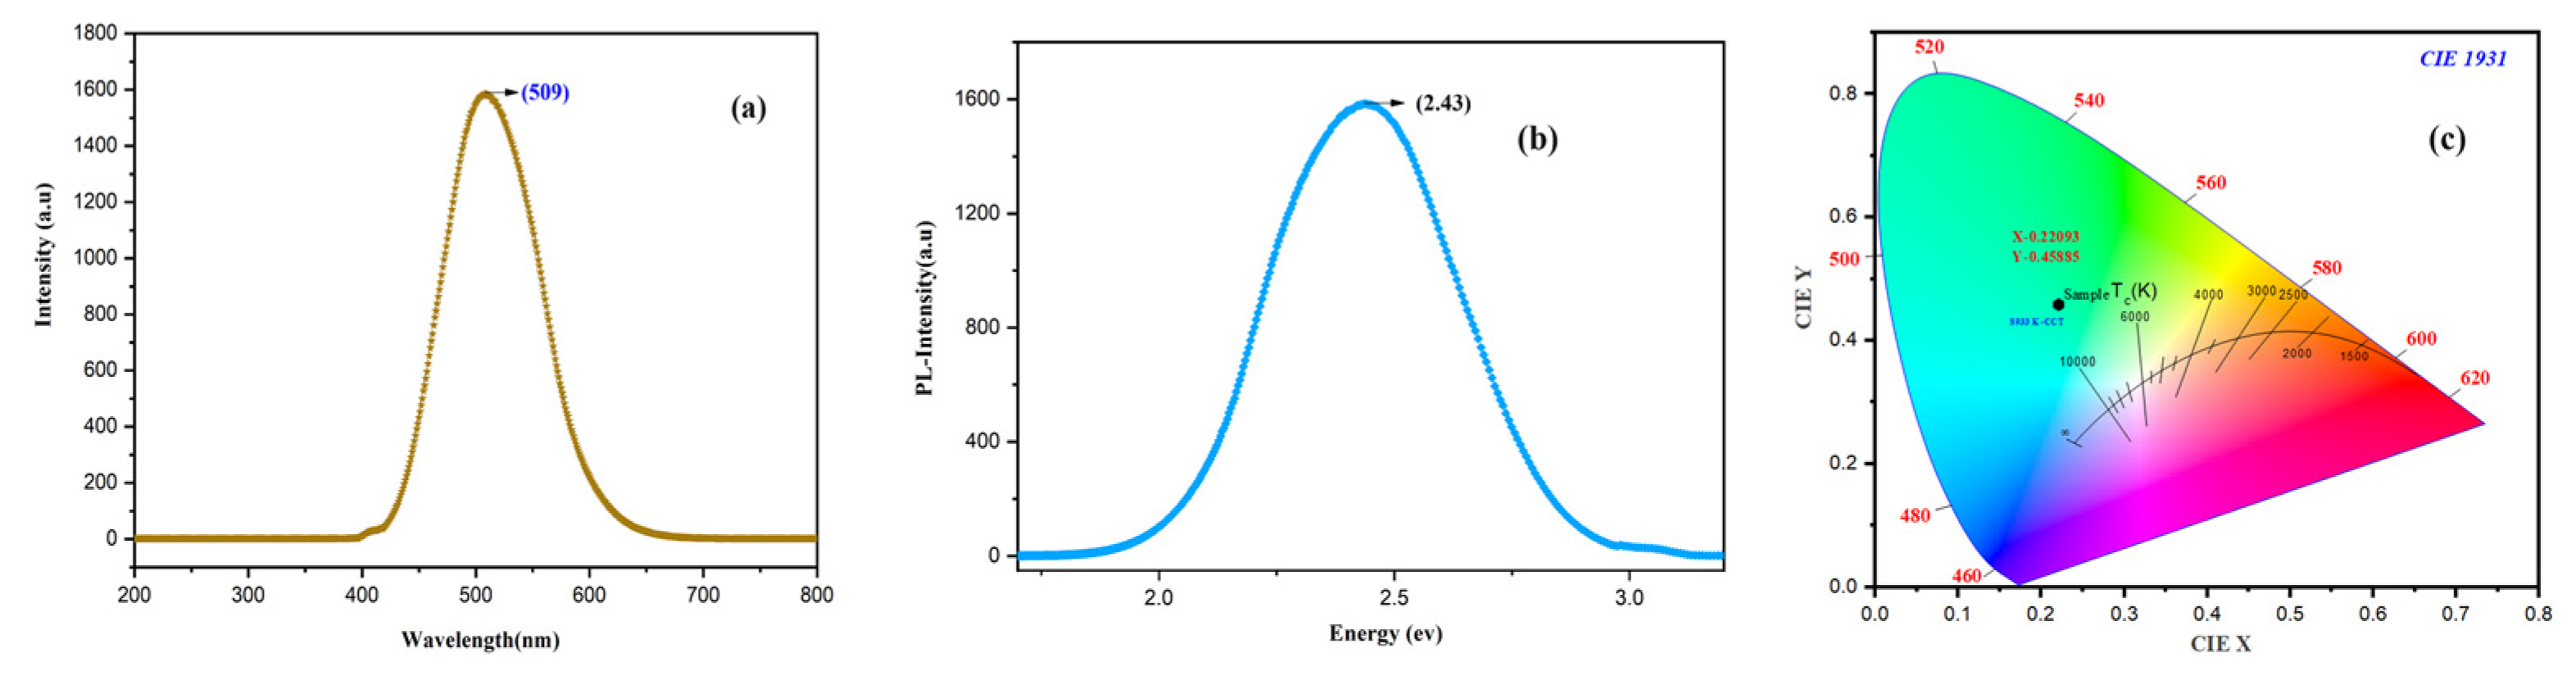
3.6. Photoluminescence Studies

The photoluminescence spectrum can be used to analyse the physical characteristics of the grown materials, namely the deep-level defects and electronic transition. Chemical sensors, photochemistry, and light-emitting diodes are potential applications for luminescence materials [27]. The emission spectrum of the MMPI crystal was recorded in the wavelength range of 200 to 800 nm, with an excitation wavelength of 413 nm selected in the UV-Vis-NIR studies. The multiple electronic transitions that take place in the energy levels within the energy gap are indicated to provide the broad PL signal have been observed. From Figure 10a, the strong, broad emission peak at 508 nm represents the π-π* transition to the donor and acceptor groups [CH=CH] in the stilbazolium chromophore. Due to their luminescence nature, the MMPI crystal’s observed emission intensity could be used as a green light emitter in the visible spectrum. Moreover, the strong single emission peak is linked to the well-defined arrangement of stilbazolium cation and defect-free MMPI crystal [28]. Therefore, the grown crystal optical quality indicates that it’s appropriately used in an optoelectronic device [29]. The Band gap of the MMPI crystal was estimated using this basic formula,
Eg = hc/λe
where c and h is a constant, λe -wavelength of the light. It is revealed that the energy band gap value is 2.43 eV (at 508 nm) from the spectrum in Figure 10b. MMPI crystal can be used for optoelectronic device applications. The analysis performed by the Commission Internationale de I’Eclairage (CIE) further reveals that the emission colour’s tunability (CIE chromaticity coordinates) and coloured associated temperature (CCT) have been established for photometric applications [30]. It is generated from the PL spectrum of MMPI crystal. The organic salt’s colour is coordinated, shown in Figure 10c CIE chromaticity diagram. The CIE colour coordinate emission colour detected in the green colour region was (0.22093, 0.45885), and the associated CCT was (8933 K).

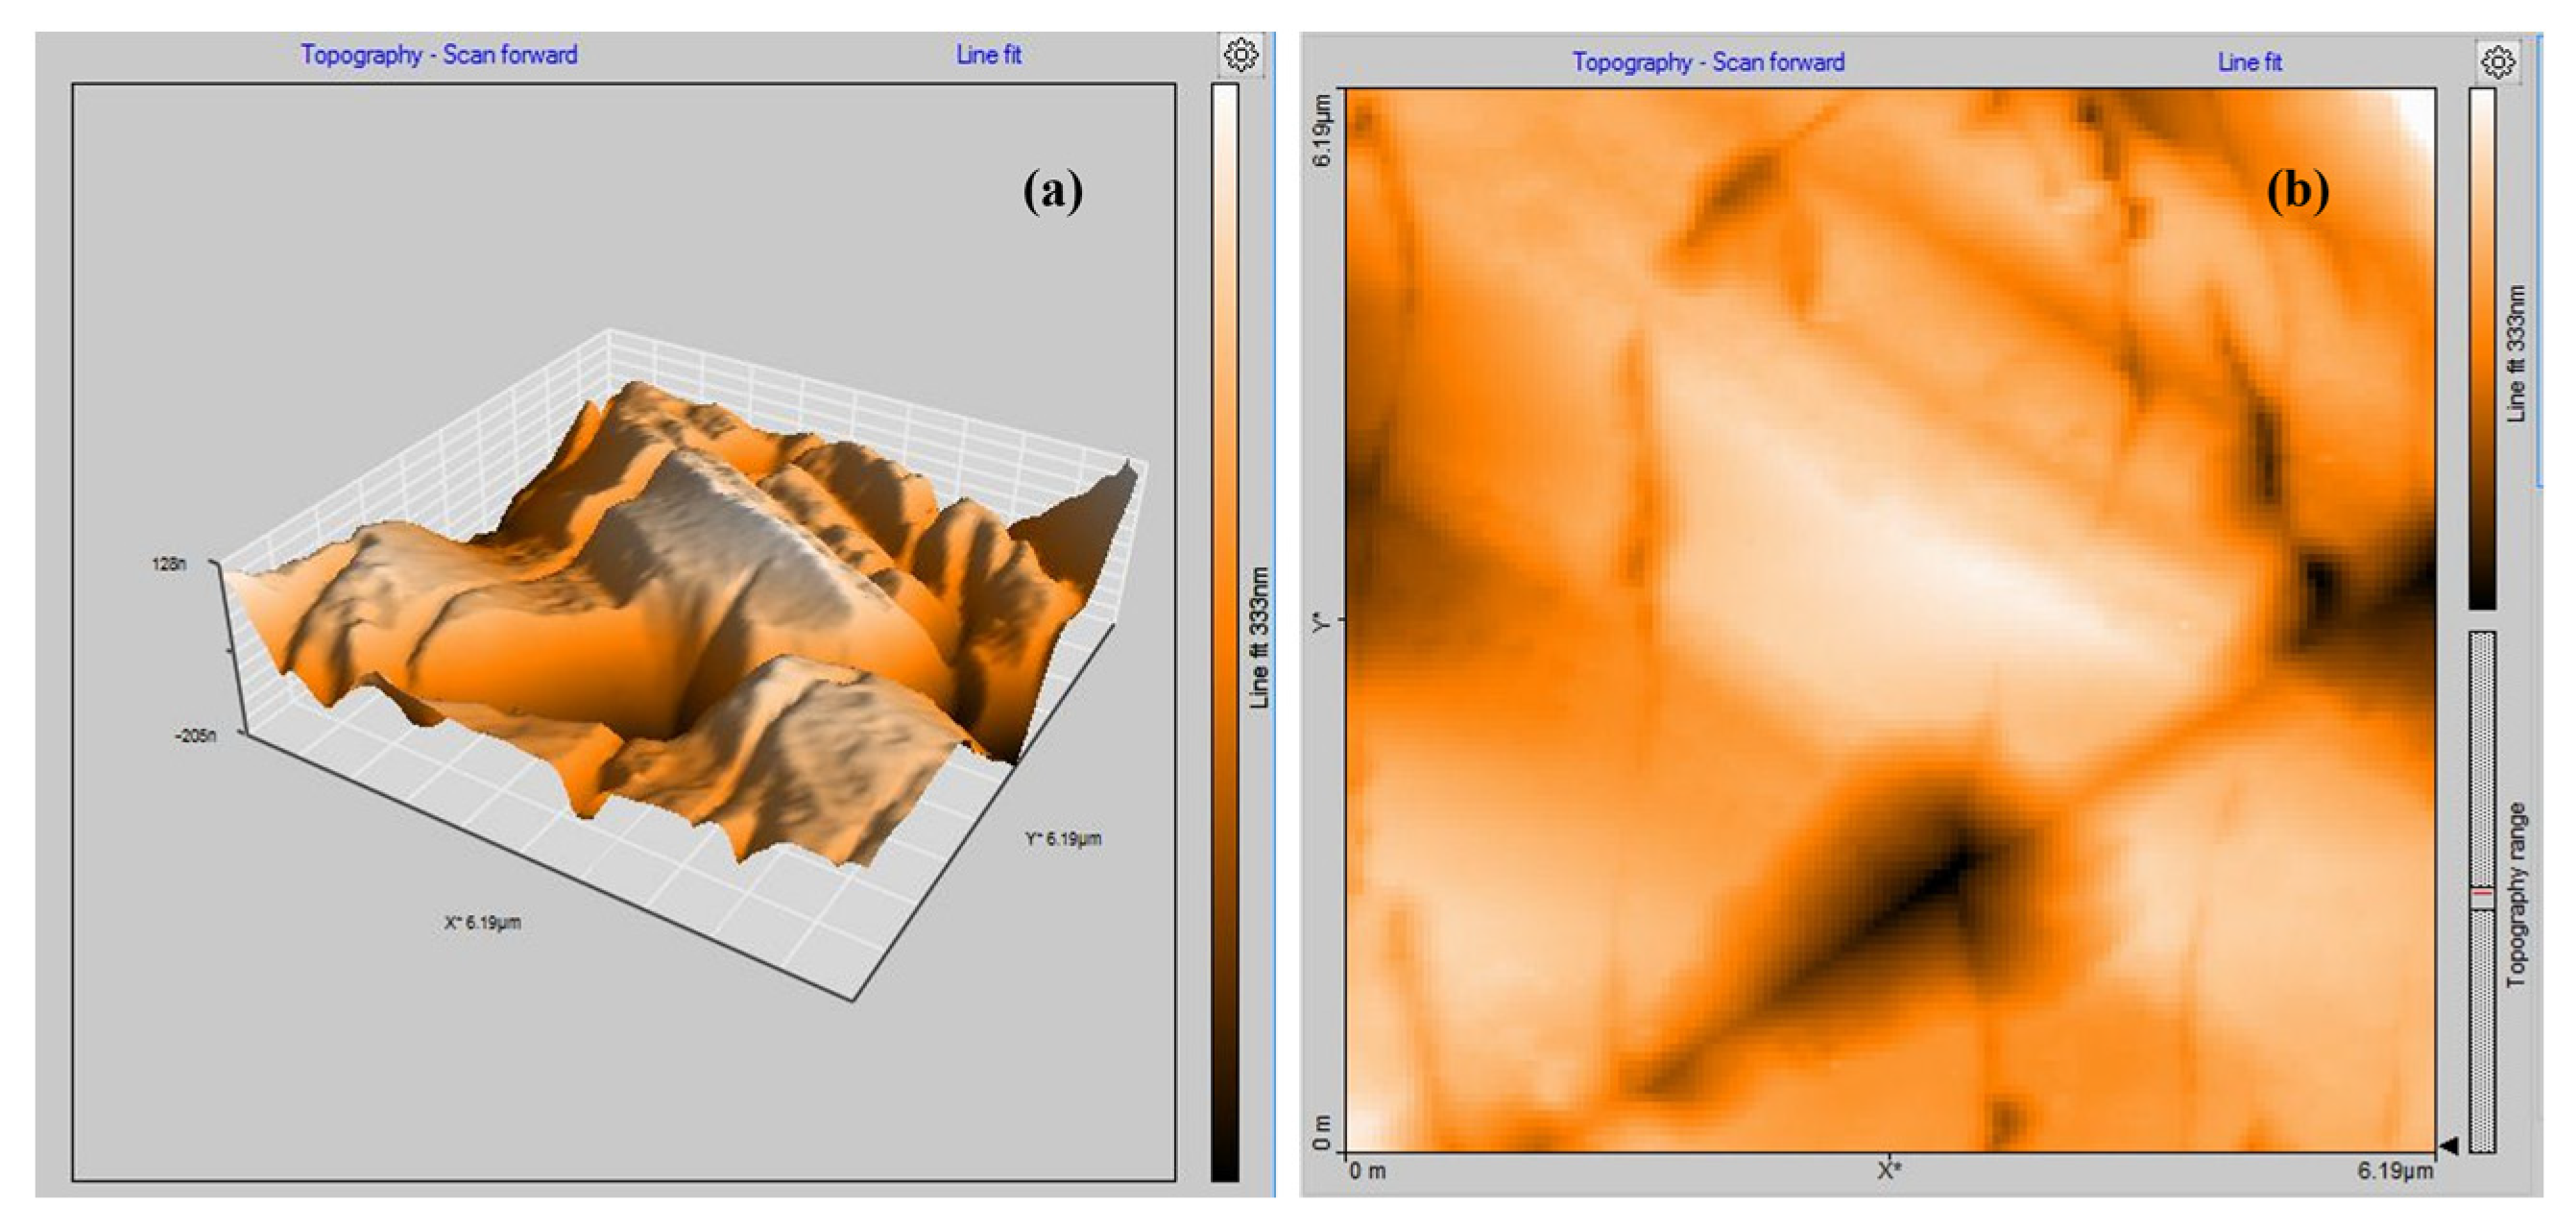
3.7. Atomic Force Microscopy Study

The surface topography can be obtained from the atomic force and microscopy analysis, which can be used to determine the morphology of the grown surface. Figure 11a,b displays the AFM 2D and 3D images. Each line (2D) or overall profile should be analyzed with the topography data to extend the analyses to the surface (3D). The four crucial variables that can be analyzed through AFM are spacing, amplitude, functional, and hybrid. The fundamental parameters for describing surface topography are amplitude parameters. The grown MMPI crystal surface area is measured to be 38.62 pm2. Root mean square (Sq) and average roughness (Sa) are the two important amplitude parameters. Since there are many peaks and valleys in the image, it is preferred to determine the median peak-to-valley difference because this has a major impact on the Sq and Sa values. The Sq and Sa values were found to be 56.289 and 43.842 nm, respectively. Peak-peak height (Sy) of MMPI is observed to be 422.51 nm. It is found that the ten-point height (Sz) observed is 115.910 nm. The crystal flatness was measured using surface parameters, namely (Ssk) surface skewness and (Sku) surface kurtosis. It is found that the MMPI’s surface skewness (Ssk) value is negative (−0.158). This negative skewness value represents that the surface is planar and valleys are more prominent. Surfaces are assumed to be absolutely flat if their surface kurtosis Sku < 3 and have more peaks than valleys when the surface kurtosis Sku > 3 [31]. Surface kurtosis (Sku) for the MMPI crystal is determined to be 6.0115, which clearly states that the subjected crystal surface has more peaks than valleys. It is shown that the grown crystal surface is fairly flat. The Ssk and Sku values of the MMPI crystal are moderately good. The roughness parameters that have been determined are all listed in Table S1.

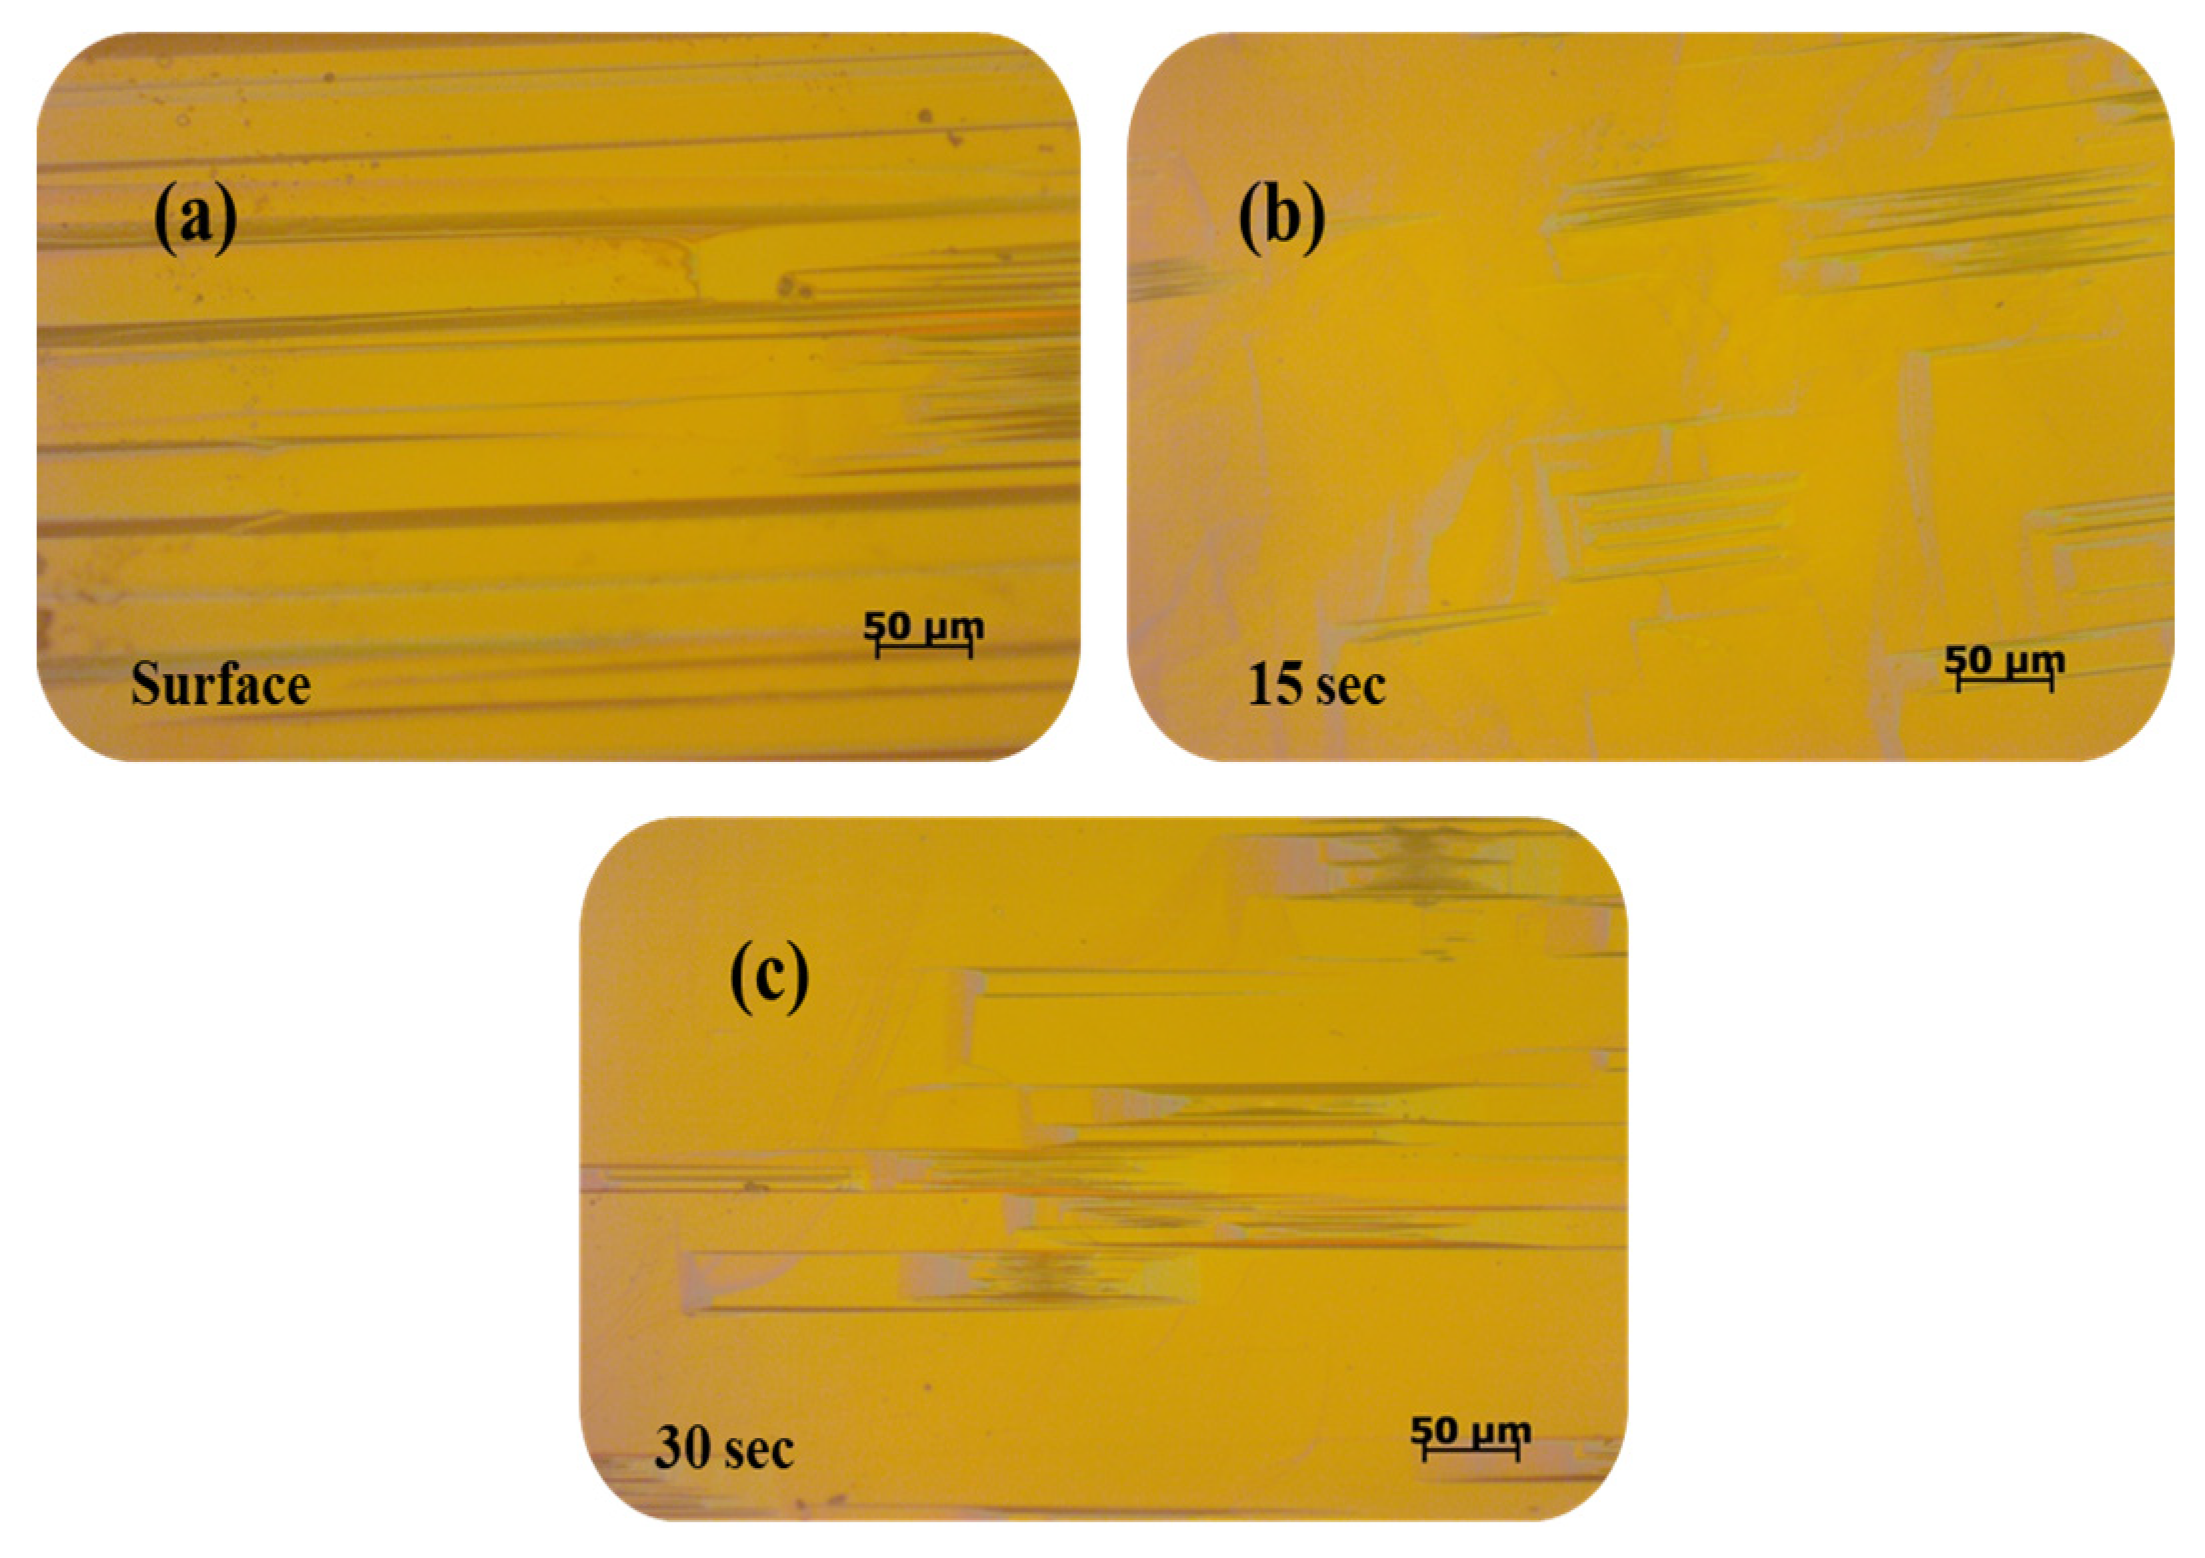
3.8. Chemical Etching Studies

A Chemical Etching study is one of the most valuable methods to investigate the morphology of the grown crystal surface. The crystal growth mechanism and related microstructural defects are revealed by subjecting the crystal to the appropriate etchant solvent treatment [32]. In the present work, chemical etching analysis for the MMPI-grown crystal was carried out using Dimethyl sulfoxide solvent for etching times 15 s and 30 s. The etched sample was wiped using tissue papers; their microstructure analysis was performed under an optical microscope (Magnification 20 × ). Figure 12a indicates the as-grown crystal surface (without etching). For a 15-s etching time, rectangular etch pits were visible on the crystal surface [33] (Figure 12b). When the etching time is raised to 30 sec, the rectangular etch pits are elongated with the size of etch pits increased Figure 12c, but the etch pits are the same. The calculated etch pit density from the etching analysis is 2.53 × 103 cm−2. The grown crystal exhibits rectangular etch pits and confirms that the MMPI single-crystal follows a two-dimensional (2D) nucleation growth mechanism [34].

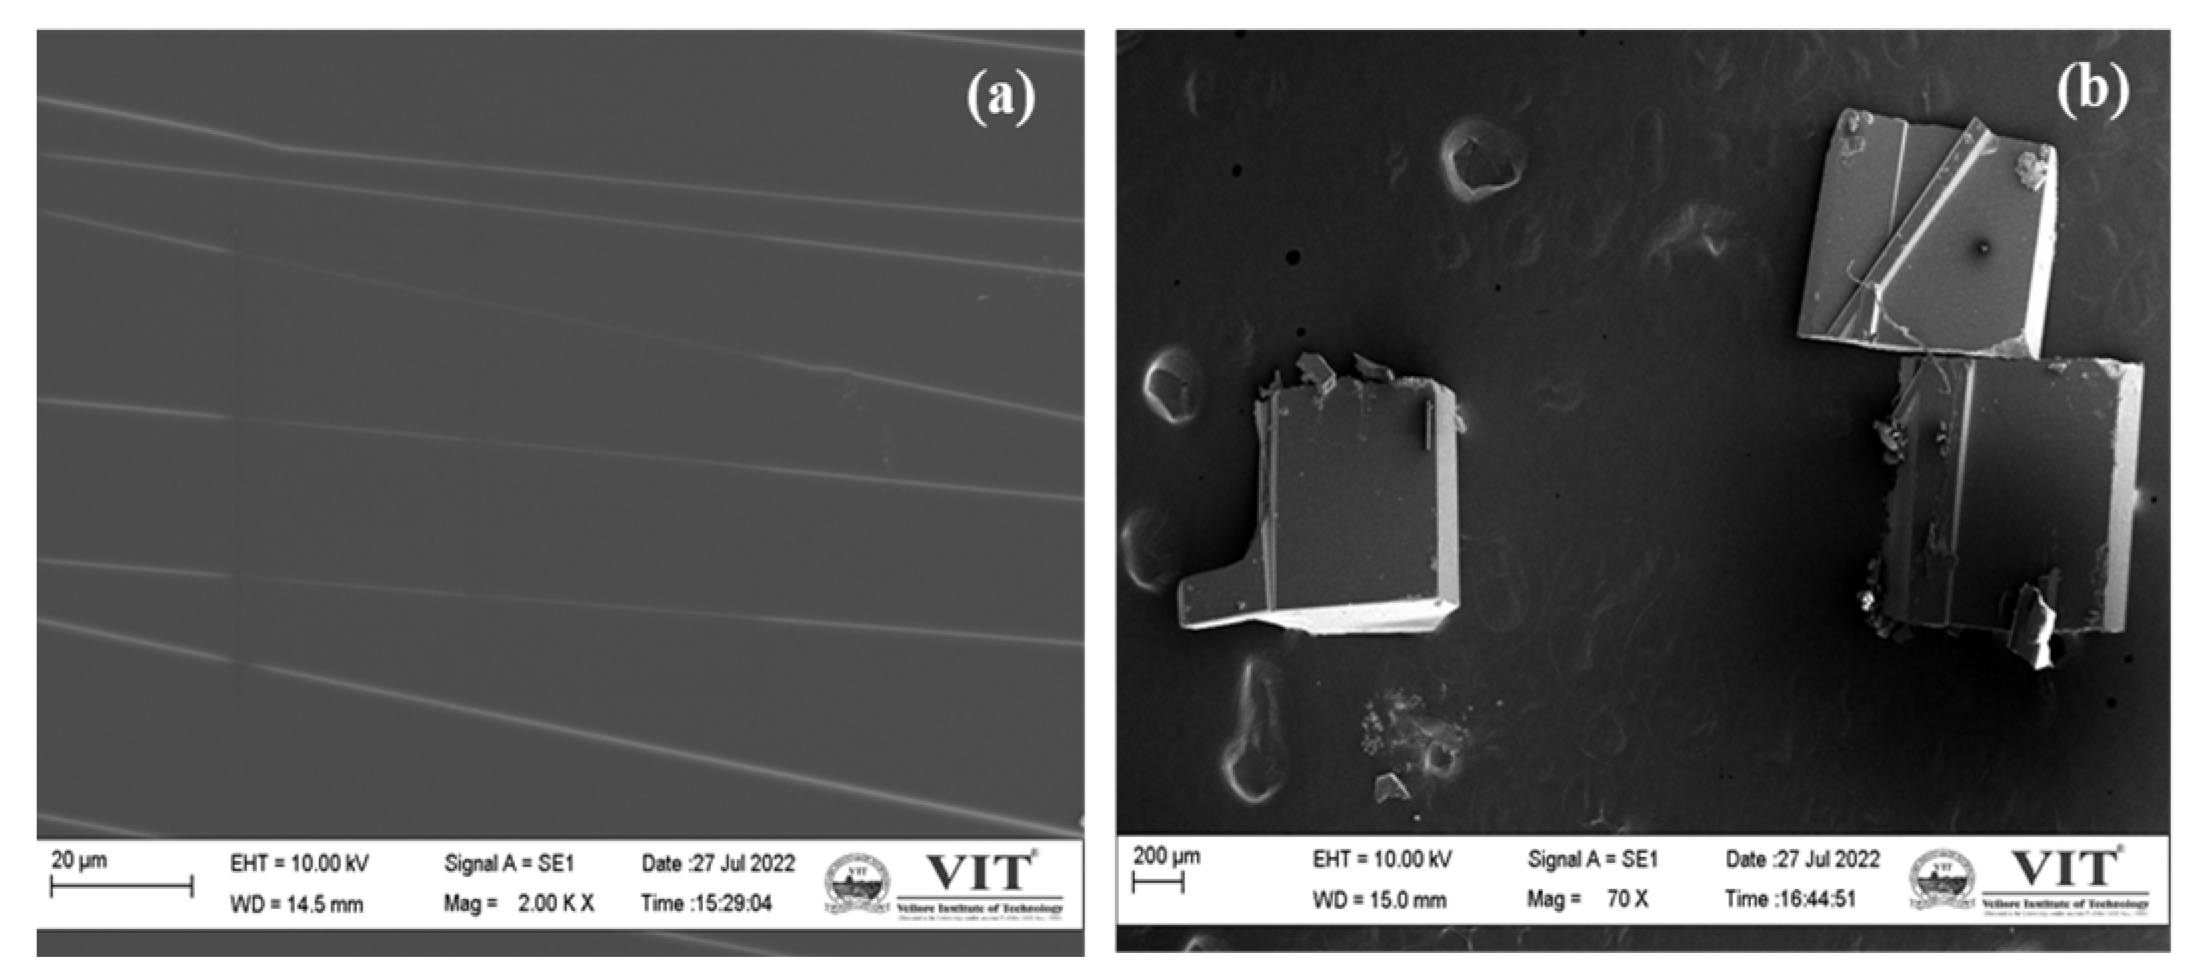
3.9. SEM Analysis and EDAX Analysis

The SEM micrographs of the MMPI crystal were recorded with resolutions of 20 µm and 200 µm are shown in Figure 13a,b. Figure 13a shows the presence of narrow line defects (NLDs) in MMPI crystal, which is commonly found in organic DAST derivative crystals [35,36].
Figure 13b reveals the presence of microcrystal growth on the surface, confirming the development and growth of multi-nucleation over the crystal surface of the MMPI crystal and also minor surface defects.
The energy dispersive X-ray analysis was used to determine the elemental composition analysis of the grown MMPI crystal (EDAX) [37]. Figure S1 displays the EDAX spectrum of the MMPI crystal along with the data of the compositional elements presented in the crystal. The presence of all the elements in the title compound, such as iodide, carbon, oxygen, and nitrogen, confirms the formation of the material. All the obtained elemental compositions are given in Table S2.

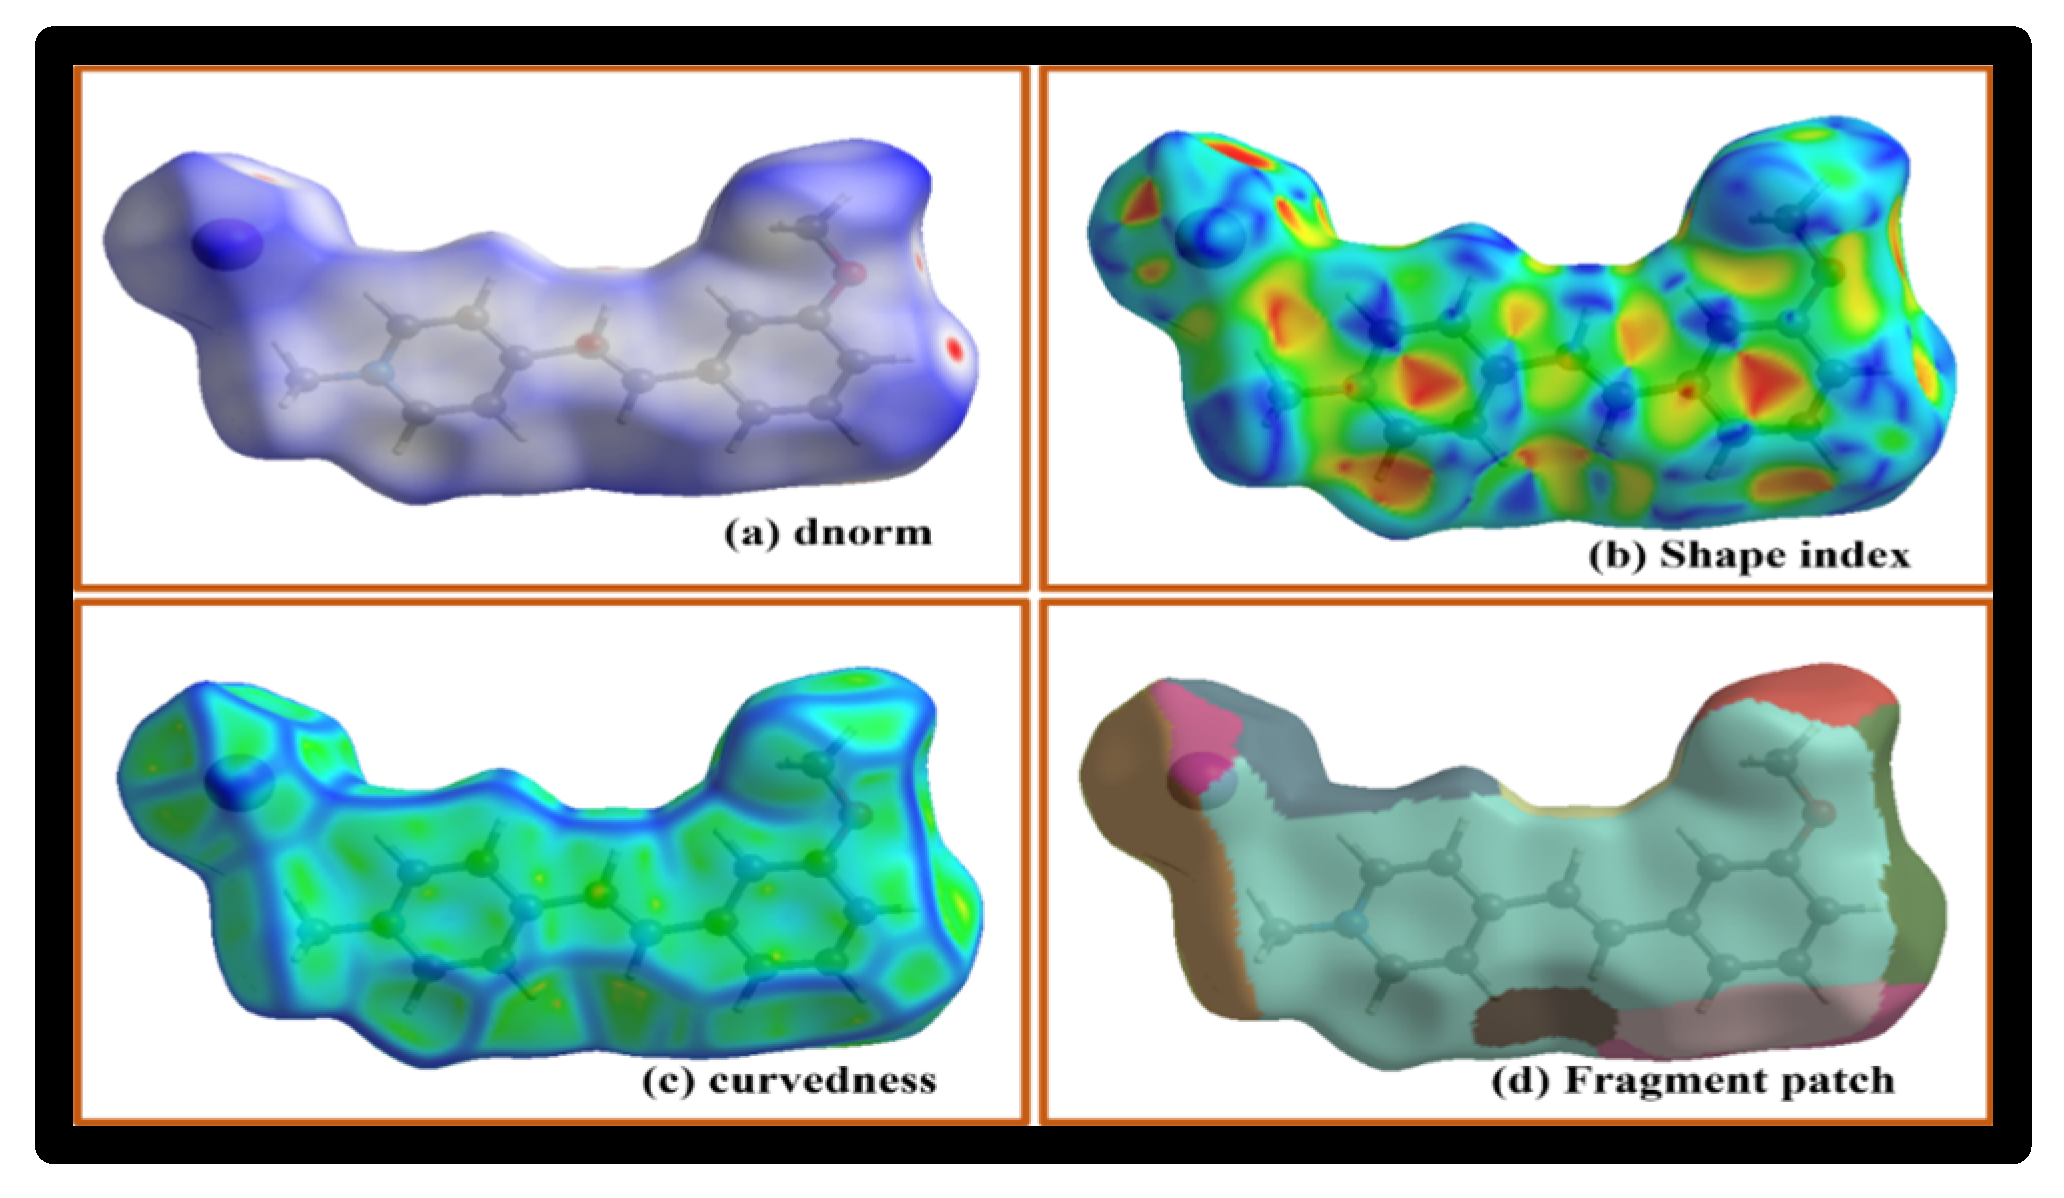
3.10. Hirshfeld Surface Analysis

The 3D intermolecular interactions were analysed using hirshfeld surfaces, were obtained to the corresponding molecular structure visualization and related 2D fingerprint plots was carried out using Crystal Explorer 21.5 software [38]. A single crystal CIF file was provided as the input data for this investigation. Figure 14 displays the intermolecular interaction in the MMPI crystal was mapped with various parameters, namely dnorm, shape index, curvedness, and fragment patch, reveals that the high standard surface resolution for HS.
The normalized contact distance is the sum of di (distance of internal atom) and de (distance of external atom). The dnorm mapped the region from −0.1391(red) to 1.5153 (blue). The intermolecular interaction within the molecule is represented by red, blue and white colours. The hydrogen bond interaction is indicated by the red (negative) coloured dots, and the white colour indicates an intermolecular distance near the van der Waals separation dnorm becomes zero [39,40]. The shape index is mapped all over the range from −1.0000 to 1.0000. The red and blue triangles in the shape index indicate shows the π-π interaction and C-H…π interaction. A flat green surface surrounded by blue edges is visible in the curvedness map, which was taken for −4.0000 to 0.4000. The curvedness indicates the presence of π…π stacking interaction [41,42,43]. A method of identifying the neighbour coordination environment based on the patch’s colour is provided by the fragment patch plot, which has a range from 0.0000 to 21.0000.
The 2D fingerprints represent all the intermolecular interactions between different atoms present in the MMPI crystal. The spikes and wings feature on the fingerprint plot analyzed from the range of di and de. Figure S2a shows all the molecule interaction percentages (100%), and Figure S2b represents the percentage of H…H (42.9%) interaction, which is due to the effect of a higher quantity of hydrogen atoms. (Figure S2c,d) indicates I-H (16.0%) & H-I (6.3%) interaction covered with right and left side wings (22.3%), Figure S2e,f,g indicates the C-C (8.3%), C-H (7.3) and O-H (2.6) interaction. It can be concluded from the 2D fingerprint plot that strong crystallization results from H-H interactions, followed by I-H interactions.

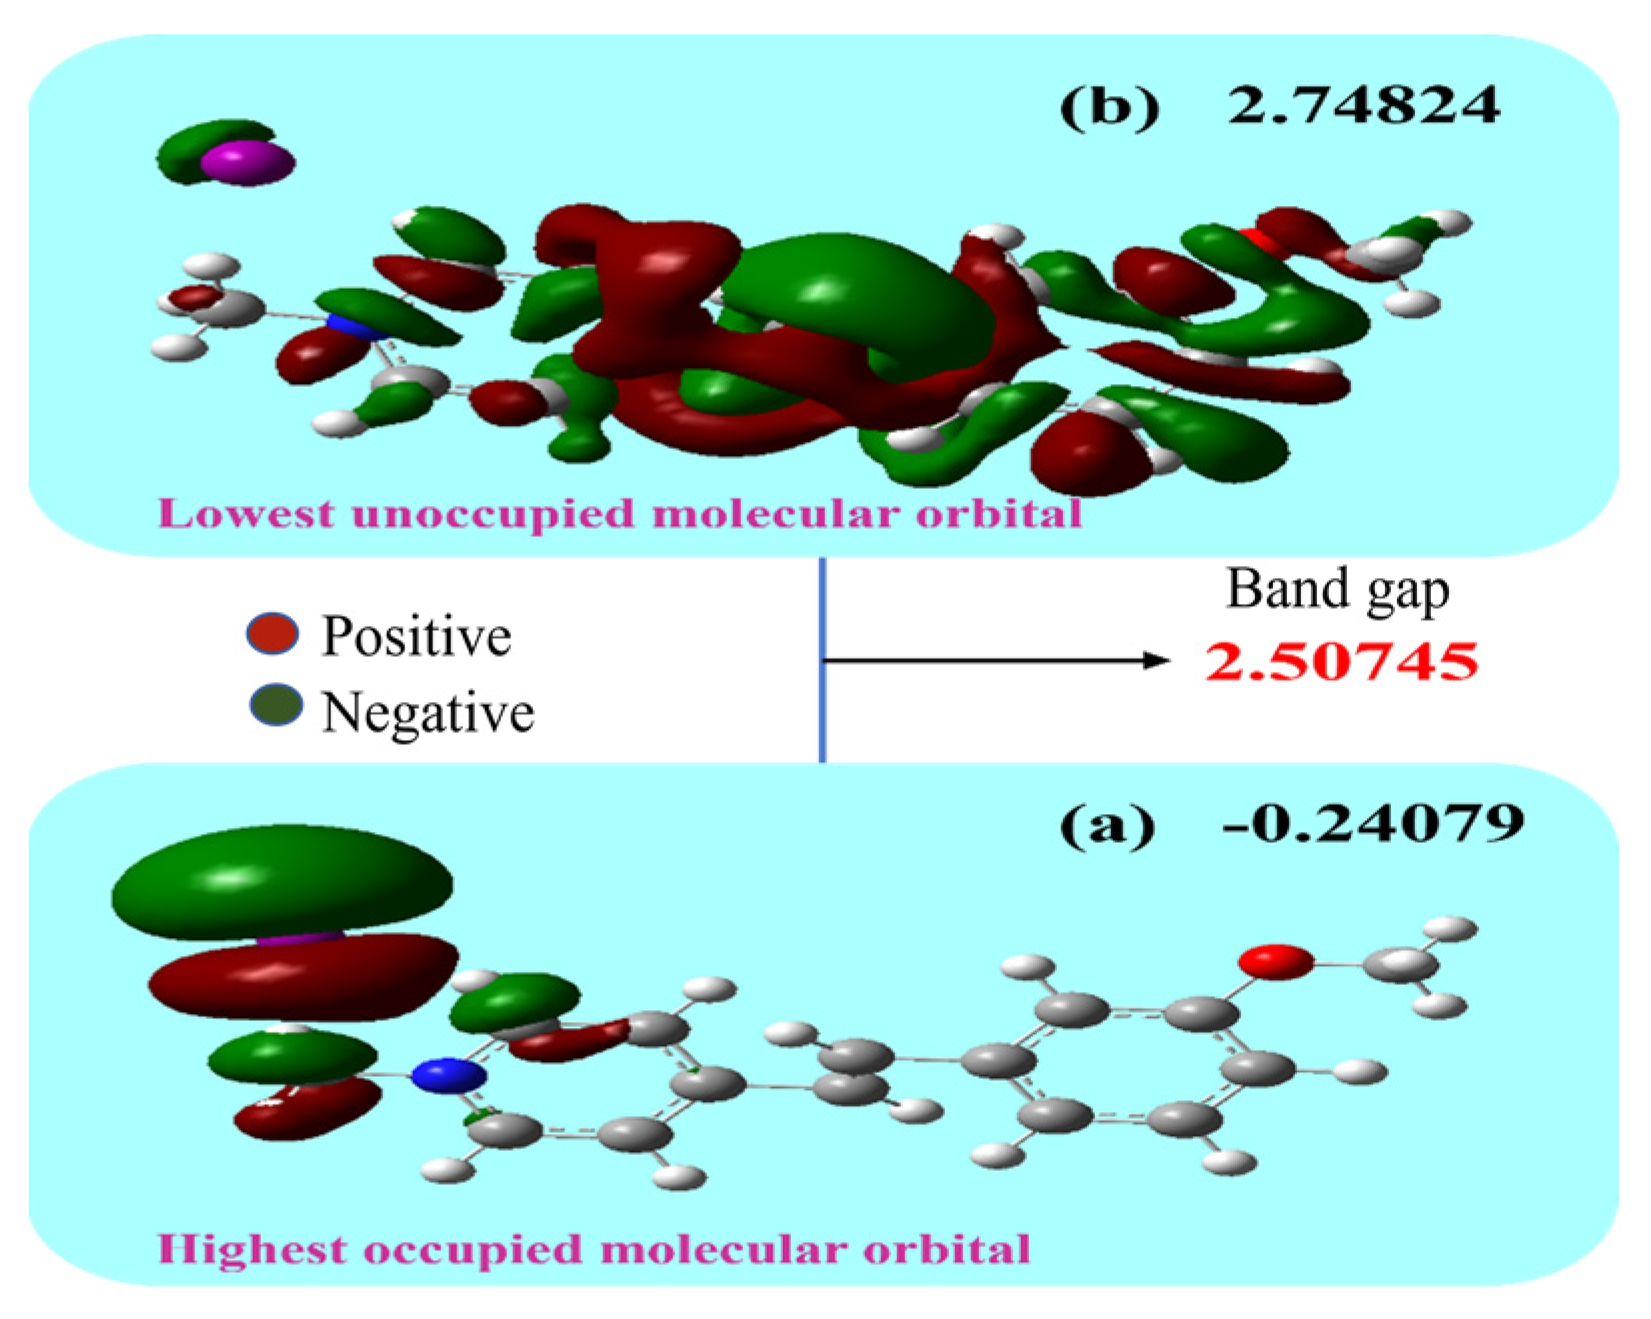
3.11. HOMO and LUMO Studies

The chemical activity of intermolecular charge transfer is indicated by the energies between the HOMO (highest occupied molecular orbital) and LUMO (lowest unoccupied molecular orbital) [44]. The HOMO molecular orbital functions act as an electron donor, While the electrons in the LUMO molecular orbital primarily serve as electron acceptors, which the transition of electron density between these molecular orbitals can describe. The charge transfer activities that occur within the molecule are governed by the energy gap that was found. Quantum chemical quantities for ionization potential, chemical potential, electron affinity, global electrophilicity index and global softness can be evaluated using the HOMO and LUMO energy values [45]. The optimized molecular structure was used to calculate the band gap energy between the HOMO and LUMO using the Gaussian View 6 program and density functional theory method (DFT) set the B3LYP/6-31G++(d,p) basic set level (input data checkpoint file). Figure 15a,b displays the Molecular orbitals plots (HOMO and LUMO). The green (negative) iodine and the red (positive) pyridinium rings in carbon atoms spread all over the HOMO orbital. The LUMO orbital spread all over the molecular structure apart from the CH3 and methoxy group of carbon atoms. The HOMO-LUMO energies result in −0.24079 eV and 2.74824 eV, respectively. An energy band gap of 2.50745 eV was found for the MMPI molecule.

3.12. MEP Analysis

The molecular electrostatic potential (MEP) surface is a useful factor for analyzing charge distribution, biological recognition, reactive sites, and hydrogen bonding interactions in molecules [46]. Figure S3 shows the 3D plots of the MMPI molecular electrostatic potential (MEP). The molecular electrostatic potential map of MMPI material was generated using gaussian view 6 software in the region of −9.269 e−2 to 9.269 e−2. Various colours represent the surface of the title chemical. Red < yellow < green < blue is the order of potential. Nucleophilic reactivity was linked to the negative (red) electrostatic potential region. The region of the electrophilic reactivity is positive (blue) [47]. The colour green depicts the regions where the electrostatic potentials are nearly zero. An electro-rich, partially positive zone is indicated by yellow. The MMPI compound reveals that the region with a negative potential is over the iodine atom. Hydrogen atoms are covered with positive potential. The yellow region represents the oxygen (positive) atom, near to the iodide atom. A green colour region covers the remaining molecular structure with zero potential. The molecular electrostatic diagram details the electrophilic and nucleophilic reactions [48].

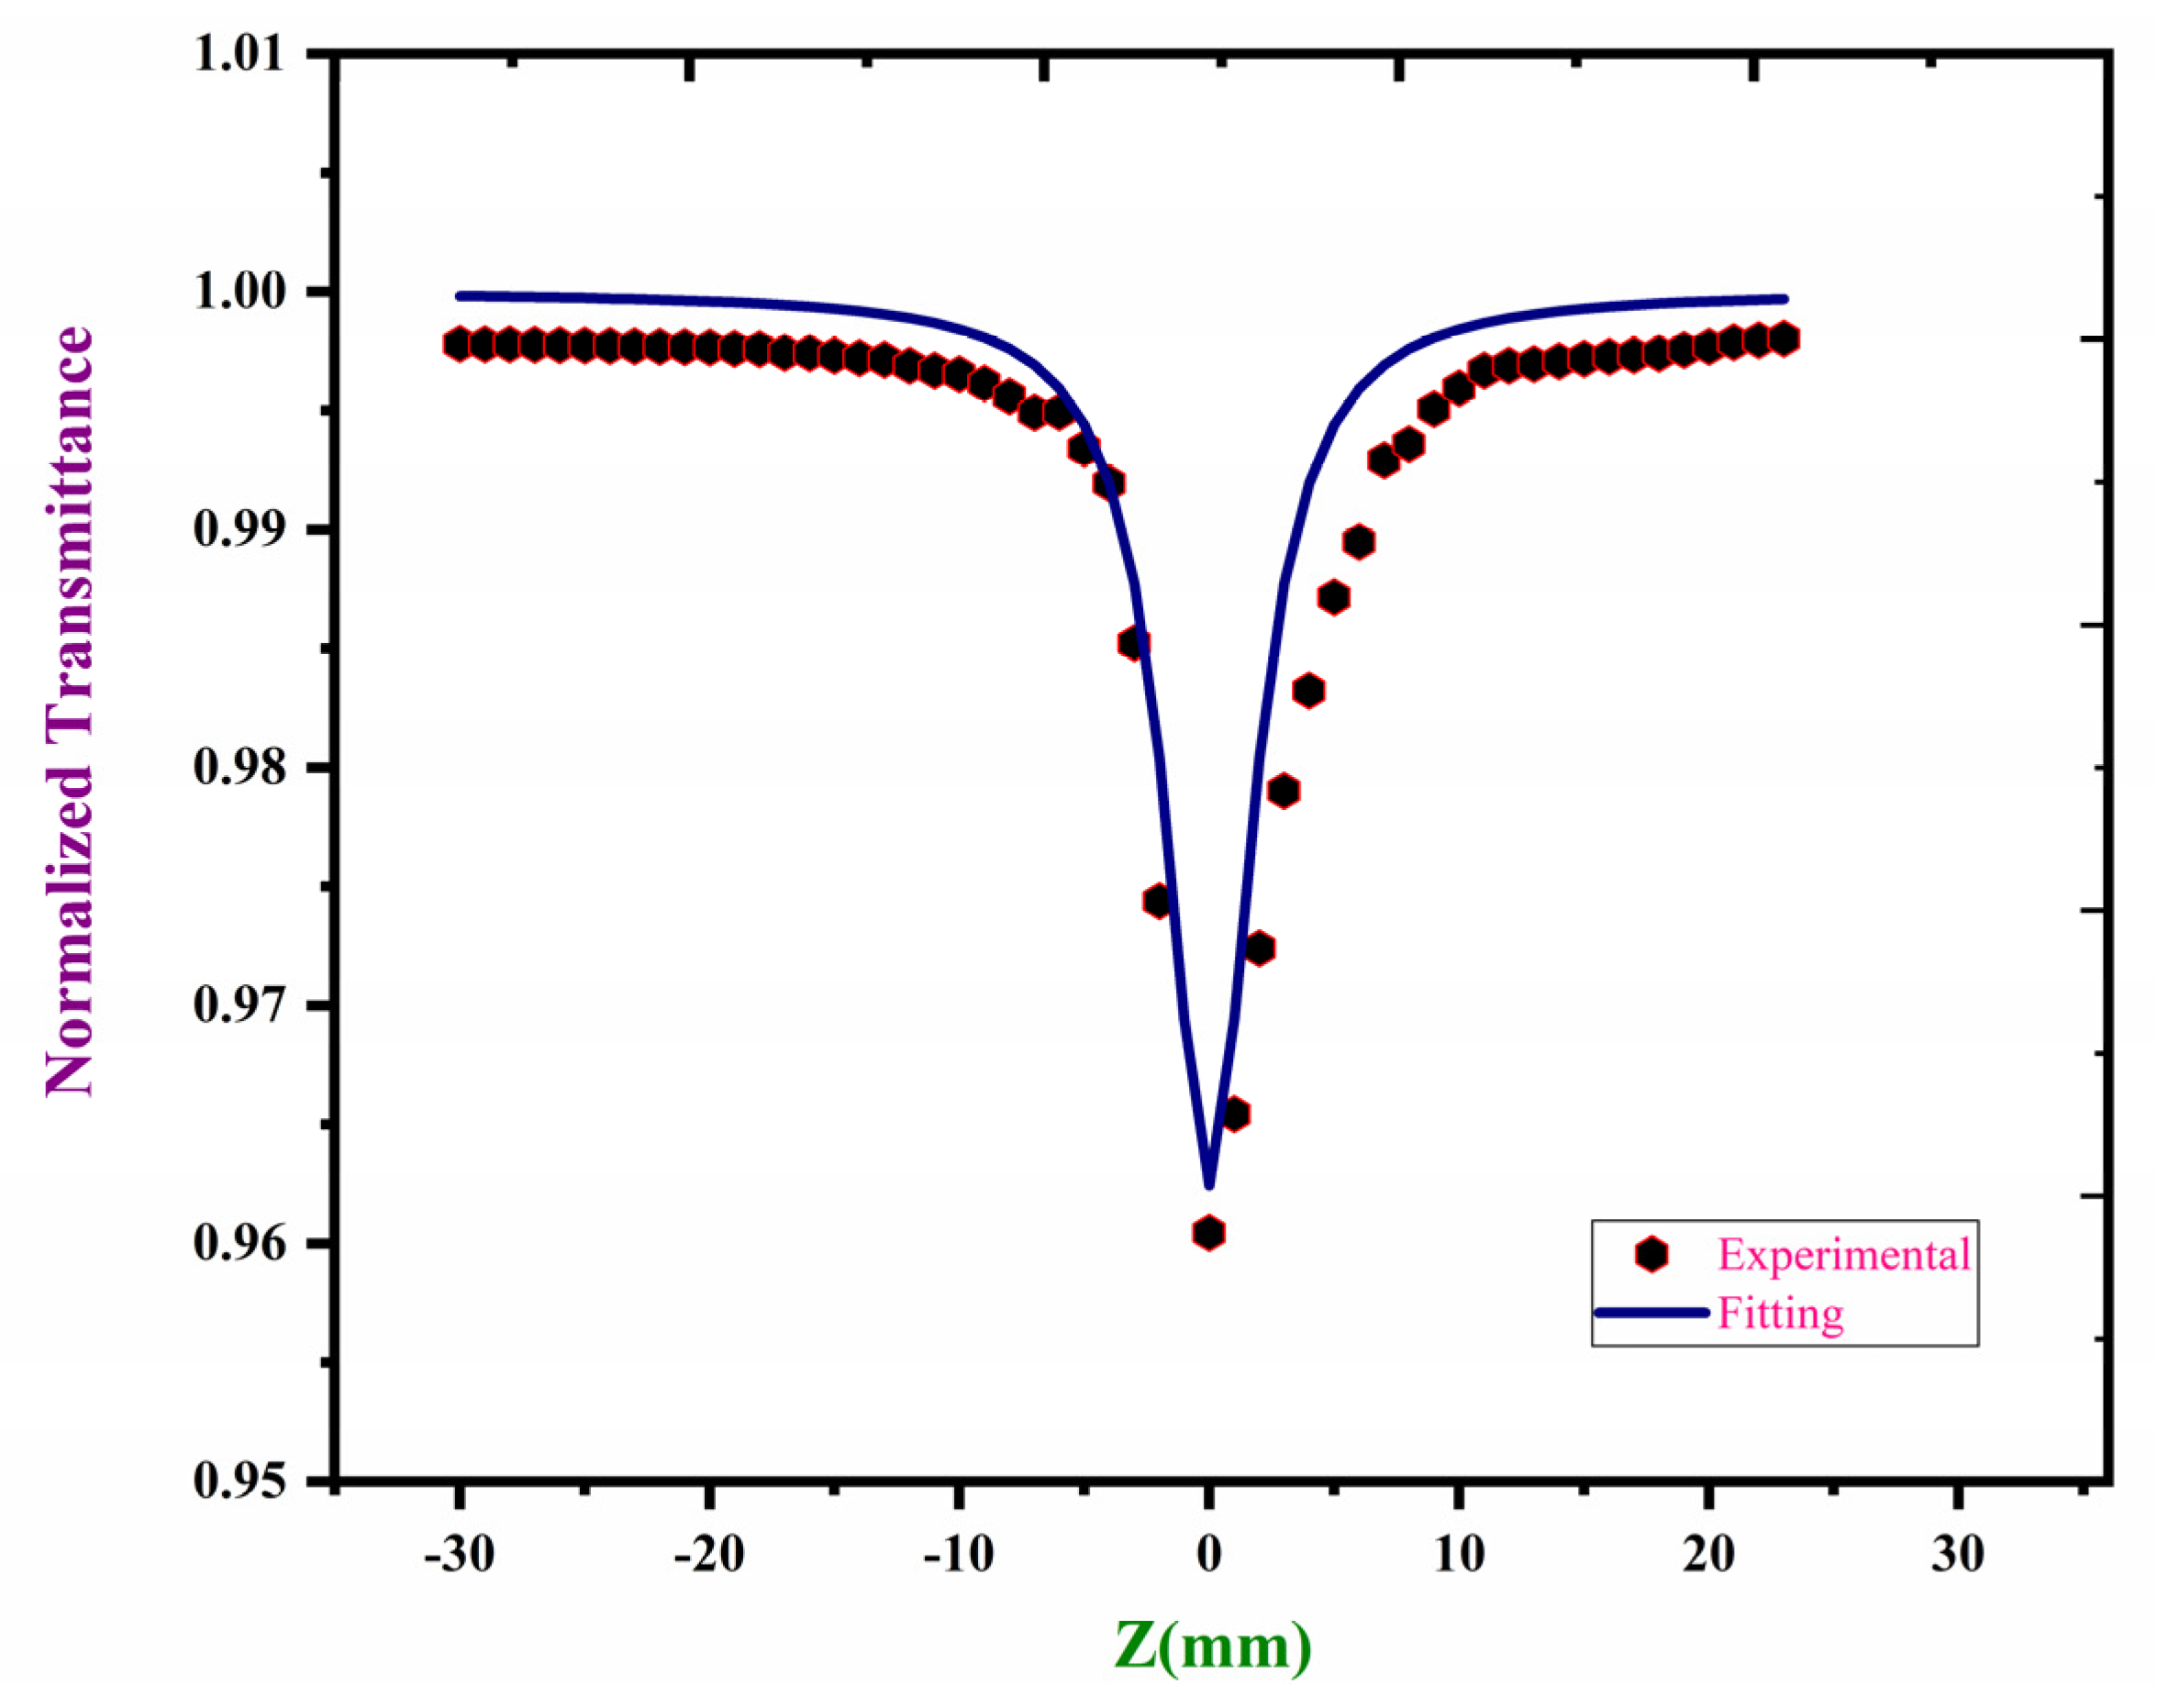
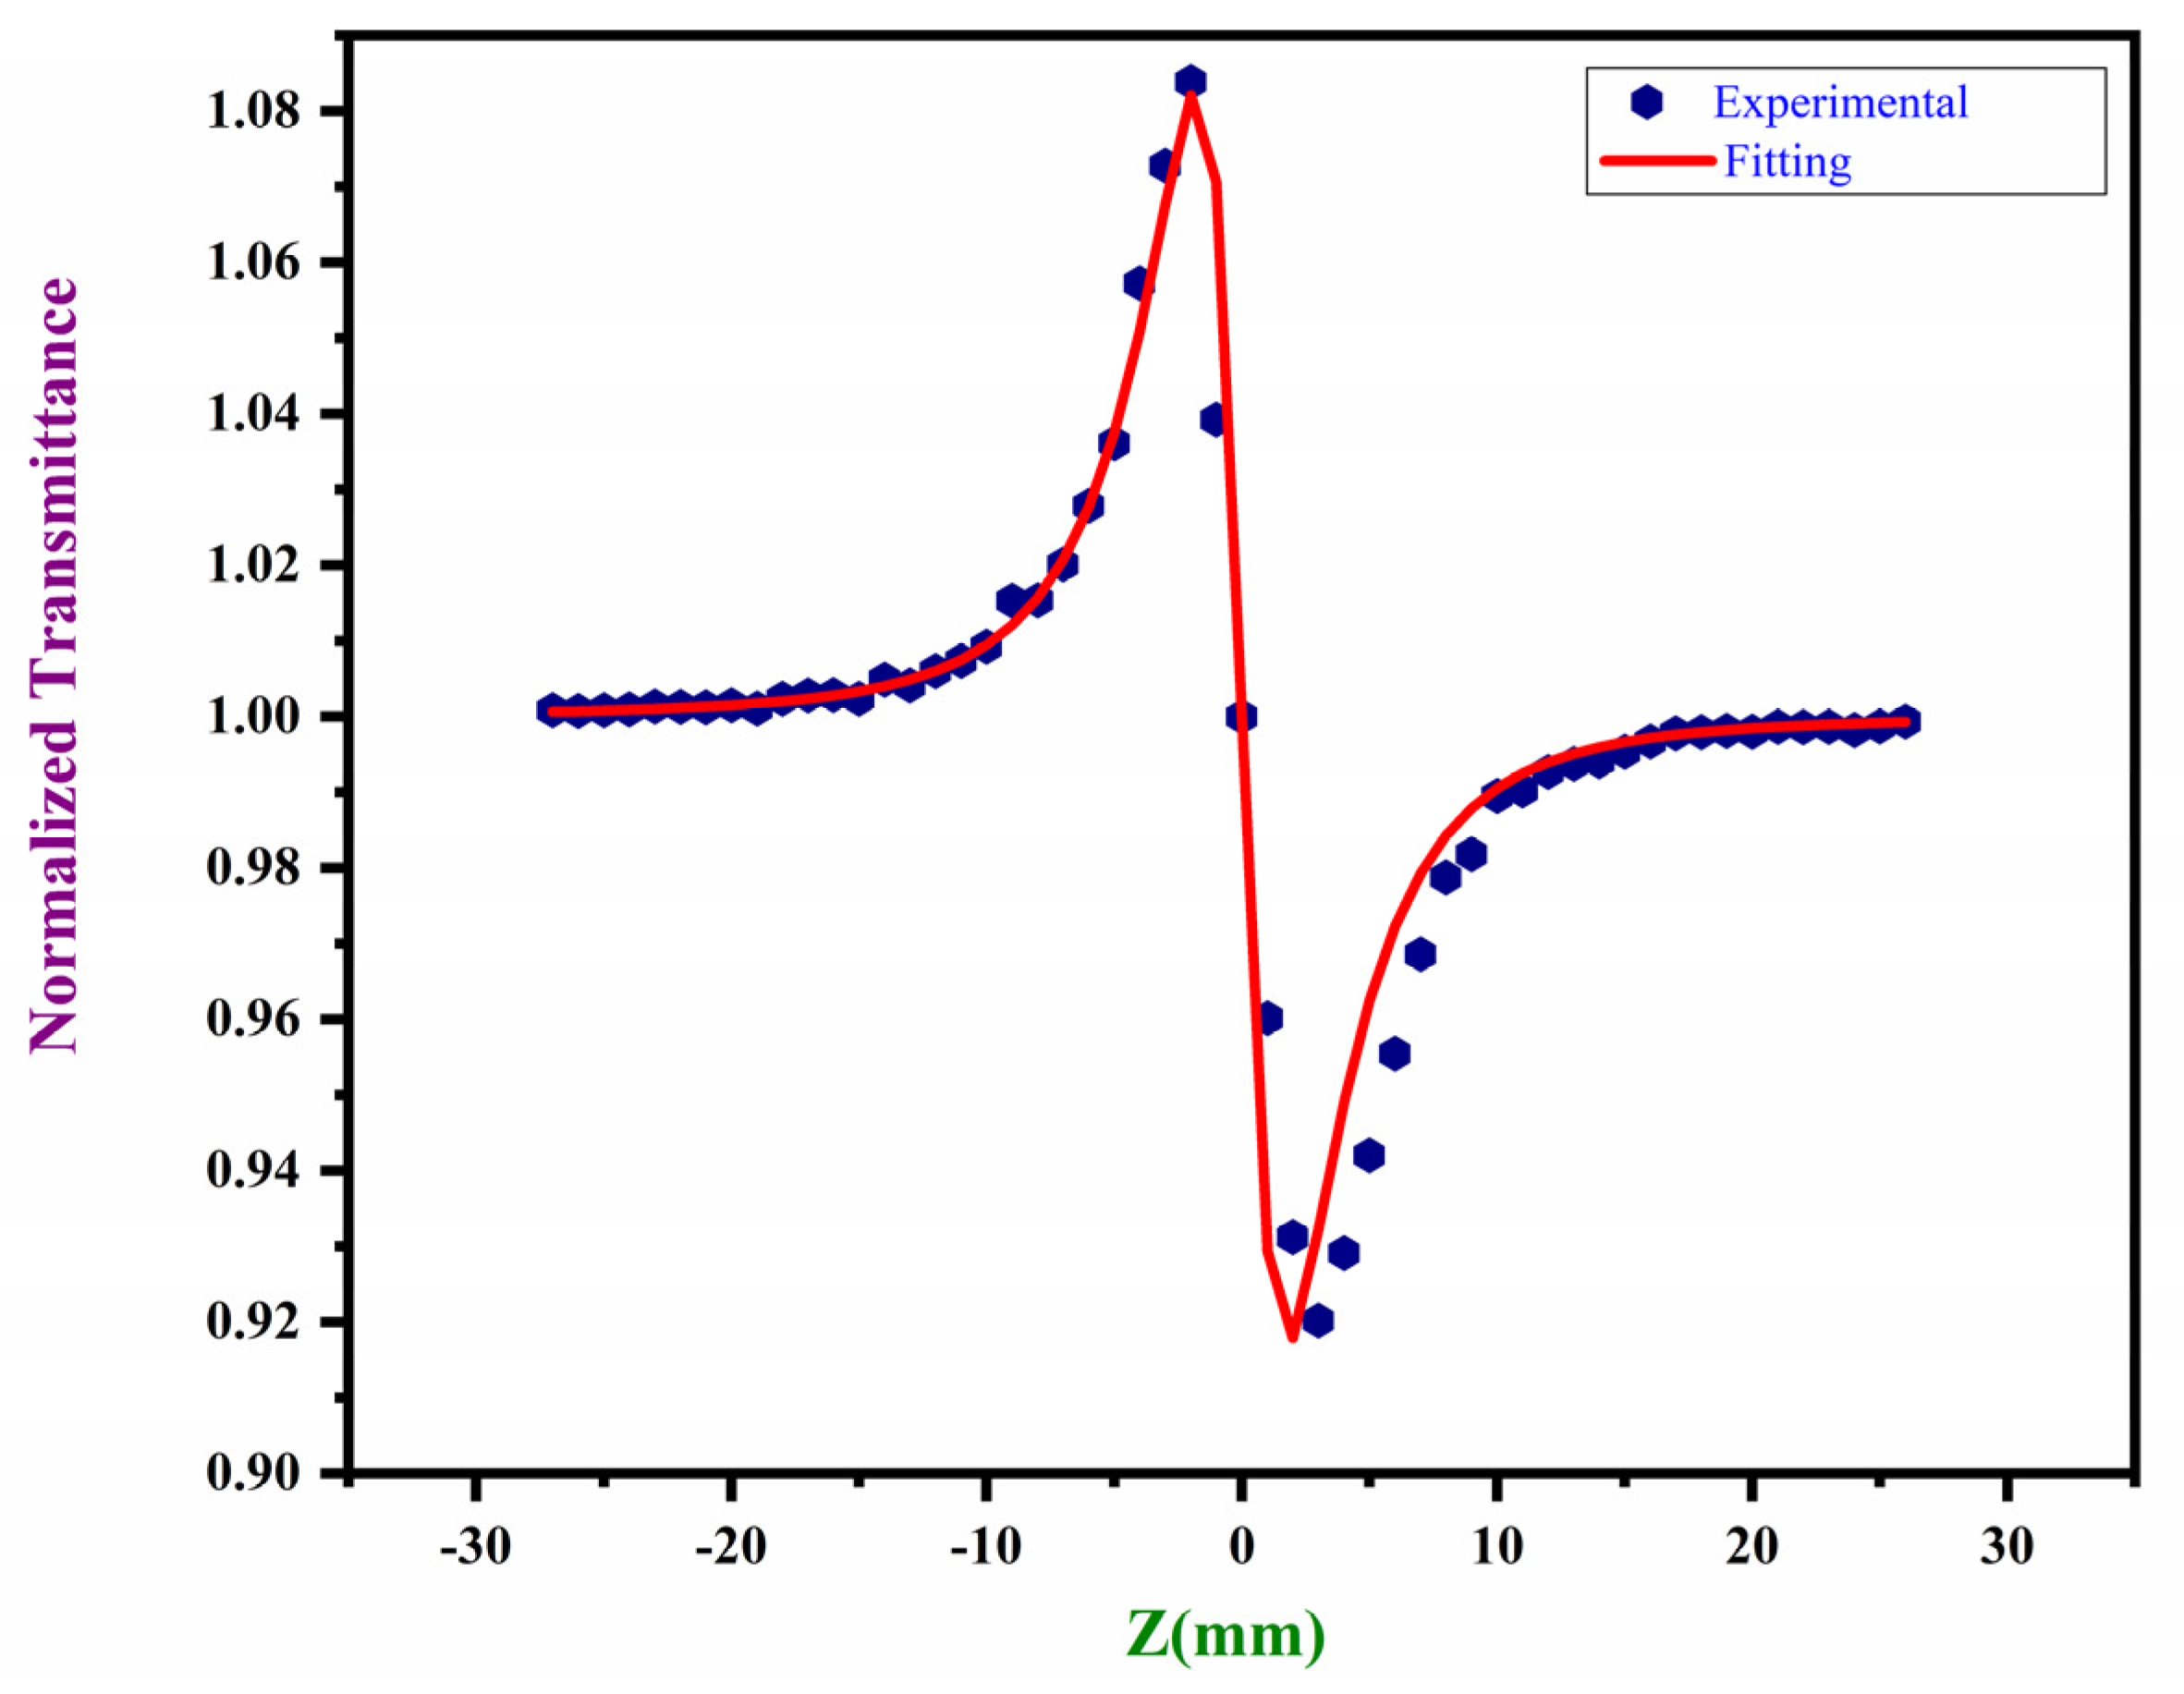
3.13. Nonlinear Optical Properties by Z-scan Technique

The chromophores arrangement in the crystal determines that the material possesses characteristics of second-order nonlinear susceptibility (ꭓ2) or third-order nonlinear susceptibility (ꭓ3) effects. A centrosymmetric distribution of the MMPI crystal with the P121/c1 space group was determined by the SCXRD experiment. This confirms the inversion centre in the crystal structure; consequently, the polarisation that rises in the system is completely due to the odd order susceptibility, which also implies that even order susceptibility is zero. Due to odd-order susceptibility, third-order nonlinear studies were carried out for the grown MMPI crystal [49,50]. The monochromatic continuous wave laser light 632.8 nm from the helium-neon laser was utilized as the light source in this technique, and the sample with a 1 mm thickness was used. The light source was focused with a lens of 10.3 cm (f) focal length. Along the negative (−Z) to the positive (+Z) axis, the sample was moved perpendicular to the laser beam. The translation of the sample along the z axis is controlled by the computer program. The output data was measured using a digital power meter with regard to the crystal position and transmittance.
Open aperture: To determine the nonlinear absorption coefficient (β) of the MMPI crystal, an open aperture mode Z scan is carried out. The experimental data and fitting trace of the open aperture Z-Scan curve are depicted in Figure 16. It is evident that there is a drop in the transmittance value close to the focus (Z = 0); beyond the focus, there is an increase in optical intensity. This nature of the MMPI crystal reveals that it exhibits reverse saturation absorption (RSA). For RSA, the sample’s normalized transmittance decreases as optical intensity increases. The relationship to estimating nonlinear absorption coefficient (β) through the open aperture method is:
β = 2 2 Δ T I o L eff
Closed aperture: In the closed aperture, the received intensity depends on the aperture radius (2 mm), and this radius is kept constant during the experimental process. The obtained experimental and fitting trace of the closed aperture (CA) Z scan curve is depicted in Figure 17. The pre-focal (maximum-peak) followed by the post-focal (minimum-valley) in normalized transmittance curve behaviour is observed from the closed aperture. Additionally, the sample causes a focus or defocus depending on whether the nonlinear refractive is positive (n2 > 0) or negative (n2 < 0) defocus [51,52]. From the graph, it can be observed that the signature of n2 is the negative and self-defocusing effect of the grown title ionic crystal. The nonlinear refractive index (n2) can be generated by using the transmittance quantity Tp-v from the curve. The normalized transmittance difference between the peak (Tp) and the valley (Tv) can be calculated using the relationship expression:
Δ T p - v = 0.406 ( 1 S ) 0.25 | Δ φ 0 |
S = 1 − exp(−2ra2/wa2) is the linear aperture transmittance, and phase axis shift is│Δ φ 0│, Radius aperture ra is (0.15 cm), spot size diameter in front of the aperture wa value is (0.35 cm). The third-order nonlinear refractive index (n2) was determined by the following relation:
n 2 = Δ φ 0 KI 0 L eff
where K = 2π/λ, K—wavenumber, λ is the wavelength of the laser and Leff = [1 − exp(−αL)]/α effective thickness of the sample. The sample of the thickness (L) is 1 mm used for the analysis, I0 is the on-axis irradiance at focus, α is the linear absorption coefficient.
This experiment gives details about the nonlinear refractive index (n2) from (CA) and the absorption coefficient (β) from (OA). The real and imaginary portions of the third-order nonlinear optical susceptibility (ꭓ3) were determined based on the relationship shown below.
Re ( 3 )   ( esu ) = 10 4   ε 0 c 2 n 0 2 π n 2   ( cm 2 / W )
Im ( 3 )   ( esu ) = 10 2   ε 0 c 2 n 0 2 4 π 2 λ β   ( cm / W )
The absolute value of ꭓ3 is determined from │ꭓ3│= [ ( Re ( 3 ) 2 ) + ( Im ( 3 ) 2 ) ] . The nonlinear absorption coefficient (NLAC) (β), and nonlinear refractive index (n2) calculated results are observed to be 7.25069 × 10⁻⁵ and 3.03311 × 10⁻⁹, respectively. The resultant third-order susceptibility (ꭓ3) was observed to be ꭓ3 = 7.87636 × 10⁻⁶ esu. Table 6 compares the title ionic crystal third-order susceptibility values with a few stilbazolium derivatives and organic centrosymmetric crystals. These comparison results indicate that the title MMPI crystal gets a comparably high (ꭓ3) value. This can be described by means of the (D-π-A) in the molecular structure. In this MMPI molecular structure, the electron donor (hydroxy group) and electron acceptor (pyridinium moiety) interact via the polarized π conjugate (charge transfer from donor to acceptor) stilbazolium chromophore, increasing the magnitude of the dipole moment and resulting in a large nonlinear behaviour [53]. The materials have a negative n2 sign, therefore indicating a self-defocused nature. All the Z-scan outcome results for the title crystal indicates that the grown MMPI crystal is benefit for the applications like optical limiting and frequency conversion [54].

4. Conclusions

The growth of a new organic single crystal of MMPI was successfully carried out by solvent evaporation method after a time of 60 days. The 1H and 13C NMR spectrum studies confirm the molecular structure of the MMPI-grown crystal. Single crystal XRD analysis reveals the monoclinic crystal structure with P121/C1 space group. The various functional groups present in the MMPI crystal were confirmed using FT-IR spectral studies. Optical spectral studies shows that the good transmittance in the Vis-NIR region with cut-off wavelength (317 and 415 nm) and optical band gap of 2.43 eV of the grown MMPI crystal. The photoluminescence spectrum exhibits a strong peak at 508 nm (2.43 eV), indicating green emission. The chemical etching study reveals the presence of a rectangular etch pit pattern in the crystal surface, and the calculated etch pit density value is found to be 2.53 × 103 cm−2. The surface features of the grown MMPI crystal are analyzed through the AFM technique; surface kurtosis (Sku) and surface skewness (Ssk) values suggest that the surface is nearly flat. The presence of NLDs and microcrystals in the title crystal was observed from SEM analysis. The various elements presented in the grown material were analyzed by EDAX analysis. A hirshfeld surface study was performed to investigate the intermolecular interactions of 3D and 2D fingerprint plots, such as H-H, I-H, and O-H interactions are strong in the MMPI compound. The title chemical of the HOMO-LUMO energy gap is 2.50745 eV. In the MMPI molecule, the ESP map revealed that the negative regions are located around the iodide atom, and the positive regions are spread throughout the hydrogen atoms of the pyridinium ring and methoxy group. The grown MMPI crystal reveals that the material appears centrosymmetric in nature. Open aperture Z-scan analyses the reverse saturation absorption, while closed aperture Z-scan investigates the negative nonlinearity that is self-defocusing in the title crystal. So, all the nonlinear parameter values were calculated. Its suitability for non-linear optical devices like optical limiting and optical switching is confirmed by the third-order nonlinear properties.

Supplementary Materials

The following supporting information can be downloaded at: https://www.mdpi.com/article/10.3390/cryst13010138/s1, Table S1: Roughness parameters of the MMPI crystal surface; Figure.S1: EDAX spectra of MMPI crystal; Table S2: EDAX in elemental composition of MMPI; Figure S2: 2D fingerprint plot for various contributions for MMPI; Figure S3: MEP surface analysis of MMPI compound. All authors have read and agreed to the published version of the manuscript.

Author Contributions

Conceptualization, N.K. and K.S.; methodology, investigation, resources, data curation, writing—original draft preparation, N.K.; writing—review and editing, K.S.; visualization, N.K.; supervision, K.S.; project administration, N.K. All authors have read and agreed to the published version of the manuscript.

Funding

This research received no external funding.

Data Availability Statement

The data mentioned in this article are available on request from the corresponding author.

Acknowledgments

The authors thank VIT management for their constant support and encouragement. The author also thanks SC-XRD at VIT, Vellore.

Conflicts of Interest

The authors declare no conflict of interest.

References

  1. Bakalska, R.; Todorova, M.; Sbirkova, H.; Shivachev, B.; Kolev, T. Comparing of the Crystal Structure and Spectroscopic Properties of Some Stilbazolium Dyes with Enlarged π-Conjugated System I. Chromophores with p-Dimethylamino Group. Dye. Pigment. 2017, 136, 919–929. [Google Scholar] [CrossRef]
  2. Zhang, C.; Song, Y.; Wang, X. Correlations between Molecular Structures and Third-Order Non-Linear Optical Functions of Heterothiometallic Clusters: A Comparative Study. Coord. Chem. Rev. 2007, 251, 111–141. [Google Scholar] [CrossRef]
  3. Prasad, P.N.; Williams, D.J. Nonlinear Optical Effects in Molecules and Polymers; Wiley: New York, NY, USA, 1991. [Google Scholar]
  4. Ashcroft, C.M.; Cole, J.M.; Lin, T.; Lee, C.; Malaspina, L.A.; Kwon, O.; Malaspina, L.A.; Kwon, O. Multiphase Structural Models and Hyperpolarizability Calculations Explain Second-Order Nonlinear Optical Properties of Stilbazolium Ions Optical Properties of Stilbazolium Ions. Phys. Rev. Mater. 2020, in press. [Google Scholar] [CrossRef]
  5. Ravindra, H.J.; Kiran, A.J.; Dharmaprakash, S.M.; Satheesh Rai, N.; Chandrasekharan, K.; Kalluraya, B.; Rotermund, F. Growth and Characterization of an Efficient Nonlinear Optical D-π-A-π-D Type Chalcone Single Crystal. J. Cryst Growth 2008, 310, 4169–4176. [Google Scholar] [CrossRef]
  6. Schneider, A.; Biaggio, I.; Günter, P. Terahertz-Induced Lensing and Its Use for the Detection of Terahertz Pulses in a Birefringent Crystal. Appl. Phys. Lett. 2004, 84, 2229–2231. [Google Scholar] [CrossRef]
  7. Yin, J.; Li, L.; Yang, Z.; Jazbinsek, M.; Tao, X.; Günter, P.; Yang, H. A New Stilbazolium Salt with Perfectly Aligned Chromophores for Second-Order Nonlinear Optics: 4-N,N-Dimethylamino-4′-N’-Methyl- Stilbazolium 3-Carboxy-4-Hydroxybenzenesulfonate. Dye. Pigment. 2012, 94, 120–126. [Google Scholar] [CrossRef]
  8. Liu, X.; Yang, Z.; Wang, D.; Cao, H. Molecular Structures and Second-Order Nonlinear Optical Properties of Ionic Organic Crystal Materials. Crystals 2016, 6, 158. [Google Scholar] [CrossRef] [Green Version]
  9. Senthil, K.; Kalainathan, S.; Ruban Kumar, A. Growth and Characterization of an Organic Single Crystal: 2-[2-(4-Diethylamino-Phenyl)-Vinyl]-1-Methyl-Pyridinium Iodide. Spectrochim. Acta A Mol. Biomol. Spectrosc. 2014, 125, 335–344. [Google Scholar] [CrossRef]
  10. Choi, E.Y.; Jazbinsek, M.; Jeong, J.H.; Kwon, O.P. Effect of Ionic Organic Additives for the Growth of Polyene Crystals Synthesized by Knoevenagel Condensations. CrystEngComm 2012, 14, 1045–1048. [Google Scholar] [CrossRef]
  11. Ermer, S.; Lovejoy, S.M.; Leung, D.S.; Warren, H.; Moylan, C.R.; Twieg, R.J. Synthesis and Nonlinearity of Triene Chromophores Containing the Cyclohexene Ring Structure. Mater. Res. Soc. Symp. Proc. 1997, 488, 243–254. [Google Scholar] [CrossRef]
  12. Zhang, Y.; Li, H.; Xi, B.; Che, Y.; Zheng, J. Growth and Characterization of L-Histidine Nitrate Single Crystal, a Promising Semiorganic NLO Material. Mater. Chem. Phys. 2008, 108, 192–195. [Google Scholar] [CrossRef]
  13. Sagayaraj, P.; Selvakumar, S. Studies on the Growth and Characterization of Novel Organometallic NLO Crystal: Cd(HCOO) 2.2CS(NH 2) 2. J. Mater. Sci. Mater. Electron. 2009, 20, 299–302. [Google Scholar] [CrossRef]
  14. Chandramohan, A.; Bharathikannan, R.; Kandavelu, V.; Chandrasekaran, J.; Kandhaswamy, M.A. Synthesis, Crystal Growth, Structural, Thermal and Optical Properties of Naphthalene Picrate an Organic NLO Material. Spectrochim Acta A Mol. Biomol Spectrosc 2008, 71, 755–759. [Google Scholar] [CrossRef]
  15. Sheldrick, G.M. SHELXT—Integrated Space-Group and Crystal-Structure Determination. Acta Cryst. A 2015, 71, 3–8. [Google Scholar] [CrossRef] [Green Version]
  16. Kaminsky, W. WinXMorph: A Computer Program to Draw Crystal Morphology, Growth Sectors and Cross Sections with Export Files in VRML V2.0 Utf8-Virtual Reality Format. J. Appl. Cryst. 2005, 38, 566–567. [Google Scholar] [CrossRef] [Green Version]
  17. Kaminsky, W. From CIF to Virtual Morphology Using the WinXMorph Program. J. Appl. Cryst. 2007, 40, 382–385. [Google Scholar] [CrossRef]
  18. Jerald Vijay, R.; Melikechi, N.; Thomas, T.; Gunaseelan, R.; Antony Arockiaraj, M.; Sagayaraj, P. Growth, Structural, Optical and Thermal Properties of Potential THz Material: N, N-Dimethylamino-N’-Methylstilbazolium 4-Styrenesulphonate. J. Cryst. Growth 2012, 338, 170–176. [Google Scholar] [CrossRef]
  19. Arunadevi, N.; Kanchana, P.; Mehala, M.; Shanmuga Sundari, S. Optical and Biological Characteristics of Novel Organic Single Crystal 4-Chloro N-Methyl 4-Stilbazolium Tosylate. Mater. Today Proc. 2019, 33, 2244–2250. [Google Scholar] [CrossRef]
  20. Antony, P.; Raj, A.A.; Sundaram, S.J.; Margaret, S.M.; Dominique, S.; Lawrence, N.; Sagayaraj, P. Scientific Research in Science and Technology (IJSRST) Growth and Characterization of A Novel Organic Stilbazolium Family Single Crystal: 4-(4-Methoxystyryl)-1-Methylpyridinium 4-Chlorobenzenesulfonate. Int. J. Sci. Res. I 2017, 3, 33–37. [Google Scholar]
  21. Krishna Kumar, M.; Sudhahar, S.; Bhagavannarayana, G.; Mohan Kumar, R. Crystal Growth, Spectral, Structural and Optical Studies of π-Conjugated Stilbazolium Crystal: 4-Bromobenzaldehyde-4′-N′-Methylstilbazolium Tosylate. Spectrochim. Acta A Mol. Biomol. Spectrosc. 2014, 125, 79–89. [Google Scholar] [CrossRef]
  22. Senthil, K.; Kalainathan, S.; Ruban Kumar, A. Effect of Additives on the Large-Size Growth of 4-N,N-Dimethylamino-4-N-Methyl Stilbazolium Naphthalene-2-Sulfonate (DSNS) Single Crystal: An Efficient Stilbazolium Derivative NLO Crystal with Potential Terahertz Wave Properties. CrystEngComm 2014, 16, 9847–9856. [Google Scholar] [CrossRef]
  23. Suriya, M.; Mani Maran, M.; Boaz, B.M.; Gunasekaran, B.; Kalainathan, S.; Murugesan, K.S. Crystal Growth, Structural, Optical and Piezoelectric Investigations on Novel B4AAT (Bis-4-Acetylanilinium Tartrate): A Phase Matchable Second and Third-Order NLO Single Crystal for Optoelectronic and Nonlinear Optical Device Applications. Opt. Mater. 2020, 108, 110042. [Google Scholar] [CrossRef]
  24. Dalal, J.; Sinha, N.; Yadav, H.; Kumar, B. Structural, Electrical, Ferroelectric and Mechanical Properties with Hirshfeld Surface Analysis of Novel NLO Semiorganic Sodium p-Nitrophenolate Dihydrate Piezoelectric Single Crystal. RSC Adv. 2015, 5, 57735–57748. [Google Scholar] [CrossRef]
  25. Jauhar, R.M.; Kalainathan, S.; Murugakoothan, P. Three Dimensional Organic Framework of 2-Amino 4, 6 Dimethoxypyrimidine p-Toluenesulfonic Acid Monohydrate: Synthesis, Single Crystal Growth and Its Properties. J. Cryst. Growth 2015, 424, 42–48. [Google Scholar] [CrossRef]
  26. Zhao, T.; Ji, S.; Zhong, D.; Teng, F.; Ullah, S.; Hu, S.; Tang, J.; Teng, B. Synthesis, Growth and Characterization of N, N-Dimethyl-4-[2-(2-Quinolyl) Vinyl] Aniline (DADMQ): An SHG Material for NLO Applications. Optik 2020, 224, 165323. [Google Scholar] [CrossRef]
  27. Kumar, M.K.; Sudhahar, S.; Bhagavannarayana, G.; Kumar, R.M. Crystal Growth, Structural and Optical Properties of an Organic Ion-Complex Crystal: 4-N, N-Dimethylamino-4′-N’-Methylstilbazolium Iodide. Optik 2014, 125, 5641–5646. [Google Scholar] [CrossRef]
  28. Sudhahar, S.; Krishna Kumar, M.; Sornamurthy, B.M.; Mohan Kumar, R. Synthesis, Crystal Growth, Structural, Thermal, Optical and Mechanical Properties of Solution Grown 4-Methylpyridinium 4-Hydroxybenzoate Single Crystal. Spectrochim Acta A Mol. Biomol. Spectrosc. 2014, 118, 929–937. [Google Scholar] [CrossRef]
  29. Nunzi, F.; Fantacci, S.; Cariati, E.; Tordin, E.; Casati, N.; MacChi, P. Stabilization through P-Dimethylaminobenzaldehyde of a New NLO-Active Phase of [E-4-(4-Dimethylaminostyryl)-1-Methylpyridinium] Iodide: Synthesis, Structural Characterization and Theoretical Investigation of Its Electronic Properties. J. Mater. Chem. 2010, 20, 7652–7660. [Google Scholar] [CrossRef]
  30. Mehkoom, M.; Faizan, M.; Afzal, S.M.; Ahmad, S. Z-Scan Screening of Proton-Shifted Monohydrated Organic Salt: The Linear, Nonlinear, and Optical Limiting Characteristics for Photonic Applications. J. Mater. Sci. Mater. Electron. 2021, 32, 28750–28764. [Google Scholar] [CrossRef]
  31. Rajesh Kumar, T.; Jeyasekaran, R.; Ravi Kumar, S.M.; Vimalan, M.; Sagayaraj, P. Surface Studies on Bimetallic Thiocyanate Ligand Based Single Crystals of MnHg(SCN) 4, CdHg(SCN) 4 and ZnCd(SCN) 4. Appl. Surf. Sci 2010, 257, 1684–1691. [Google Scholar] [CrossRef]
  32. Baig, M.I.; Anis, M.; Kalainathan, S.; Babu, B.; Muley, G.G. Laser Induced Optical and Microscopic Studies of Salicylic Acid Influenced KH2PO4 Crystal for Photonic Device Applications. Mater. Technol. 2017, 32, 560–568. [Google Scholar] [CrossRef]
  33. Antony Raj, A.; John Sundaram, S.; Gunaseelan, R.; Sagayaraj, P. Bulk Size Crystal Growth, Spectroscopic, Dielectric and Surface Studies of 4-N,N-Dimethylamino-4-N′-Methylstilbazolium m-Nitrobenzenesulfonate (DSMNS): A Potential THz Crystal of Stilbazolium Family. Spectrochim. Acta A Mol. Biomol. Spectrosc. 2015, 149, 957–964. [Google Scholar] [CrossRef] [PubMed]
  34. Mukerji, S.; Kar, T. Etch Pit Study of Di!Erent Crystallographic Faces of L-Arginine Hydrobromide Monohydrate (LAHBr) in Some Organic Acids. J. Cryst. Growth 1999, 204, 341–347. [Google Scholar] [CrossRef]
  35. Precursor, X.; Route, M.X.P. Synthesis and Characterization of Phosphorescent Cyclometalated Platinum Complexes. Inorg. Chem. 1992, 2, 65–84. [Google Scholar]
  36. Abeens, M.; Muruganandhan, R.; Thirumavalavan, K.; Kalainathan, S. Surface Modification of AA7075 T651 by Laser Shock Peening to Improve the Wear Characteristics. Mater. Res. Express 2019, 6, 066519. [Google Scholar] [CrossRef]
  37. Sivakumar, T.; Anna Lakshmi, M.; Anbarasan, R.; Eniya, P.; Vignesh, S.; Kalyana Sundar, J. Exploring the Influence of CdCl2 on the Nonlinear Properties of 4–N, N–Dimethylamino–4–N–Methyl–Stilbazolium Tosylate (DAST) Crystal for Optoelectronic Applications. Mater. Technol. 2021, 37, 618–630. [Google Scholar] [CrossRef]
  38. Spackman, P.R.; Turner, M.J.; McKinnon, J.J.; Wolff, S.K.; Grimwood, D.J.; Jayatilaka, D.; Spackman, M.A. CrystalExplorer: A Program for Hirshfeld Surface Analysis, Visualization and Quantitative Analysis of Molecular Crystals. J. Appl. Cryst. 2021, 54, 1006–1011. [Google Scholar] [CrossRef]
  39. Dhanalakshmi, M.; Balakrishnan, C.; Rafi Ahamed, S.; Vinitha, G.; Parthiban, S. Synthesis, Structural Characterization, Hirshfeld Surface Analysis and Third-Order Nonlinear Optical Properties of Schiff Bases Derived from 1,1-Diphenylmethylamine. J. Mol. Struct. 2022, 1251, 131942. [Google Scholar] [CrossRef]
  40. Madhankumar, S.; Muthuraja, P.; Dhandapani, M. Structural Characterization, Quantum Chemical Calculations and Hirshfeld Surface Analysis of a New Third Order Harmonic Organic Crystal: 2-Amino-4-Methylpyridinium Benzilate. J. Mol. Struct. 2020, 1201, 127151. [Google Scholar] [CrossRef]
  41. Fatima, A.; Singh, M.; Agarwal, N.; Verma, I.; Butcher, R.J.; Siddiqui, N.; Javed, S. Spectroscopic, Molecular Structure, Electronic, Hirshfeld Surface, Molecular Docking, and Thermodynamic Investigations of Trans-4-Hydroxy-L-Proline by DFT Method. J. Mol. Liq. 2021, 343, 117549. [Google Scholar] [CrossRef]
  42. Karnan, C.; Rhoda, J.C.; Manikandan, A.; Vinitha, G. Supramolecular Assembly of Morpholin-4-Ium Hydroxy(Diphenyl)Acetate—Structural, Spectral and Nonlinear Optical Analyses. J. Mol. Struct. 2022, 1250, 131719. [Google Scholar] [CrossRef]
  43. Anitha, K.; Subha, M.; Elakkiya, M.T. Synthesis, Growth, Structural, Optical, Thermal and NLO Studies of New Organic Single Crystal: 3-Hydroxy Pyridinium 2-Hydroxy Benzoate. J. Mol. Struct. 2021, 1244, 130850. [Google Scholar] [CrossRef]
  44. Ramesh, K.S.; Saravanabhavan, M.; Rajkumar, M.; Edison, D.; Sekar, M.; Muhammad, S.; Al-Sehemi, A.G. Synthesis, Growth, Structural, Thermal, Third Order Nonlinear and Computational Studies of Organic Single Crystal: 2-Amino-4-Picolinium 2-Chloro-4-Nitrobenzoate. Opt. Mater. 2019, 96, 109341. [Google Scholar] [CrossRef]
  45. Mary, Y.S.; Panicker, C.Y.; Sapnakumari, M.; Narayana, B.; Sarojini, B.K.; Al-Saadi, A.A.; van Alsenoy, C.; War, J.A.; Fun, H.K. Infrared Spectrum, Structural and Optical Properties and Molecular Docking Study of 3-(4-Fluorophenyl)-5-Phenyl-4,5-Dihydro-1H-Pyrazole-1-Carbaldehyde. Spectrochim. Acta A Mol. Biomol. Spectrosc. 2015, 138, 529–538. [Google Scholar] [CrossRef]
  46. Tamer, Ö.; Şimşek, M.; Avcı, D.; Atalay, Y. Static/Dynamic First and Second Order Hyperpolarizabilities, Optimized Structures, IR, UV–Vis, 1H and 13C NMR Spectra for Effective Charge Transfer Compounds: A DFT Study. Spectrochim. Acta A Mol. Biomol. Spectrosc. 2023, 286, 122005. [Google Scholar] [CrossRef]
  47. Saraswathi, V.; Agilan, S.; Muthukumarasamy, N.; Gupta, V.K.; Suresh, M.; Peulakumari, P.; Velauthapillai, D. Synthesis, Crystal Structure, Hirshfeld Surface, Nonlinear Optical Properties and Computational Studies of Schiff Based (E)-N’-(2,4-Dimethoxybenzylidene) Benzohydrazide Single Crystals for Optoelectronic Applications. Opt. Quantum. Electron. 2022, 54, 758. [Google Scholar] [CrossRef]
  48. Nivetha, K.; Kalainathan, S.; Yamada, M.; Kondo, Y.; Hamada, F. Synthesis, Growth, Structure and Characterization of 1-Ethyl-2-(2-p-Tolyl-Vinyl)-Pyridinium Iodide (TASI)—An Efficient Material for Third-Order Nonlinear Optical Applications. Mater. Chem. Phys. 2017, 188, 131–142. [Google Scholar] [CrossRef]
  49. Thilak, T.; Ahamed, M.B.; Vinitha, G. Third Order Nonlinear Optical Properties of Potassium Dichromate Single Crystals by Z-Scan Technique. Optik 2013, 124, 4716–4720. [Google Scholar] [CrossRef]
  50. Sheik-Bahae, M.; Said, A.A.; Wei, T.H.; Hagan, D.J.; van Stryland, E.W. Sensitive Measurement of Optical Nonlinearities Using a Single Beam. IEEE J. Quantum. Electron. 1990, 26, 760–769. [Google Scholar] [CrossRef] [Green Version]
  51. Subashini, A.; Kumaravel, R.; Leela, S.; Evans, H.S.; Sastikumar, D.; Ramamurthi, K. Synthesis, Growth and Characterization of 4-Bromo-4′chloro Benzylidene Aniline—A Third Order Non Linear Optical Material. Spectrochim. Acta A Mol. Biomol Spectrosc. 2011, 78, 935–941. [Google Scholar] [CrossRef]
  52. Sun, Z.; Chen, T.; Cai, N.N.; Chen, J.W.; Li, L.; Wang, Y.; Luo, J.; Hong, M. Synthesis, Growth and Characterization of a Third-Order Nonlinear Optical Crystal Based on the Borate Ester with Sodium Supporting Its Structural Framework. N. J. Chem. 2011, 35, 2804–2810. [Google Scholar] [CrossRef]
  53. Cassano, T.; Tommasi, R.; Babudri, F.; Cardone, A.; Farinola, G.M.; Naso, F. High. Third-Order Nonlinear Optical Susceptibility in New Fluorinated Poly(p-Phenylenevinylene) Copolymers Measured with the Z-Scan Technique. Opt. Lett. 2002, 27, 2176–2178. [Google Scholar]
  54. Karuppasamy, P.; Kamalesh, T.; Senthil Pandian, M.; Ramasamy, P.; Sunil, V.; Chaudhary, A.K. Bulk Crystal Growth, Crystalline Perfection and Optical Homogeneities of 2AP4N Single Crystals for Second and Third Order Frequency Conversion and Terahertz (THz) Device Applications. Opt. Mater. 2021, 118, 131–142. [Google Scholar] [CrossRef]
  55. Krishna Kumar, M.; Sudhahar, S.; Pandi, P.; Bhagavannarayana, G.; Mohan Kumar, R. Studies of the Structural and Third-Order Nonlinear Optical Properties of Solution Grown 4-Hydroxy-3-Methoxy-4′-N′-Methylstilbazolium Tosylate Monohydrate Crystals. Opt. Mater. 2014, 36, 988–995. [Google Scholar] [CrossRef]
  56. Antony Raj, A.; Gunaseelan, R.; Sagayaraj, P. Investigation on Third Order Nonlinear Optical, Electrical and Surface Properties of Organic Stilbazolium Crystal of 4-N,N-Dimethylamino-N′-Methylstilbazolium p-Methoxybenzenesulfonate. Opt. Mater. 2014, 38, 102–107. [Google Scholar] [CrossRef]
  57. Karuppanan, N.; Kalainathan, S. A New Nonlinear Optical Stilbazolium Family Crystal of (E)-1-Ethyl-2-(4-Nitrostyryl) Pyridin-1-Ium Iodide: Synthesis, Crystal Structure, and Its Third-Order Nonlinear Optical Properties. J. Phys. Chem. C 2018, 122, 4572–4582. [Google Scholar] [CrossRef]
Scheme 1. Synthesis of MMPI compound.
Crystals 13 00138 sch001
Figure 1. Solubility curve of MMPI.
Crystals 13 00138 g001
Figure 2. The grown MMPI crystal.
Crystals 13 00138 g002
Figure 3. ORTEP Diagram for MMPI.
Crystals 13 00138 g003
Figure 4. Packing diagram for MMPI.
Crystals 13 00138 g004
Figure 5. Morphology of MMPI crystal.
Crystals 13 00138 g005
Figure 6. 1H Nuclear magnetic resonance for MMPI crystal.
Crystals 13 00138 g006
Figure 7. 13C NMR for MMPI crystal.
Crystals 13 00138 g007
Figure 8. Fourier transform infrared spectroscopy spectrum of MMPI.
Crystals 13 00138 g008
Figure 9. (a). UV–Vis–NIR transmittance and absorbance spectrum, (b) Tauc’s plot of MMPI.
Crystals 13 00138 g009
Figure 10. (a) PL spectrum of MMPI crystal (b) band gap of MMPI and (c) CIE chromaticity plot of MMPI.
Crystals 13 00138 g010
Figure 11. The X* midpoint on the X-axis was represented by 3.095 µm, while the Y* midpoint on the Y-axis was represented by the value 3.095 µm. (a) shows the AFM 3D and (b) AFM 2D images of MMPI.
Crystals 13 00138 g011
Figure 12. (a) MMPI crystal surface, (b,c) Etched for 15 s and 30 s.
Crystals 13 00138 g012
Figure 13. (a,b) 20 µm and 200 µm SEM micrograph of grown MMPI crystal.
Crystals 13 00138 g013
Figure 14. HS analysis of MMPI crystal mapped with (a) dnorm, (b) shape index, (c) curvedness, (d) fragment patch.
Crystals 13 00138 g014
Figure 15. (a,b) Molecular orbital HOMO and LUMO diagram of MMPI.
Crystals 13 00138 g015
Figure 16. Open aperture Z-scan trace of MMPI.
Crystals 13 00138 g016
Figure 17. Closed aperture Z-scan trace of MMPI.
Crystals 13 00138 g017
Table 1. Data collection and structure refinement for MMPI crystal.
CCDC No2131739
Chemical formulaC15H16INO
Formula weight353.19 g/mol
Temperature301(2) K
Wavelength0.71073 Å
Crystal size0.300 × 0.320 × 0.350 mm
Crystal habitgold block
Crystal systemMonoclinic
Space groupP 1 21/c 1
Unit cell dimensionsa = 6.8601(6) Å
b = 19.7111(16) Å
c = 10.8400(8) Å
α = 90°
β = 91.207(3)°
γ = 90°
Volume1465.5(2) Å3
Z4
Density (calculated)1.601 g/cm3
Absorption coefficient2.174 mm−1
F(000)696
Theta range for data collection2.07 to 28.30°
Index ranges−9 ≤ h ≤ 9, −26 ≤ k ≤ 26, −14 ≤ l ≤ 14
Reflections collected39,250
Independent reflections3617 [R(int) = 0.0412]
Coverage of independent reflections99.4%
Absorption correctionMulti-Scan
Max. and min. transmission0.5620 and 0.5170
Structure solution techniquedirect methods
Structure solution programSHELXT 2018/2 [15]
Function minimizedΣw(Fo2 − Fc2)2
Data/restraints/parameters3617/0/166
Goodness-of-fit on F21.123
Δ/σmax0.001
Final R indices2505 data; I > 2σ(I)R1 = 0.0589, wR2 = 0.1546
all dataR1 = 0.0853, wR2 = 0.1715
Weighting schemew = 1/[σ2(Fo2) + (0.0632P)2 + 3.5086P]
where P = (Fo2 + 2Fc2)/3
Extinction coefficient0.0250(30)
Largest diff. peak and hole0.774 and −0.567 eÅ−3
R.M.S. deviation from mean0.144 eÅ−3
Table 2. Selected the Bond lengths (Å) and Bond angles (°) for MMPI crystal.
Bond Lengths (Å)Bond Angles (°)
AtomsLengthAtomsAngle
O1-C101.359(7)C10-O1-C15118.1(5)
N1-C31.331(7)C3-N1-C14120.5(5)
N1-C141.479(7)C5-C1-C2117.2(5)
C1-C21.378(9)C2-C1-C6125.3(6)
C2-C31.377(9)N1-C3-C2119.3(5)
C6-C71.295(9)C4-C5-C1119.9(5)
C8-C131.361(8)C6-C7-C8125.0(6)
C9-C101.380(8)C13-C8-C7115.8(6)
C11-C121.362(9)C10-C9-C8119.5(5)
O1-C151.437(9)O1-C10-C11114.8(5)
N1-C41.345(7)C12-C11-C10120.0(6)
C1-C51.378(9)C8-C13-C12120.6(6)
C1-C61.487(8)C3-N1-C4120.3(5)
C4-C51.358(8)C4-N1-C14119.2(5)
C7-C81.471(9)C5-C1-C6117.5(5)
C8-C91.421(8)C3-C2-C1121.6(6)
C10-C111.394(8)N1-C4-C5121.7(6)
C12-C131.383(9)C7-C6-C1123.3(6)
--C13-C8-C9119.4(5)
--C9-C8-C7124.8(5)
--O1-C10-C9125.4(5)
--C9-C10-C11119.8(5)
--C11-C12-C13120.8(6)
Table 3. Selected torsion angle for MMPI crystal.
NumberAtom1Atom2Atom3Atom4Torsion
1C15O1C10C9−1.92
2C15O1C10C11178.44
3C10O1C15H15A−169.67
4C10O1C15H15B70.33
5C10O1C15H15C−49.67
6C4N1C3C2−0.62
7C4N1C3H3179.38
8C14N1C3C2178.93
9C14N1C3H3−1.07
10C3N1C4H4−178.82
Table 4. Proton and carbon NMR chemical shift of MMPI crystal.
Chemical Shift (ppm)Assignment
Δ − 2.5 ppmDMSO-d6 solvent
δ − 3.380 ppmwater in DMSO-d6
δ − 3.833 ppmmethoxy group (O-CH3) in the aromatic ring
δ − 4.264 ppmN-CH3
δ − 7.031 and 7.052 ppmaromatic ring in the methoxy group
δ −7.322 and 7 339 ppmCH=CH
δ − 7.396, 7.416 and 7.435 ppmone hydrogen atom of the methoxy group
δ − 7.539, and 7.580 ppmaromatic ring in the hydrogen atom
δ − 7.969 and 8.010 ppmMethoxy group—hydrogen atom
δ − 8.217, 8.233, 8.862 and 8.878 ppm(C5H4N)
δ − 31.16 and 47.44 ppmMethoxy group—carbon atoms
δ − 24.06, 145.63 and 152.88pyridine ring carbon atoms
δ − 55.78, 113.26, 116.78, 121.32, 130.66, 137.02, 140.97, 160.18, and 206.95 ppmvinyl group and aromatic ring carbon atoms
Table 5. FT-IR assignments of MMPI crystal.
Wavenumber (cm−1)Assignment
3010.88 cm−1 and 2835.36 cm−1Aromatic C–H stretching and alkyl C–H stretching
1624.06 cm−1CH=CH stretching
1581.63 and 1517.98 cm−1Vinyl group of C–C=C–C stretching
1432 cm−1CH3 bending
1336.67cm−1C–N stretching mode
1028.06 cm−1O–CH3 stretching vibration
960.55 cm−1C–H stretching vibration of the pyridinium ring
829.39 cm−11, 4 disubstitution in the aromatic ring
785.03 cm−1 and 715.59 cm−1C–H out-plane bending vibration
597.93, 557.43, and 507.28 cm−1phenyl ring of the C–C–C mode
Table 6. Comparing of (ꭓ3) of the MMPI crystal values in few stilbazolium derivative in organic crystal.
Crystal Name3 Values (esu)
MMPI (present work)7.87636 × 10⁻⁶ esu
VMST [55]9.6963 × 10⁻¹² esu
DSMOS [56]5.05 × 10⁻⁸ esu
NSPI [57]9.09 × 10⁻⁷ esu
Disclaimer/Publisher’s Note: The statements, opinions and data contained in all publications are solely those of the individual author(s) and contributor(s) and not of MDPI and/or the editor(s). MDPI and/or the editor(s) disclaim responsibility for any injury to people or property resulting from any ideas, methods, instructions or products referred to in the content.

