Article

Experiments and Crystal Plasticity Finite Element Simulations of Texture Development during Cold Rolling in a Ti-15V-3Cr-3Sn-3Al Alloy

1
Department of Metallurgical and Materials Engineering, Visvesvaraya National Institute of Technology (VNIT), South Ambazari Road, Nagpur 440010, Maharashtra, India
2
College of Engineering and Technology, American University of the Middle East, Egaila 54200, Kuwait
*
Author to whom correspondence should be addressed.
Crystals 2023, 13(1), 137; https://doi.org/10.3390/cryst13010137
Submission received: 22 December 2022 / Revised: 8 January 2023 / Accepted: 9 January 2023 / Published: 12 January 2023
(This article belongs to the Special Issue Feature Papers in Crystalline Metals and Alloys in 2022–2023)

Abstract

:
The effect of deformation on the evolution of crystallographic texture in a Ti-15V-3Cr-3Sn-3Al (Ti-15333) alloy after unidirectional cold rolling was studied experimentally and numerically in the present investigation. An optical microscope (OM) and scanning electron microscope (SEM) were used to study the microstructures, while the crystallographic texture after cold rolling was studied with X-ray diffraction. The rolling process (deformation) was simulated with PRISMS-plasticity, open-source crystal plasticity software. Micro-indentations were performed on the initial solution-annealed sample with an equiaxed grain structure. The experimentally obtained load–displacement curve for a particular grain (orientation-φ1, Φ, φ2 = 325.2°, 18.0°, 66.2° (Bunge notation)) was compared with the crystal plasticity finite element method (FEM)-simulated load–displacement curve to obtain the calibration parameters. The obtained parameters, along with the experimental stress–strain curve, were used to recalibrate the PRISMS-plasticity software for the rolling simulations of the Ti-15333 alloy. It was observed that the γ-(normal direction, ND//<111>) and α-(rolling direction, RD//<110>) fibers strengthened with cold rolling, experimentally as well as numerically. The simulated orientation distribution functions (ODFs) matched reasonably well with those obtained from the experiments. The average values of von Mises stress and von Mises strain increased with an increase in deformation.

1. Introduction

Titanium (Ti) alloys are generally classified into several types depending on the presence of different phases in the microstructure, such as α (hcp) alloys, β (bcc) alloys and α+β (hcp+bcc) alloys. β is a higher-temperature phase of titanium, and to obtain it at room temperature, a sufficient amount of β-stabilizing elements must be added and solution annealing should be carried out above the β transus temperature [1]. These alloys (termed as meta-stable βTi alloys) are versatile with low density, high resistance to corrosion and good tensile and fatigue properties, and hence, they find extensive use in aerospace and biomedical industries [2,3,4]. Their main advantages over single-phase α-Ti alloys are their increased ductility and cold workability, which are mostly owing to the single-phase bcc β microstructure [5]. The alloy considered in this work is a meta-stable β Ti alloy, i.e., Ti-15V-3Cr-3Sn-3Al alloy (abbreviated as Ti-15333 hereafter), which usually finds applications in the aerospace industry. Because structural applications involve the thin sheets of the alloy, it is critical to investigate the alloy’s behavior during cold rolling. β-Ti alloys accommodate strain during deformation via different mechanisms, such as slip, mechanical twinning ({112}<111>type or {332}<113>) and stress- or strain-induced martensite formation [6,7,8]. The microstructure development during the cold rolling of the Ti-15333 alloy has been studied by various authors [9,10,11,12,13]. It was shown that Ti-15333 alloys develop α-(rolling direction, RD//<110>) and γ-(normal direction, ND//<111>) fibers, i.e., the texture components/fibers, which usually occur during deformation in bcc materials. Low-carbon steels also develop α- and γ-fibers after unidirectional cold rolling [14,15,16,17,18,19]. γ-fiber saturates typically after 70% cold rolling reduction, while α fiber continues to strengthen with the increasing cold rolling reduction. Shear bands (non-crystallographic and cutting across many grains) were also observed in the 80% cold-rolled Ti-15V-3Sn-3Cr-3Al alloy [20]. The deformed sample showed partial α-fiber with maximum intensity centered around {001}<110>. Ghaderi et al. [21] studied the cold rolling and annealing behavior of a meta-stable Ti-5Al-5V-5Mo-3Cr alloy. Strong α-and γ-fibers developed after 40% cold rolling.
To understand the micro-mechanism(s) of deformation and texture evolution, simulations are inevitable. In general, these simulations fall into two categories—mean-field methods [22,23,24,25,26] and full-field methods [25,26,27,28,29].The identification of constitutive parameters needs to be performed for both mean-field and full-field methods to simulate the deformation behavior of the selected material accurately. Full-field CP modeling, taking both grain microstructure and crystallographic texture as input, can guarantee stress equilibrium and strain compatibility among grains. It has an advantage over the mean-field ones in terms of considering the authentic multiphase/polycrystalline microstructures and describing the stress/strain partitions among phases and grains. For full-field methods, characterization using macro-scale stress/strain curves [30,31], inverse methodology involving nano-indentation of individual grains of polycrystalline samples with various orientations [32], and models that predict parameters considering single crystals are used to obtain the plasticity constitutive parameters as inputs into the simulations. The finite element (FE) method with different crystal plasticity frameworks has been used for different tests, including nano-indentation tests [33,34,35,36,37,38,39]. For instance, Chakraborty et al. [40] adjusted the calculated constitutive parameters of fcc materials by comparing the crystal plasticity FE (CPFE) method simulated load–displacement curves with those from the experiments of the indentation of single crystals using a Nelder–Mead [41] optimization scheme. A similar study on α-Ti was carried out by Zambaldi et al. [42] and Lin et al. [43] for a Ti-12 wt% Mo alloy by EBSD. Demiral et al. [38,44] performed indentation experiments and simulations using an enhanced crystal plasticity model incorporating geometrically necessary dislocations (GND) to study the deformation behavior of Ti-15333 micro-pillars, where the evolution of the strain gradients was characterized. Gerday et al. [45] investigated the effect of various factors, including the orientation of indentation and the single crystal, elastic parameters, indenter tip, etc., for a β-Ti alloy. The determination of constitutive parameters for bcc materials generally follows different expressions in comparison with fcc materials, as described in detail by Yalcinkaya et al. [46], with the implementation of additional terms to the slip law. In many studies of bcc materials, twinning was not observed experimentally and, hence, is usually neglected in the simulations.
Constitutive parameters are important as they are required to predict the behavior of a material under different boundary and loading conditions. This study aims to investigate the microstructure and texture evolution for a cold-rolled Ti-15333 alloy experimentally and simulate it with PRISMS software [47]. It is an open-source, parallel, scalable simulation software. Simulations of the load–displacement curve for orientation during indentation and stress–strain curve CPFEM simulations during tensile deformation were used to validate the constitutive/plasticity parameters for deformation texture simulation during rolling.

2. Materials and Methods

2.1. Material and Processing

The chemical composition of the Ti-15333 alloy used in the present investigation was determined by optical emission spectroscopy (OES) and is given in Table 1. The as-received (AR) sheet was 4 mm thick, and before cold rolling, it was solution-annealed (SA) at 800 °C for 1 h to obtain uniform equiaxed grain size [20]. The average linear intercept grain size in the long transverse plane (plane containing RD and ND) for the SA sheet was 75 ± 3 μm. Afterward, the SA sheet was cut into smaller pieces of 5 cm (along transverse direction TD) × 7 cm (along RD) for unidirectional cold rolling. Cold rolling was performed along RD to obtain thickness reduction in the range of 10–40%. The sheet was 3.6 mm, 3.2 mm, 2.8 mm and 2.4 mm thick (along ND) after 10, 20, 30 and 40% cold rolling respectively. The average true strain (dimensionless) per pass during cold rolling was ~0.05, and the total reduction for each condition was achieved in several rolling passes. The average true strain per pass was calculated based on the total number of passes and total reduction.

2.2. Characterization

For the SA sample with an equiaxed microstructure, micro-indentation tests were performed. For indentation, a Vickers square pyramid indenter was used on a machine (Nanoatom Technologies, Bengaluru, India) in which the target load was 1N, and the loading rate was 0.1 N/s. Multiple indentations were taken on the sample, and the load–displacement curve was recorded for each test. The orientation of such grains was determined using electron backscattered diffraction (EBSD). An EBSD system (EDAX, Mahwah NJ, USA) attached to an FEI Quanta 3D field emission gun (FEG) (SEM, The Netherlands) was used for it. A 20 kV accelerating voltage, 15 mm working distance and 0.2 µm step size were used for data acquisition. Identical electron beam parameters and identical video conditions of the camera were kept during the acquisition of EBSD data for all the samples (SA as well as deformed). The indentation in which the indent was at the center of the grain (φ1, Φ, φ2 = 325.2°, 18.0°, 66.2° in Bunge notation [48]) was selected for further analysis (Figure 1). The deformed zone near the indent was imaged with (JEOL 6380A, Tokyo, Japan) a scanning electron microscope (SEM). All the microstructures were obtained on the long transverse plane using an SEM and optical microscope (OM, ZEISS, Gottingen, Germany). For microstructural characterization, metallographic polishing was used to obtain a mirror finish, after which etching was performed by Kroll’s reagent [49] to reveal the microstructure. For EBSD, electro-polishing was carried out with an electro-polisher (Buehler, IL, USA) at a temperature of −10 °C using a mixture of perchloric acid and ethanol (20:80 by volume) at 17 V (DC) for 20 s [20]. Bulk texture was measured for all the samples on a PANAlytical XPert PRO MRD system in reflection geometry with CuKα radiation and point detector. Three incomplete pole figures—{110}, {200} and {112}—were measured up to a tilt angle of 75°. A powdered β titanium alloy sample was used to correct for the background and defocusing effects.

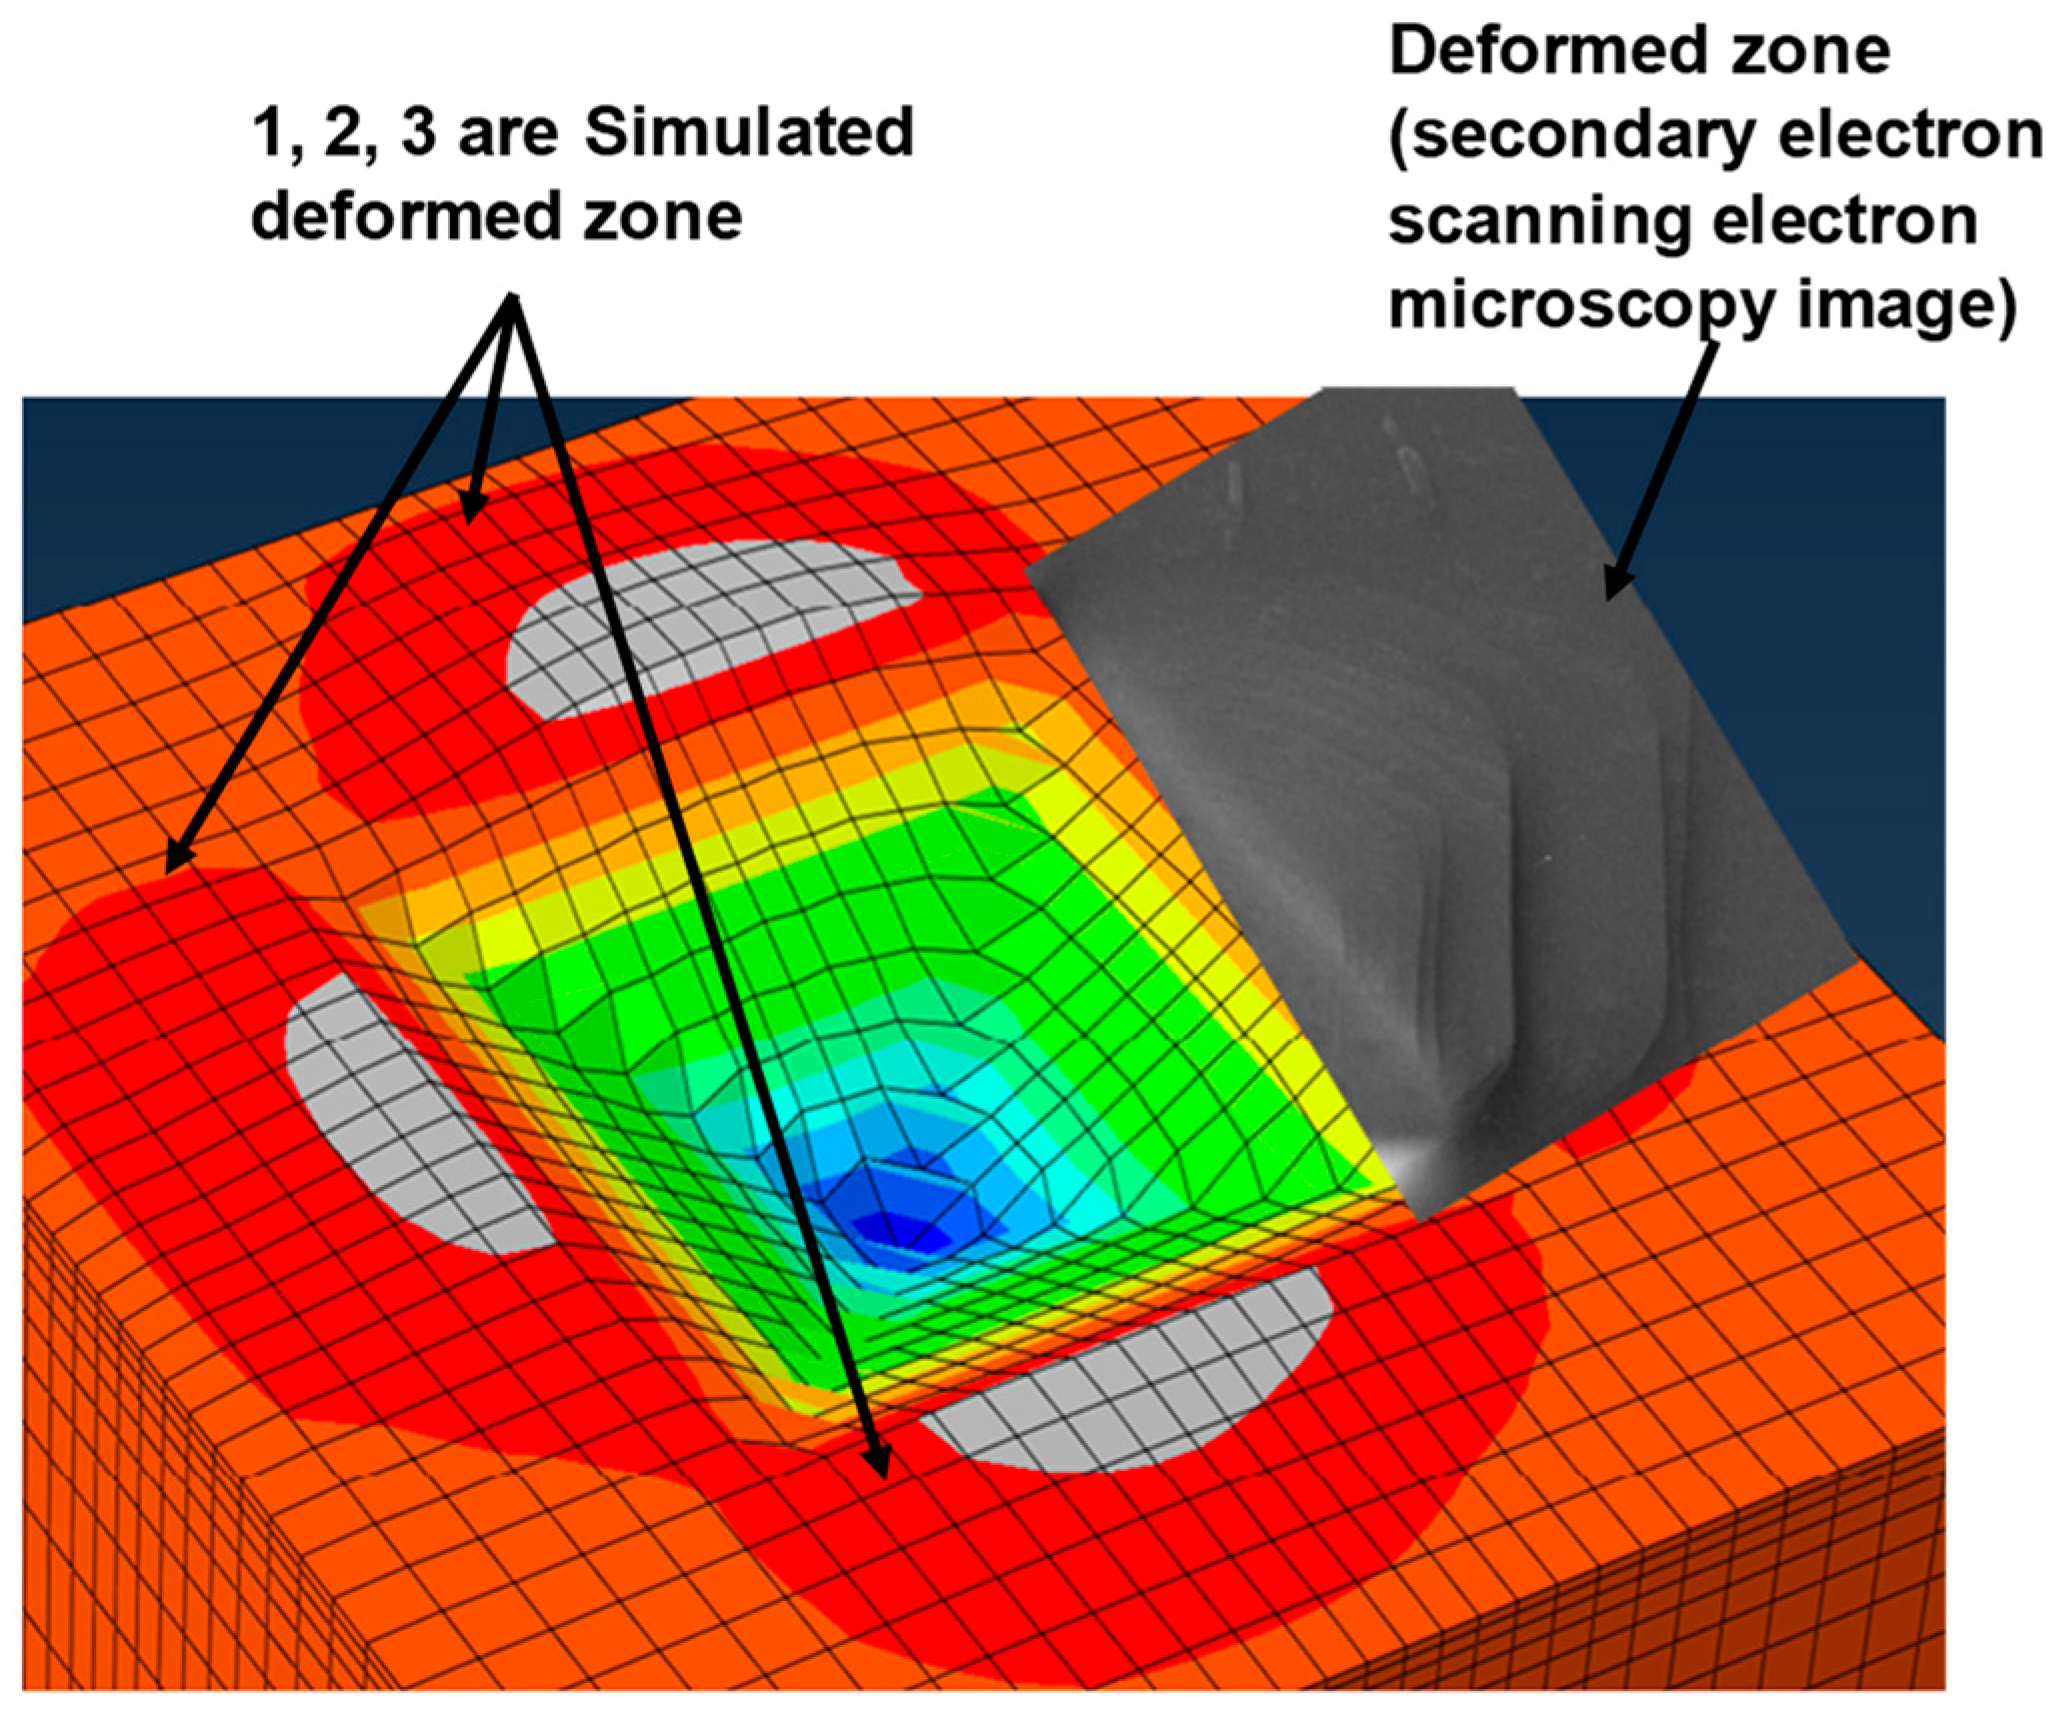
2.3. FE Model for Indentation Simulation

In the developed numerical model, a deformable bcc single crystal workpiece with a rigid Vicker’s indenter was considered, as shown in Figure 2. The dimensions of the workpiece were 70 µm (length) × 70 µm (width) × 40 µm (depth). The bottom face was constrained in all directions. The plane strain compression matrix was used to define the boundary conditions. A finer mesh was considered for the workpiece sample at the location where the indenter indented the sample. A minimum element size of 0.2 μm × 1.0 μm × 1.0 μm was used to discretize the workpiece and that of 0.1 μm × 0.1 μm × 0.1 μm was considered for the indenter. The orientation of the single crystal used was φ1, Φ, φ2 = 325.2°, 18.0°, 66.2° in Bunge notation [50]. This orientation was determined by the EBSD of the SA Ti-15333 sample, as explained in the previous section. The Coulomb’s friction model with a coefficient of 0.05 was used between the indenter and workpiece [38]. The method utilized to evaluate the plasticity/constitutive parameters here is similar to that described by Chakraborty et al. [40], Demiral et al. [38] and Zambaldi et al. [32,42] in which the experimentally and numerically obtained load–displacement curves and/or deformation zones were matched with each other. The crystal plasticity (CP) theory modeling the behavior of the single crystal was implemented in ABAQUS/Standard [51] FE software using a user-defined material (UMAT) subroutine developed by Huang [52]. The parameters obtained by Qidwai et al. [53] for the β titanium alloy ( s s β = S s = 500 MPa, s 0 β = s 0 = 200 MPa,   h 0 β = h 0 = 1500 MPa and α β = α = 0.1 for all slip systems) were used for the simulations. The indentation simulations were performed to validate the parameters obtained from the literature for the present Ti-15333 alloy.

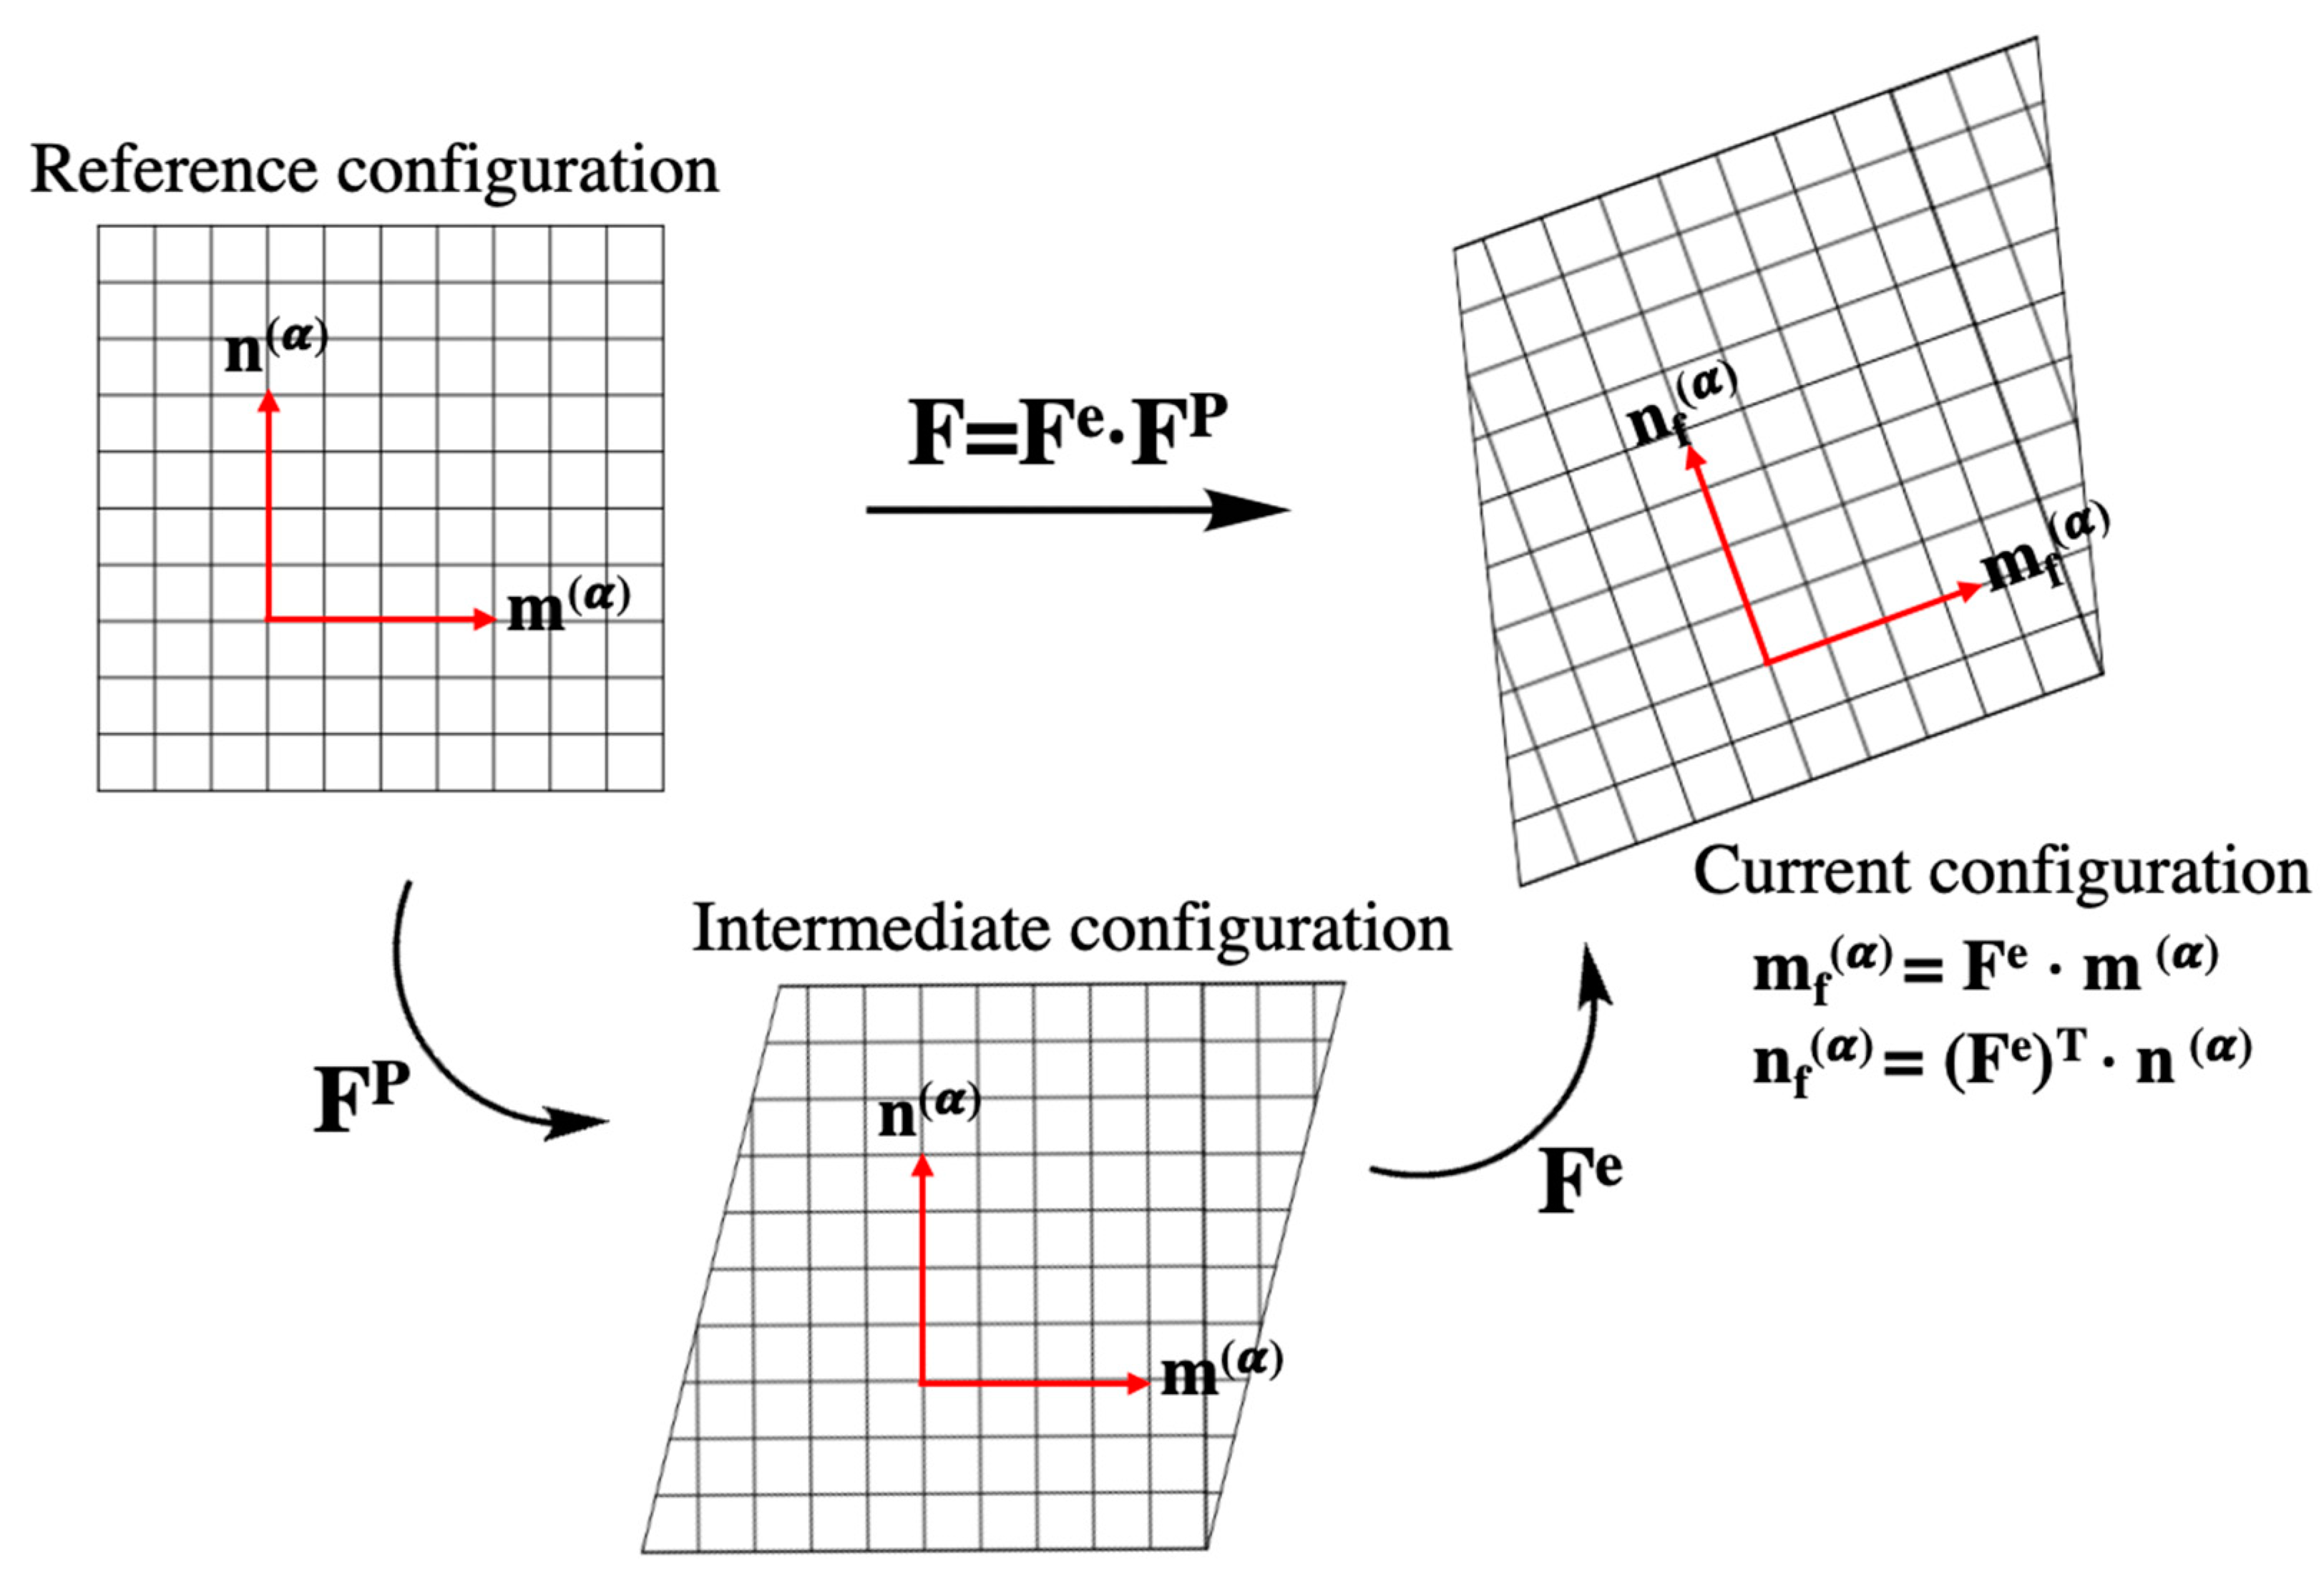
2.4. Crystal Plasticity Model (PRISMS) and Cold Rolling Simulations

Ti-15333 cold rolling simulations were conducted with the 3D CPFE open-source software, PRISMS-plasticity [47]. It is based on the theory of rate-independent single-crystal plasticity developed by Anand and Kothari [54]. Sundararaghavan and Zabaras [55] used PRISMS-plasticity software for the fcc material, whereas Kumar and Sundararaghavan [56] used it for the bcc material. Acar et al. [57] successfully used it to capture the response of the hcp material. The model is based on the theory of plastic flow accommodation via slip on a prescribed slip system(s). For this plasticity model, the finite deformation continuum mechanics framework was considered. In the model, the deformation gradient tensor F is decomposed into two components (Figure 3), an elastic ( F e ) and plastic ( F p ) component, which can be written as follows (Equation (1)):
F = F e   F p
The applied deformation in the crystal plasticity model accommodates two independent deformation mechanisms, namely, the elastic distortion of the crystal lattice and pure shear due to plastic slip. The velocity gradient tensor (microscopic) L has two components—elastic velocity gradient ( L e ) and plastic velocity gradient ( L p )—and can be expressed as Equation (2):
L = L e + L p
The superimposition of shear deformation induced by crystallographic slip on multiple slips is associated with the microscopic response of the plastic part of the velocity gradient, as shown below (Equation (3)):
L p = α γ ˙ α S α sign   ( τ α )
For a slip system α, γ ˙ α is the shearing rate, τ α is the resolved shear stress, and S α is the Schmid tensor, which is given as (Equation (4)):
S α = m α n α
In the deformed configuration, m α and n α are the unit vectors that denote the slip direction and slip plane normal, respectively. Furthermore, for the slip system α, resolved shear stress can be expressed as (Equation (5)):
τ α = σ . S α
where the (.) operator denotes the standard inner product of the tensor, and σ is the Cauchy stress tensor. The yield surface for the slip system α can now be defined as Equation (6):
f α = | τ α | S α
where S α is the slip resistance for a slip system α. For slip to occur, | τ α | must reach a critical value of S α . The Kuhn–Tucker consistency condition [58] gives the governing equation of slip resistance, which can be written as (Equation (7)):
S ˙ α = β h α β γ ˙ β
where the hardening moduli is h α β , and it describes the variation in slip resistance for slip system α due to the slip rate on slip system β. The hardening moduli h α β can be described using a power law relationship, which takes into account the combined effect of work hardening and recovery and is given as follows (Equation (8)):
h α β = { h 0 β [ 1 s β s s β ] α β     if   α = β h 0 β q [ 1 s β s s β ] α β if   α β
For a β slip system, q is the latent hardening ratio, h 0   β is a hardening parameter, s s β is the slip resistance at hardening saturation, and α β is a material constant that governs the sensitivity of the hardening moduli to the slip resistance. The numerical implementation of the model was elaborated by Yaghoobi et al. [47]. For the Ti-15333 alloy, the crystal plasticity model parameters s s β = S s = 500 MPa, s 0 β = s 0 = 200 MPa, h 0 β = h 0 = 1500 ({110}<111>), 1980 ({112}<111>) and 1640 ({123}<111>) MPa, and α β = α = 0.1 for all slip systems were used. These were validated using the load–displacement curve in the present work, and these were obtained and refined by Yaghoobi et al. [47] for PRISMS-plasticity of Ti-15333. A latent hardening value of q = 1 was used for all the simulations [59]. In simulations, the standard value of q is either 1 or 1.4. The simulations were run with both q values; however, there was no significant difference in texture, and hence, q = 1 was used and reported for the present work.
The developments in crystallographic texture after cold rolling were simulated for the Ti-15333 alloy using PRISMS. Plane strain compression was considered for the deformation simulation, with compression along the ND, elongation along the RD, and the TD remaining unchanged. For simulations, the initial statistical microstructure was generated with DREAM.3D software [60] consisting of 100 grains and 32 × 32 × 32 = 32,768 elements (Figure 4). The bulk texture and grain size data for the SA sample were used to generate the statistical microstructure. Multiple simulations with different step sizes—0.01, 0.001 and 0.0001—were carried out. A step size of 0.001 was considered to be the most optimum based on the resolution of the final output and the simulations’ running time. Simulations were conducted considering one, two and three slip systems. Orientation distribution functions (ODFs) and pole figures (PFs) were obtained using the MTEX MATLAB toolbox [61] for the experimental, as well as simulated, data. The volume fractions of different texture components/fibers were calculated considering a spread of 15° around the ideal orientation/fiber.

3. Results and Discussion
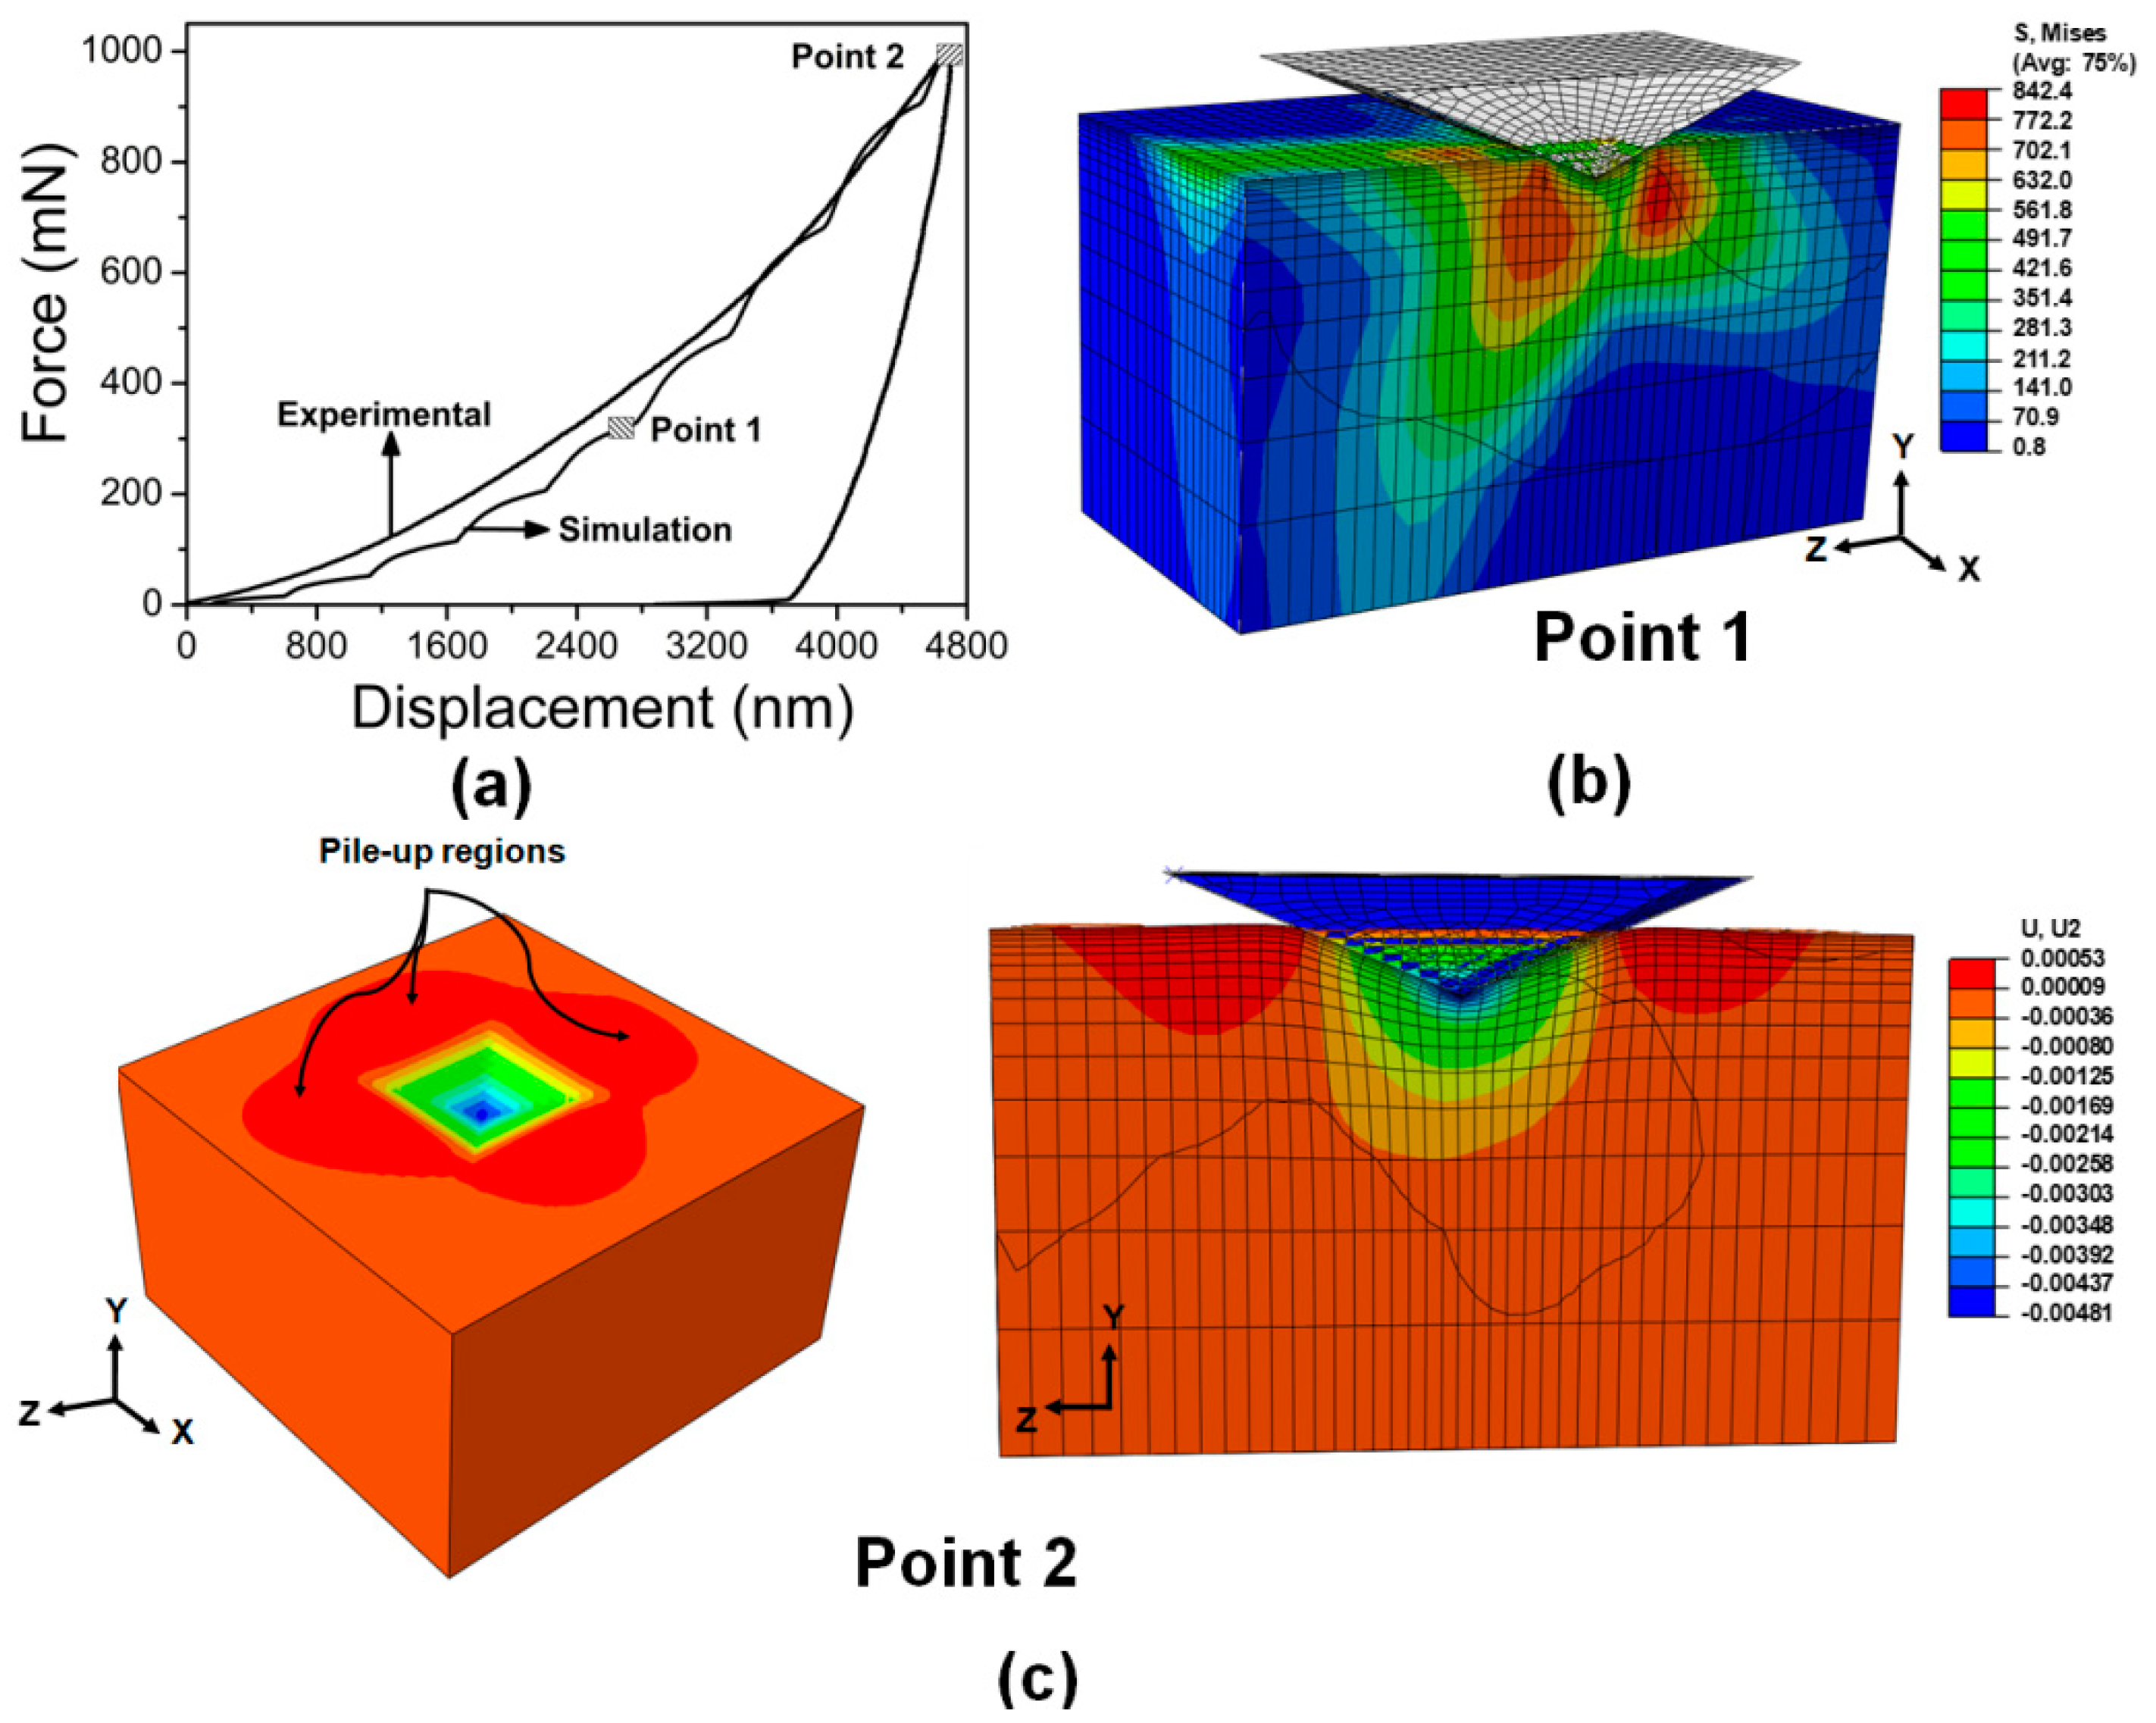
3.1. Indentation

Figure 5a shows the experimental versus the simulated load–displacement curves along with the deformed zone during indentation. Point 1 and point 2 represent the simulated material state at almost quarter and full loading, respectively (Figure 5b,c). At maximum force (Figure 5c), i.e., at point 2, the pile-up of the material around the indented area with a four-fold symmetry can be seen. These pile-up regions or deformation zones matched with those observed in the indentation experiments. Figure 6 shows the magnified view of the deformed zone around the indent at maximum force along with a secondary electron SEM image of the same orientation. The strain distribution around the simulated deformed zone has similar morphology to that of the SEM image showing the pile-up region near the indent.
Both the matching of the force–displacement curve and the deformation zone around the indent validate that the constitutive parameters considered for simulations are correct.

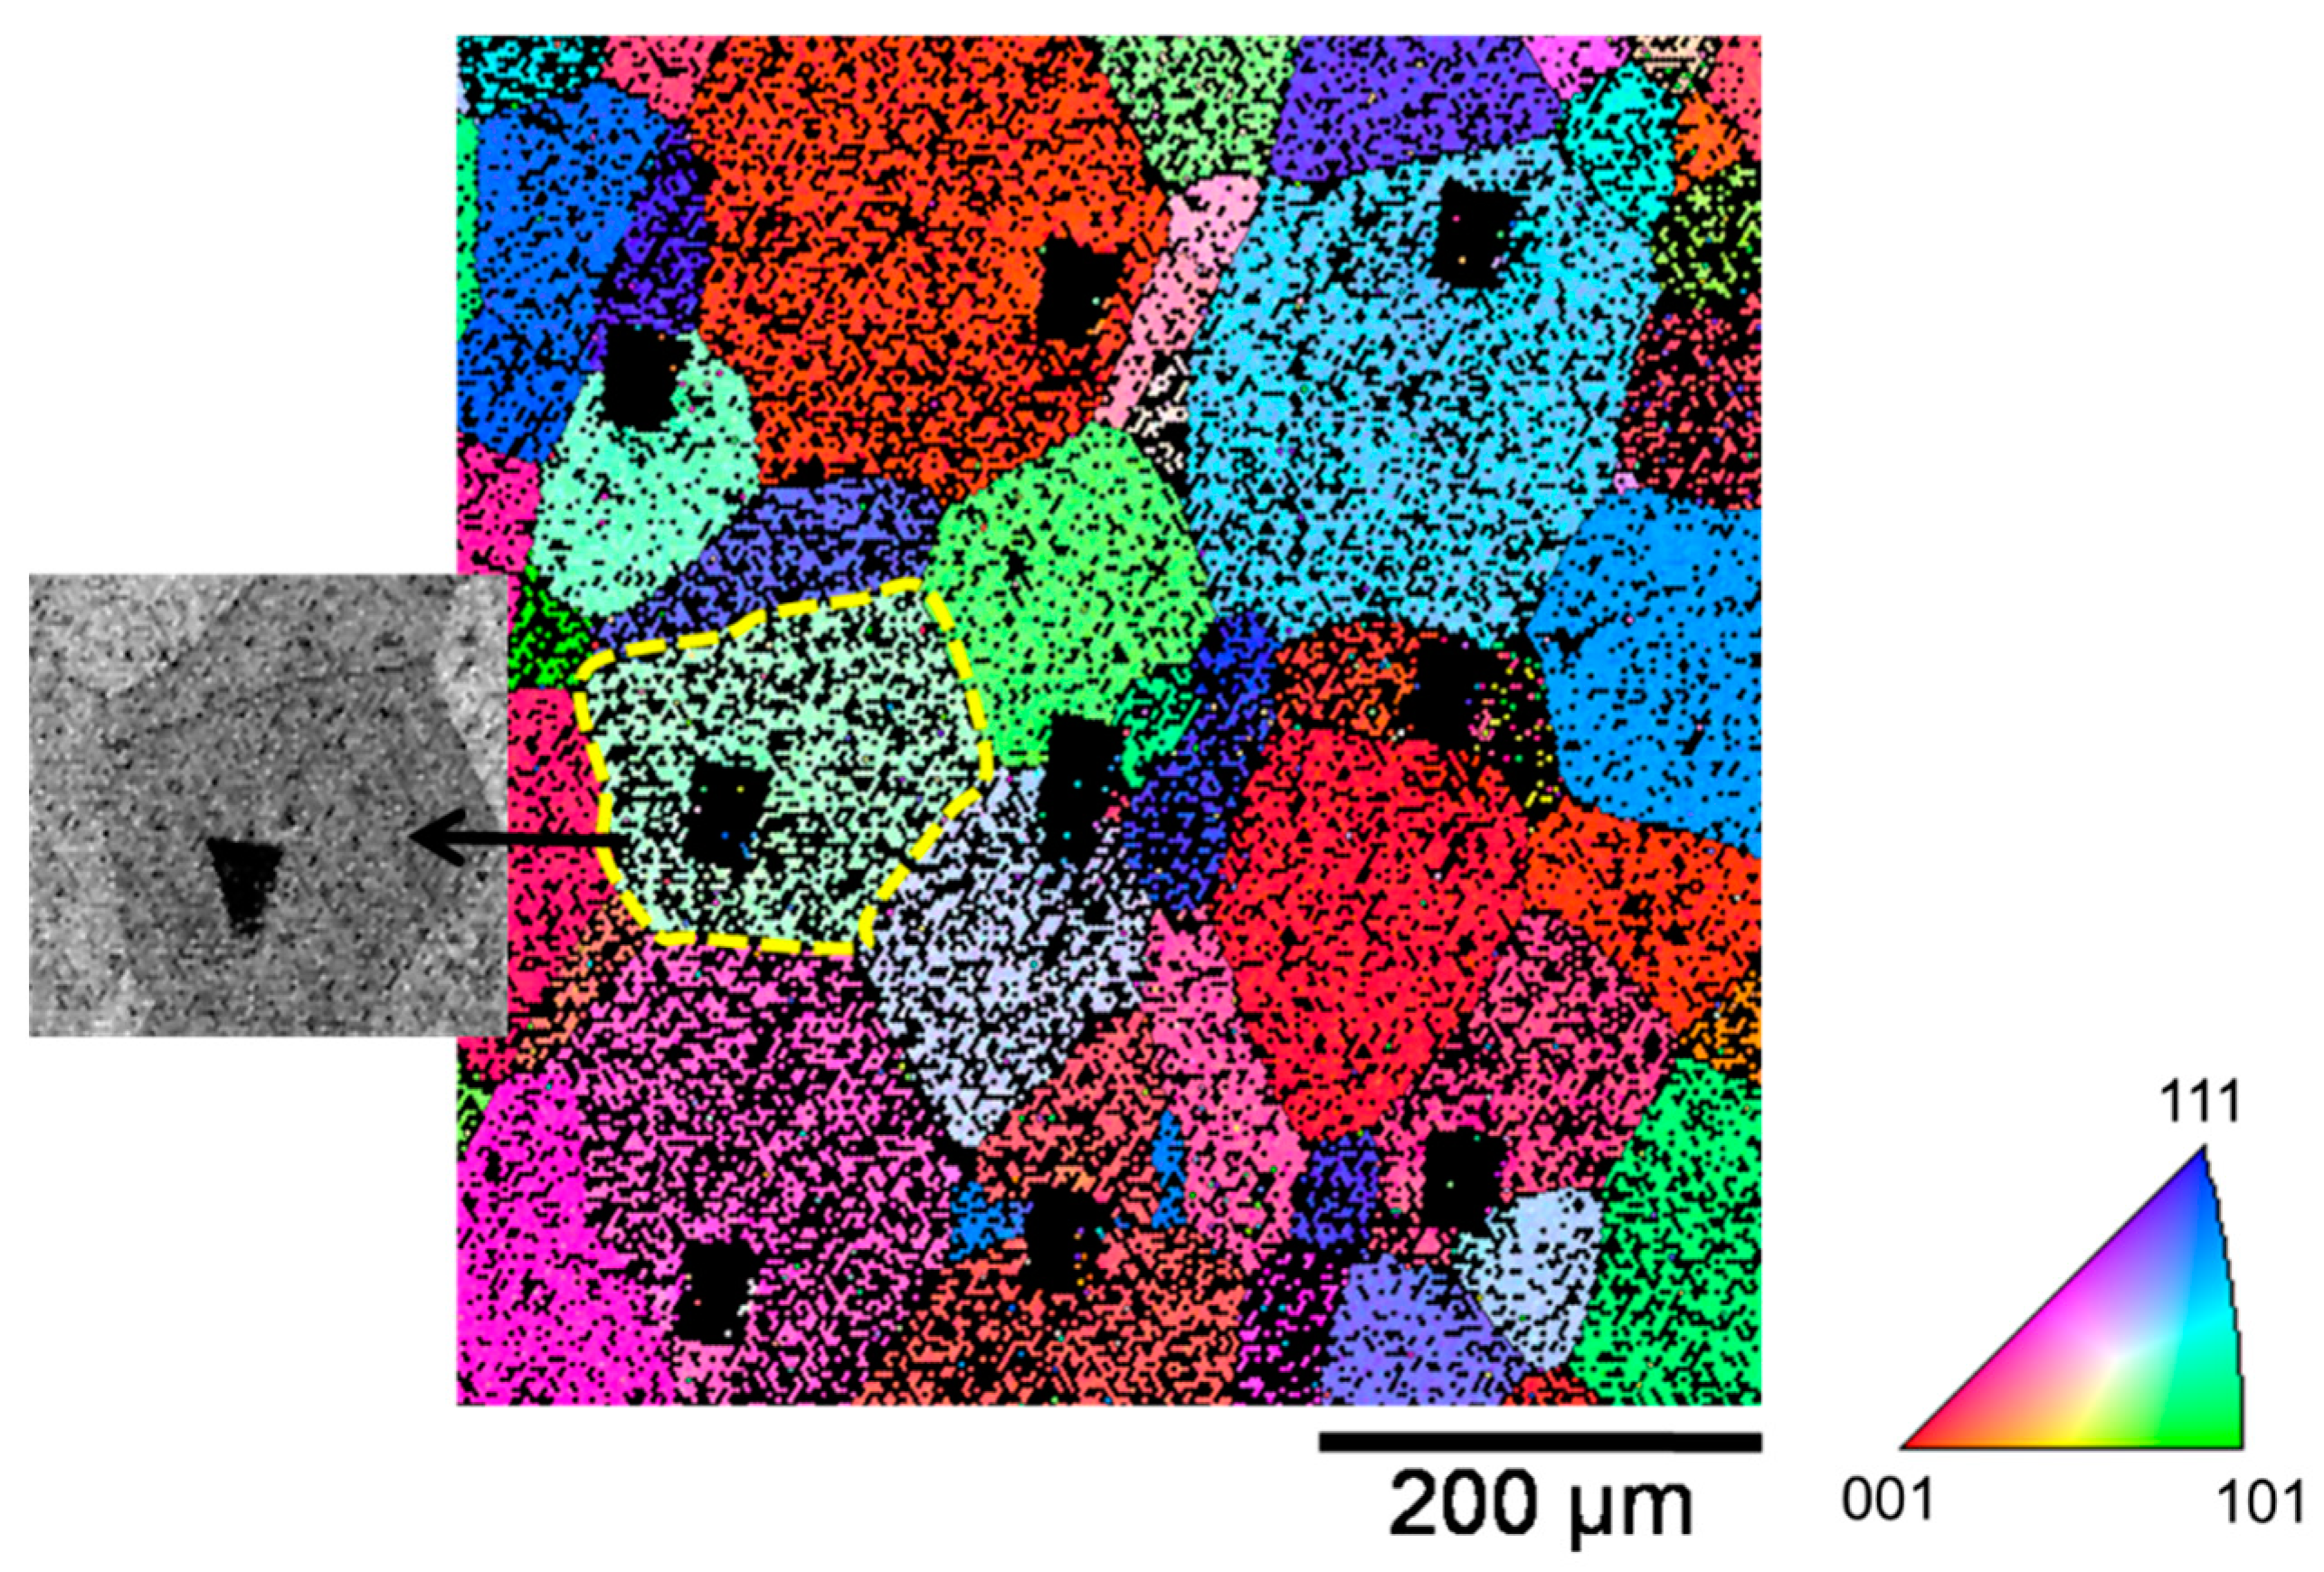
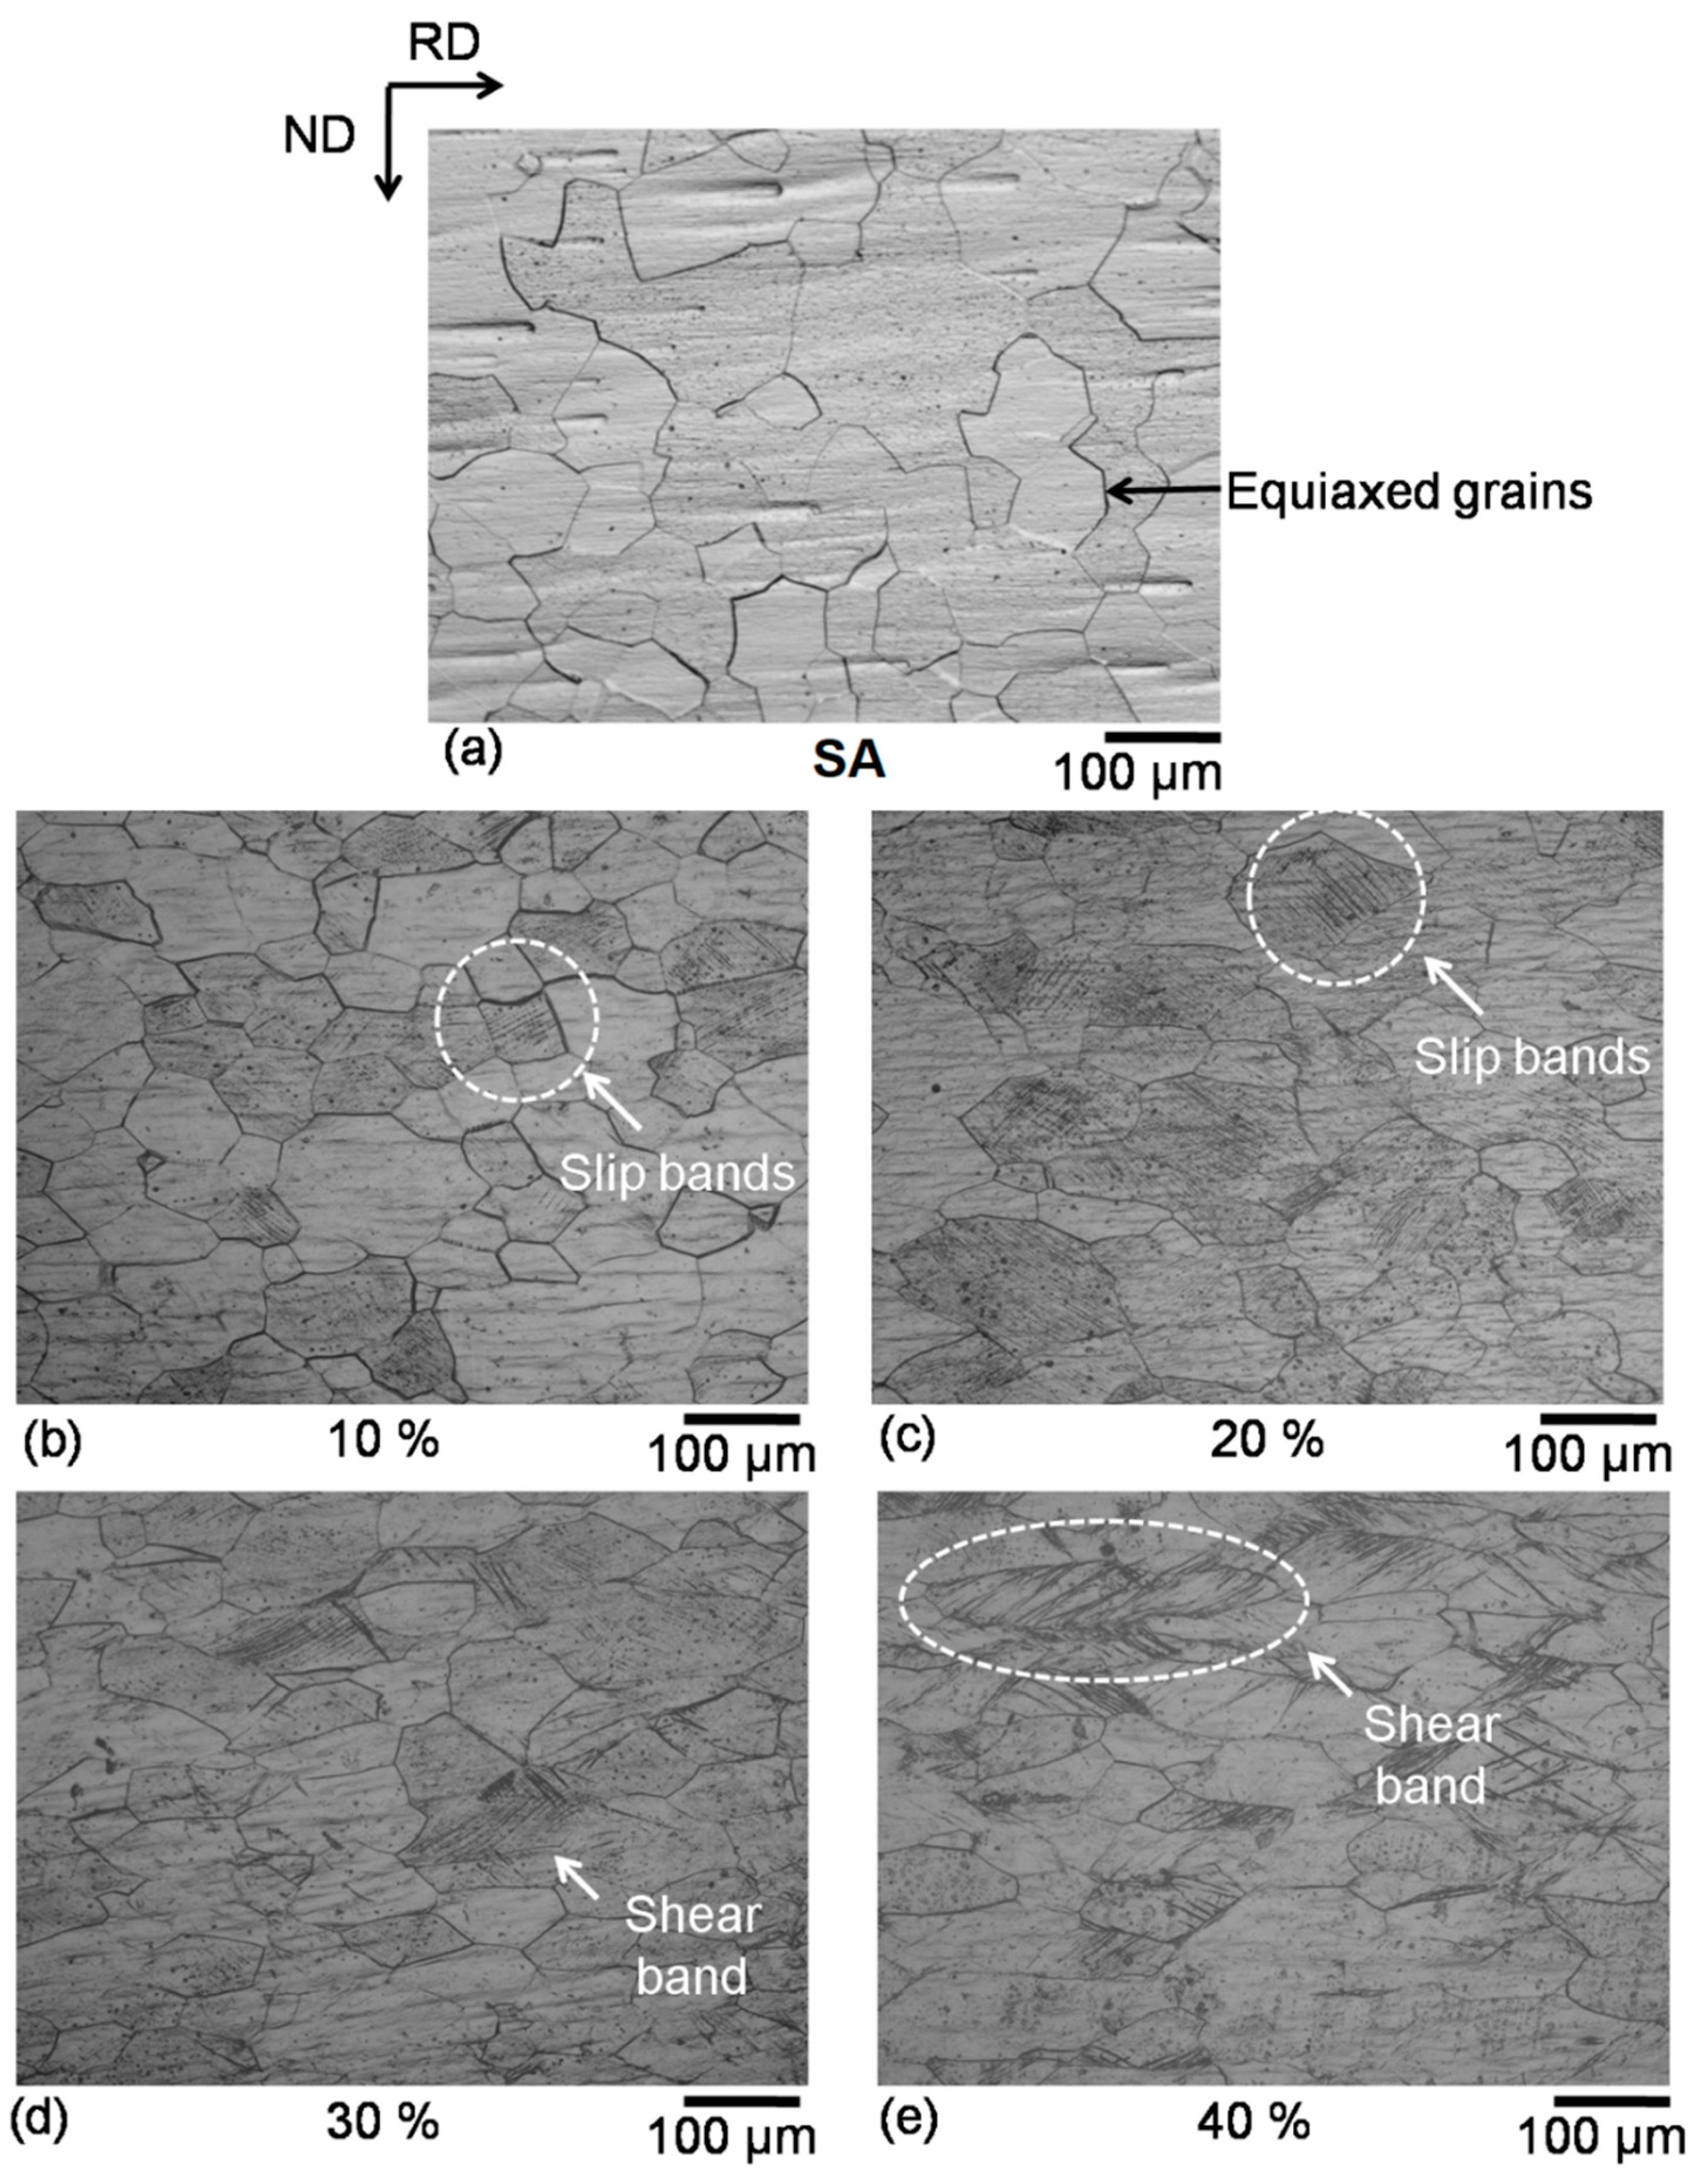
3.2. Microstructures

Figure 7 shows the optical microstructures for the SA, 10%, 20%, 30% and 40% cold-rolled samples.
In the SA sample, equiaxed grains were observed, and as the cold rolling progressed, grains started to elongate with the appearance of slip bands and shear bands. Figure 8 shows the SEM images of these rolled samples. In 10% and 20% cold-rolled samples, the formation of slip bands was more pronounced, and with an increase in cold rolling reduction, shear bands were found to be the more pronounced features of the microstructure. A high amount of localized deformation is responsible for the formation of these shear bands, and these bands were at an angle of 35–40° with RD [53]. These shear bands (non-crystallographic) are regions of localized deformation and have an accumulated strain of ~200–400%. These can form both in positive and negative directions with respect to the RD and act as an alternative mechanism of accommodating strain when sufficient numbers of crystallographic slip systems are not available during deformation. They can form in both positive and negative directions due to geometric deformation symmetry during cold rolling.
It has been reported that these bands are also orientation-sensitive [13] and have a preferred appearance in γ-fiber than the grains with other orientations. The formation of these shear bands, often termed as strain localizations (in EBSD terminology, regions with higher-than-average misorientation across the features in the microstructure) has been linked with Dillamore’s plastic instability criterion [62]. It has been reported [62,63,64] that grains with higher Taylor factor (M) are often grains with negative values of dM/dε and, hence, cause textural softening, resulting in the development of strain localizations. γ-fiber has higher M and, hence, possible negative dM/dε, resulting in textural softening and enhanced shear banding.

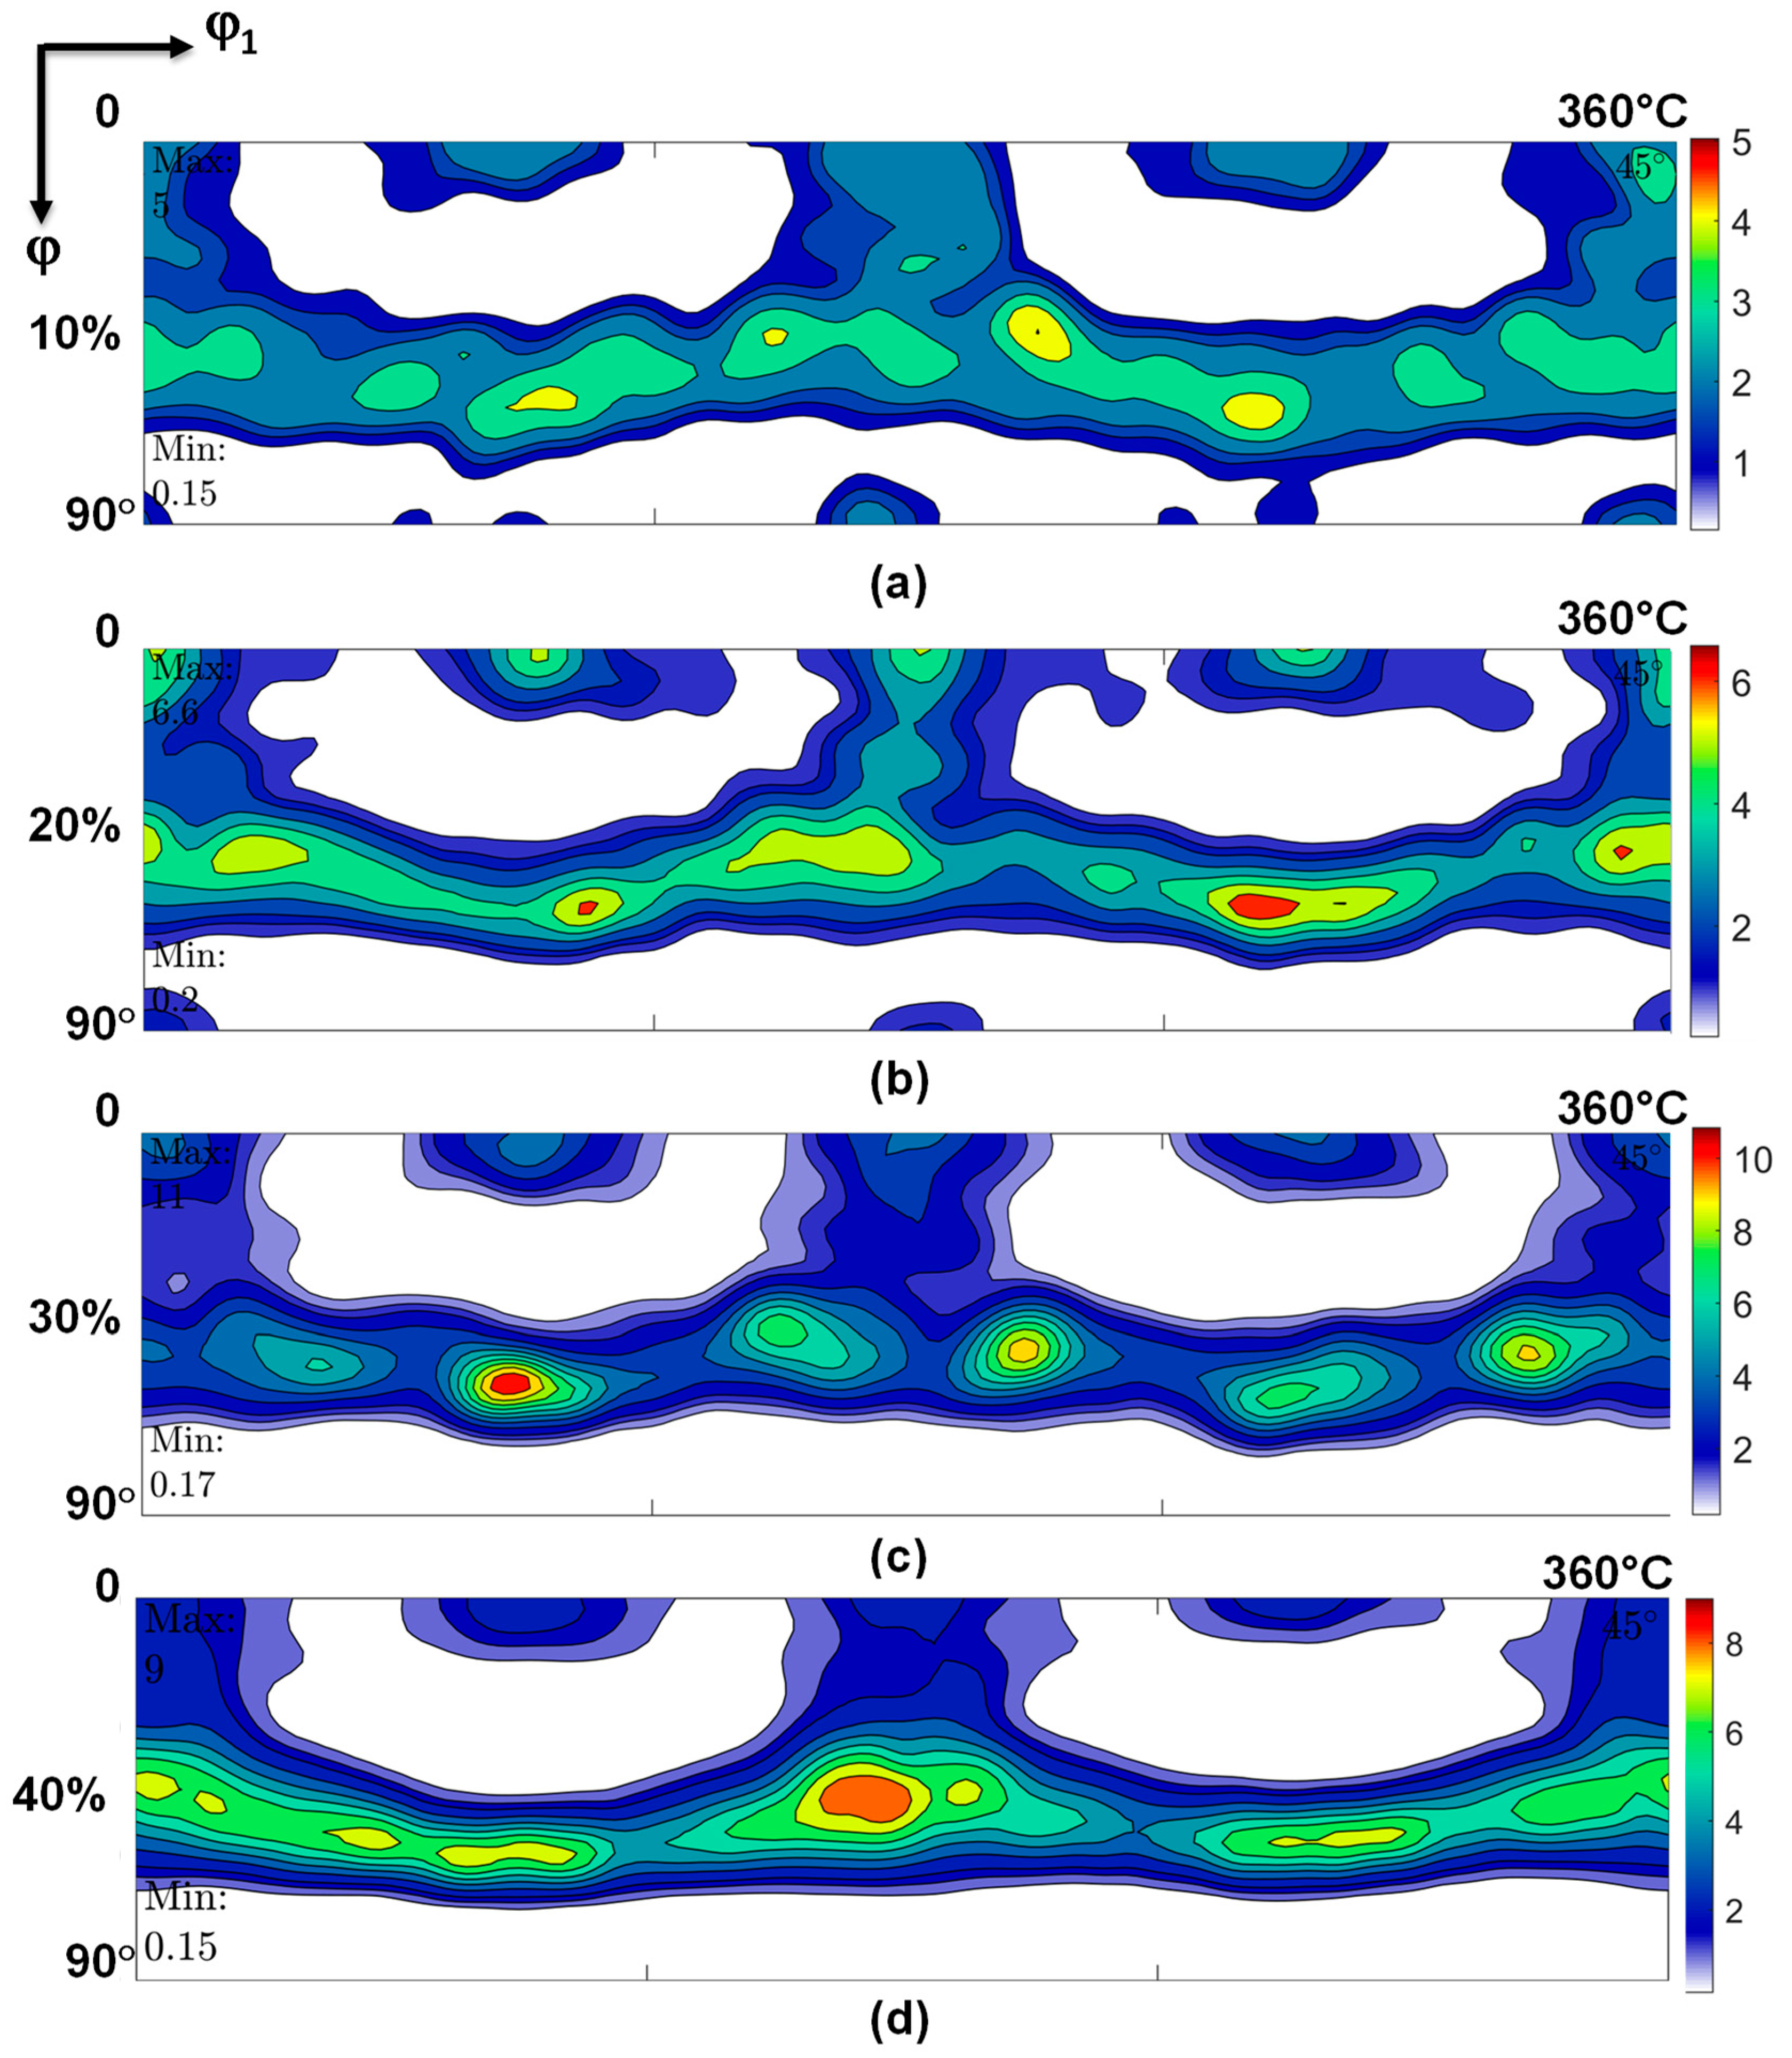
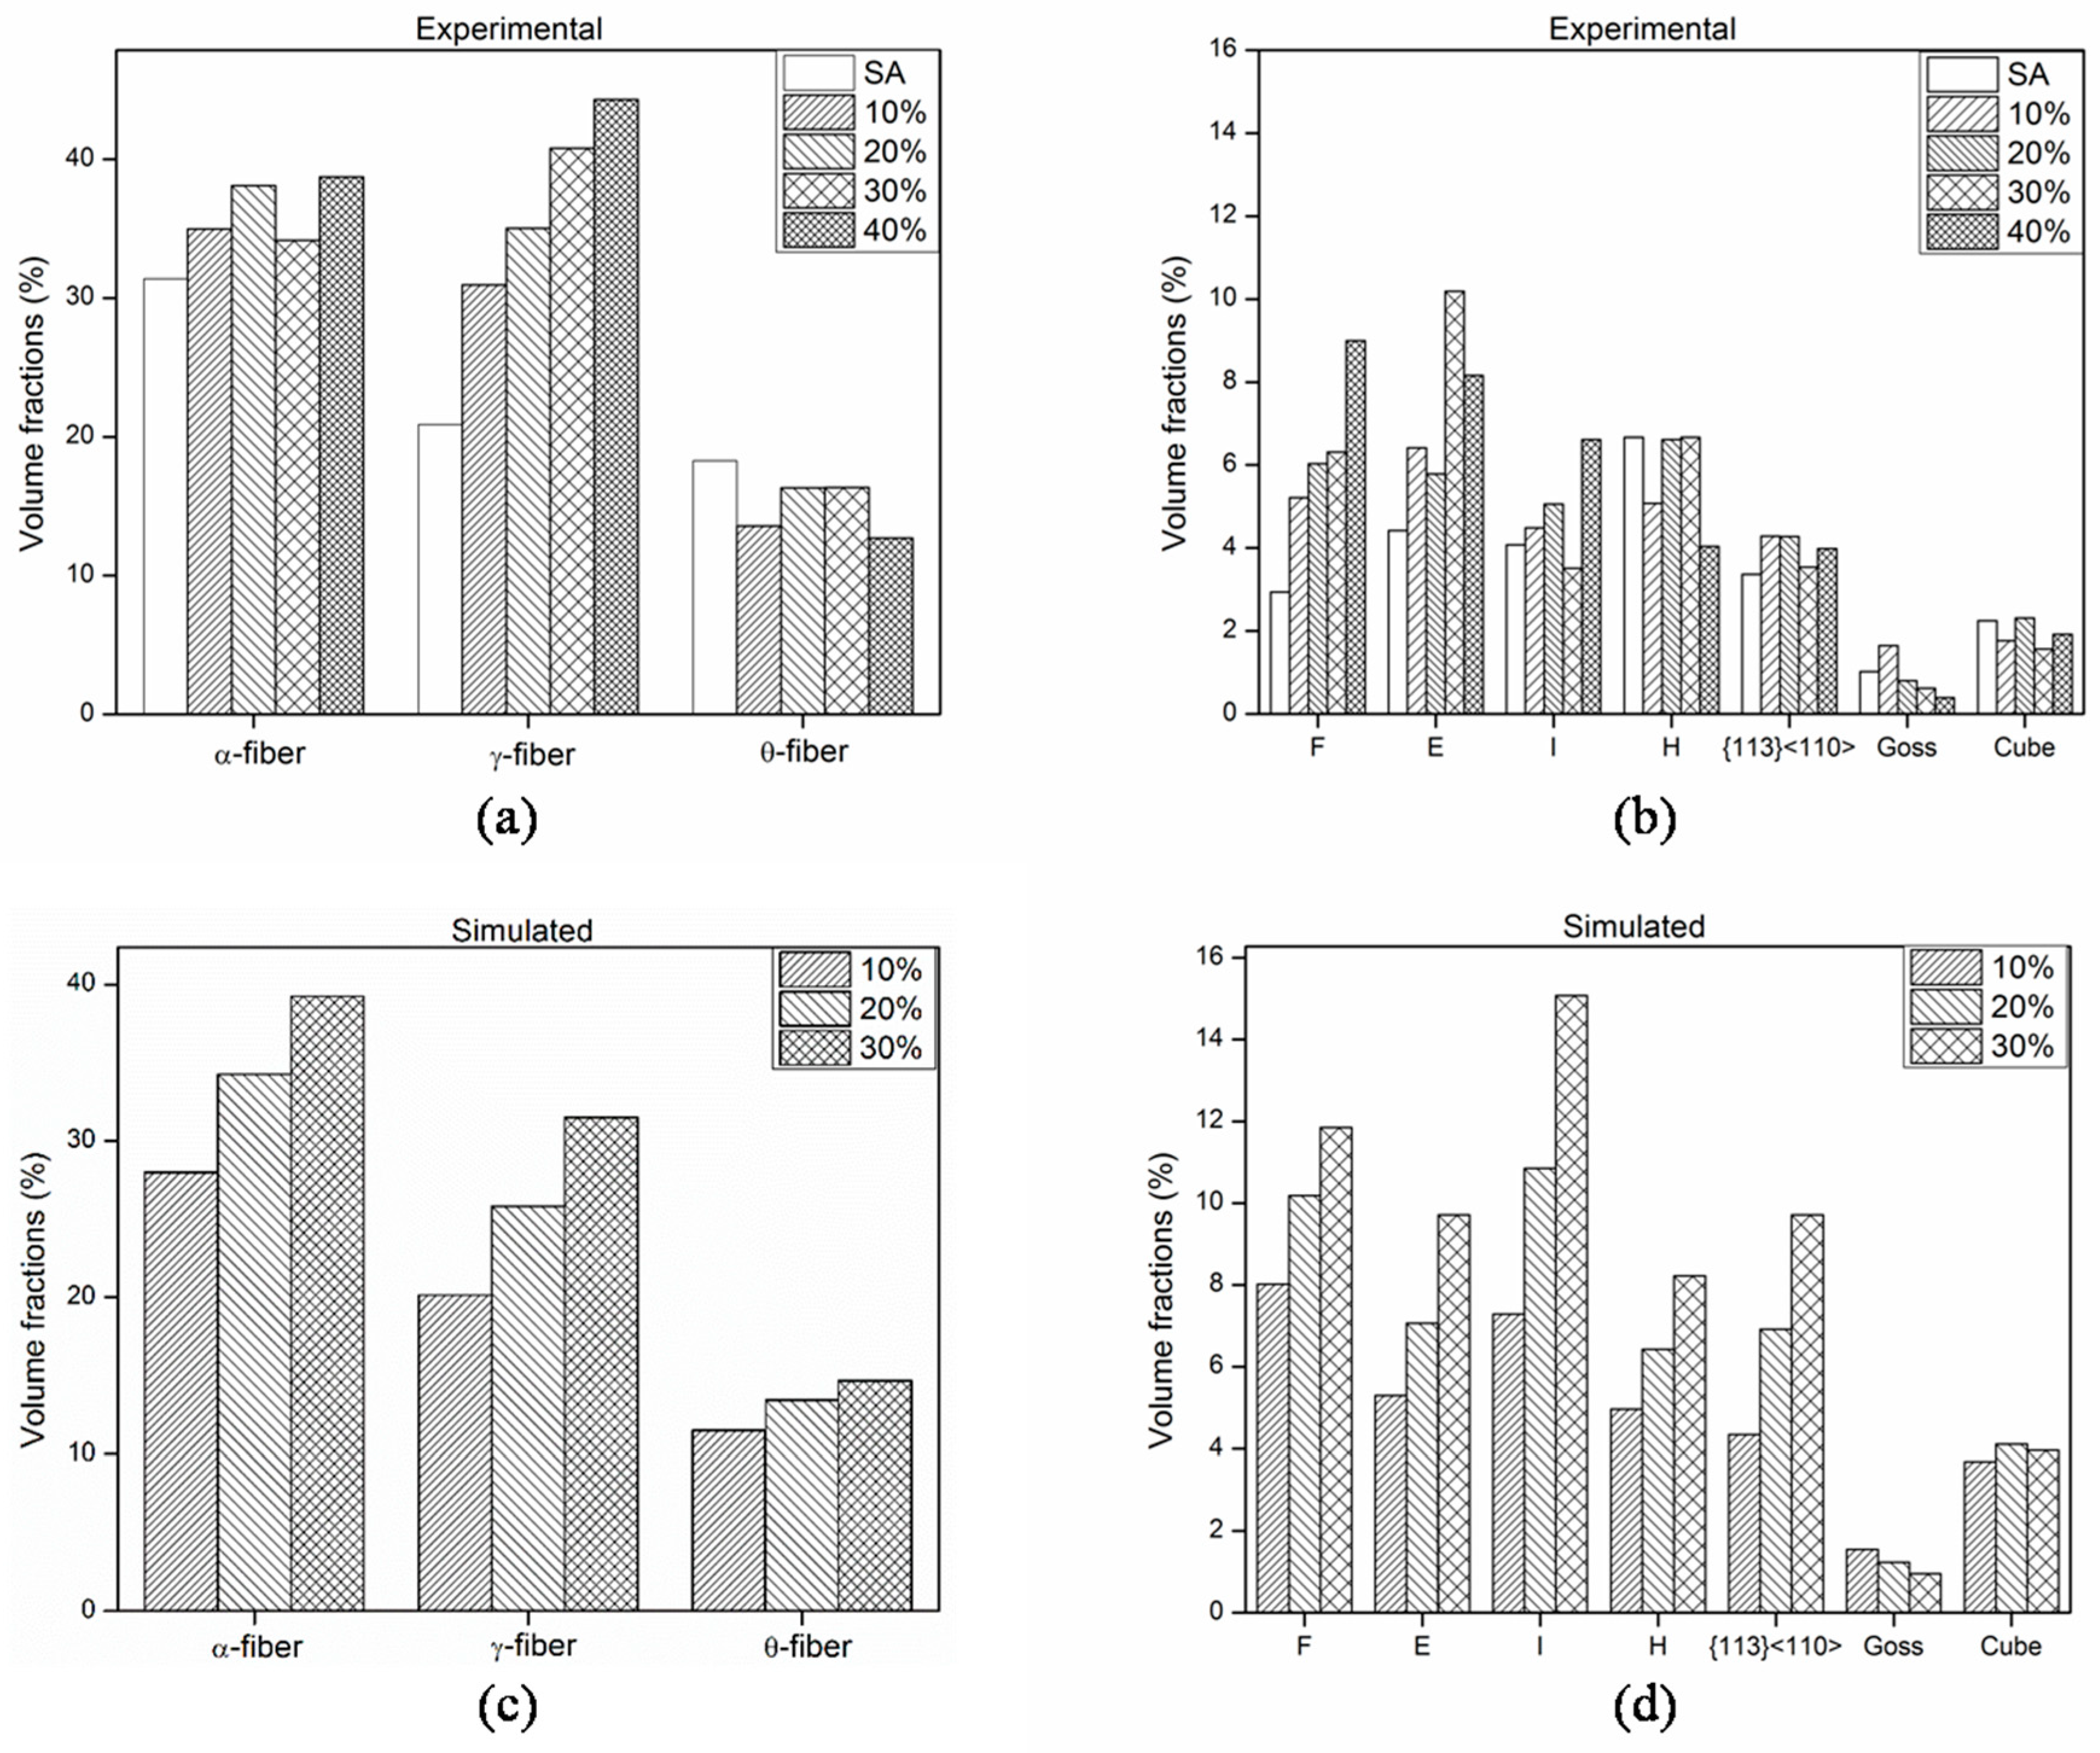
3.3. Experimental Texture

The ODFs (φ2 = 45°constant section) of the SA sample, along with standard ODF showing typical components that occur in bcc metals and alloys, are shown in Figure 9a,b, respectively. In the SA sample, α-fiber, γ-fiber and θ-fiber were observed; the intensity of α-fiber was higher than that of the other two. Rotated cube texture {001}<110>, which is a part of θ-fiber, was observed to be stronger than the other components in the SA sample. Figure 9c,d show the pole figure (PF) of the experimental and discretized and simulated SA sample. The experimental PF matches the simulated PF very well, implying that the initial texture used in the experiment and simulation was the same. Texture development after cold reduction can be significantly affected due to the presence of strong texture in the initial condition. The initially present texture components, if stable, usually strengthen after an increase in cold rolling reduction in bcc metals and alloys.
Figure 10 shows the ODFs (φ2 = 45°constant section) of the 10%, 20%, 30% and 40% unidirectionally cold-rolled samples. It can be observed from Figure 10 that both γ-fiber and α-fiber are present in all the cold-rolled conditions. As the degree of cold rolling reduction is increased gradually from 10% to 40%, these two fibers also intensified. γ-fiber was stronger in intensity than α-fiber, in general, for all the conditions of cold rolling. Additionally, it can be found that the rotated cube, which was present in the SA sample weakened with the increase in cold reduction, whereas F, i.e., {111}<121>, increased continuously with the increase in cold rolling reduction.
The texture development during cold rolling or deformation, in general, depends on many factors, such as grain interactions, grain fragmentation, grain rotation and initial texture, to name a few. It is very difficult to isolate the individual contribution of each factor. However, it is agreed that during deformation, grains tend to orient themselves towards more stable orientation(s). In bcc metals and alloys, α- and γ-fiber orientations are expected to be more stable than the other orientations. Typically, in cold-rolled low-carbon (LC) steels, strong α and γ fibers develop [14,15,16,17,18,19,20,21,22,23,24,25,26,27,28,29,30]. The deformation texture in LC steels is important from a technological viewpoint because the recrystallization behavior and development of strong γ-fiber recrystallization texture depend on deformation also. The control of formability lies in the presence or absence of θ fiber (ND//<100>), i.e., this fiber type is detrimental, while γ-fiber is beneficial for formability. This also applies to the present alloy (Ti-15333). In single-phase bcc materials, such as LC steel, Ti-15333 alloy, pure Mo, etc. [65], the formation of deformation texture results from the rotation of unstable orientation toward stable once, where α and γ fibers seem to be stable and, hence, are usually obtained after cold rolling [22].

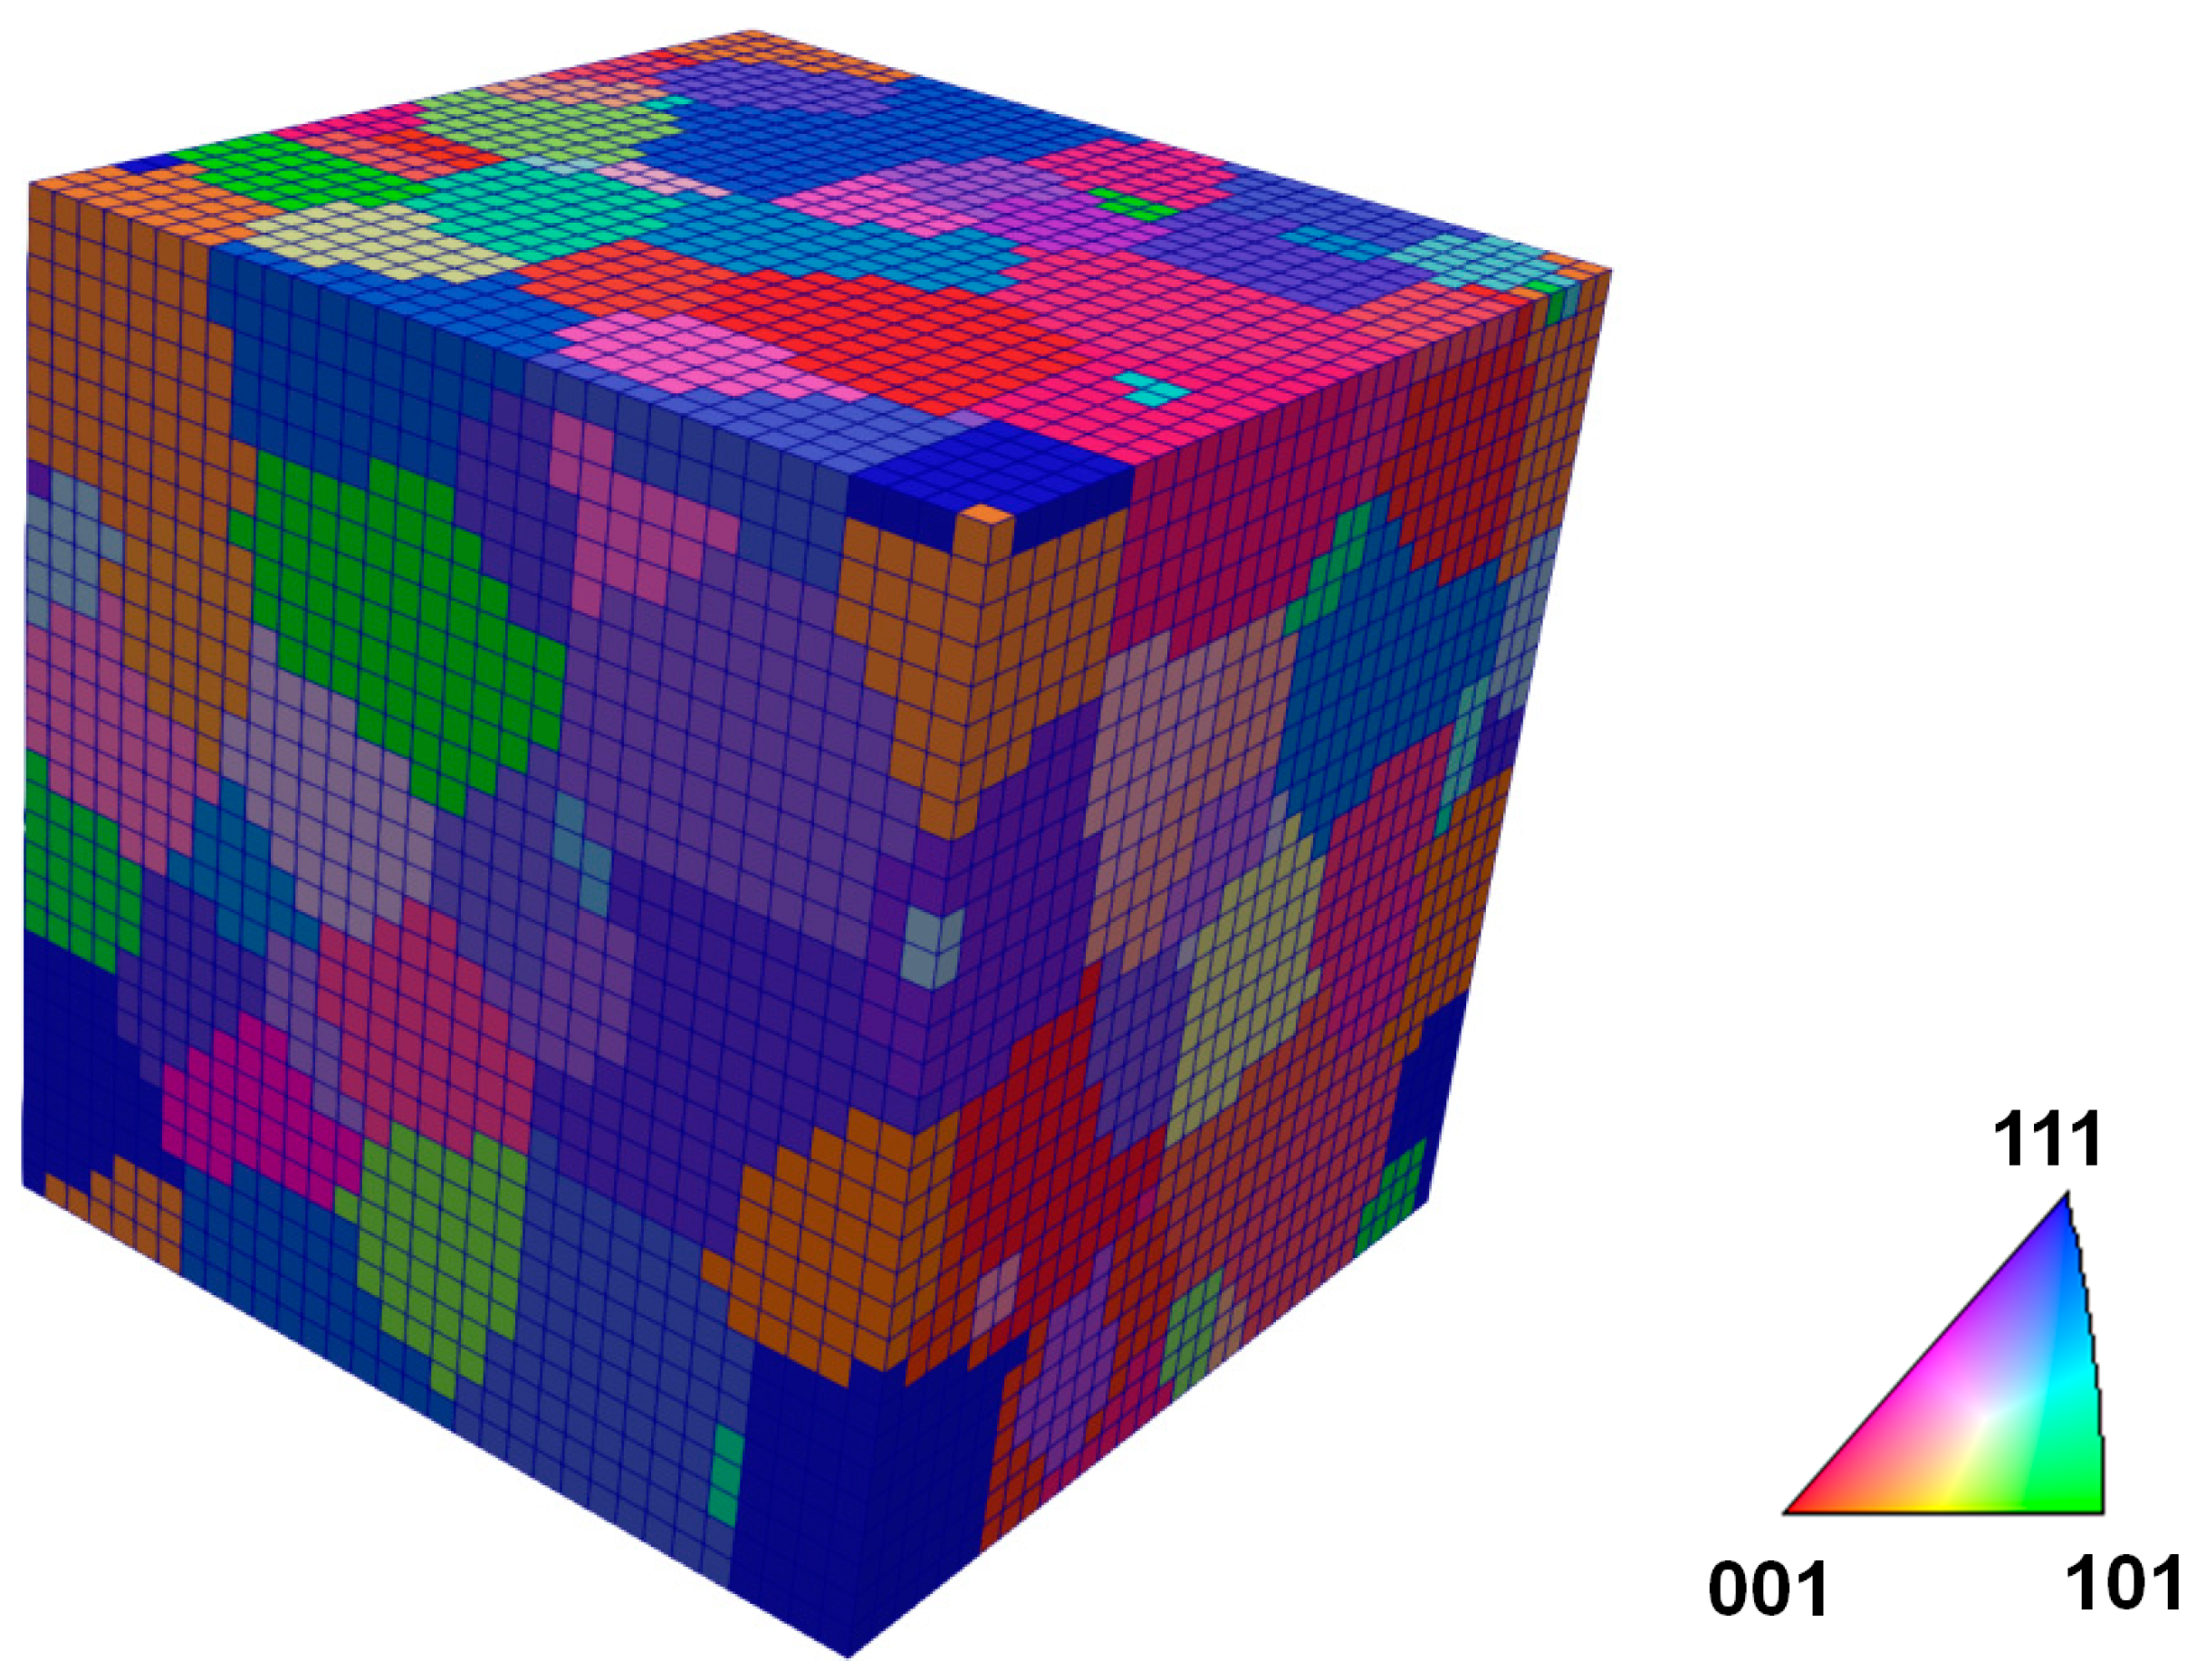
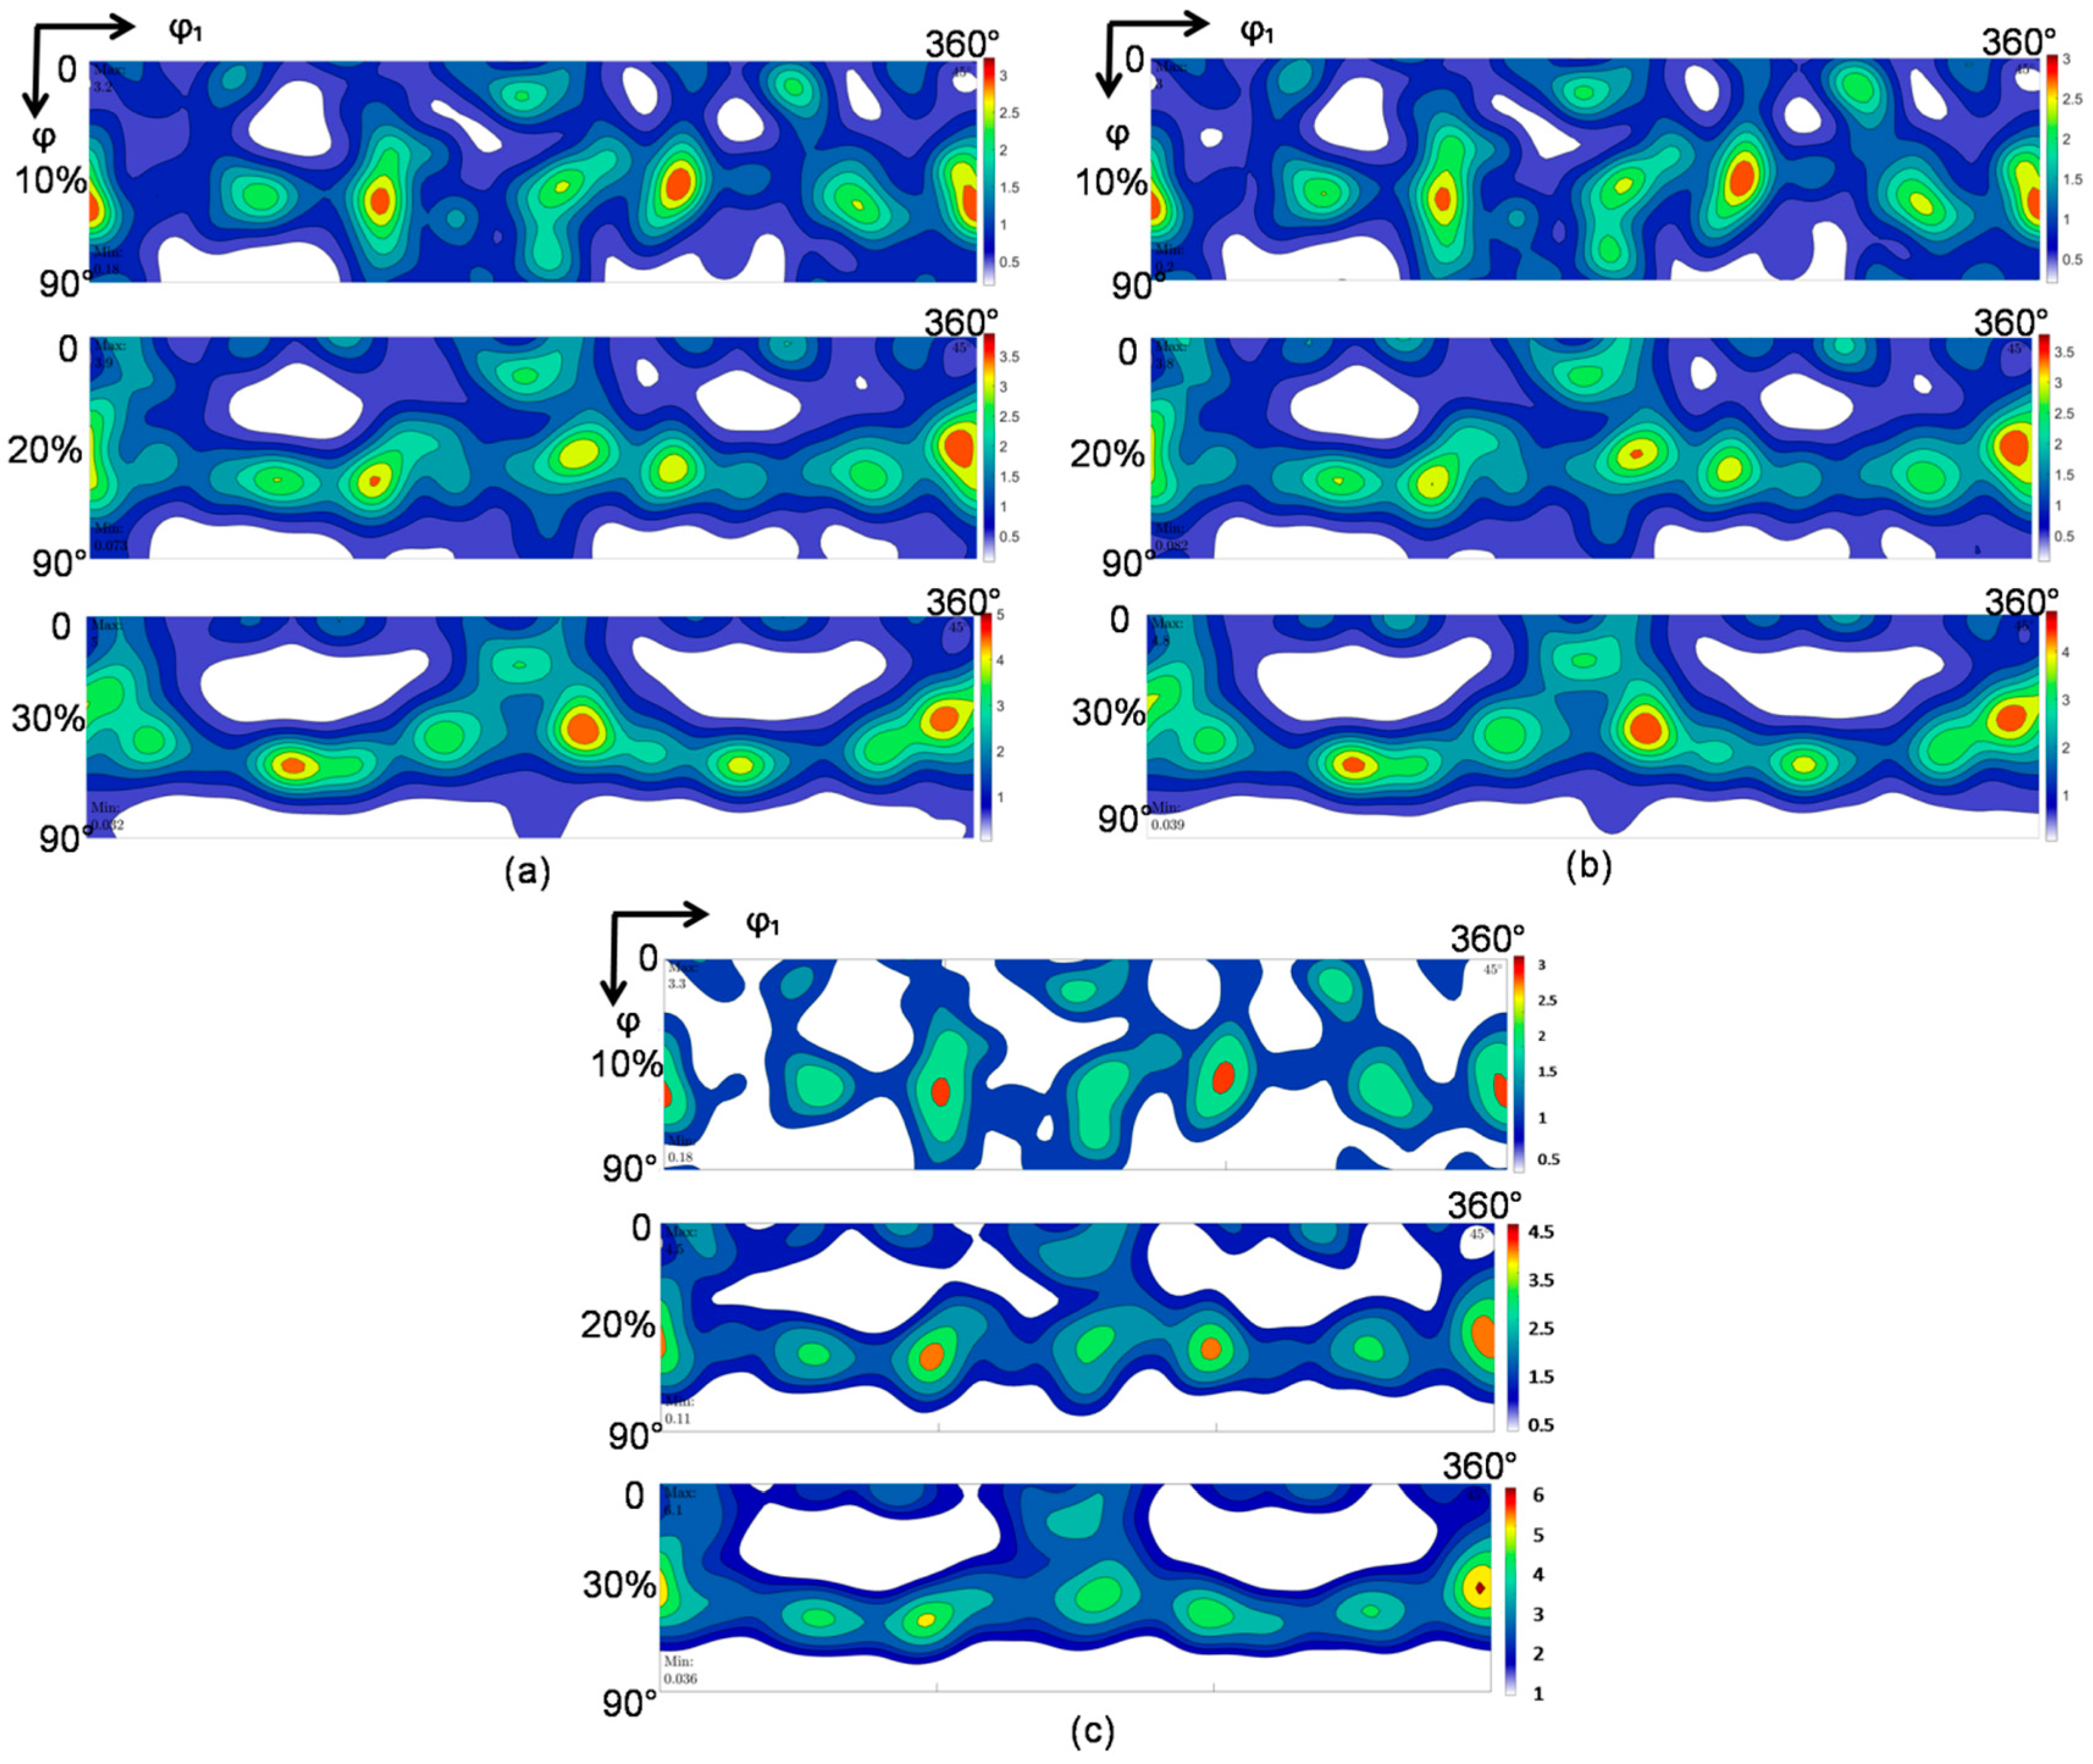
3.4. Texture after CPFE Cold Rolling Simulations

Figure 11 shows the results of simulations for one-, two- and three-slip systems in the form of ODF for 10%, 20% and 30% cold rolling using the initial statistical 3D microstructure (Figure 4) as an input. The simulations were found to give good results for two- and three-slip systems. The experiments were performed up to 40% cold rolling (deformation), but the simulation results were reported only up to 30% cold rolling. The simulation did not converge after 30%; the numerical solutions are not exactly accurate at large strains quantitatively because factors such as the accumulation of plastic strain, or shear banding, work hardening and microstructure evolution are not taken into account in simulations, which can affect simulation parameters such as rotation velocity, texture maxima and stable end orientations. Furthermore, the impact of grain boundaries, as well as the local variation in orientations while determining the constitutive relationship between the resolved shear stress and slip rate, may cause textural deviation during simulations. The trend of texture evolution followed in the simulations was close to the experimental results with slight variations. γ-fiber and α-fiber were observed for all the conditions, with α-fiber having higher intensity than its counterpart. θ-fiber, as in the case of the experimental results, was slightly weakened with increasing deformation, while a slight increase in intensity was observed in the simulated results. Nonetheless, the θ-fiber intensity was in a comparable range. The prediction of the final texture is generally dependent on the initial texture used in the simulation. Because the intensity of α-fiber is slightly higher in the initial texture, the prediction of α-fiber texture in the final texture is higher than that of γ-fiber. To compare the results quantitatively, volume fractions of various fibers and texture components were determined from the simulated results and are shown in Figure 12.
For the experiments, α-fiber was in the range of 30% to 39%, whereas γ-fiber was in the range of 20% to 44%. As the cold reduction increased from 10% to 40%, γ-fiber intensified to more than that of α-fiber, strengthening the observation reported in Figure 10. Around 9% volume fraction of F{111}<121> component and 7% of rotated cube component was present at the 40% cold-reduced sample. Volume fraction calculations in the simulated results also followed a similar trend to that of the experiments. The volume fraction of the α-fiber increased from around 28% to 39% when the reduction increased from 10% to 30%, whereas this increase was from 20% to 30% for γ-fiber under similar conditions. Thus, in simulations, α-fiber was present in a slightly more predominant way than the γ-fiber. Further, in order to make the comparison between experimental and simulated results more simplified, the differences in the volume fraction of each fiber and texture component was calculated. It was found that the difference was only around 10% considering all the sample conditions, suggesting a very close agreement between the experimental and simulated results.
The ODFs for the initial configuration, used as an input in the simulations and for the 10%, 20% and 30% cold-rolled samples, obtained experimentally and numerically, are presented in Figure 8, Figure 9 and Figure 10, respectively. A good agreement between them was achieved for 20% and 30% cold rolling, while the γ-fiber was underestimated in the simulations for the excessive rolling amount. It is well known that simulated textures cannot be predicted correctly at larger strains. There could be multiple reasons for this, such as higher shear bandings in the material at large strains, the fragmentation of grains and the development of near-boundary gradient zones.
Figure 13 depicts the effect of cold rolling reduction on von Mises strain and von Mises stress for the simulated data. As can be seen, both stress and strain increase as deformation increases. The average stress after a 10% cold rolling reduction was ~1100 MPa, which increased to ~2900 MPa after a 30% cold rolling reduction, while the average strain increased from 1.39% to 1.9%. In order to enhance the usage of Ti-15333 as sheet metal, it was important to understand its texture development by simulations also. Further, if even partially, the mechanical tests/experiments could be replaced by numerical studies for the characterization of material behaviors and then there would be a significant reduction in resource allocation in the design process (such as) of an alloy for a particular application.

4. Conclusions

In the present work, the microstructure and texture evolution of a Ti-15333 alloy during cold rolling for different amounts of thickness reductions were investigated experimentally, as well as numerically. The simulations were performed using PRISMS-plasticity, where the material parameters validated from the micro-indentation test with FE simulation were used. Slip bands formed in the initial phase of the deformation, while shear banding was the major feature of the microstructure at higher deformation. The Ti-15333 alloy developed strong α and γ fibers after cold rolling; the strength of both increased with the increase in cold rolling reduction. CPFE simulations were able to capture the developments of crystallographic texture during cold rolling with reasonable accuracy. The simulation of the 20% and 30% rolled samples matches the experimental results well. Due of the high strain in the 40% rolled sample, the simulation did not converge.

Author Contributions

Conceptualization, M.D., H.M. and R.K.K.; Methodology, D.M.; Software, D.M. and M.D.; Validation, D.M. and M.D.; Formal analysis, M.D., H.M. and R.K.K.; Investigation, D.M. and R.K.K.; Resources, R.K.K.; Writing—original draft, D.M., M.D. and R.K.K.; Writing—review & editing, M.D. and H.M.; Supervision, R.K.K.; Project administration, R.K.K.; Funding acquisition, R.K.K. All authors have read and agreed to the published version of the manuscript.

Funding

R.K.K. wishes to acknowledge the Science and Engineering Research Board (SERB) for financial assistance to carry out this work (grant no. EEQ/2016/000408).

Data Availability Statement

The raw/processed data required to reproduce these findings cannot be shared at this time as the data also forms a part of an ongoing study.

Acknowledgments

The authors D.M. and R.K.K. would like to thank VNIT Nagpur for providing the necessary facilities and the constant encouragement to publish this paper. These two authors would also like to acknowledge the use of the “National Facility of Texture & OIM” (a DST-IRPHA facility), IIT Bombay for the EBSD measurements.

Conflicts of Interest

The authors declare no conflict of interest.

References

  1. Donachie, M.J. Titanium—A Technical Guide, 2nd ed.; ASM International: Materials park, Ohio, 2000. [Google Scholar] [CrossRef]
  2. Boyer, R.R.; Briggs, R.D. The use of β titanium alloys in the aerospace industry. J. Mater. Eng. Perform. 2005, 14, 681–685. [Google Scholar] [CrossRef]
  3. Ankem, S.; Greene, C.A. Recent developments in microstructure/property relationships of beta titanium alloys. Mater. Sci. Eng. A 1999, 263, 127–131. [Google Scholar] [CrossRef]
  4. Terlinde, G.; Fischer, G.; Metallwerke, O.F. Beta Titanium Alloys. In Titanium and Titanium Alloys: Fundamentals and Applications; Leyens, C., Peters, M., Eds.; Wiley-VCH: Weinheim, Germany, 2003; pp. 37–57. [Google Scholar] [CrossRef]
  5. Bania, P.J. Beta titanium alloys and their role in the titanium industry. JOM J. Miner. Met. Mater. Soc. 1994, 46, 16–19. [Google Scholar] [CrossRef]
  6. Rosenberg, H.W. Ti-15-3: A New Cold-Formable Sheet Titanium Alloy. JOM J. Miner. Met. Mater. Soc. 1983, 35, 30–34. [Google Scholar] [CrossRef]
  7. Grosdidier, T.; Roubaud, C.; Philippe, M.J.; Combres, Y. The deformation mechanisms in the β-metastable β-cez titanium alloy. Scr. Mater. 1997, 36, 21–28. [Google Scholar] [CrossRef]
  8. Wood, R.A.; Williams, D.N.; Boyd, J.D.; Rothman, R.L.; Bartlett, E.S. Strain Transformable Beta Titanium·Base Alloys, AFML·TR·70-257. 1970. Available online: https://apps.dtic.mil/sti/citations/AD0877899 (accessed on 21 December 2022).
  9. Karasevskaya, O.P.; Ivasishin, O.M.; Semiatin, S.L.; Matviychuk, Y.V. Deformation behavior of beta-titanium alloys. Mater. Sci. Eng. A 2003, 354, 121–132. [Google Scholar] [CrossRef]
  10. Qiang, G.; Qing, W.; Dong-Li, S.; Xiu-Li, H.; Gao-Hui, W. Formation of nanostructure and mechanical properties of cold-rolled Ti-15V-3Sn-3Al-3Cr alloy. Mater. Sci. Eng. A 2010, 527, 4229–4232. [Google Scholar] [CrossRef]
  11. Ide, N.; Morita, T.; Takahashi, K.; Seto, H. Influence of cold rolling on fundamental properties of Ti-15V-3Cr-3Sn-3Al alloy. Mater. Trans. 2015, 56, 1800–1806. [Google Scholar] [CrossRef]
  12. Ivasishin, O.M.; Markovsky, P.E.; Matviychuk, Y.V.; Semiatin, S.L. Precipitation and recrystallization behavior of beta titanium alloys during continuous heat treatment. Metall. Mater. Trans. A Phys. Metall. Mater. Sci. 2003, 34, 147–158. [Google Scholar] [CrossRef]
  13. Gupta, A.; Khatirkar, R.K.; Kumar, A.; Thool, K.; Bibhanshu, N.; Suwas, S. Microstructure and texture development in Ti-15V-3Cr-3Sn-3Al alloy—Possible role of strain path. Mater. Charact. 2019, 156, 109884. [Google Scholar] [CrossRef]
  14. Hutchinson, W.B. Development and control of annealing textures in low-carbon steels. Int. Met. Rev. 1984, 29, 25–42. [Google Scholar] [CrossRef]
  15. Ray, R.K.; Jonas, J.J.; Hook, R.E. Cold rolling and annealing textures in low carbon and extra low carbon steels. Int. Mater. Rev. 1994, 39, 129–172. [Google Scholar] [CrossRef]
  16. Mishra, S.; Darmann, C. Role and control of texture in deep-drawing steels. Int. Met. Rev. 1982, 27, 307–320. [Google Scholar] [CrossRef]
  17. Juntunen, P.; Karjalainen, P.; Raabe, D.; Bolle, G.; Kopio, T. Optimizing continuous annealing of interstitial-free steels for improving deep drawability. Metall. Mater. Trans. A Phys. Metall. Mater. Sci. 2001, 32, 1989–1995. [Google Scholar] [CrossRef]
  18. Khatirkar, R.; Kestens, L.A.I.; Petrov, R.; Samajdar, I. Controlled Warm Working: Possible Tool for Optimizing Stored Energy Advantage in Deformed &gamma;-fiber (ND//&lsaquo;111&rsaquo;). ISIJ Int. 2009, 49, 78–85. [Google Scholar] [CrossRef] [Green Version]
  19. Khatirkar, R.; Vadavadagi, B.; Haldar, A.; Samajdar, I. ND//<111> Recrystallization in Interstitial Free Steel: The Defining Role of Growth Inhibition. ISIJ Int. 2012, 52, 894–901. [Google Scholar] [CrossRef] [Green Version]
  20. Gupta, A.; Khatirkar, R.K.; Dandekar, T.; Jha, J.S.; Mishra, S. Recrystallization behavior of a cold rolled Ti–15V–3Sn–3Cr–3Al alloy. J. Mater. Res. 2019, 34, 3082–3092. [Google Scholar] [CrossRef]
  21. Ghaderi, A.; Hodgson, P.D.; Barnett, M.R. Microstructure and texture development in Ti-5Al-5Mo- 5V-3Cr alloy during cold rolling and annealing. Key Eng. Mater. 2013, 551, 210–216. [Google Scholar]
  22. Gupta, A.; Khatirkar, R.K.; Kumar, A.; Thool, K.S.; Bhibhanshu, N.; Suwas, S. Texture Development During Cold Rolling of a β-Ti Alloy: Experiments and Simulations. Metall. Mater. Trans. A 2021, 52, 1031–1043. [Google Scholar] [CrossRef]
  23. Molinari, A.; Tóth, L.S. Tuning a self consistent viscoplastic model by finite element results—I. Modeling. Acta Metall. Mater. 1994, 42, 2453–2458. [Google Scholar] [CrossRef]
  24. Lebensohn, R.A.; Tomé, C.N. A self-consistent anisotropic approach for the simulation of plastic deformation and texture development of polycrystals: Application to zirconium alloys. Acta Metall. Mater. 1993, 41, 2611–2624. [Google Scholar] [CrossRef]
  25. Kumar, A.; Khatirkar, R.K.; Chalapathi, D.; Bibhanshu, N.; Suwas, S. Texture development during cold rolling of Fe–Cr–Ni alloy-experiments and simulations. Philos. Mag. 2017, 97, 1939–1962. [Google Scholar] [CrossRef]
  26. Furstoss, J.; Bernacki, M.; Petit, C.; Fausty, J.; Pino Muñoz, D.; Ganino, C. Full Field and Mean Field Modeling of Grain Growth in a Multiphase Material Under Dry Conditions: Application to Peridotites. J. Geophys. Res. Solid Earth 2020, 125, e2019JB018138. [Google Scholar] [CrossRef]
  27. Deeparekha, N.; Gupta, A.; Demiral, M.; Khatirkar, R.K. Cold Rolling of an Interstitial Free (IF) Steel—Experiments and Simulations; Elsevier Ltd: Amsterdam, The Netherlands, 2020. [Google Scholar] [CrossRef]
  28. Zhao, P.; Song En Low, T.; Wang, Y.; Niezgoda, S.R. An integrated full-field model of concurrent plastic deformation and microstructure evolution: Application to 3D simulation of dynamic recrystallization in polycrystalline copper. Int. J. Plast. 2016, 80, 38–55. [Google Scholar] [CrossRef] [Green Version]
  29. Zherebtsov, S.V.; Murzinova, M.A.; Klimova, M.V.; Salishchev, G.A.; Popov, A.A.; Semiatin, S.L. Microstructure evolution during warm working of Ti-5Al-5Mo-5V-1Cr-1Fe at 600 and 800°C. Mater. Sci. Eng. A 2013, 563, 168–176. [Google Scholar] [CrossRef] [Green Version]
  30. Sedighiani, K.; Diehl, M.; Traka, K.; Roters, F.; Sietsma, J.; Raabe, D. An efficient and robust approach to determine material parameters of crystal plasticity constitutive laws from macro-scale stress–strain curves. Int. J. Plast. 2020, 134, 102779. [Google Scholar] [CrossRef]
  31. Herrera-Solaz, V.; LLorca, J.; Dogan, E.; Karaman, I.; Segurado, J. An inverse optimization strategy to determine single crystal mechanical behavior from polycrystal tests: Application to AZ31 Mg alloy. Int. J. Plast. 2014, 57, 1–15. [Google Scholar] [CrossRef] [Green Version]
  32. Zambaldi, C.; Raabe, D. Plastic anisotropy of γ-TiAl revealed by axisymmetric indentation. Acta Mater. 2010, 58, 3516–3530. [Google Scholar] [CrossRef]
  33. Shirazi, H.A.; Mirmohammadi, S.A.; Shaali, M.; Asnafi, A.; Ayatollahi, M.R. A constitutive material model for a commercial PMMA bone cement using a combination of nano-indentation test and finite element analysis. Polym. Test. 2017, 59, 328–335. [Google Scholar] [CrossRef]
  34. Xiao, X.; Terentyev, D.; Bakaev, A.; Zinovev, A.; Dubinko, A.; Zhurkin, E.E. Crystal plasticity finite element method simulation for the nano-indentation of plasma-exposed tungsten. J. Nucl. Mater. 2019, 518, 334–341. [Google Scholar] [CrossRef]
  35. Liu, M.; Lu, C.; Tieu, A.K. Crystal plasticity finite element method modelling of indentation size effect. Int. J. Solids Struct. 2015, 54, 42–49. [Google Scholar] [CrossRef]
  36. Liu, M. Crystal Plasticity and Experimental Studies of Nano-Indentation of Aluminium and Copper, 2014. Available online: https://ro.uow.edu.au/theses (accessed on 21 December 2022).
  37. Zhang, T.; Wang, S.; Wang, W. Method to determine the optimal constitutive model from spherical indentation tests. Results Phys. 2018, 8, 716–727. [Google Scholar] [CrossRef]
  38. Demiral, M.; Roy, A.; Silberschmidt, V.V. Indentation studies in b.c.c. crystals with enhanced model of strain-gradient crystal plasticity. Comput. Mater. Sci. 2013, 79, 896–902. [Google Scholar] [CrossRef] [Green Version]
  39. Demiral, M.; Roy, A.; Silberschmidt, V.V. Numerical modelling of size effects in micro-cutting of fcc single crystal: Influence of strain gradients. J. Manuf. Process. 2022, 74, 511–519. [Google Scholar] [CrossRef]
  40. Chakraborty, A.; Eisenlohr, P. Evaluation of an inverse methodology for estimating constitutive parameters in face-centered cubic materials from single crystal indentations. Eur. J. Mech. ASolids 2017, 66, 114–124. [Google Scholar] [CrossRef]
  41. Nelder, J.A.; Mead, R. A Simplex Method for Function Minimization. Comput. J. 1965, 7, 308–313. [Google Scholar] [CrossRef]
  42. Zambaldi, C.; Yang, Y.; Bieler, T.R.; Raabe, D. Orientation informed nanoindentation of α-titanium: Indentation pileup in hexagonal metals deforming by prismatic slip. J. Mater. Res. 2012, 27, 356–367. [Google Scholar] [CrossRef]
  43. Lin, F.; Marteleur, M.; Alkorta, J.; Jacques, P.J.; Delannay, L. Local stress field induced by twinning in a metastable β titanium alloy. IOP Conf. Ser. Mater. Sci. Eng. 2017, 219, 012031. [Google Scholar] [CrossRef]
  44. Demiral, M.; Roy, A.; El Sayed, T.; Silberschmidt, V.V. Influence of strain gradients on lattice rotation in nano-indentation experiments: A numerical study. Mater. Sci. Eng. A 2014, 608, 73–81. [Google Scholar] [CrossRef] [Green Version]
  45. Gerday, A.F.; Ben Bettaieb, M.; Duchêne, L.; Clément, N.; Diarra, H.; Habraken, A.M. Interests and limitations of nanoindentation for bulk multiphase material identification: Application to the β phase of Ti-5553. Acta Mater. 2009, 57, 5186–5195. [Google Scholar] [CrossRef]
  46. Yalcinkaya, T.; Brekelmans, W.A.M.; Geers, M.G.D. BCC single crystal plasticity modeling and its experimental identification. Model. Simul. Mater. Sci. Eng. 2008, 16, 085007. [Google Scholar] [CrossRef]
  47. Yaghoobi, M.; Ganesan, S.; Sundar, S.; Lakshmanan, A.; Rudraraju, S.; Allison, J.E.; Sundararaghavan, V. PRISMS-Plasticity: An open-source crystal plasticity finite element software. Comput. Mater. Sci. 2019, 169, 109078. [Google Scholar] [CrossRef]
  48. Bunge, H.-J. Bunge_TextureAnalysis.pdf. 1982. Available online: http://www.ebsd.info/pdf/Bunge_TextureAnalysis.pdf (accessed on 21 December 2022).
  49. Vander Voort, G.F. Metallography and Microstructures; ASM International: Almere, Netherlands, 2004. [Google Scholar] [CrossRef]
  50. Bunge, H.-J. Zur darstellung allgemeiner texturen. Z. Fur Met. 1965, 56, 872. [Google Scholar] [CrossRef]
  51. Michael Smith ABAQUS/CAE User’s Manual. ABAQUS/CAE User’s Man. 2001, pp. 1–847. Available online: https://www.academia.edu/38631701/ABAQUS_CAE_Users_Manual_ABAQUS_CAE_Users_Manual (accessed on 21 December 2022).
  52. Huang, Y. A User-Material Subroutine Incorporating Single Crystal Plasticity in the ABAQUS Finite Element Program. MECH Report 178, Division of Engineering and Applied Sciences; Harvard University: Cambridge, MA, USA, 1991. [Google Scholar]
  53. Qidwai, M.A.S.; Lewis, A.C.; Geltmacher, A.B. Using image-based computational modeling to study microstructure-yield correlations in metals. Acta Mater. 2009, 57, 4233–4247. [Google Scholar] [CrossRef]
  54. Staroselsky, A.; Anand, L. A constitutive model for hcp materials deforming by slip and twinning. Int. J. Plast. 2003, 19, 1843–1864. [Google Scholar] [CrossRef]
  55. Sundararaghavan, V.; Zabaras, N. A multi-length scale sensitivity analysis for the control of texture-dependent properties in deformation processing. Int. J. Plast. 2008, 24, 1581–1605. [Google Scholar] [CrossRef]
  56. Kumar, A.; Jha, A. Introduction. In Anticandidal Agents; Elsevier: Amsterdam, The Netherlands, 2017; pp. 1–5. [Google Scholar] [CrossRef]
  57. Acar, P.; Ramazani, A.; Sundararaghavan, V. Crystal Plasticity Modeling and Experimental Validation with an Orientation Distribution Function for Ti-7Al Alloy. Metals 2017, 7, 459. [Google Scholar] [CrossRef] [Green Version]
  58. Prism, GraphPad Prism 8 User Guide—How to Learn Prism. 2019, pp. 1–688. Available online: https://www.graphpad.com/guides/prism/8/user-guide/how_to_learn_prism.htm (accessed on 21 December 2022).
  59. Anand, L.; Kothari, M. A computational procedure for rate independent crystal plasticity. J. Mech. Phys. Solids 1996, 44, 525–558. [Google Scholar] [CrossRef]
  60. Groeber, M.A.; Jackson, M.A. DREAM.3D: A Digital Representation Environment for the Analysis of Microstructure in 3D. Integr. Mater. Manuf. Innov. 2014, 3, 56–72. [Google Scholar] [CrossRef] [Green Version]
  61. Hielscher, R.; Schaeben, H. A novel pole figure inversion method: Specification of the MTEX algorithm. J. Appl. Crystallogr. 2008, 41, 1024–1037. [Google Scholar] [CrossRef]
  62. Dillamore, I.L.; Hazel, R.J.; Watson, T.W.; Hadden, P. An experimental study of the mechanical anisotropy of some common metals. Int. J. Mech. Sci. 1971, 13, 1049–1061. [Google Scholar] [CrossRef]
  63. Unnikrishnan, R.; Kumar, A.; Khatirkar, R.K.; Shekhawat, S.K.; Sapate, S.G. Structural developments in un-stabilized ultra low carbon steel during warm deformation and annealing. Mater. Chem. Phys. 2016, 183, 339–348. [Google Scholar] [CrossRef]
  64. Cicalè, S.; Samajdar, I.; Verlinden, B.; Abbruzzese, G.; Houtte, P. Van Development of Cold Rolled Texture and Microstructure in a Hot Band Fe-3%Si Steel. ISIJ Int. 2002, 42, 770–778. [Google Scholar] [CrossRef]
  65. Pantleon, W. Resolving the geometrically necessary dislocation content by conventional electron backscattering diffraction. Scr. Mater. 2008, 58, 994–997. [Google Scholar] [CrossRef]
Figure 1. ND inverse pole figure map with multiple indentations on the sample. The grain on which the indent was at the center is also highlighted and shown with the help of magnified SEM micrograph.
Crystals 13 00137 g001
Figure 2. The simulation set-up showing the indenter and the sample with the orientation considered for Ti-15333 alloy.
Crystals 13 00137 g002
Figure 3. Decomposition of the total deformation gradient into the elastic and plastic components.
Crystals 13 00137 g003
Figure 4. Statistical 3D microstructure consisting of 100 grains generated with DREAM.3D.
Crystals 13 00137 g004
Figure 5. (a) Experimentally and numerically obtained load–displacement curves, (b) the von Mises stress distribution in the workpiece at loading point 1 and (c) the pile-up profile on a cross-section and its isometric depiction at maximal loading (point 2).
Crystals 13 00137 g005
Figure 6. Pile-up structures of imprint obtained by FEM and SEM.
Crystals 13 00137 g006
Figure 7. Optical microstructures for (a) SA, (b) 10%, (c) 20%, (d) 30% and (e) 40% cold-rolled samples.
Crystals 13 00137 g007
Figure 8. Secondary electron SEM images of (a) 10%, (b) 20%, (c) 30% and (d) 40% cold-rolled samples. A magnified image of a 40% rolled sample with a shear band crossing the grain boundary is also shown in (d).
Crystals 13 00137 g008
Figure 9. (a) φ2 = 45° constant section of orientation distribution functions (ODF) showing important components and (b) ODF of SA sample. (c,d) PF of experimental and discretized+simulated SA sample, respectively.
Crystals 13 00137 g009
Figure 10. φ2 = 45° constant section of ODF for (a) 10%, (b) 20%, (c) 30% and (d) 40% cold-rolled samples (experimental).
Crystals 13 00137 g010
Figure 11. φ2 = 45° constant section of ODF after simulations for (a) one-slip system, (b) two-slip systems and (c)three-slip systems.
Crystals 13 00137 g011
Figure 12. Volume fractions (%) for initial SA and cold-rolled β-Ti alloy. (a) For fibers (experimental), (b) for individual components (experimental), (c) for fibers (after simulations) and (d) for individual components (after simulations).
Crystals 13 00137 g012
Figure 13. Development of (a) average von Mises strain and (b) average von Mises stress with increasing cold rolling reduction obtained from simulations.
Crystals 13 00137 g013
Table 1. Chemical composition (in weight% alloying elements) of the Ti-15333 sheet.
VAlSnCrMoSiTi
Ti-1533314.503.593.362.351.230.44Balance
Disclaimer/Publisher’s Note: The statements, opinions and data contained in all publications are solely those of the individual author(s) and contributor(s) and not of MDPI and/or the editor(s). MDPI and/or the editor(s) disclaim responsibility for any injury to people or property resulting from any ideas, methods, instructions or products referred to in the content.

