1. Introduction
Numerically modelling the solidification of dendritic metal microstructures is often approached as a two-dimensional (2D) problem due to the often prohibitive computational resources required to obtain three-dimensional (3D) solutions at a useful scale and in a reasonable time frame [
1,
2,
3]. Many of the basic mechanisms are the same in both 2D and 3D simulations, meaning 2D models can demonstrate fundamental behaviour and be used to make qualitative comparisons with experiments at a fraction of the computational cost. However, it can never be overlooked that dendrites are always three-dimensional objects in reality, meaning that quantitative comparisons between 2D simulations an experimental results are generally not feasible due to the often significant differences between how solidifying systems develop in 2D compared to reality.
It has been widely observed that 2D dendrites often display a significantly different morphology to their 3D counterparts, with different behaviour observed in spacing [
4,
5], side branching [
2,
6,
7], fragmentation [
8] and tip shape [
1,
9]. The fundamental cause of these differences is the more efficient diffusion facilitated by the extra dimension existing in 3D, which allows dendrite arms to grow more closely and sometimes even fuse together in a manner not replicable in 2D models due to the higher solute concentration gradient surrounding the dendrites. This diffusion behaviour has a further impact on the observed growth speed between 2D and 3D simulations, where the higher concentration gradient in 2D causes the dendrite tip velocity to be significantly lower [
1,
2,
5,
10,
11,
12]. These differences can be further compounded when considering the concurrent modelling of other physical processes, for example fluid flow. Modelling fluid flow restricted to 2D requires simplifying assumptions [
13] even before considering the significant interactions both natural and forced flow can have with the solute transport behaviour to influence the solidification process. When simulating dendritic solidification with flow, 3D modelling produces a thinner solute layer as fluid may flow in many directions around the complex geometry of a dendritic network, causing faster growth and a different morphology to develop. In contrast, in 2D modelling a thicker solute layer is observed due to flow needing to pass around the tips of dendrites rather than being able to flow around the stems as it can in reality. This makes it far easier for recirculation to occur and solute to become trapped [
6,
7,
12,
14,
15]. Dendrite arm growth under convection shows the same general behaviour in both 2D and 3D as in both cases the upstream dendrite arms grow faster than those downstream. However, despite the 3D systems still growing faster overall, the differences between the upstream and downstream arms is far less extreme than in 2D simulations due to the greater ease with which the flow can propagate around the network [
2,
3].
Beyond these fundamental aspects of the solidification process which impact all 2D simulations, the 3D nature of dendritic growth in reality can lead to almost systematic differences in the development of some processes such that only qualitative comparisons can be drawn between the final microstructures. One example of this would be modelling the columnar-to-equiaxed transition, where significantly different grain sizes and overall morphologies are observed when compared to experiments. This is due to equiaxed dendrites being able to block entire fronts of columnar dendrites unrealistically easily as in 2D there is no way for the columnar front to grow around the sides of an equiaxed dendrite as it can in reality [
11,
12]. Furthermore, there are intrinsically 3D elements of this process which must be ignored in 2D, such as the full range of orientations the dendrites may have and the heterogeneous distribution of the equiaxed dendrites in 3D space. The issue of the potential dendrite orientations allowing for rotation or out-of plane-bending necessarily ignored by 2D modelling, has been found to be a significant factor in accurately predicting the competitive growth of dendrites [
16,
17]. Competitive growth behaviour is much more complex than 2D modelling indicates, such that it provides a poor match with even thin sample experiments in all but very specific scenarios [
18].
Experimental results have demonstrated that during the solidification process dendrites can become misorientated [
19], deform [
20] and even fragment [
21] due to structural mechanical effects driven by numerous potential sources including, gravity, thermal expansion or partial remelting [
22]. While this behaviour is often identified as a key factor in the formation of casting defects and can alter the development of the microstructure more generally, research into understanding these mechanisms remains sparse. This is particularly true when it comes to numerically modelling, where the impact of structural mechanics on the development of the microstructure is generally ignored. When structural mechanical behaviour is considered as a factor it is often only done to post-process an existing dendritic microstructure [
23,
24,
25], without considering any interaction structural effects may have had with the solidification process. One notable exception is the work done by Yamaguchi and Beckermann [
26], who combined a phase field solidification model with the finite element method in a fully coupled framework of interdependent microstructure solidification and structural mechanics, albeit limited in many ways as highlighted by the authors. Furthermore, with the exception of the work by Yang et al. [
23] where the structural behaviour of a simplified structure roughly approximating a dendrite is modelled, all existing modelling has been performed in 2D. This, aside from the differences in fundamental solidification behaviour outlined earlier, has large implications on the expected structural mechanical behaviour, even before considering how this interacts with the solidification process. Much of the structural mechanical behaviour observed in experiments is fundamentally 3D, where any examples of dendrites rotating or bending out of plane are impossible to model in 2D [
21,
22]. The exclusion of these potential orientations means that at best a qualitative match with experiments can be expected when modelling phenomena such as crystal mosaicity [
27] or competitive growth with misorientated dendrites which may lead to defects.
In previous work by the authors in Soar et al. [
28], structural mechanics and microstructure solidification were concurrently modelled in 2D such that the preferential growth orientation of the dendrites was altered by displacements arising during growth perpendicular to a constant supergravity body force. This fully coupled framework is representative of cases where the orientation change is more significant to microstructure development than the deformation itself, such that even if the absolute displacement at the tip remains quite small relative to the dendrite size, the gradient of the displacements can still cause significant misorientation. In a subsequent paper [
29] this framework expanded the modelling into 3D and tested its capability for modelling fundamentally 3D structural effects using a selection of idealised cases. Furthermore, it was also observed in this paper when modelling a 3D system with an identical problem setup to a case modelled in 2D in the earlier paper [
28], the observed orientations, deformations and final microstructure were all significantly different. This contribution will expand on this point and explore how the modelling assumptions for both solidification and structural mechanics in 2D can significantly alter how microstructures develop, meaning that 2D modelling of coupled microstructure solidification with structural mechanics can generally only provide qualitative insights into some aspects of fundamental behaviour, as the final 2D microstructure predicted will always be significantly different to the 3D reality. The results presented have been chosen to explore these differences in structural behaviour between 3D and 2D simulations for a single dendrite grown under otherwise identical modelling conditions. The cases were chosen as to allow for easy comparison and to highlight the differences in behaviour rather than to necessarily predict any specific mechanism.
2. Numerical Modelling
The numerical modelling used in this paper is largely identical to that laid out in previous papers written by the authors on this topic [
28,
29], with this section providing a quick summary of the methods used while highlighting any differences in implementation that were required to obtain the results presented.
The evolution of the alloy microstructure for all cases examined in this paper uses a finite difference decentred octahedron (or square in 2D) Cellular Automata (CA) method which is based on the Imperial College µMatIC code [
4,
14,
30], further developed into the bespoke numerical code Thermo Electric Solidification Algorithm (TESA) which uses parallel processing to solve large scale, complex multi-physics problems [
31,
32,
33]. The governing equations used for solidification are the transient phase change and solute partitioning given by
where
and
are the liquid and solid concentration respectively ,
is the partition coefficient,
is the solid fraction,
is the mass diffusivity and
t is time. Diffusive transport is then governed by
with the equivalent concentration defined as
. A Frozen Temperature Approximation is taken, which for a constant thermal gradient increasing along
x and constant cooling rate gives the explicit spatial and temporal temperature as
where
is the initial lowest temperature at the west wall and
Q is the constant cooling rate. The equilibrium temperature of the interface is given by
where
is the initial concentration,
is the liquidus temperature at this initial concentration and
is the liquidus slope.
The structural mechanical behaviour in the system is modelled using a Linear Elastic material model, requiring assumptions that the displacements are ’small’, that there is no plastic deformation occurring and that there is a linear relationship between stress and strain. While these simplifying assumptions cannot be held as applicable for all cases where structural mechanics has an impact on microstructure solidification, they are sufficient for examining the cases where the absolute displacement is small relative to gradient of displacement (and hence orientation change) at the tip of the dendrite as have been explored in this paper and previous work.
Due to the scope of this paper, examining the impact of 2D assumptions on the concurrent modelling of microstructure solidification with structural mechanics, there are three sets of governing Linear Elasticity equations which must be considered. The first is for modelling a fully 3D system as was done in Soar et al. [
29], which requires no further assumptions and has the stationary solution for displacement behaviour of a linear elastic structure under external forces being governed by the following set of three partial differential equations:
where
u,
v and
w are the displacements in the
x,
y and
z direction,
,
and
are the corresponding body forces and the Lamé constants
and
are defined as:
taking
E and
to be the Young’s Modulus and Poisson’s ratio of the material respectively. In this implementation we allow for variable material properties for a solidifying structure by defining the Young’s Modulus as a parameter which can vary according to a linear relationship with the solid fraction, such that a fully solidified material will have the maximal Young’s Modulus chosen for the material and liquid cells are given a trivially small Young’s modulus value which will provide no resistance to structural movement if modelled.
When solving a structural mechanics problem in 2D an assumption must be made about the thickness of the 2D structure being modelled. In the previous modelling found in Soar et al. [
28] plane strain was assumed, meaning that the out-of-plane thickness dimension is much larger than the other two dimensions, allowing an assumption to be made that the displacements
w in the
z direction are functionally zero, causing the out-of-plane strains to correspondingly vanish. Once these assumptions have been considered, the system of partial differential equations that needs to be solved for the displacements of a stationary 2D plane strain linear elasticity problems are reduced to:
The other 2D assumption that can be made when representing a 2D structure is that of plane stress, which assumes that the out-of-plane thickness dimension is much smaller than the other two dimensions. This means out-of-plane stresses can be considered as negligible and can be ignored, though out-of-plane displacement is allowed to occur. These assumptions allow the system of partial differential equations for the displacement of a stationary 2D plane stress linear elasticity problem to be reduced to:
The numerical approach being used to solve this system is the same irrespective of the assumption chosen to represent the thickness dimension, utilising a Finite Volume Structural Mechanics Solver (FVSMS) which stores the displacements at the cell faces. While it is somewhat unusual to use Finite Volume Methods for structural mechanics, there have been many studies which have found the method to be comparable in accuracy to the more popular Finite Element Method [
34,
35,
36], while synergising better for the purposes of coupling the structural mechanics process to flow and solidification. This implementation treats structural mechanics as a quasi-stationary process where only displacements occurring since the previous call of the FVSMS are calculated, requiring body forces to act transiently such that rather than considering the total force acting upon a structure, only the changes in the forces since the previous timestep are applied.
The structural mechanics is coupled to solidification using the displacements at a given timestep to alter the crystallographic orientation of the dendrite. This is done locally for each volume comprising the dendrite such that orientations observed throughout a single dendrite can vary dramatically depending on how much displacement a region of the dendrite experiences. This is implemented in the same manner as employed in previous work, where it has been applied to both 2D [
28] and 3D [
29] problems. For prior 3D work the displacements were used to obtain three extrinsic rotations
,
and
around their corresponding axes that combined to describe a 3D orientation change, but for the results presented here the orientation changes around the
x and
y axes are ignored for easier comparison with the 2D solutions. This is required because, even though a single fixed body force acting acting upon the structure primarily alters the orientation around only one axis, over the course of a simulation the orientation change around the other two axes can still accumulate to a significant enough degree that visible 3D behaviour such as twisting and out-of-plane bending can occur which makes comparison between the final microstructures less obvious.
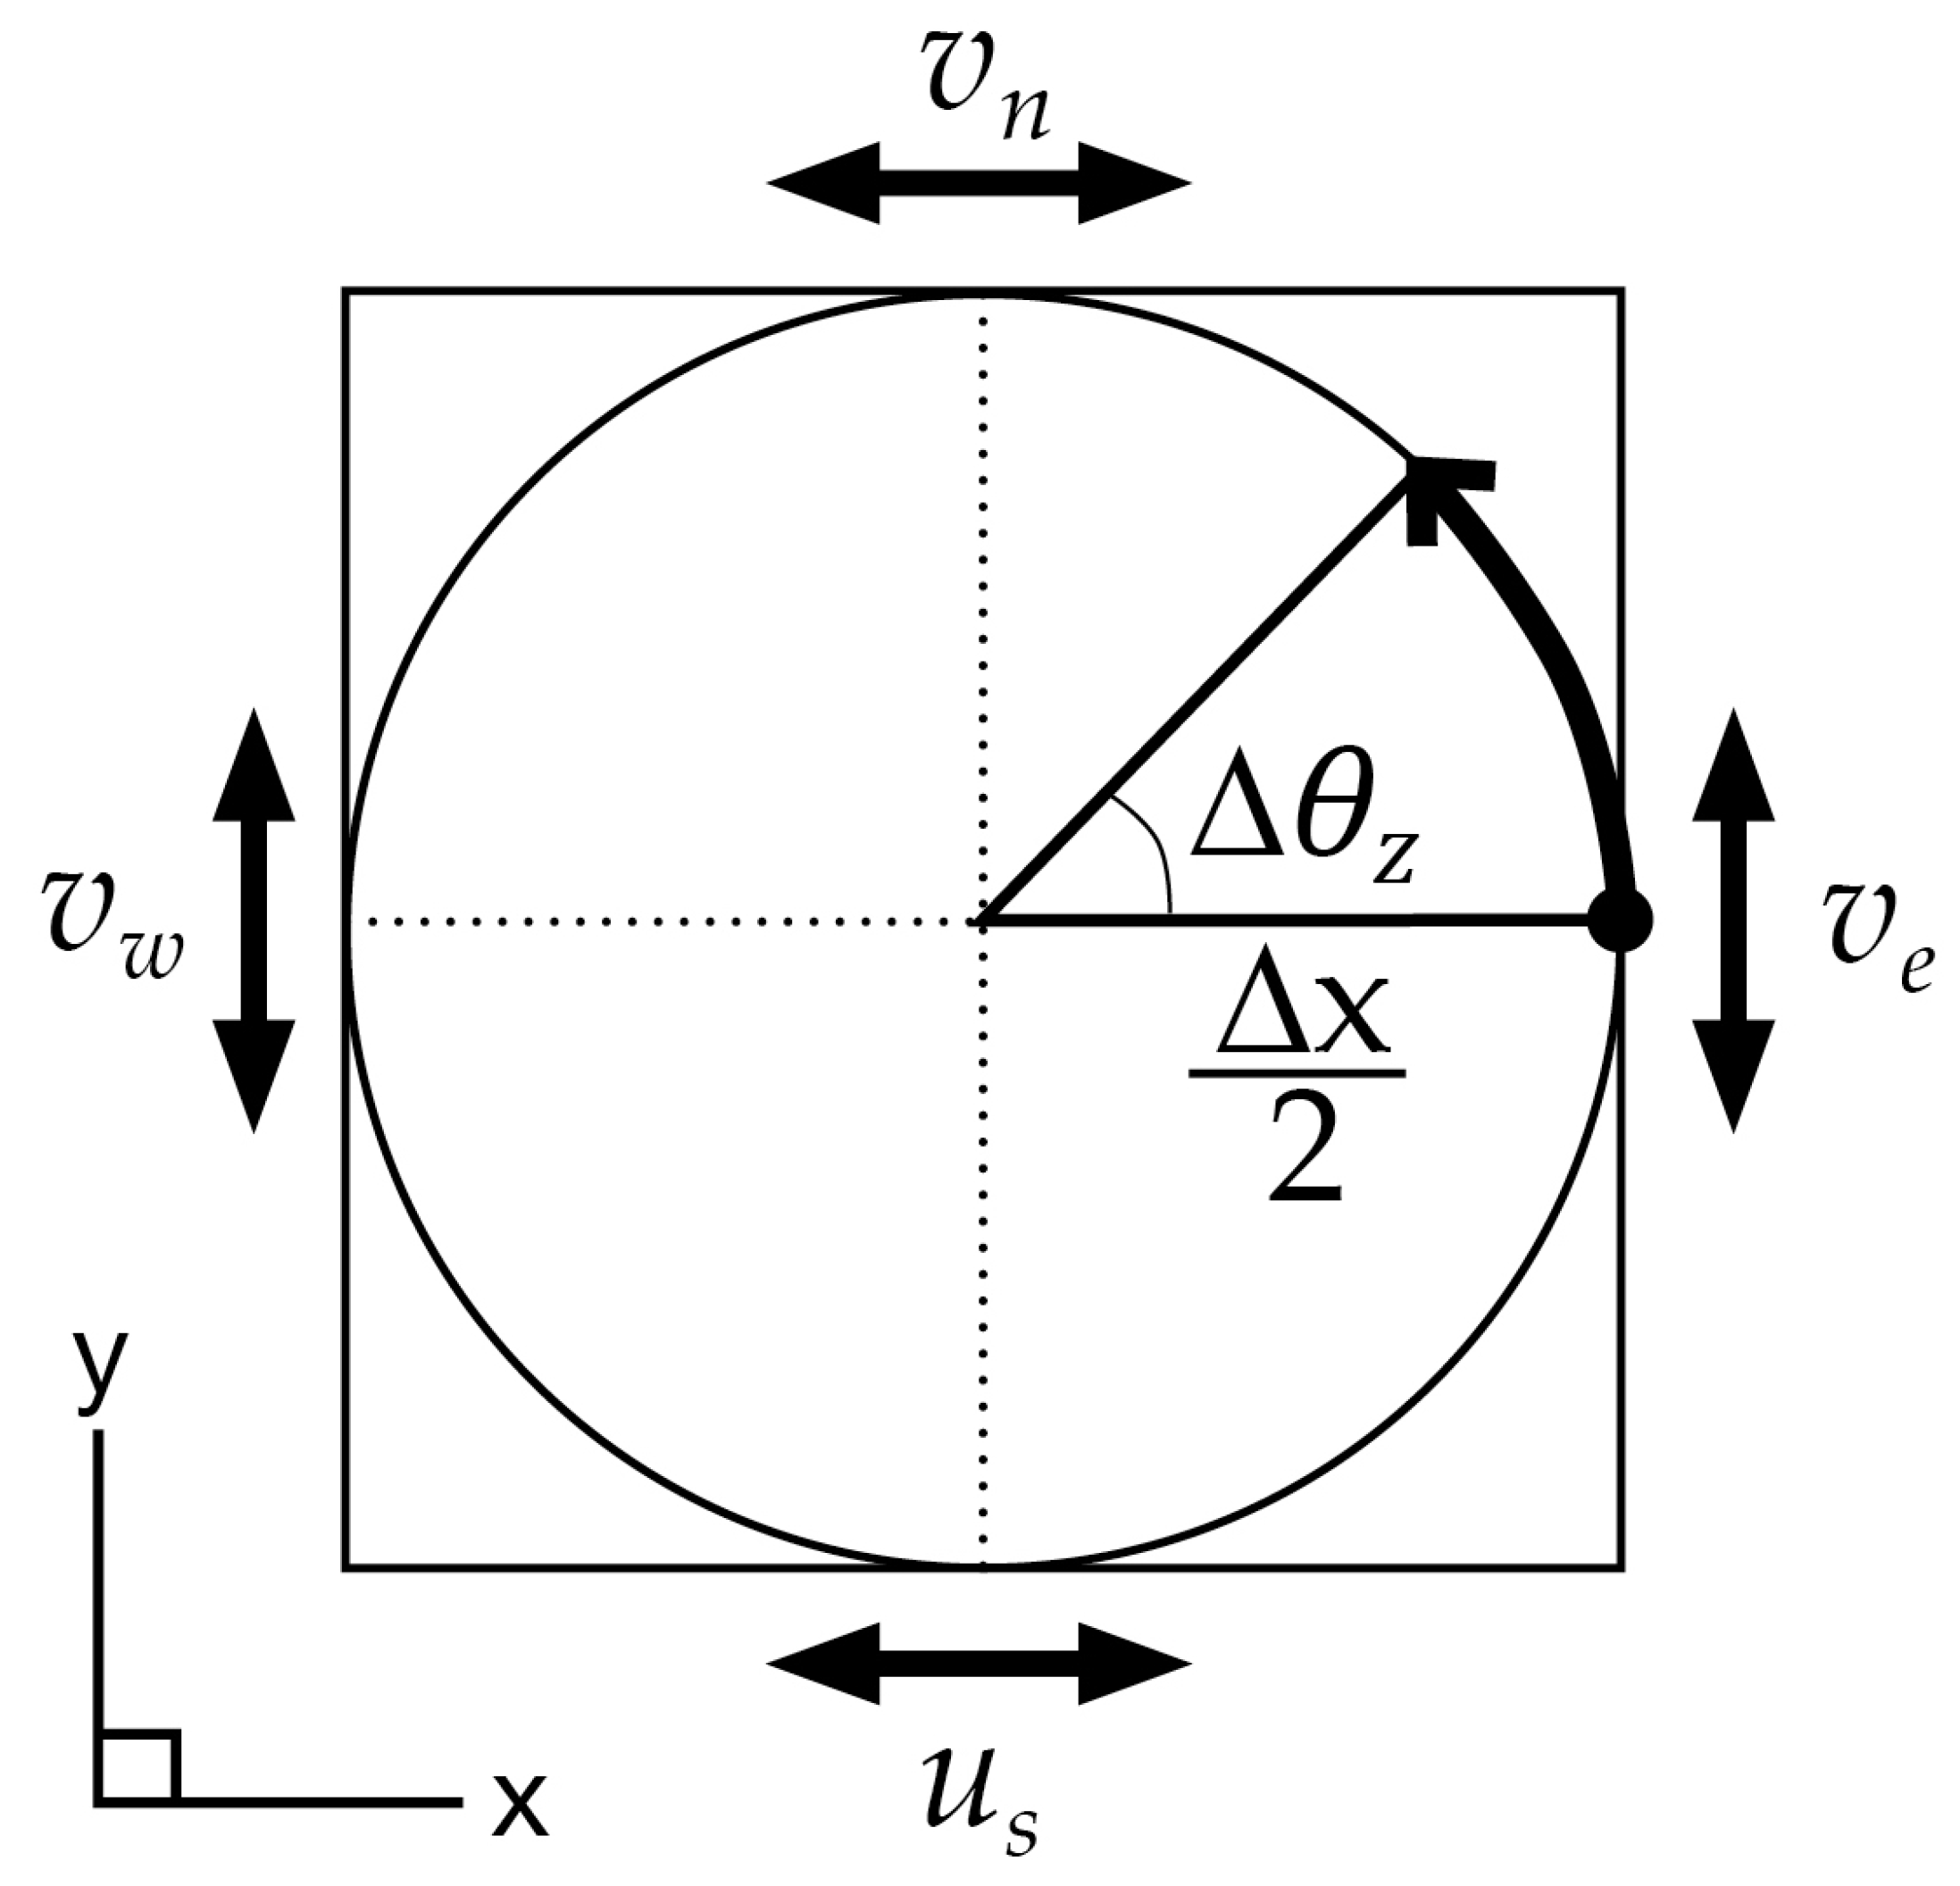
Consequently, for the cases being examined in this paper, the only change in cell orientation being calculated will be around the
z axis in 3D, which is also the only orientation change requiring calculation in 2D problems. This rotation is calculated for each volume of the structure by summing the displacements to form an arc between the initial and displaced position of a point in the centre of the face of the volume as demonstrated in
Figure 1, defining the change in rotation around
z as
where the subscripts
e,
w,
n and
s indicate that the displacements being used are spatially located respectively at the East, West, North and South faces of the volume. For the duration of any simulations presented in this paper
throughout the structure, either by definition for 2D cases or being fixed at these values for 3D cases.
To summarise the numerical approach being used, the CA method will calculate the microstructural evolution, causing changes to the material properties as well as the body force being applied to the structure when structural mechanics is solved. The FVSMS generates displacements which are used to calculate changes to the local crystallographic orientations, which then alter how the CA method develops until structural mechanics is next solved.
3. Modelling Set-Up
The relevant material properties and problem setup values used for all cases can be found in
Table 1, which are analogous to those used for experiments with a semi-solid Ga-25 wt%-In alloy, chosen to provide easier comparison with earlier work published by Soar et al. [
28]. The domain used for all cases presented has a width of
and a height of
. The depth of the domain depends on the case being modelled, with 2D solutions having no depth directly modelled (though the equations for plane stress assume an infinitesimally thin structure and plane strain assume it is infinitely thick), thin sample simulations have a depth of
and all other 3D simulations have a depth of
. These domains are all divided into square (2D) or cubic (3D) volumes with a cell size of
. It should be noted that while cases will be referred to as ‘thin sample’ and ‘3D’, this is simply for convenience as ‘thin sample’ cases are still fully modelled in 3D for both structural mechanics and solidification.
For ease of comparison, all cases presented are using the same fixed uniform body force of , with the other body force components set . This force had to be chosen rather arbitrarily due to the paucity of documented information about the mechanical properties of a single dendrite or the magnitude of any forces experienced in cases where significant bending has been observed in experiments. This represents a system with a 1:1 ratio between force and Young’s Modulus, this force being found to induce significant and visually distinct displacements for easy visual comparisons despite the relatively small modelling domains.
The temperature is defined for all cases assuming nucleation occurs at a small initial undercooling of 5 K below the liquidus temperature starting at the west wall. The temperature increases with a constant temperature gradient of aligned with the x axis through the rest of the domain. The system then cools at a constant rate of throughout the simulation. As the temperature variations are small at the microscale for this setup, the effect of thermal expansion has been neglected and the material properties have been assumed to be temperature independent.
It should be noted that as there is a linear relationship between the applied force and Young’s modulus, increasing or decreasing both quantities by the same amount will cause the same displacement to be predicted, meaning that the results presented apply to a whole family of solutions with the same ratio of E:F, making the exact values being chosen here somewhat arbitrary. The boundary conditions used are also the same for all domains, with the west wall where the dendrite is seeded using a fixed Dirichlet condition to anchor the structure and the north, south, high and low boundaries periodic for both structural mechanics and solidification such that the system could be considered as being part of a larger sample growing under the same conditions.
4. Validation
Before examining how 2D assumptions alter the behaviour of coupled structural mechanics and microstructure solidification, it seemed prudent to model cases using only the structural mechanics solver to remove solidification as a factor. This serves not only to validate the accuracy of the solutions for the three sets of governing equations but also provides a baseline for the impact of 2D assumptions on structural behaviour which will be instructive to refer back to when exploring the interactions of these assumptions with growing dendrites.
A cantilever beam structure was modelled with dimensions
. This was fixed to the centre of the western wall of the domain and had a uniformly distributed body force applied using the same structural material properties as defined above for the dendrites. A cantilever beam was chosen for this validation case for multiple reasons. With these dimensions the beam structure should be as similar in aspect ratio to the dendrites that will be modelled as can be achieved with a single geometric shape. Furthermore, in the literature both for modelling and when interpreting experiments, many authors have published results where an analogy was made that a single columnar dendrite behaves like a cantilever beam [
19,
20,
21,
24], making the results of a deforming beam a natural baseline reference for the fully coupled behaviour presented in the results. Another benefit of modelling a cantilever beam is that its behaviour can also be represented using the Euler–Bernoulli beam theory to derive a 1D analytic solution which accounts for the thickness of the beam. The process of deriving these analytic solutions along with any corresponding assumptions have been covered in detail in many other places [
37], but for the purposes of this validation it is sufficient to know that the displacement
along the beam experiencing a uniform load can be calculated at any given point
x using
where
I is the second moment of area for the beam’s cross section and
L is the total length of the beam.
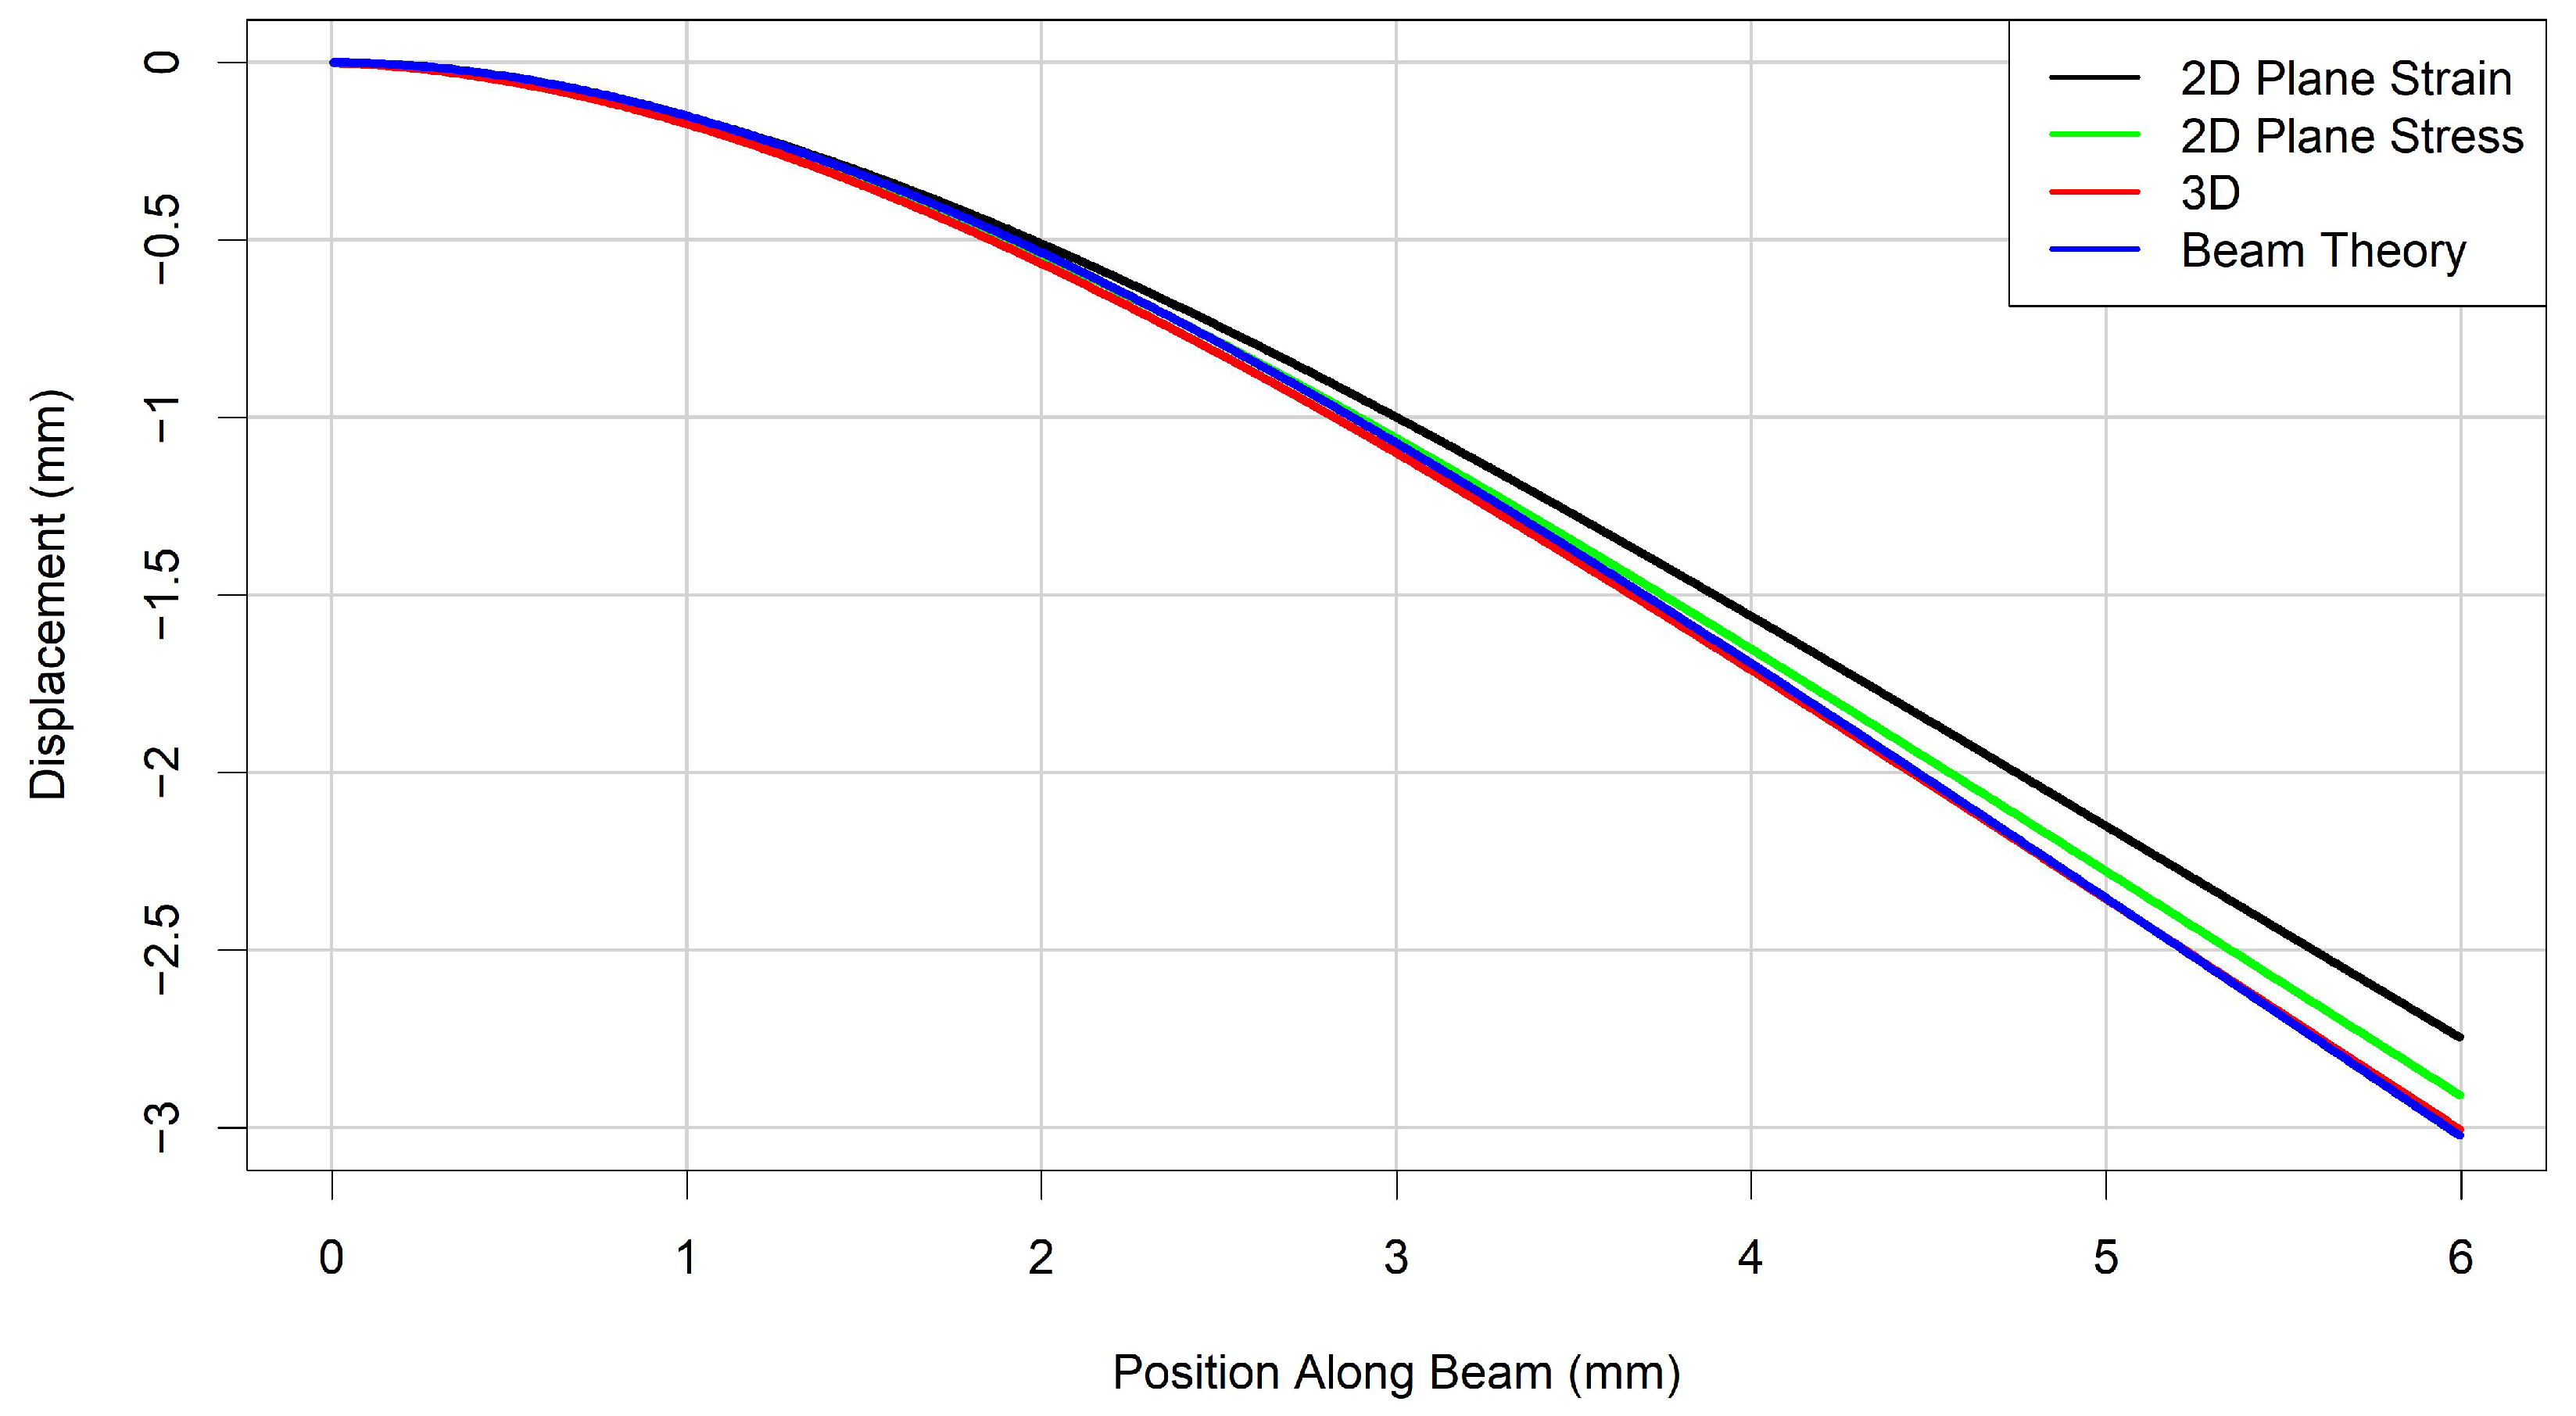
The results for the displacement
v were calculated for beams using the analytic solution, 2D plane strain, 2D plane stress and in 3D, with the resulting displacements observed along the entire length of the beam being shown in
Figure 2. Note that while displacements in
x were calculated in all cases other than in the analytic solution, and displacements in
z were calculated in 3D, these have been omitted due to being relatively insignificant in magnitude and as there are no means of comparing them with the analytic solution. Looking at the results it can be seen that the 3D modelling provides a very close match to the analytic solution, with 2D plane stress under-predicting the displacement slightly and the 2D plane strain solution predicting a significantly lower displacement than even the plane stress solution. However, all cases show similar behaviour and the displacements obtained are all of the same order of magnitude, with the displacement at the tip of the beam varying by less than
of displacements obtained from the beam theory solution even for the 2D cases. This indicates that while there may be a degree of systematic under prediction when using 2D modelling assumptions which could prove to be significant in some cases, all governing equations nevertheless provide a reasonably accurate stationary solution for the displacements of a structure.
5. Results and Discussion
A natural extension of the beam validation results is to examine how the calculated displacements of dendrites are altered by using different modelling assumptions within an uncoupled framework. The results in this section will be examples of post processing, where the structural mechanics provides a prediction of how a structure reacts to external forces, but structural mechanics is not considered as a factor which will influence the growth behaviour of the dendrites at any point.
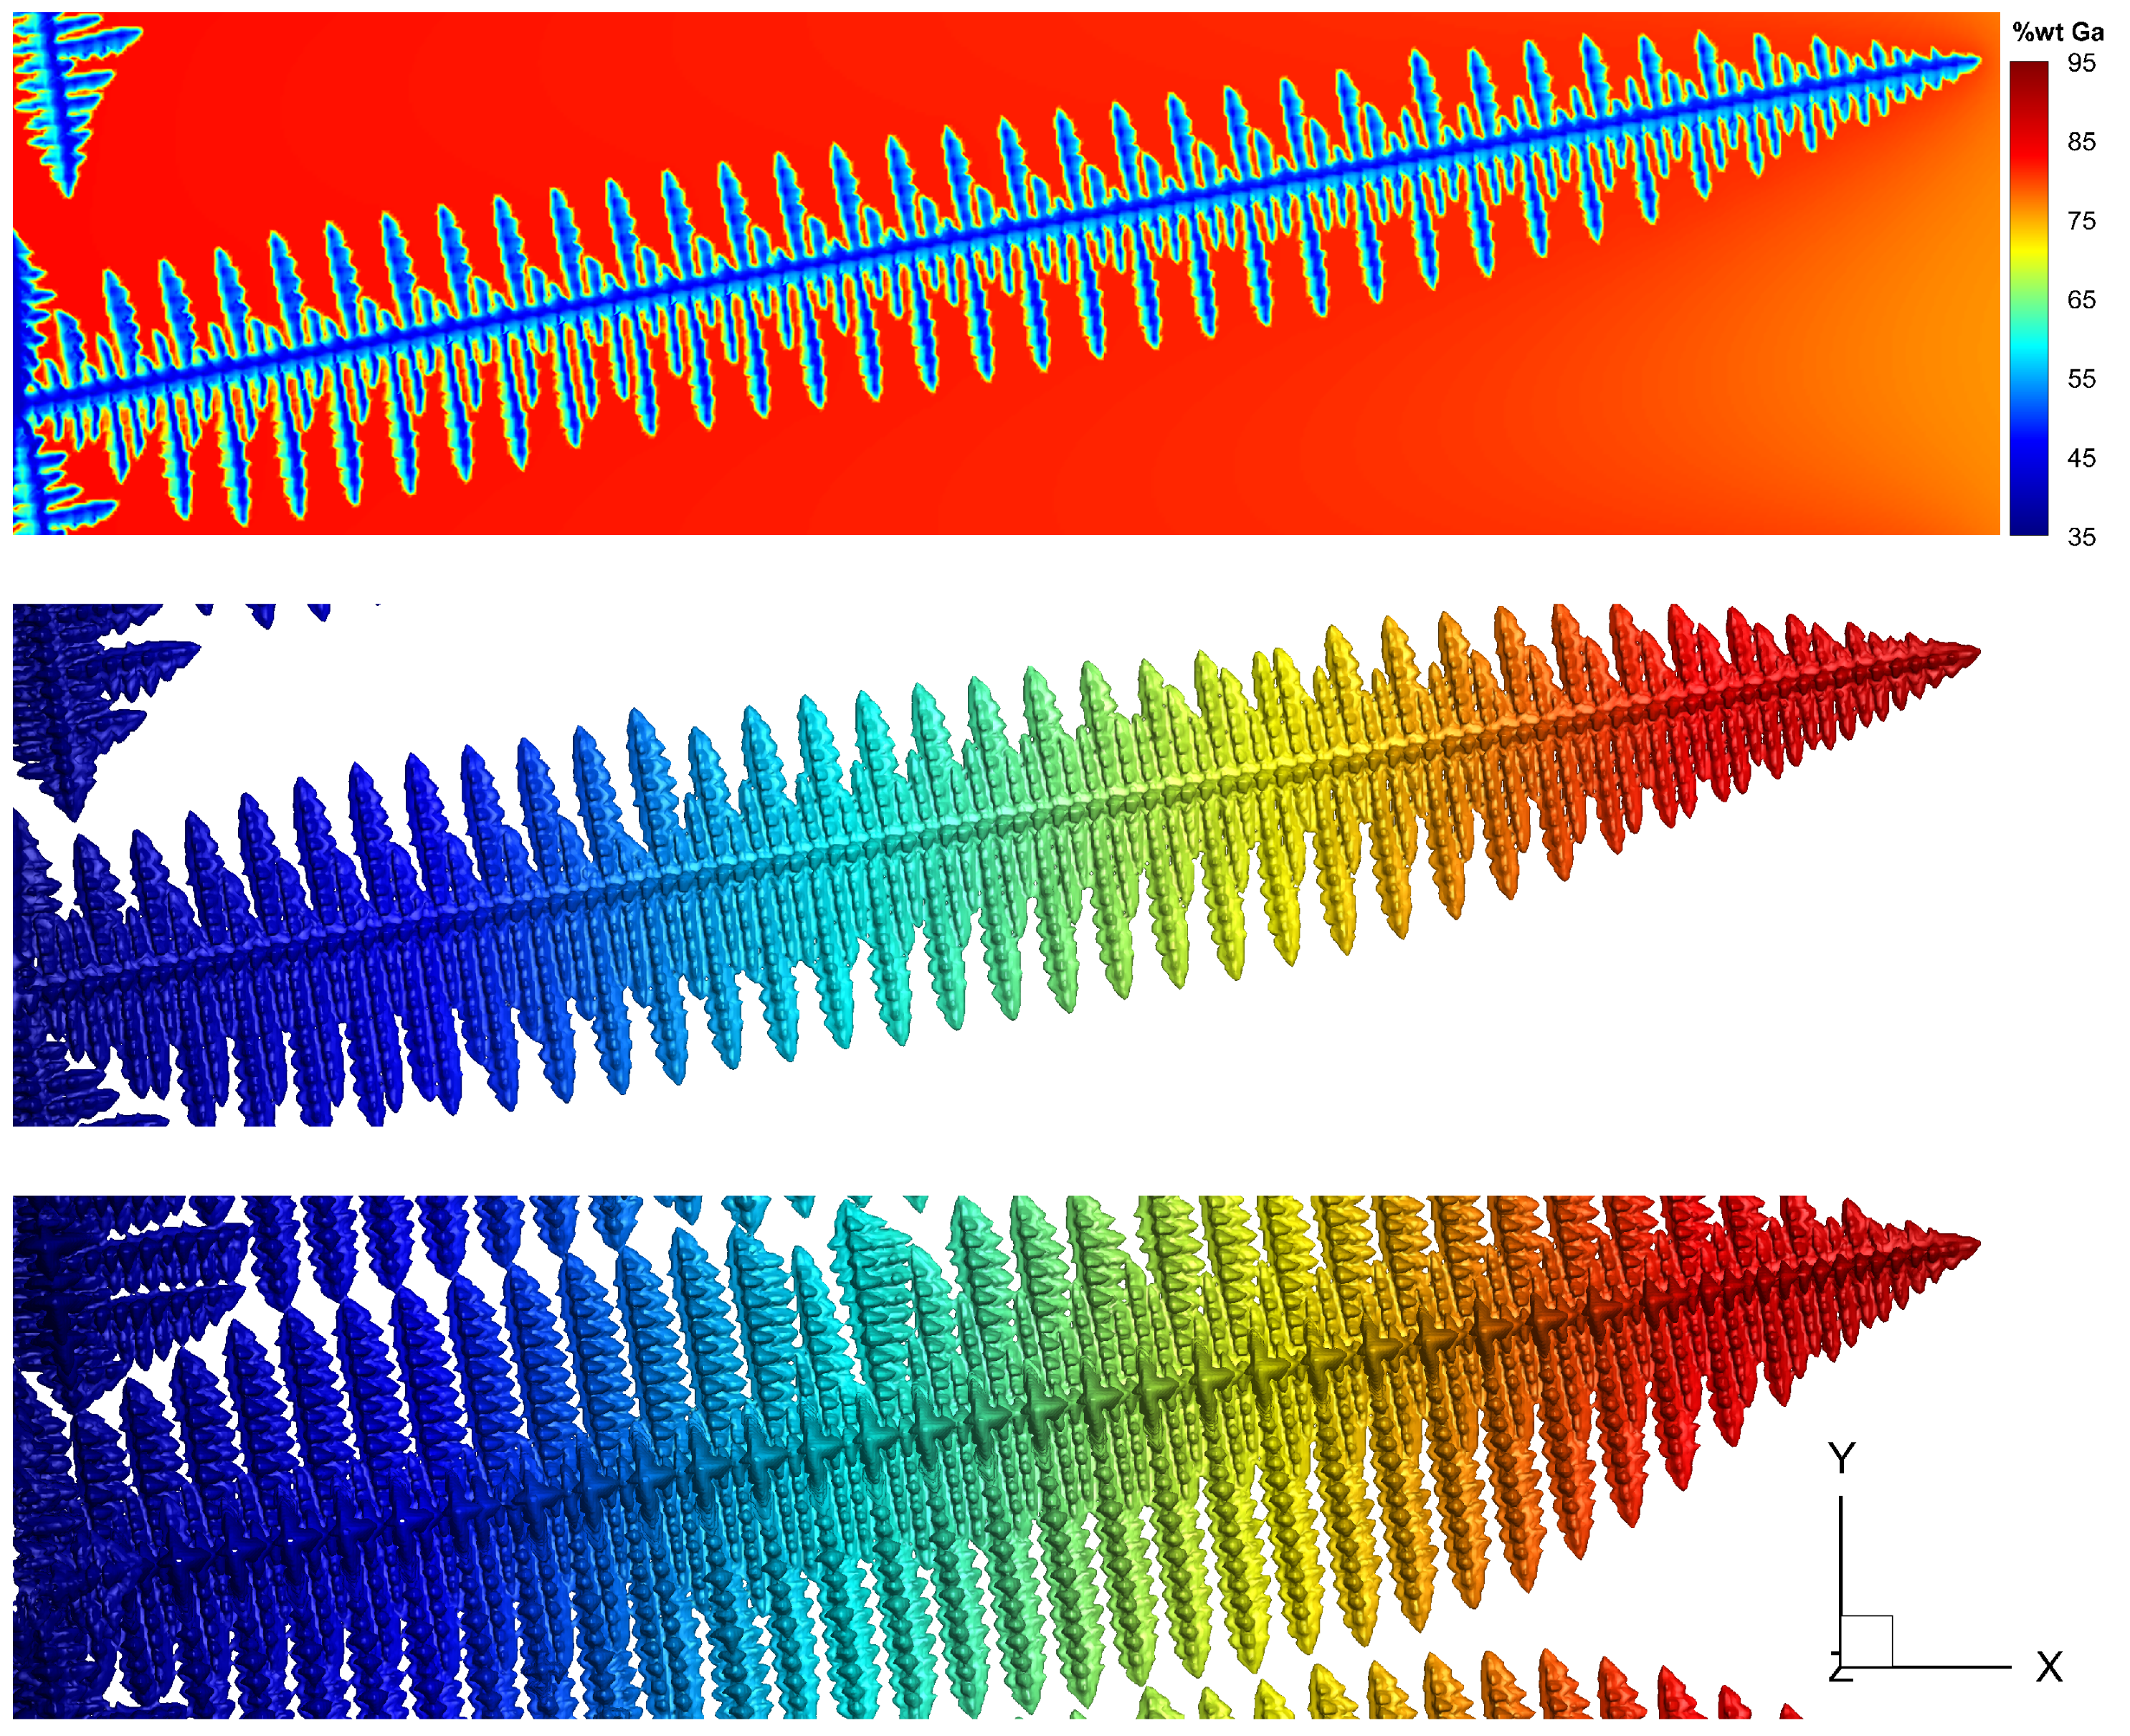
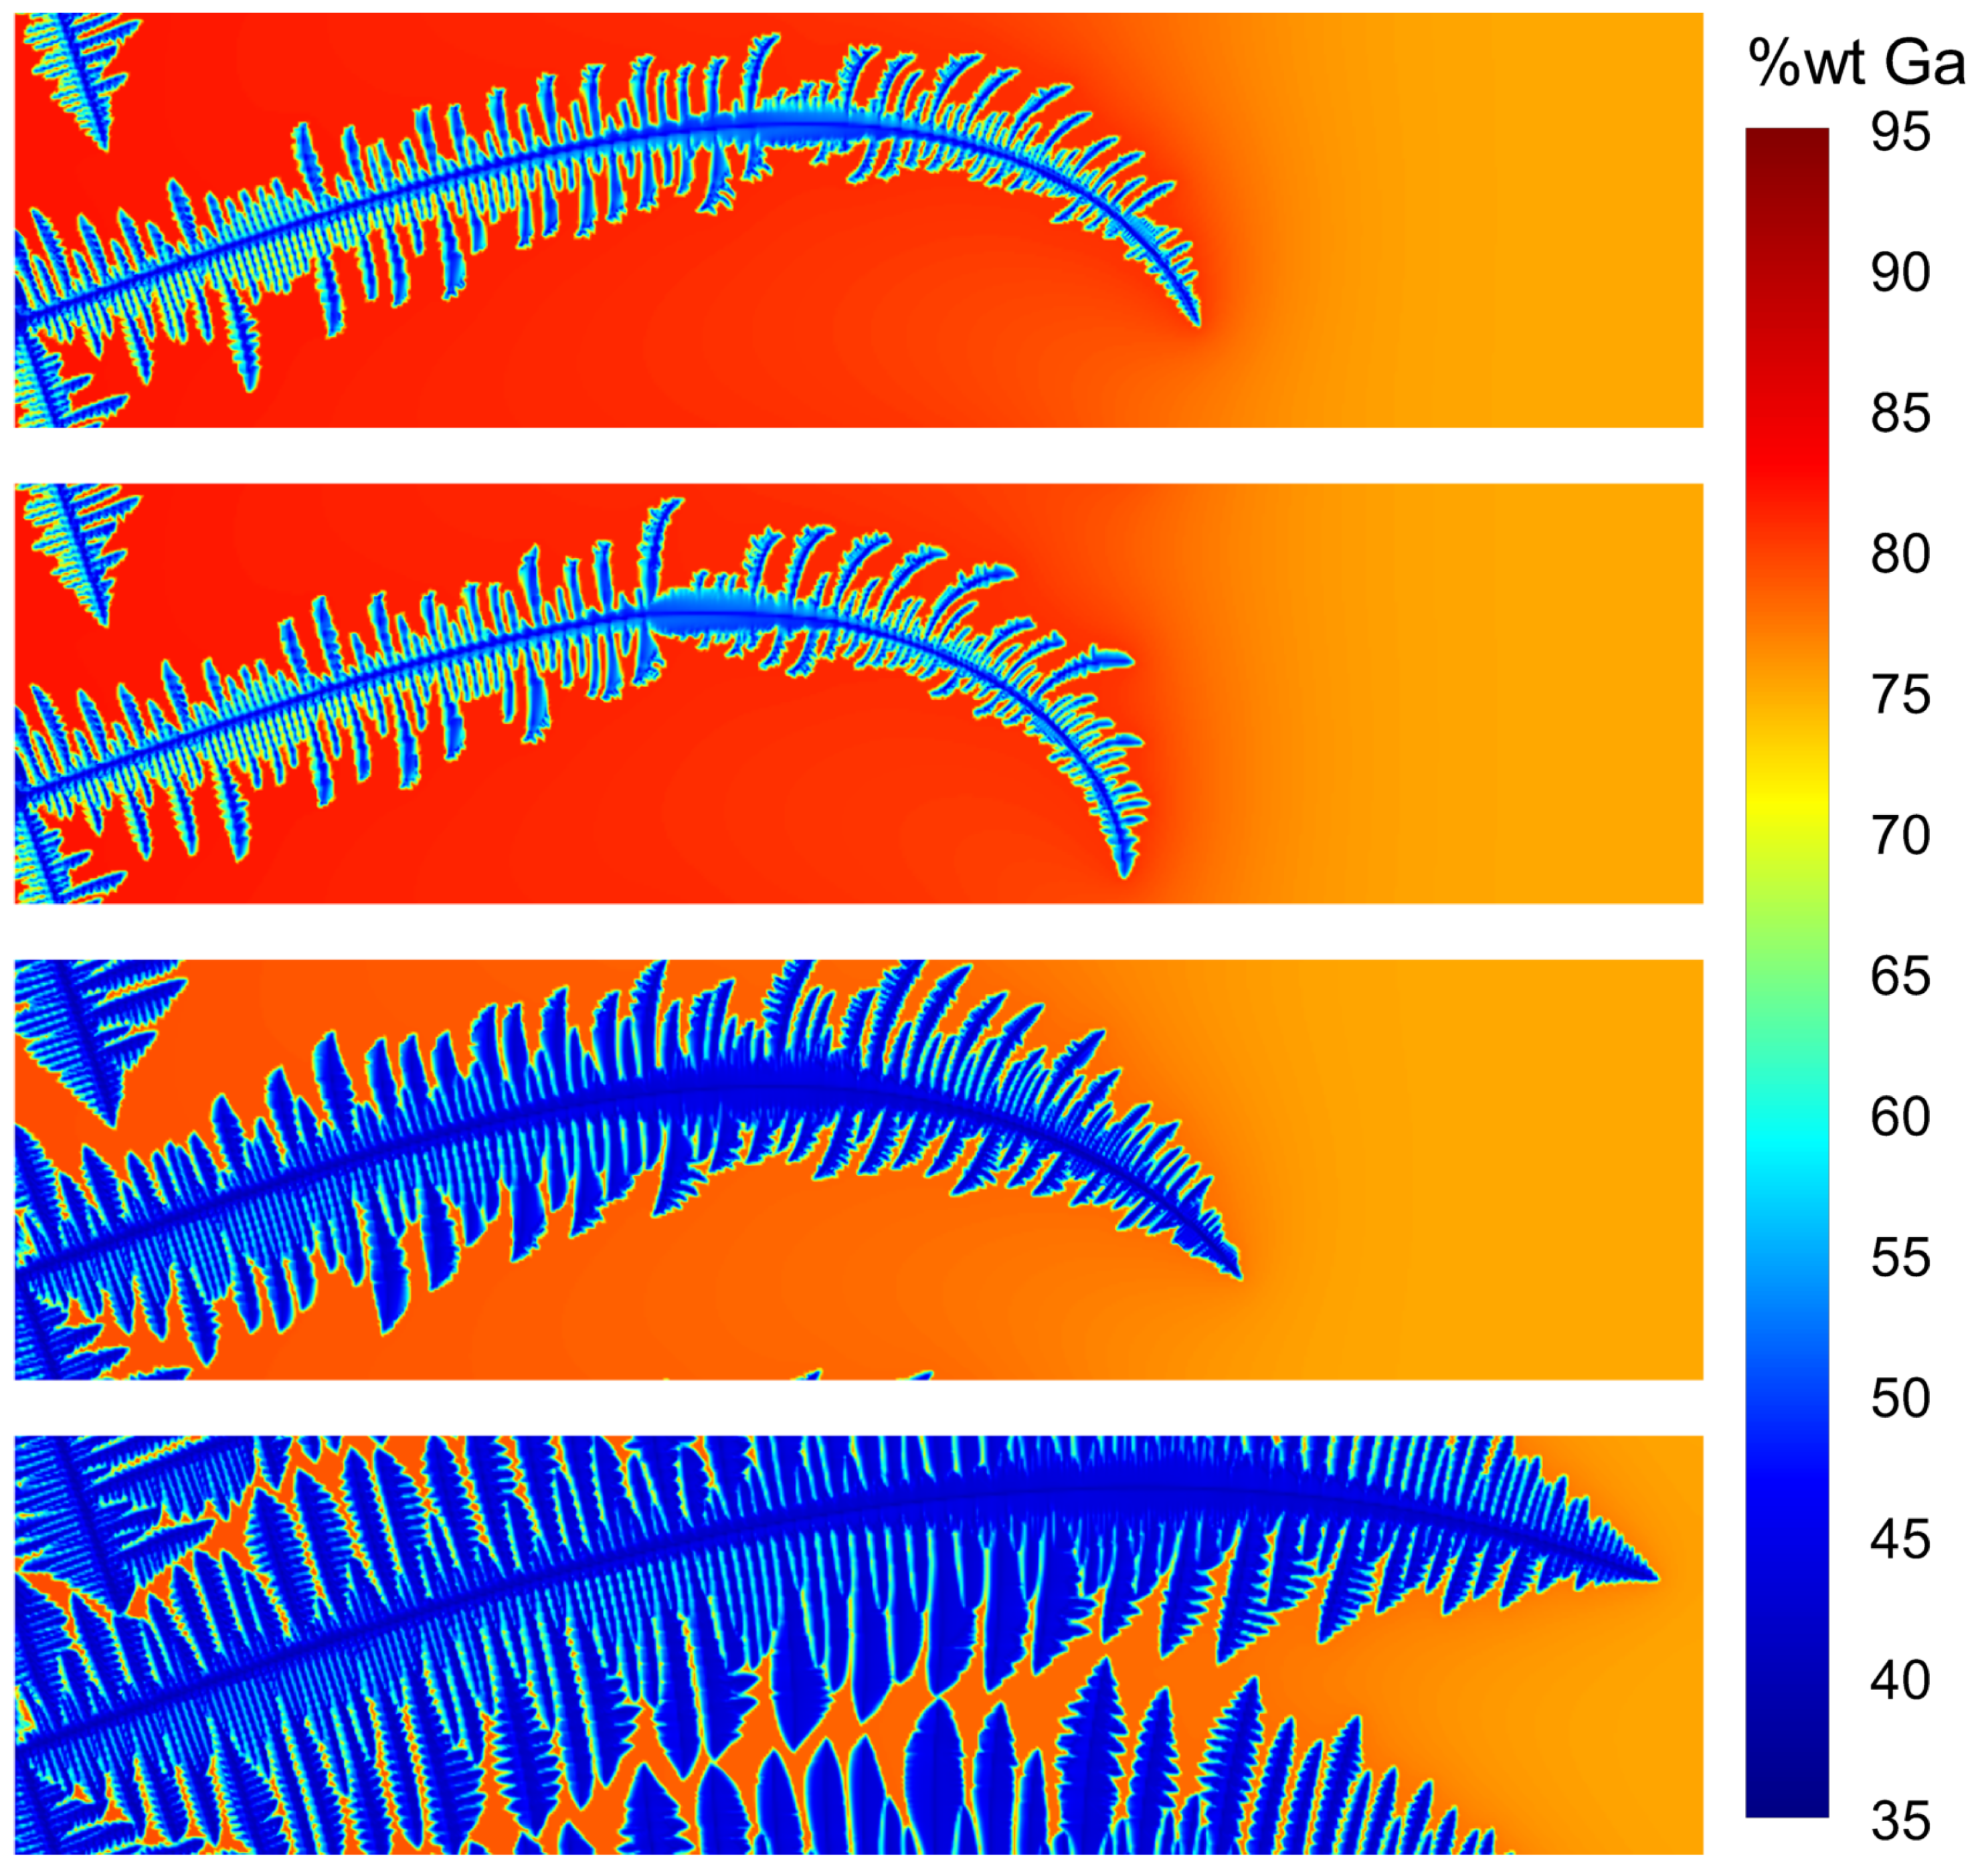
Four cases were examined, using the problem domain dimensions outlined in the Modelling set-up section: 2D plane strain, 2D plane stress, thin sample and 3D, with the corresponding microstructures of dendrites grown to a length of approximately
with a crystallographic orientation of 10° using these modelling assumptions being provided in
Figure 3. From these results it is immediately obvious how the different modelling assumptions alter the solidification behaviour of the dendrite by constraining the solute diffusion, with the 2D dendrite being more needle-like with less developed secondary arms than either of the 3D results where the extra dimension allows solute to escape far more easily. However, the constriction of the thin sample clearly has an impact on solute diffusion despite being modelled in 3D, as while still clearly different, there are qualitative similarities between the thin sample and 2D microstructures such as more similar secondary arm lengths and spacing than can be observed in the 3D dendrite. This problem of constrained solute diffusion is also a factor in the growth time, as it takes approximately twice as long for a dendrite modelled in 2D to reach a comparable length to a 3D dendrite. To account for this in comparisons, 2D dendrites will be grown for twice as long as the 3D dendrite they are compared to.
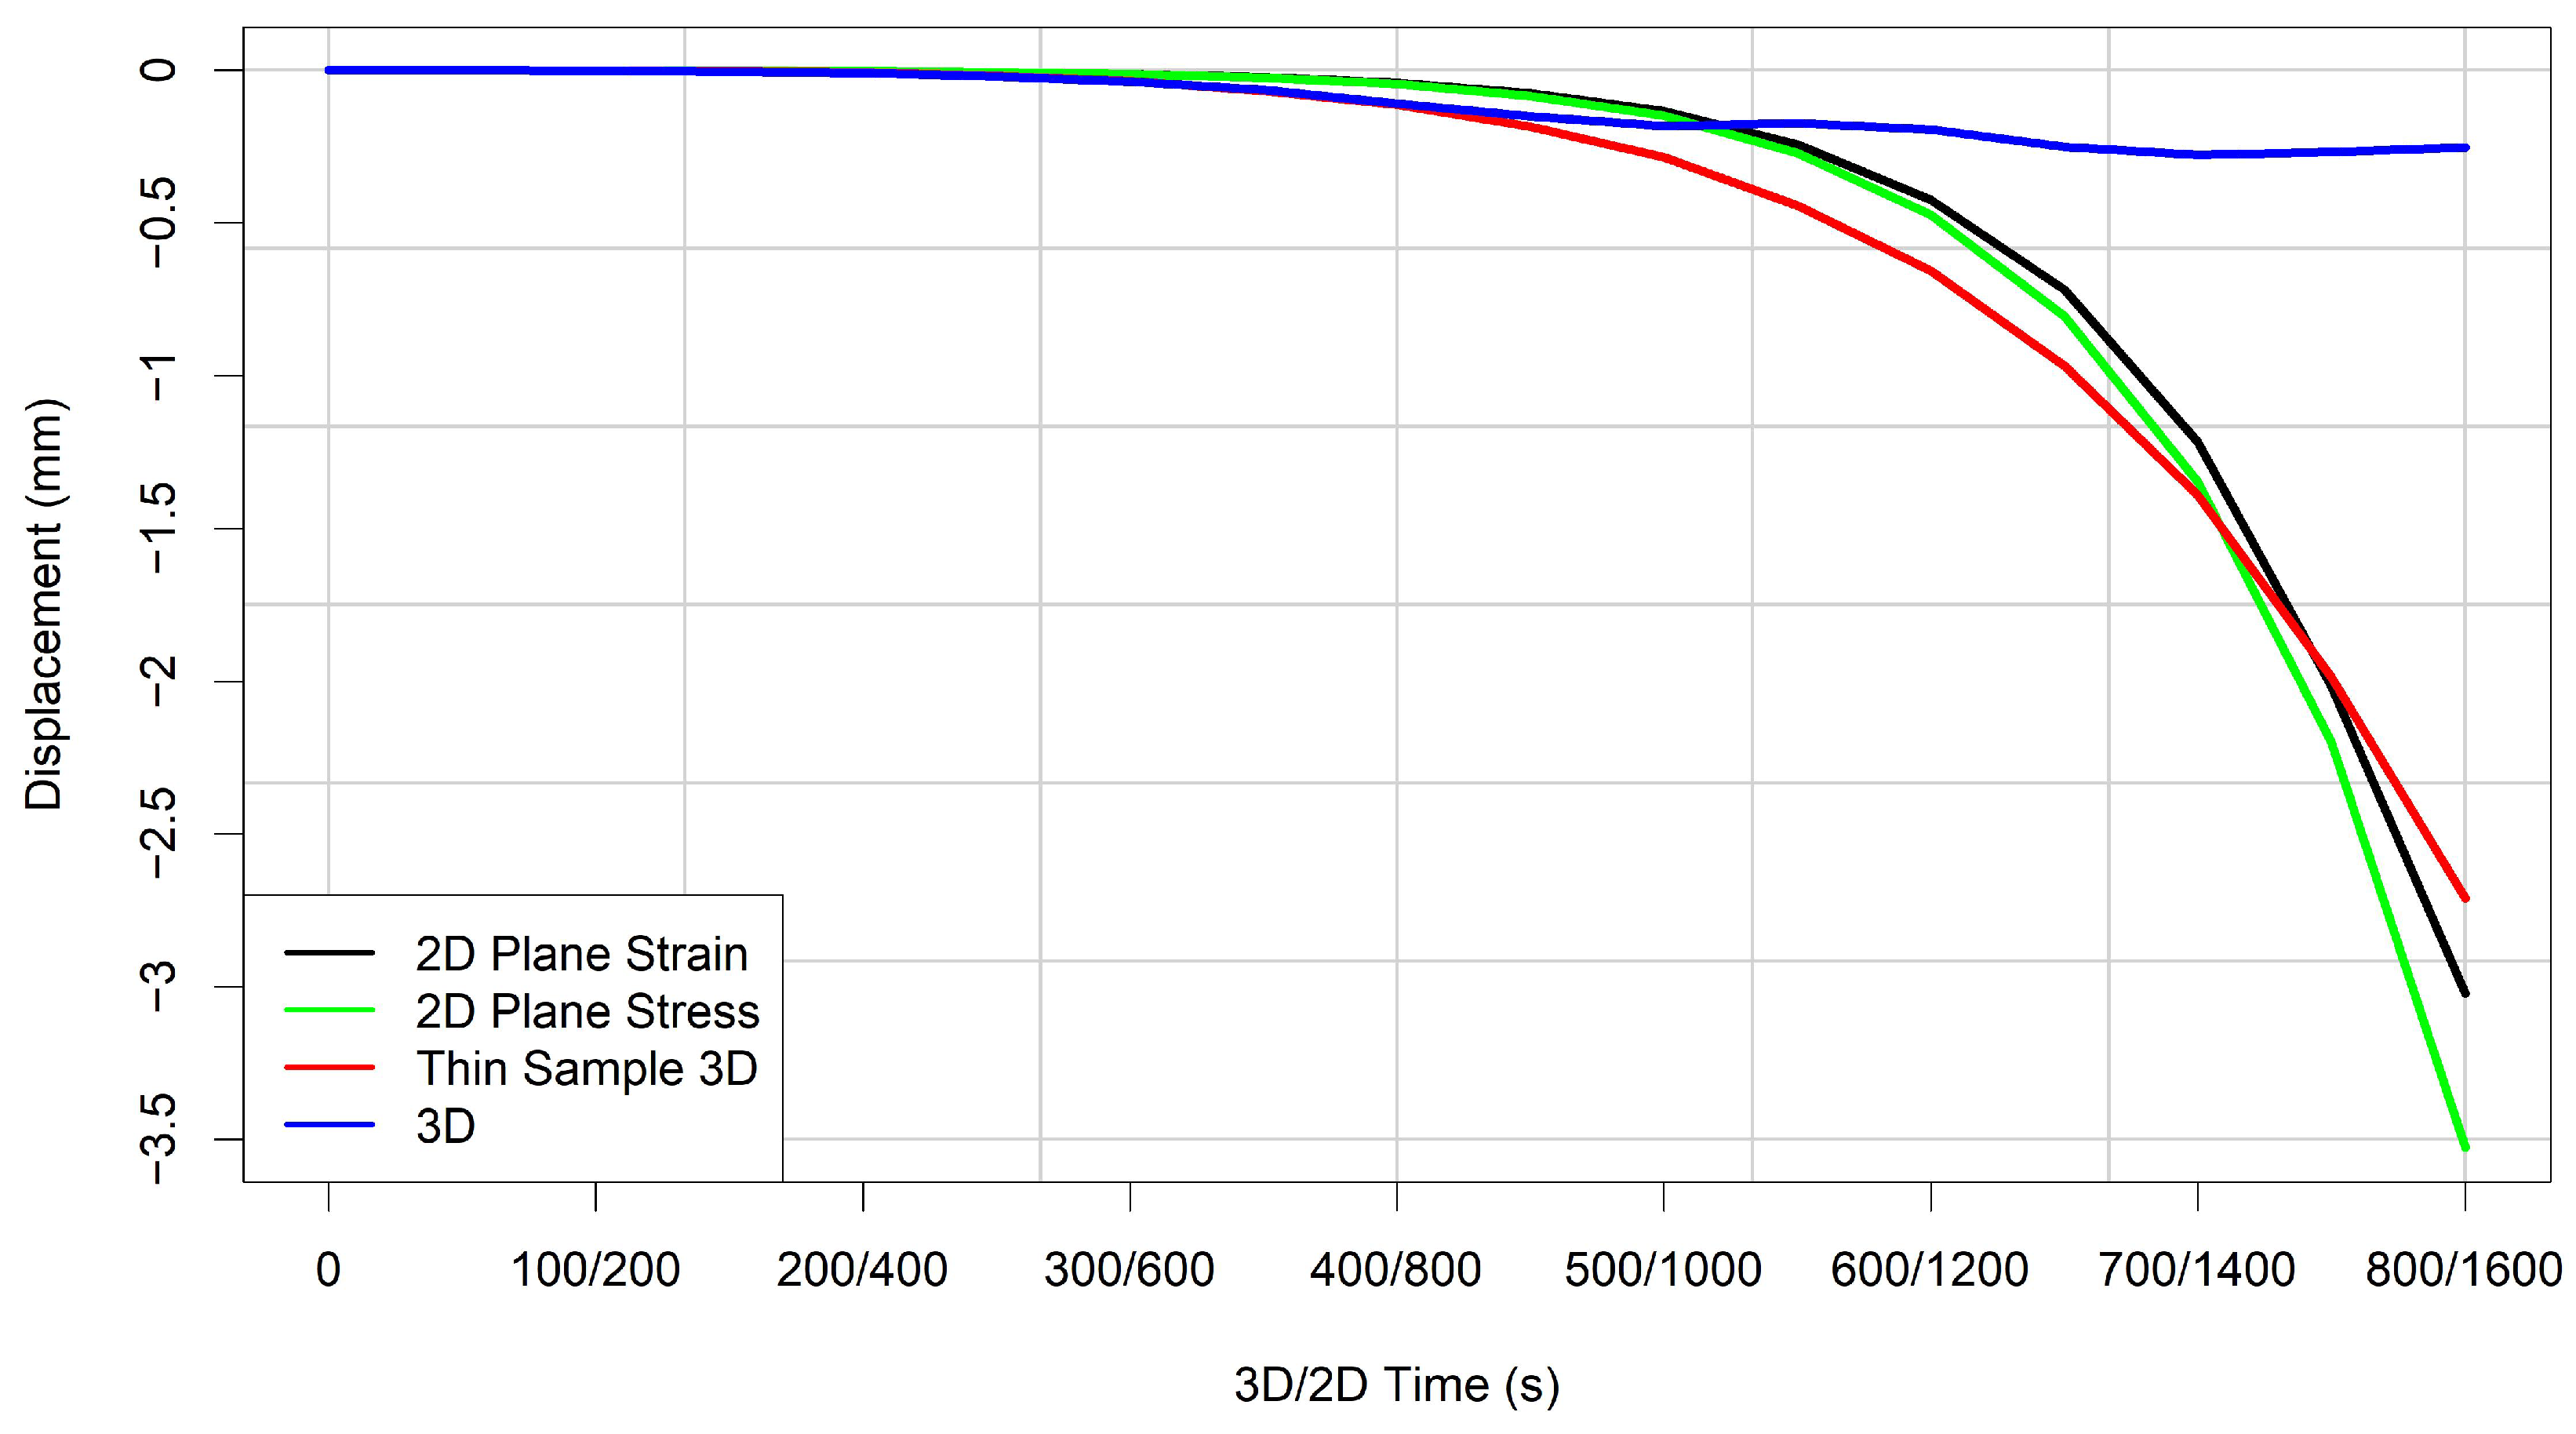
To explore the deformation behaviour of these dendrites throughout solidification, the dendrites were post-processed at fixed time intervals to calculate the displacement value at the tip, which has been plotted for all four cases up to
(3D/2D) in
Figure 4. The transient behaviour here shows that the 3D and thin sample displacements are almost identical until around
, where their behaviour radically diverges as the thin sample displacements continue smoothly increasing according to a power law
, while the 3D solution only increases by a small amount for the rest of the simulation. The reason for this becomes obvious when considering the 3D microstructure in
Figure 3, as the secondary arms have become sufficiently developed that they are interacting with those of other dendrites due to the periodic boundary conditions, constraining deformation along the length of the dendrite other than a relatively small region near the tip which remains free. Consequently, rather than acting like a cantilever beam, only the parts of the dendrite which are ahead of the point of the secondary arm interaction are able to move freely. The length of this region of free movement stays approximately the same irrespective of the total length of the dendrite, meaning that the displacements at the dendrite tip stop changing other than by a slight linear trend caused by the small displacements which occur within the growing constrained region of the dendrite. In comparison, the secondary arms of the thin sample dendrite do not interact with other dendrites and have significant gaps in the secondary arm spacing that makes the dendrite more susceptible to bending than a continuous beam structure of the same length such as those examined in the validation.
The same morphological considerations apply to the 2D dendrites, with even less developed secondary arms and larger arm spacing than the thin sample case making the 2D dendrite even more susceptible to bending. The deformations over time for the 2D solutions are also significantly different to those observed in either of the 3D simulations, likely due to the different speed and morphological evolution behaviour experienced in 2D solidification, where early in the simulation the tip displacement is significantly smaller than that observed in 3D, but after around
the changes in tip deformation move into a mode which increases according to a power law of
. This leads to both 2D assumptions overtaking even the thin sample case by the end of the simulations, despite the fact that the 2D assumptions should cause the displacements of otherwise identical structures to be underestimated as indicated by the beam validation in
Figure 2.
While the beam validation demonstrates that modelling assumptions can alter the observed displacements by up to
, this seems relatively minor when compared to the structural mechanical behaviour observed over time in solidified dendrites as shown in
Figure 4. Clearly the interaction of structural mechanics with solidification to alter dendrite morphology and the different growth speeds can have a far more significant impact to the displacements obtained than can be accounted for by the comparatively minor systematic error caused by 2D structural mechanical modelling assumptions.
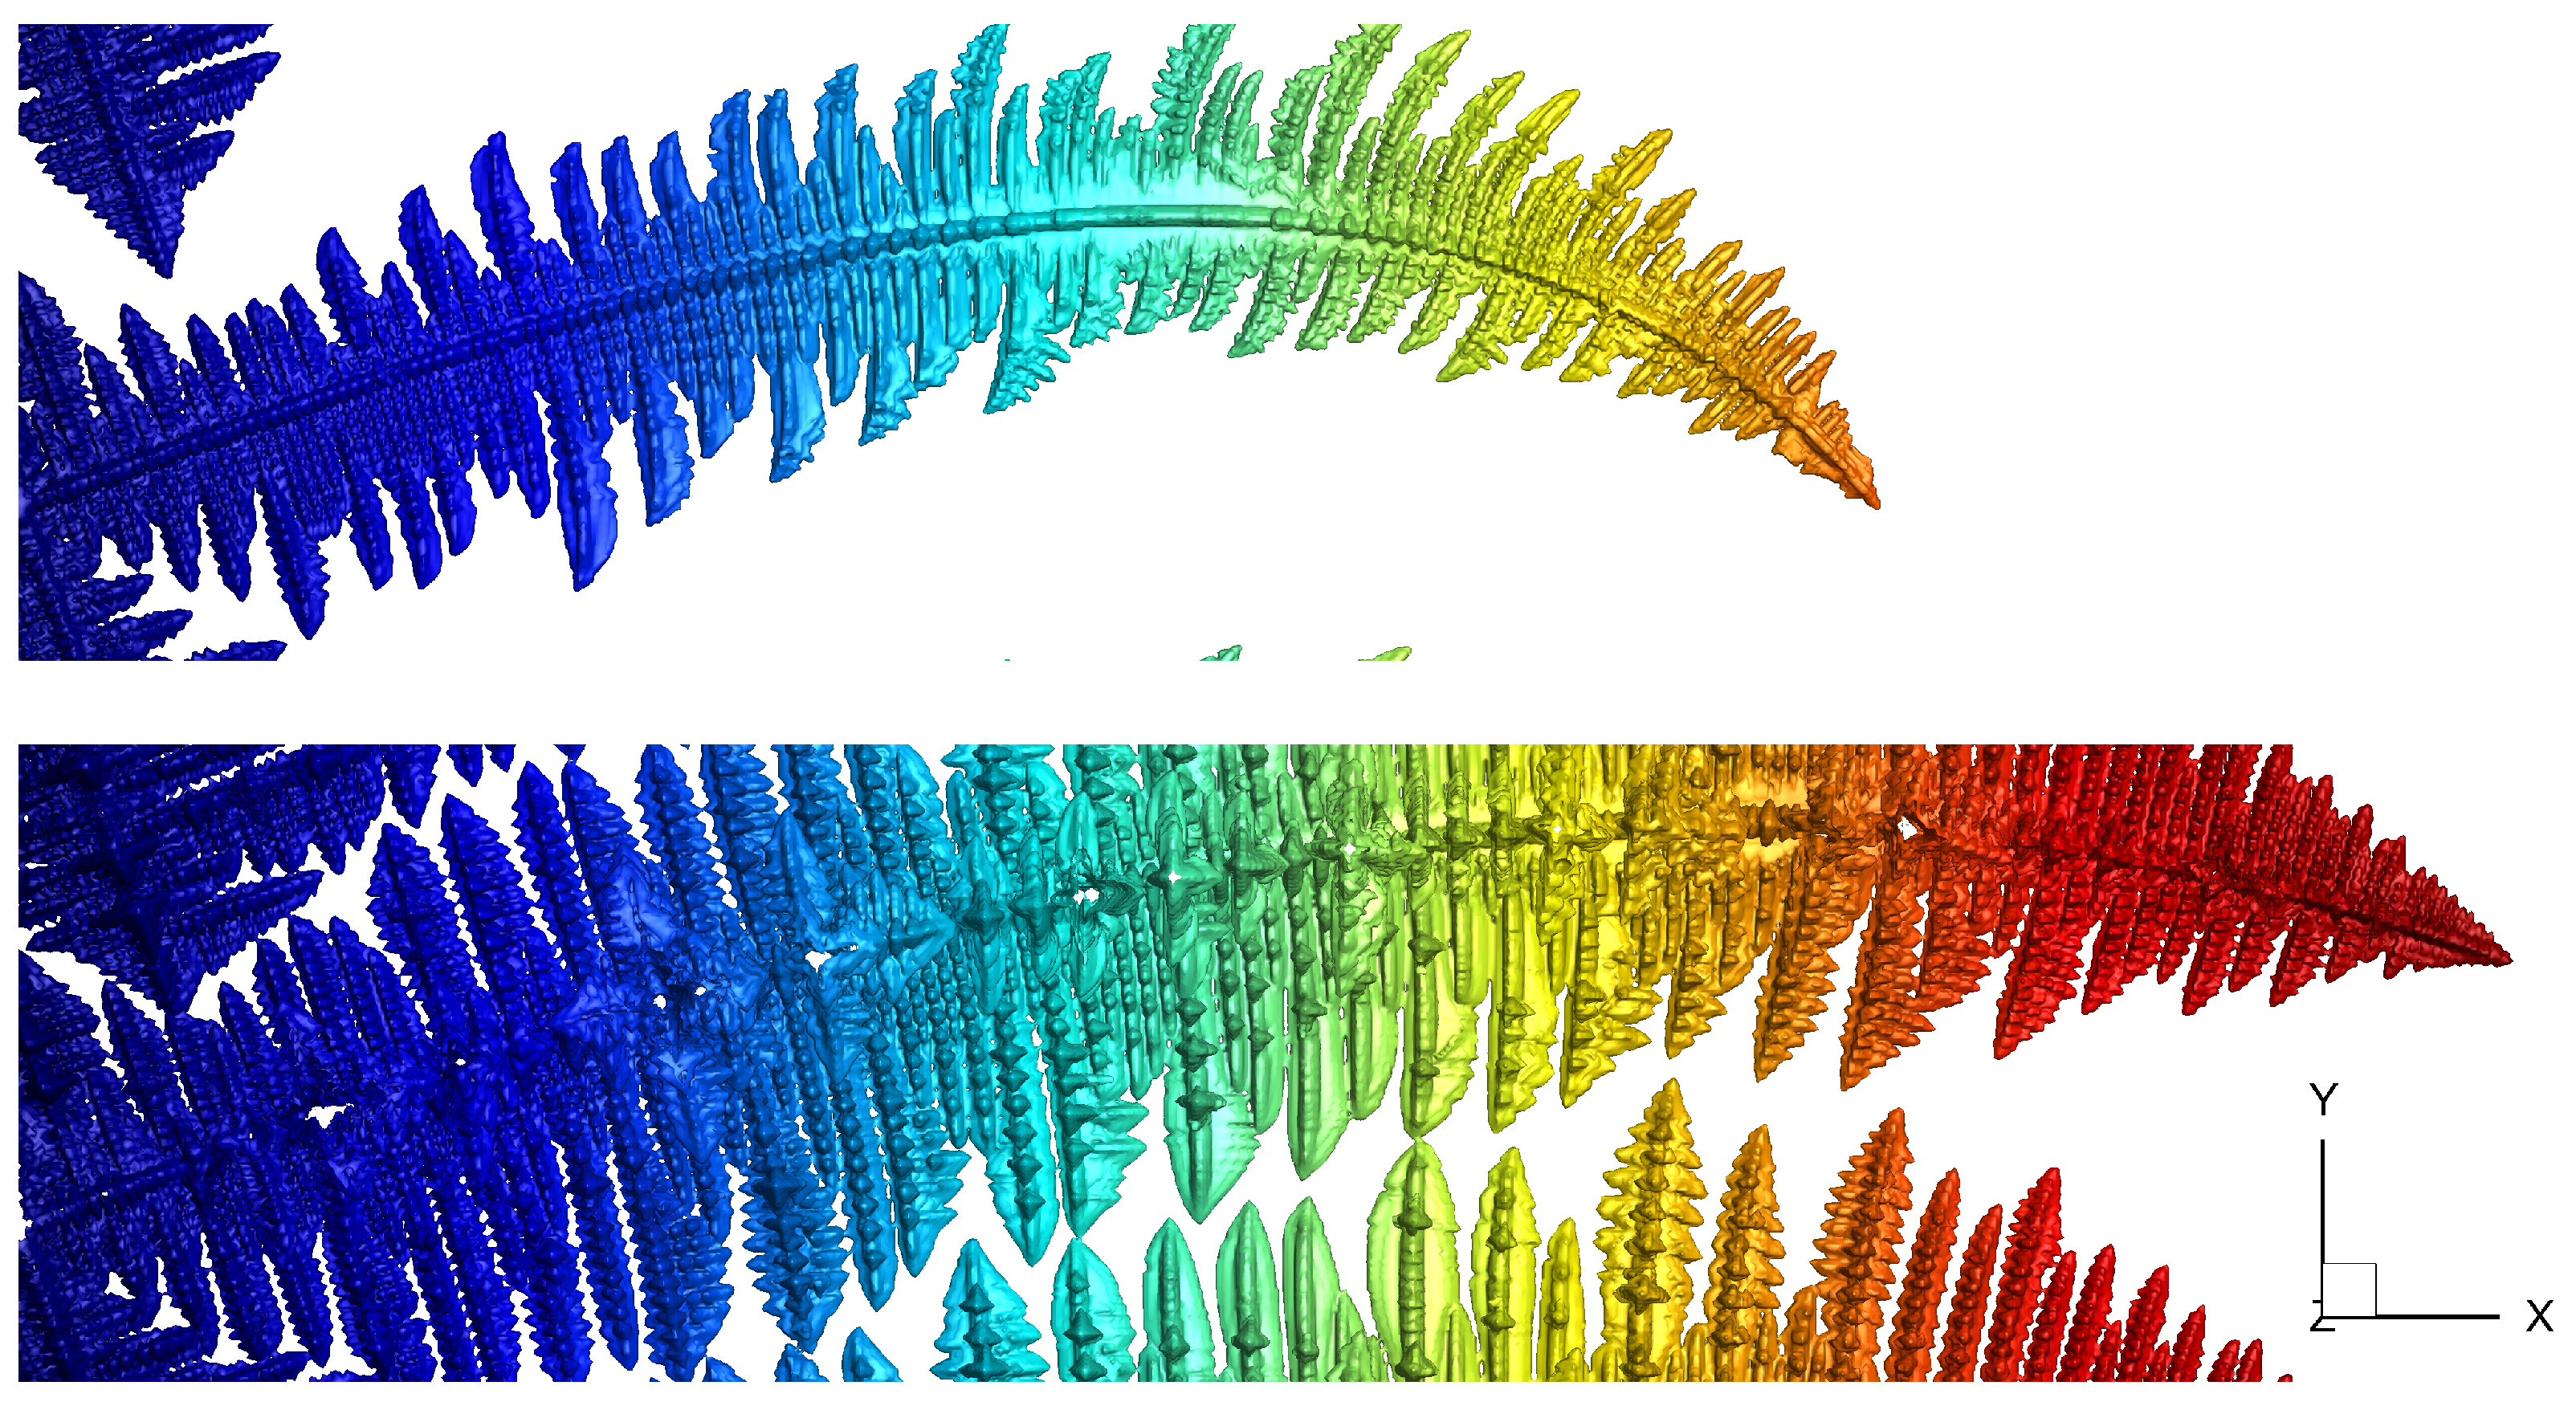
The final case examines coupled dendrite growth and structural mechanics, using the methodology previously described where the crystallographic orientation of a dendrite is updated using the displacements obtained throughout the simulation. The dendrites in this simulation were grown for
(3D/2D) with results showing the concentration profile for each case provided in
Figure 5 and the 3D dendrite morphologies more clearly shown in
Figure 6. These solute concentration profiles highlight that 2D solidification has less efficient diffusion, with both 2D solutions showing a significantly higher solute concentration than either 3D case. Much as in the uncoupled cases shown in
Figure 3 this leads to approximately halved growth velocities in 2D and significant morphological changes.
All of the dendrites were seeded with an initial orientation of 20°, which is continually changed by the displacements throughout the simulation. Comparing the two 2D simulations, the final orientation observed at the tip of the dendrite grown with plane strain assumptions is °. However the larger displacements obtained due to the plane stress assumptions seem to have compounded during the course of the simulation to cause a significantly larger final orientation of ° at the tip. The final tip orientation observed for the thin sample case is °, with the reduced deformation being down to the more developed secondary arms constraining deformation more than either 2D examples, though there are some qualitative similarities in the final microstructures of the thin sample and 2D plane strain cases. The 3D case has a comparatively much smaller final tip orientation of °, which is again attributable to having significantly more developed secondary arms than even the thin sample case. Much as in the uncoupled 3D case, these are not only much coarser but also interact with the secondary arms of other dendrites due to the periodic boundaries, constraining the dendrite along most of the primary arm and only leaving a relatively small region near the tip free to move.
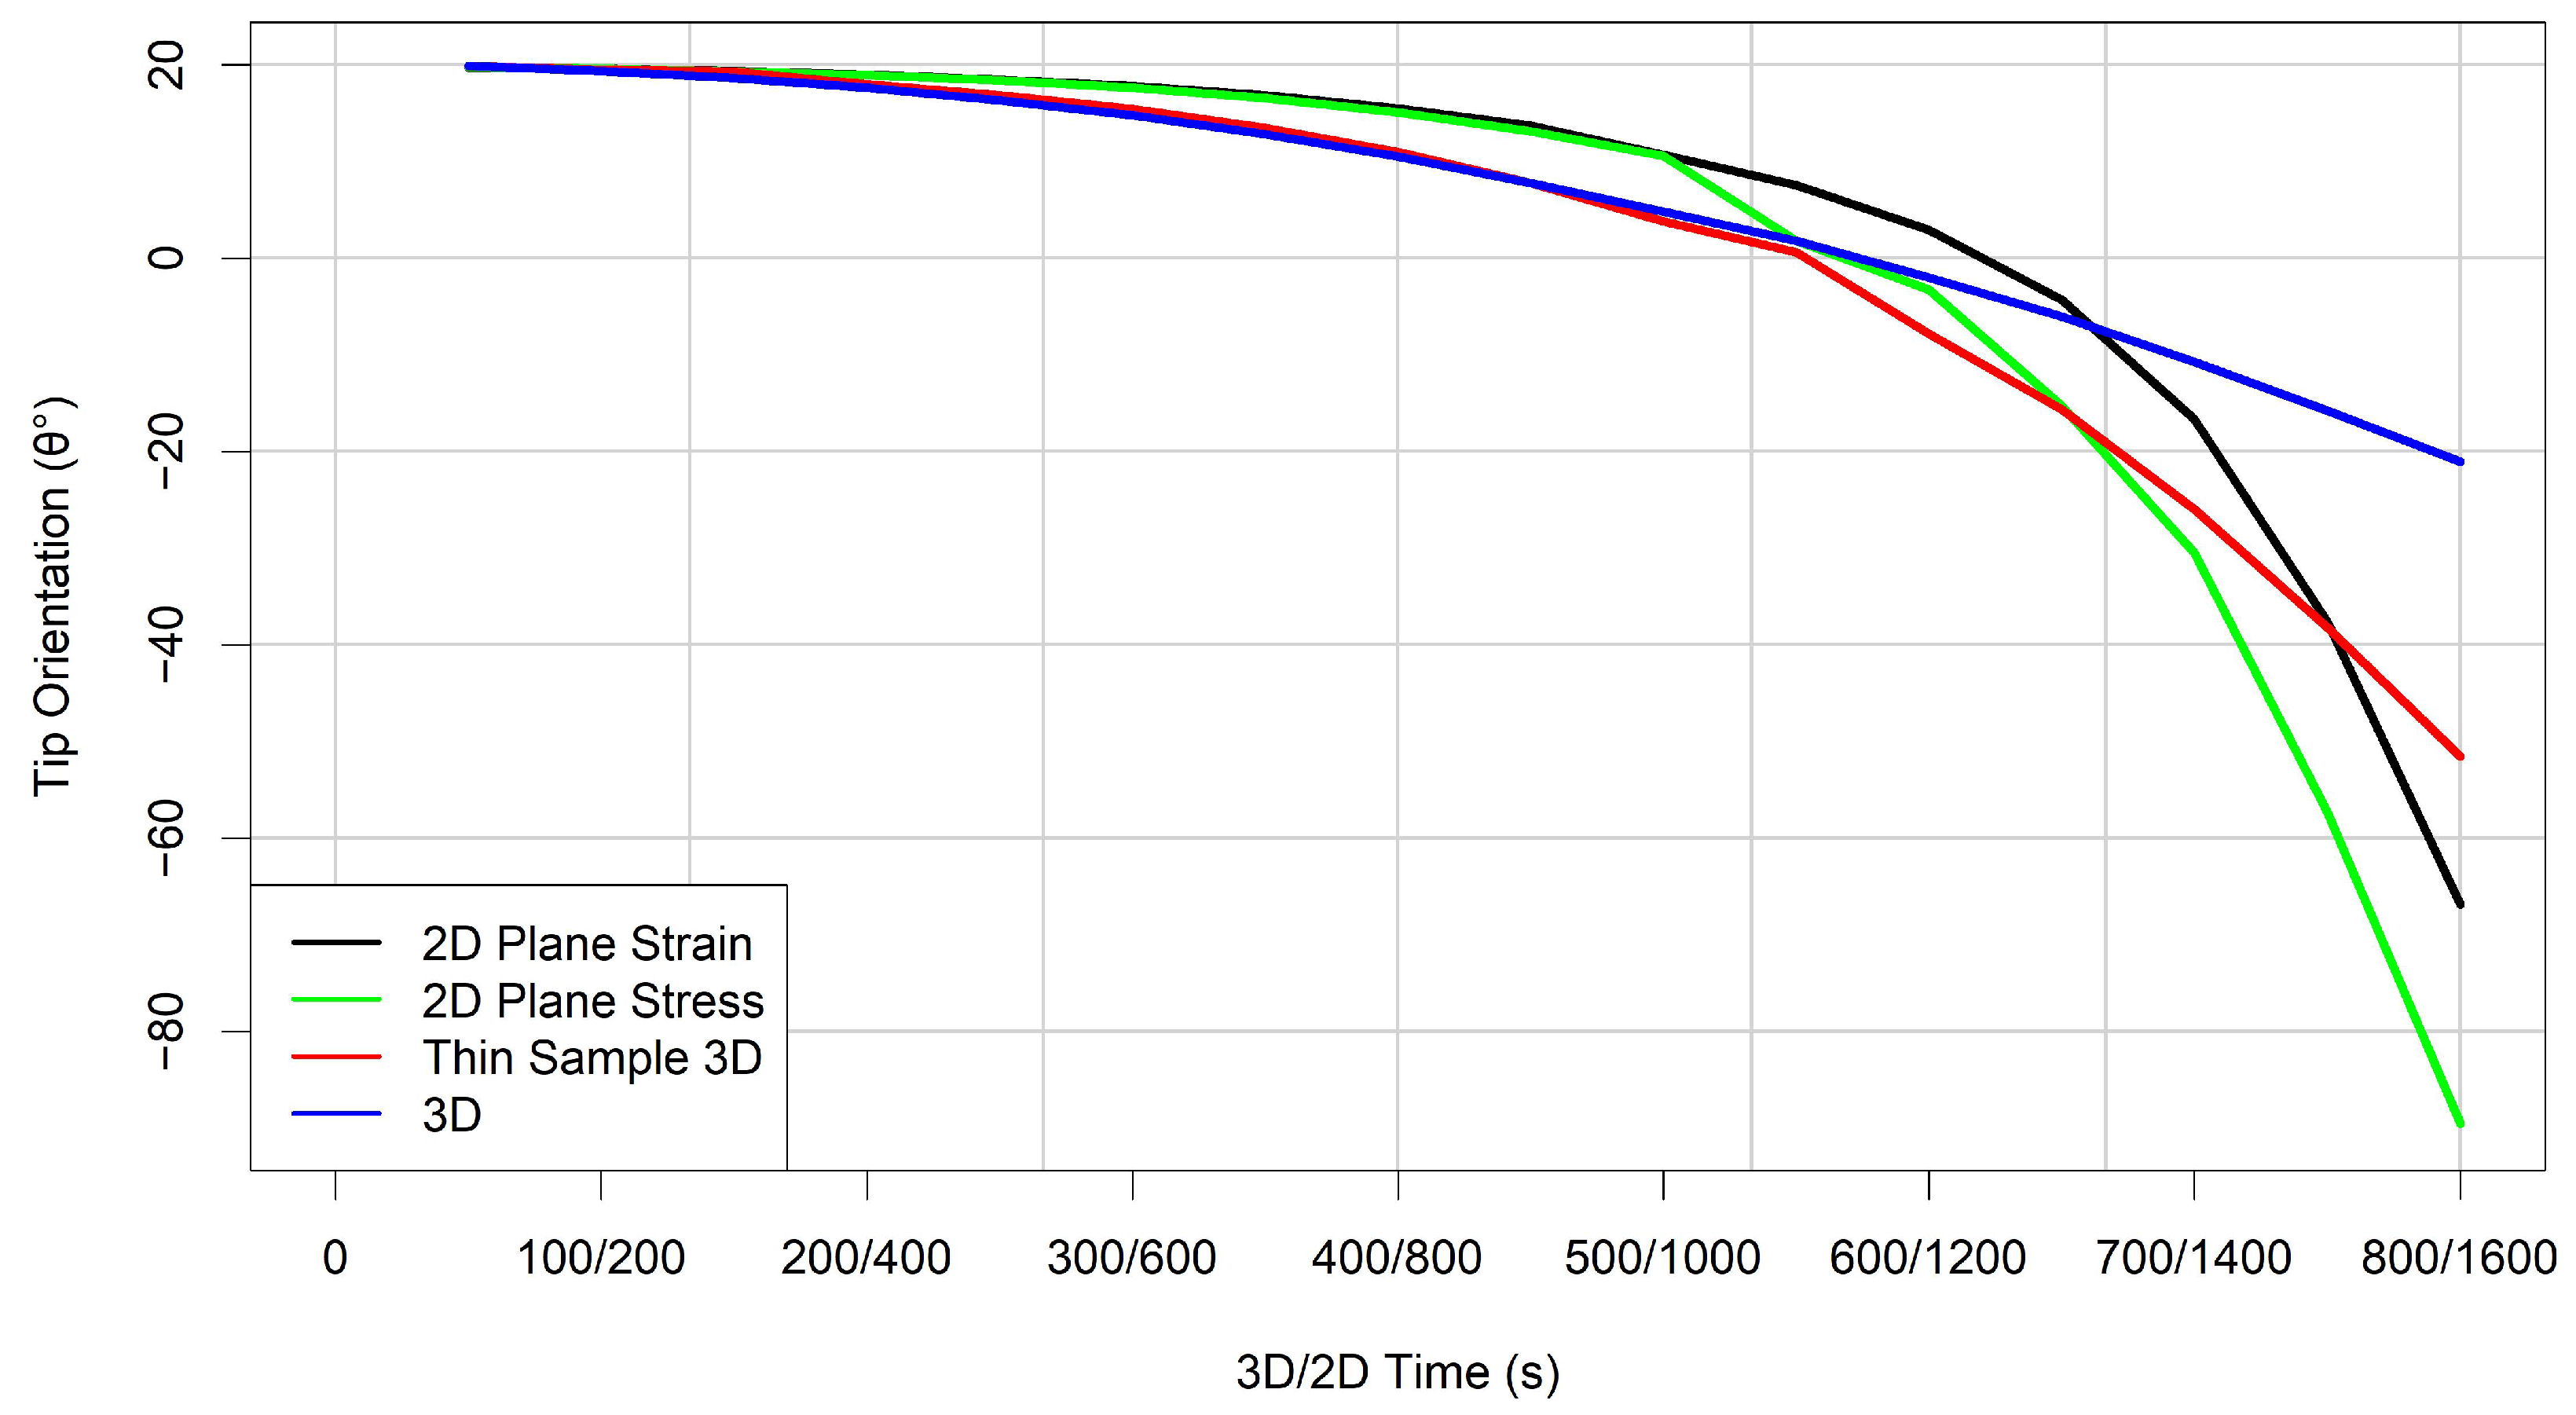
A better understanding of the transient behaviour of these coupled simulations can be gained by considering how the orientation at the tip of these dendrites changes over time as they grow under a constant force. This can be seen in
Figure 7 and as the change in orientation over time can be thought of as a derivative of the displacements it is not surprising that there are some similar relationships to those seen in the post-processed cases in
Figure 4. However due to the morphology of the dendrites changing over time the tip orientation in these coupled cases has further complications. For the 3D cases there is again a very good matching of tip orientation until around
with the rate of orientation change for both cases following a power law of
. At this point the thin sample case shifts into a different mode where the orientation change becomes
. However the orientation observed in the 3D case begins to change at an approximately linear rate as around this time secondary arm interaction begins. Much as in the post processed cases, this means that only a relatively small region near the tip ahead of the arm interaction is free to move and hence the rate of orientation change becomes approximately constant rather than increasing with the length as would be expected of a cantilever beam.
The 2D cases follow the same general trend as that observed in the post processed cases in
Figure 4, with the the rate of orientation change for both 2D assumptions being significantly less than the 3D cases for the first half of the simulation, then rapidly increasing such that by the end of the simulation both of the 2D cases have changed orientation significantly more than either 3D case, though plane strain is again consistently smaller than plane stress for the duration of the simulation. The orientation for the 2D cases increases approximately exponentially with time, highlighting that while the thin sample and plane strain cases are qualitatively similar in microstructural morphology and tip orientation at the end of this simulation, that appears to be largely coincidental and significant differences would soon become apparent if the simulation had continued due to the different modes of orientation change being followed by each case. Regardless, while 2D dendrites are usually a sub-optimal approximation for any types of 3D dendrite, this does indicate that if 2D modelling must be used the best qualitative comparisons can be made between thin sample experiments and 2D dendrites modelled using plane strain assumptions.
These results all combine to underline the complex non-linear nature of coupled solidification with structural mechanics, as while a single columnar dendrite may act analogously to a cantilever beam when considered in isolation as a post processed structure, the interaction with other dendrites and the impact of a structure becoming misorientated while it solidifies can lead to far more complex behaviour than can be explained by the cantilever beam analogy. This becomes even more significant when considering the impact of 2D vs. 3D simulations, as the impact of these modelling assumptions on the solidification process causes morphological differences for the dendrites that means they behave in an opposite manner than would be expected from the beam validation. The validation using beams analogous in cross section to the dendrites show that 2D assumptions cause an under prediction of displacements compared to reality, however this under prediction is far less significant than the morphological changes which make 2D dendrites far more susceptible to bending, leading 2D dendrites to displace and misorient more than the 3D dendrites in both the post processing and fully coupled cases. Furthermore, any case modelled in 2D ignores the intrinsic 3D behaviour such as the ability to twist, bend out of plane or pass through the sample due to misalignment which is known to occur during the solidification process in reality. All of these factors combine to make any conclusions drawn from 2D modelling about the structural mechanical behaviour of growing dendrites of limited use for all but the most general of qualitative observations.
6. Conclusions
When numerically modelling microstructure solidification, 2D simulations are often run due to the significantly lower computation cost required to obtain solutions at a relevant scale. However, the 2D assumptions impact diffusion behaviour to alter the dendrite morphology such that generally only qualitative matches can be obtained. The impact of this is only exacerbated when modelling other processes which interact with solidification, each of which include additional assumptions to function in 2D that cause the results to be even further abstracted from the 3D reality.
Modelling microstructure solidification with structural mechanics is a complex non-linear process that, when considered at all, has largely been explored in 2D simulations. A validation case using cantilever beams with a cross section analogous to the dendrites being modelled indicate that 2D modelling assumptions cause the displacements to be underpredicted. However testing the structural mechanical behaviour of simulated dendrites being both post processed and fully coupled to solidification has indicated that the real picture is more complex, with the changes in dendrite morphology caused by 2D solidification modelling assumptions making 2D dendrites far more susceptible to bending than their 3D counterparts. This remains the case even in thin sample experiments which are generally considered to be essentially 2D in behaviour due to the small width limiting many 3D behaviours. Despite 2D and thin sample microstructures being somewhat similar in a qualitative sense, the diffusion behaviour is still significantly different, leading to slower growing and much less developed dendrites in 2D that are more prone to deformation than the reality.
Consequently, while 2D modelling may sometimes be sufficient to qualitatively explore the fundamental behaviour of coupled structural mechanics and microstructure solidification, any quantitative match with experiments will be impossible without modelling the system in 3D.


