Article

GPU-Based Cellular Automata Model for Multi-Orient Dendrite Growth and the Application on Binary Alloy

School of Information Science and Engineering, Northeastern University, Shenyang 110819, China
*
Author to whom correspondence should be addressed.
Crystals 2023, 13(1), 105; https://doi.org/10.3390/cryst13010105
Submission received: 27 November 2022 / Revised: 25 December 2022 / Accepted: 31 December 2022 / Published: 6 January 2023
(This article belongs to the Special Issue Intermetallic Compound (Volume II))

Abstract

:
To simulate dendrite growth with different orientations more efficiently, a high-performance cellular automata (CA) model based on heterogenous central processing unit (CPU)+ graphics processing unit (GPU) architecture has been proposed in this paper. Firstly, the decentered square algorithm (DCSA) is used to simulate the morphology of dendrite with different orientations. Secondly, parallel algorithms are proposed to take full advantage of many cores by maximizing computational parallelism. Thirdly, in order to further improve the calculation efficiency, the task scheduling scheme using multi-stream is designed to solve the waiting problem among independent tasks, improving task parallelism. Then, the present model was validated by comparing its steady dendrite tip velocity with the Lipton–Glicksman–Kurz (LGK) analytical model, which shows great agreement. Finally, it is applied to simulate the dendrite growth of the binary alloy, which proves that the present model can not only simulate the clear dendrite morphology with different orientations and secondary arms, but also show a good agreement with the in situ experiment. In addition, compared with the traditional CPU model, the speedup of this model is up to 158×, which provides a great acceleration.

1. Introduction

Dendrite is an important component of solidification structure, whose morphological characteristics directly affect the performance of an alloy. Therefore, studying the growth of dendrite is helpful for researchers to optimize the process parameters and improve the performance of alloys. Experimental methods for obtaining the microstructure during solidification have been proposed, such as the electronic probe [1], synchrotron X-ray [2,3], etc. that have been developed, but cannot be applied to product at a large scale due to the expensive cost and harsh environment. Moreover, these methods are unable to show the dynamic evolution process of dendrite growth.
Over the past few decades, a considerable number of numerical models have grown up around the theme of simulating the evolution process of dendrite morphology during solidification, such as level set [4], monte carlo (MC) [5], cellular automata (CA) [6,7,8], phase field (PF) [9], etc. Among them, the phase field model (PF) and CA model are the most widely used. Due to complex physical equations and massive calculations, the PF model is only applied to small-scale simulations. Whereas the CA model can perform large-scale simulations and reveal the evolution of micro-mesoscopic dendrites, such as the transformation of columnar crystals into equiaxed crystals (CET) [10], the behavior of dendrite deflection in fluids [6,7,8], and the formation of silicon facet dendrite [11]. Influenced by grid layout and capture rules, the traditional CA model can only simulate dendrites that grow along the x axis or 45° with the x axis. However, during the actual solidification process of the alloy, dendrites grow with different preferred orientations, which is caused by the solute profile and can lead to macro-segregation in the cast product [12]. Therefore, it is very important for the model to be able to simulate the dendrite with different orientations. Researchers have proposed various methods to achieve multi-orient dendrite simulation, such as defining block cells [13], establishing random ZigZag neighbor cell capture rules [14], etc. These methods can only simulate a dendrite with the same orientation at the same time due to complex algorithms. Hence, Rappaz and Gandin developed the decentered square algorithm (DCSA) [15], which can simulate dendrites with different orientations simultaneously, and it has been widely used to simulate the growth of columnar and equiaxed dendrites [16,17,18,19]. However, these models suffered from velocity anisotropy, which means velocities along different orientations are asymmetrical and have multiple interfaces. Then, Luo et al. [20] modified the velocity of the interface cell through the local solute equilibrium and improved the phenomenon of multiple interfaces. Wang et al. [21]. determined the length of the square half diagonal by the preferred orientation to ensure sharpness of the interface and introduced GF to reduce velocity anisotropy.
However, the DCSA rule dynamically determines the capture position and condition by tracking the dendrite tip, which is very complex. Massive calculations of the CA model incorporating the DCSA rule make large-scale simulations very time-consuming. It is, therefore, necessary to speed up the calculation. Some methods have attempted to improve calculation efficiency, such as adaptive meshes [22,23], parallelizing the computer program using MPI technology [24], and parallel computing technology based on serial arithmetic [25]. These accelerators are CPU-based, so the speedup is not good enough for the number of cores, being limited by the hardware architecture. Unlike the CPU, GPU is characterized by integrating thousands of computer cores inside, which makes it the most effective way to achieve acceleration. With the development of GPU in general purpose computing, it has been used in various fields [26,27]. Over the past two decades, the GPU-based acceleration method has become a hotspot in computational and material science [28,29,30] and has made great progress in dendrite growth simulation [31,32,33,34]. However, most of these contributions focused on the PF model, which is still unable to simulate dendrite growth at large scale, even when accelerated by using GPU.
This paper proposes a high-performance CA model incorporating the DCSA capture rule to simulate dendrite growth with different orientations more efficiently. To make full use of the hardware resources and improve the calculation efficiency, parallel algorithms and a task scheduling scheme using multi-stream are proposed. Compared to the traditional CPU-CA model, this model can achieve great acceleration with a speedup of 158×. In addition, the steady-state tip velocity predicted by this work shows great agreement with the analytical value of the LGK model. The simulation results of the binary alloy by this model not only show dendrites with different orientations, but also agree well with the experimental result in situ. This model will be a promising tool for studying the dendrite growth during the large-scale solidification.
The following chapters will cover the establishment, solution, and verification of the model in detail.

2. Materials and Methods

2.1. Description of Numerical Model

2.1.1. Heat Transfer Model

Equation (1) is used to describe heat transfer during alloy solidification.
p c p T t = x ( λ T x ) + y ( λ T y )
where T is the temperature, f s is the solid fraction, ρ is the density, c p is the equivalent specific heat, and L is the latent heat.

2.1.2. Solute Distribution Model

The solute distribution model consists of solute redistribution at the interface and solute diffusion across the entire domain. For one thing, the solute redistribution is determined by Equations (2) and (3) according to local equilibrium.
C s = k C l
d C = C l ( 1 k ) Δ f s
where d C is the residual solute expelled by the interface cell, and k is the coefficient of equilibrium solute partition ( k < 1 in the present work).
First, the expelled solute will be discharged into the remaining liquid of the current cell. Then, the current C l will be compared to the equilibrium solute concentration C l * ; the part beyond C l * will be discharged to adjacent liquid cells. C l * is calculated by Equation (4).
C l * = C 0 + T T 0 m l + Γ K a ( n ^ ) m l
where T is the actual temperature, T 0 is the initial temperature, C 0 is the initial solute concentration, m l is the liquidus slope, and a ( n ^ ) is the function of interface anisotropy.
If the current cell is completely solidified, then all the excluded solute will be discharged to the adjacent liquid cells. How much solute will be discharged into an adjacent liquid cell is designed by weight, as shown in Equation (5).
w i = C i 0 C l j = 0 N ( C j 0 C l )
where C i 0 C l is the solute difference between the interface cell and the adjacent liquid cell i , N is the number of liquid neighbours.
For another, the solute diffusion coefficient in liquid is three to four orders of magnitude larger than that in solid, so diffusion in solid phase is neglected in this paper. Equation (6) shows the diffusion of a solute in liquid and interface.
C l t = x ( D i C l x ) + y ( D i C l y )
where D i is the solute diffusion coefficient, which is governed by Equation (7).
D i = f s D s + ( 1 f s ) D l
where D l and D s are the diffusion coefficient in liquid and solid, respectively.

2.1.3. CA Model

In the traditional CA model, only fully solidified cells ( f s = 1 ) can capture their liquid neighbors. This capture rule is severely affected by the grid layout, so it can only simulate dendrites growing along the x axis and 45° with the x axis. However, the growth orientation of dendrite is chaotic in the actual solidification process of the alloy. In order to simulate dendrite growth closer to reality, the decentered square rule for capturing has been adopted by the present CA model. As shown in Figure 1, the key to the improved algorithms is dynamically calculating the nucleation position and nucleation conditions, according to the position where the interface cell (parent cell) reaches the liquid cell. All cells in the entire computing domain are initialized to liquid ( f s = 0 ). As the temperature decreases, the one who receives the nucleation conditions will receive the chance to nucleate. The nucleation probability is calculated by Equation (8) combined with random probability.
d n d Δ T = n m a x 2 exp [ 1 2 ( Δ T Δ T N Δ T σ ) ]
where Δ T is the undercooling, n m a x is the maximum density of nuclei given by the integral of undercooling (from 0 to Δ T ) of Equation (8), Δ T N is the average nucleation undercooling, and Δ T σ is the standard deviation. Once a cell is nucleated, its solid fraction will be changed from 0 to 1, and a decentered square with an angle θ between diagonal and x axis will be located at its center. Additionally, four corners of this square penetrate the nearest liquid neighbors, capturing them in the corners and changing them into interface cells. Captured cells will inherit the growth properties of the parent cell and grow along the diagonal to capture its liquid neighbors until it is completely solidified.
In order to simulate the dendrite morphology in detail, the local level rule method is used to calculate the increment of the solid fraction [35], wherein Δ f s of each time step is determined by Equation (9). The length of the primary arm of the dendrite is updated by Equation (10).
Δ f s = ( C l * C l ) ( C l * ( 1 k ) ) G F
l ( t + Δ t ) = l ( t ) + Δ f s l m a x
l m a x is the maximum half-diagonal length determined by Equation (11).
l m a x = l ( Δ x max ( sin θ , cos θ ) )
Δ x is the size of the cell, and G F [36] is the geometry factor related to the state of neighbors, which is introduced to avoid multiple interfaces and is limited to no more than 1.
G F = min { 1 , G ( m = 1 4 S m I + 2 m = 1 4 S m II ) }
where G is an adjustable factor, s m Ι and s m Ι Ι are the state of the nearest neighbor and the second nearest neighbor, respectively, and both of them have two values, as shown in Equation (13).
S m I , S m II = { 0 ,   f s < 1 1 ,   f s = 1

2.2. Parallel Solver Based on GPUq

To simulate the morphology of dendrite with clequeqear secondary arms, the cell size is generally divided into 1~2 μ m . There will be huge calculations when conducting large-scale simulations, which is time-consuming using CPU. In addition, the purpose of the simulation is to optimize the process parameters by performing many groups of experiments. Therefore, it is necessary to accelerate the calculation. This paper designs a GPU-based parallel solver for acceleration.

2.2.1. GPU-CA Framework

The GPU-CA frame used in this work is shown in Figure 2, in which each slice has the cell state of the cross-section corresponding to this moment.
In this heterogeneous framework, the CPU is responsible for allocating memory, initializing, and transferring the initial state to the global memory on the GPU via the PCIe bus. Then, all the threads on the GPU execute instructions simultaneously in single-instruction-multiple-data (SIMD) mode until the required calculations are completed. Finally, data are transferred from GPU memory to CPU memory via the PCIe bus for post-processing. This work uses Pascal GP100 GPU (embedded with 3584 CUDA cores) as the accelerator, where millions of threads can execute instructions simultaneously, and each thread corresponds to a cell.

2.2.2. Implementation by CUDA C

This work adopts CUDA as the programming model, because it allows us to execute applications on heterogeneous computing systems by simply annotating code with a small set of extensions to the C programming language. In addition, the CUDA programming model provides the exposed memory hierarchy, in which global memory is the most widely used, because it has a large memory space. This work chose global memory and, based on it, designed the structure of array (SOA) to organize data, because the SOA is more liable to maximize the efficiency of accessing the global memory.
  • Task scheduling scheme
CUDA provides streams to achieve concurrency between kernels, where kernels are executed sequentially in the same stream, simultaneously in different streams. To increase parallelism, this paper divides the problem into eight small tasks, each corresponding to a kernel function, as shown in Table 1.
All kernels are related, but at some point, some kernels are independent. For example, before kernel solute _ Dif is scheduled, kernels capture , schange , calD are independent. To solve the waiting problem among independent tasks, this paper puts all kernels into two streams based on the kernel dependency, as shown in Figure 3. It is noted that all operations in the non-default stream are non-blocking with respect to the host thread. Thus, we need to synchronize the host with operations running in a stream. The overall flow of the numerical simulation is shown in Figure 3, where kernel function solute _ Dif depends on values of C L and D calculated by calD and schange , respectively. In this case, the host has to wait until the calD and schange finish their calculation before solute _ Dif is scheduled. This work uses the cudaDeviceSynchronize ( void ) function to achieve synchronization between the host and operations running in a stream.
2
Parallel algorithms
Global memory can be accessed on the device from any SM throughout the application’s lifetime. When multiple threads write data to the same address at the same time, there will be a ‘data race’ that can lead to an undefined error. The CA model in this work adopted the Moore neighbor, in which each cell has eight neighbors. Therefore, there may be more than one neighbor discharging solute into a liquid cell or capturing it at the same time. Mapping to the programming model, there are multiple threads that attempt to modify the data in the same address, introducing a ‘data race’. This paper avoided this phenomenon by preventing the cell from ‘actively’ discharging solute to neighboring cells or capturing it. For example, the solute redistribution algorithm adopts a kernel function and a device function to turn ‘active’ to ‘passive’, as shown in Figure 4. There are two steps to complete the solute redistribution process. The pseudo-code is listed in Algorithm 1.
First, calculate how much solute will be discharged to each liquid neighbor and store it in the intermediate variables, lines 2–7 in Algorithm 1.
Then, read the data stored by the first step from the neighbors and sum it to the solute of the current cell changed, lines 8–11 in Algorithm 1.
Algorithm 1 parallel solute redistribution algorithm
1  i d :     assign   thread   to   cell
2  for   all   interface   cells   do
3   d C diacharged   solute
4   if ( d C > 0 )
5    d C i store   the   solute   dischared   to   cells
6   end
7  end
8  for   all   liquid   and   interface   cells   do
9   temp read   dC i   from   neighbors
10   C l C l + temp / / add   temp   to   C l
11  end
This algorithm can avoid the ‘data race’ and make all cells in the calculation domain independent.

3. Results and Discussion

3.1. Validated by the LGK Model

This model was validated by comparing the steady velocity of a free dendrite crystal in an undercooled melt with the analytical value of the LGK model. This work defines the velocity of the dendrite tip through the cell size and time interval as the cell stays in the interface state, and the steady state of dendrite growth is determined as the solute at the boundary opposite the dendrite tip reaches 1.01 times the initial value [37,38]. The physical parameters used in this paper are shown in Table 2.
This test was performed in a square domain with a size of 400 μm × 400 μm, which is uniformly divided into 400 × 400 cells with the size of 1 μm × 1 μm. At the beginning of solidification, a nucleus with a preferred orientation of 0° was placed in the center of the domain.
Figure 5 shows the evolution of the transient velocity of the dendrite tip as a function of time calculated by the present CA model under the undercooling of 8K and the steady velocity calculated by the LGK model. It can be seen that tip velocity of the dendrite decreases dramatically in the transient growth period; then, the decreasing tendency becomes mild in the steady growth period. Finally, the velocity is stable at 56.33 μm/s, which is very close to the analytical value of 55.90 μm/s calculated by the LGK model.

3.2. Model Capability

This model is applied to simulate the dendrite growth of binary alloy. Firstly, a group of dendrites of Fe–0.6C alloy are simulated to evaluate the ability to simulate the dendrites with different orientations. Secondly, it is applied to simulate multi-orient dendrites’ growth of Fe–5.3Si alloy [41], and the simulated result is compared with the in situ observation. Finally, the performance of the parallel solution is analyzed by comparing the calculation time with the traditional CPU calculation.

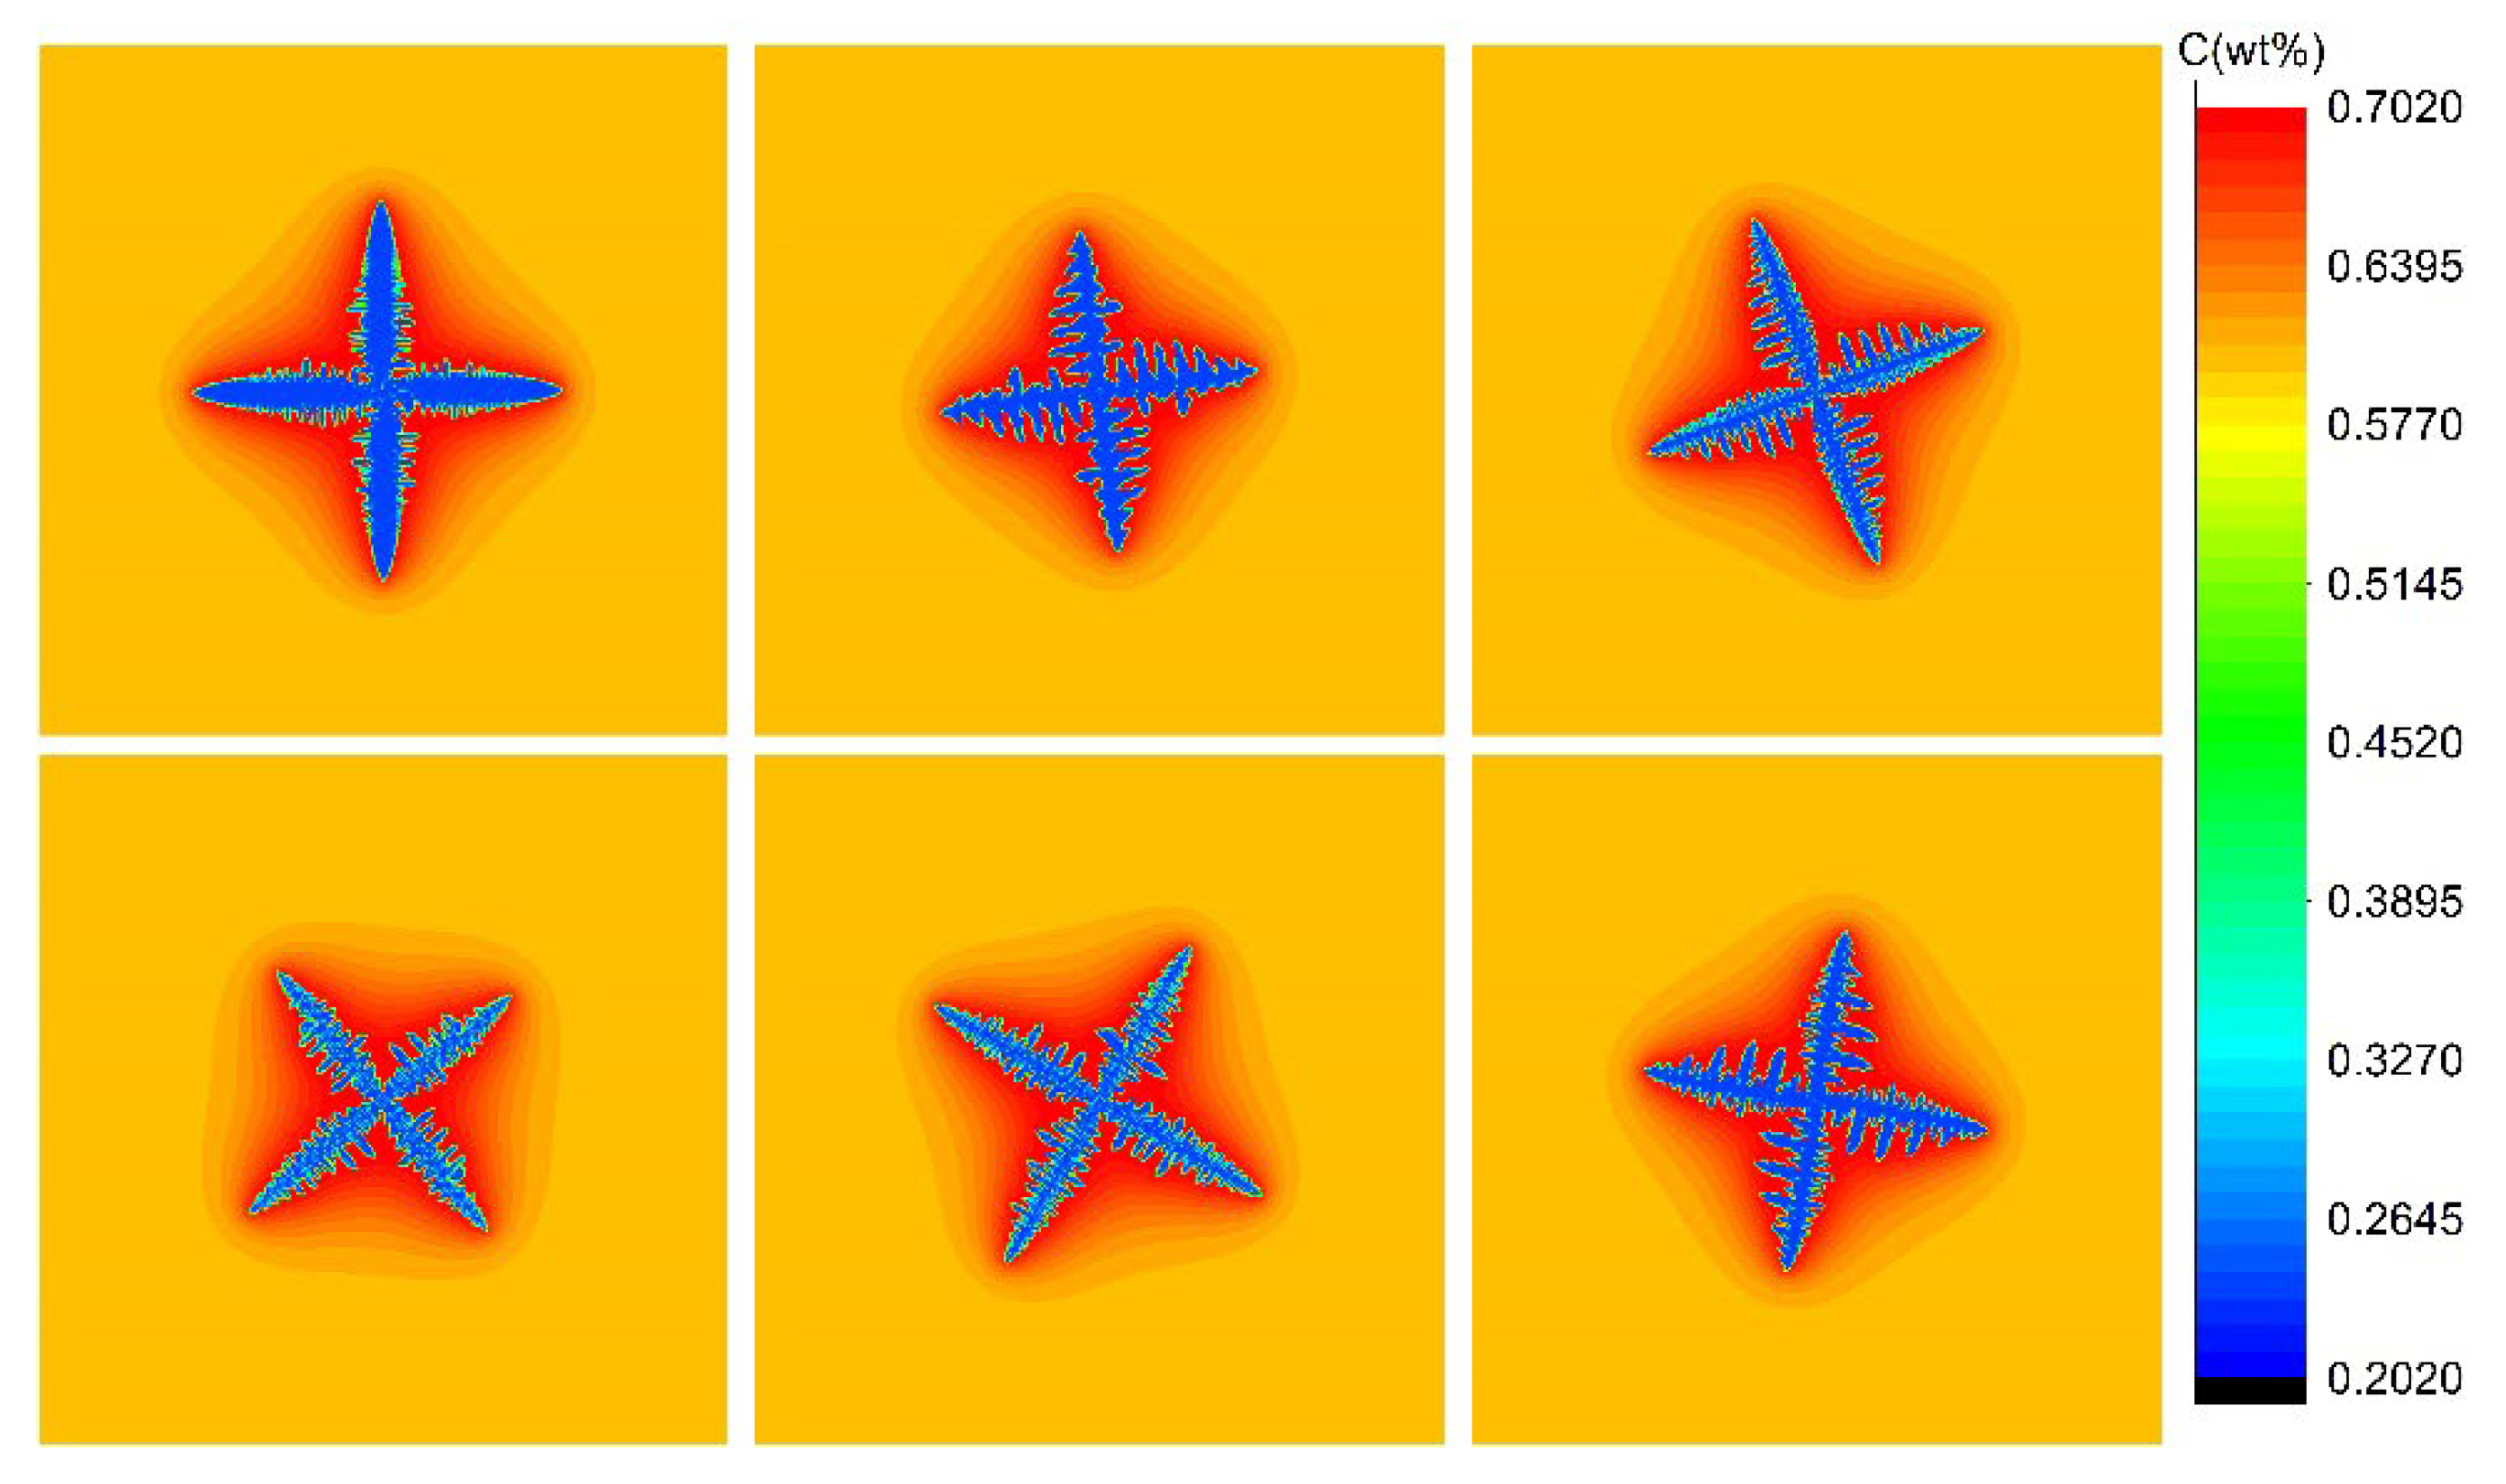
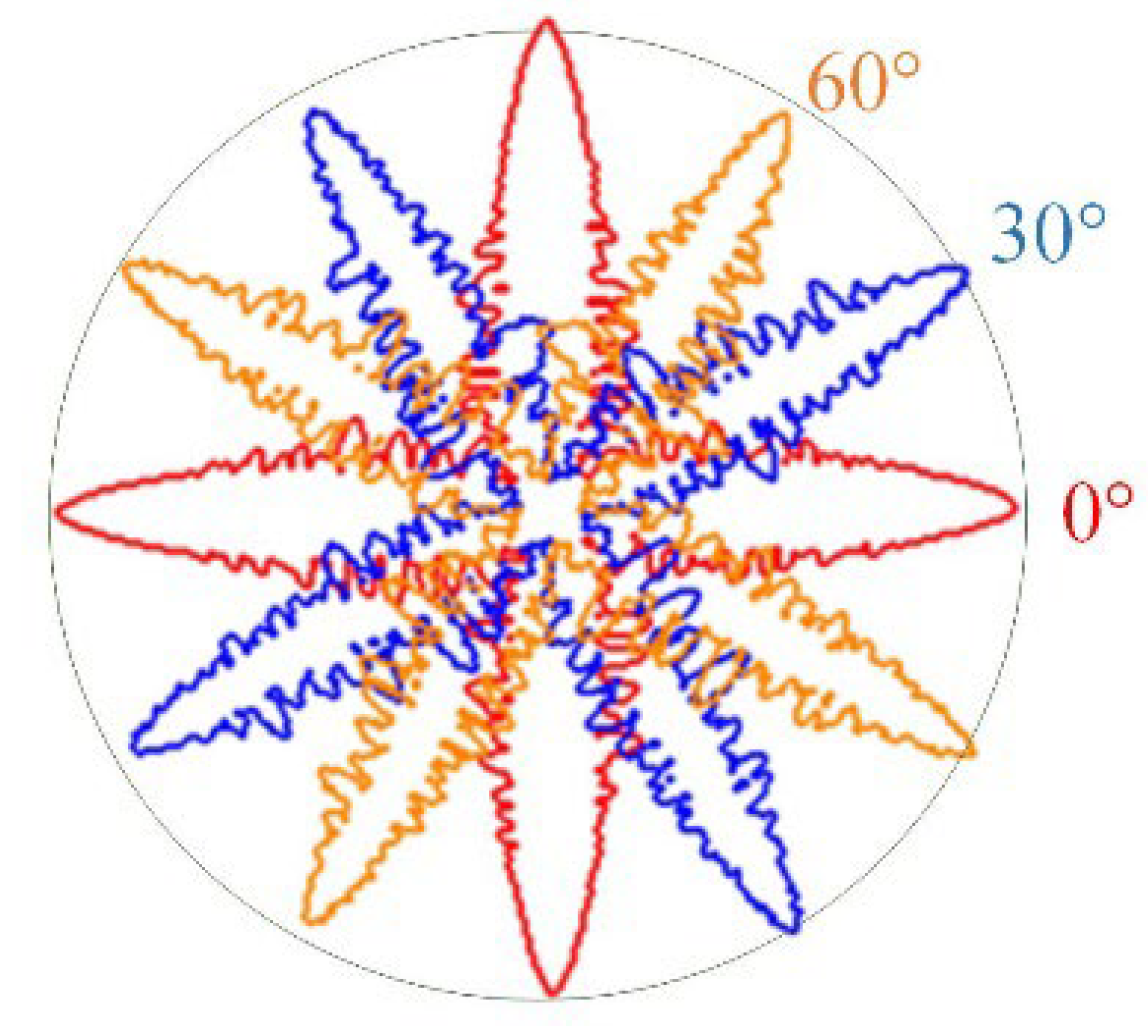
3.2.1. Single Dendrite of Fe–0.6C Alloy

A group of dendrites of Fe–0.6C with different orientations are simulated in this part, where the orientation ranges from 0° to 90° due to the four-fold symmetry of the dendrite. Simulations are also performed on a square domain with a size of 400 μm × 400 μm that is divided into 400 × 400 cells. Figure 6 shows the simulation results at 0.6 s with a constant undercooling of 8K, which shows that the present model can simulate clear dendrite morphology with not only different orientations but also second dendrite arms.
In addition, as shown in Figure 7, the primary arm of dendrites with different orientations of 0°, 30°, and 60° are almost the same length, indicating that growth velocities with different orientations are in good symmetry.

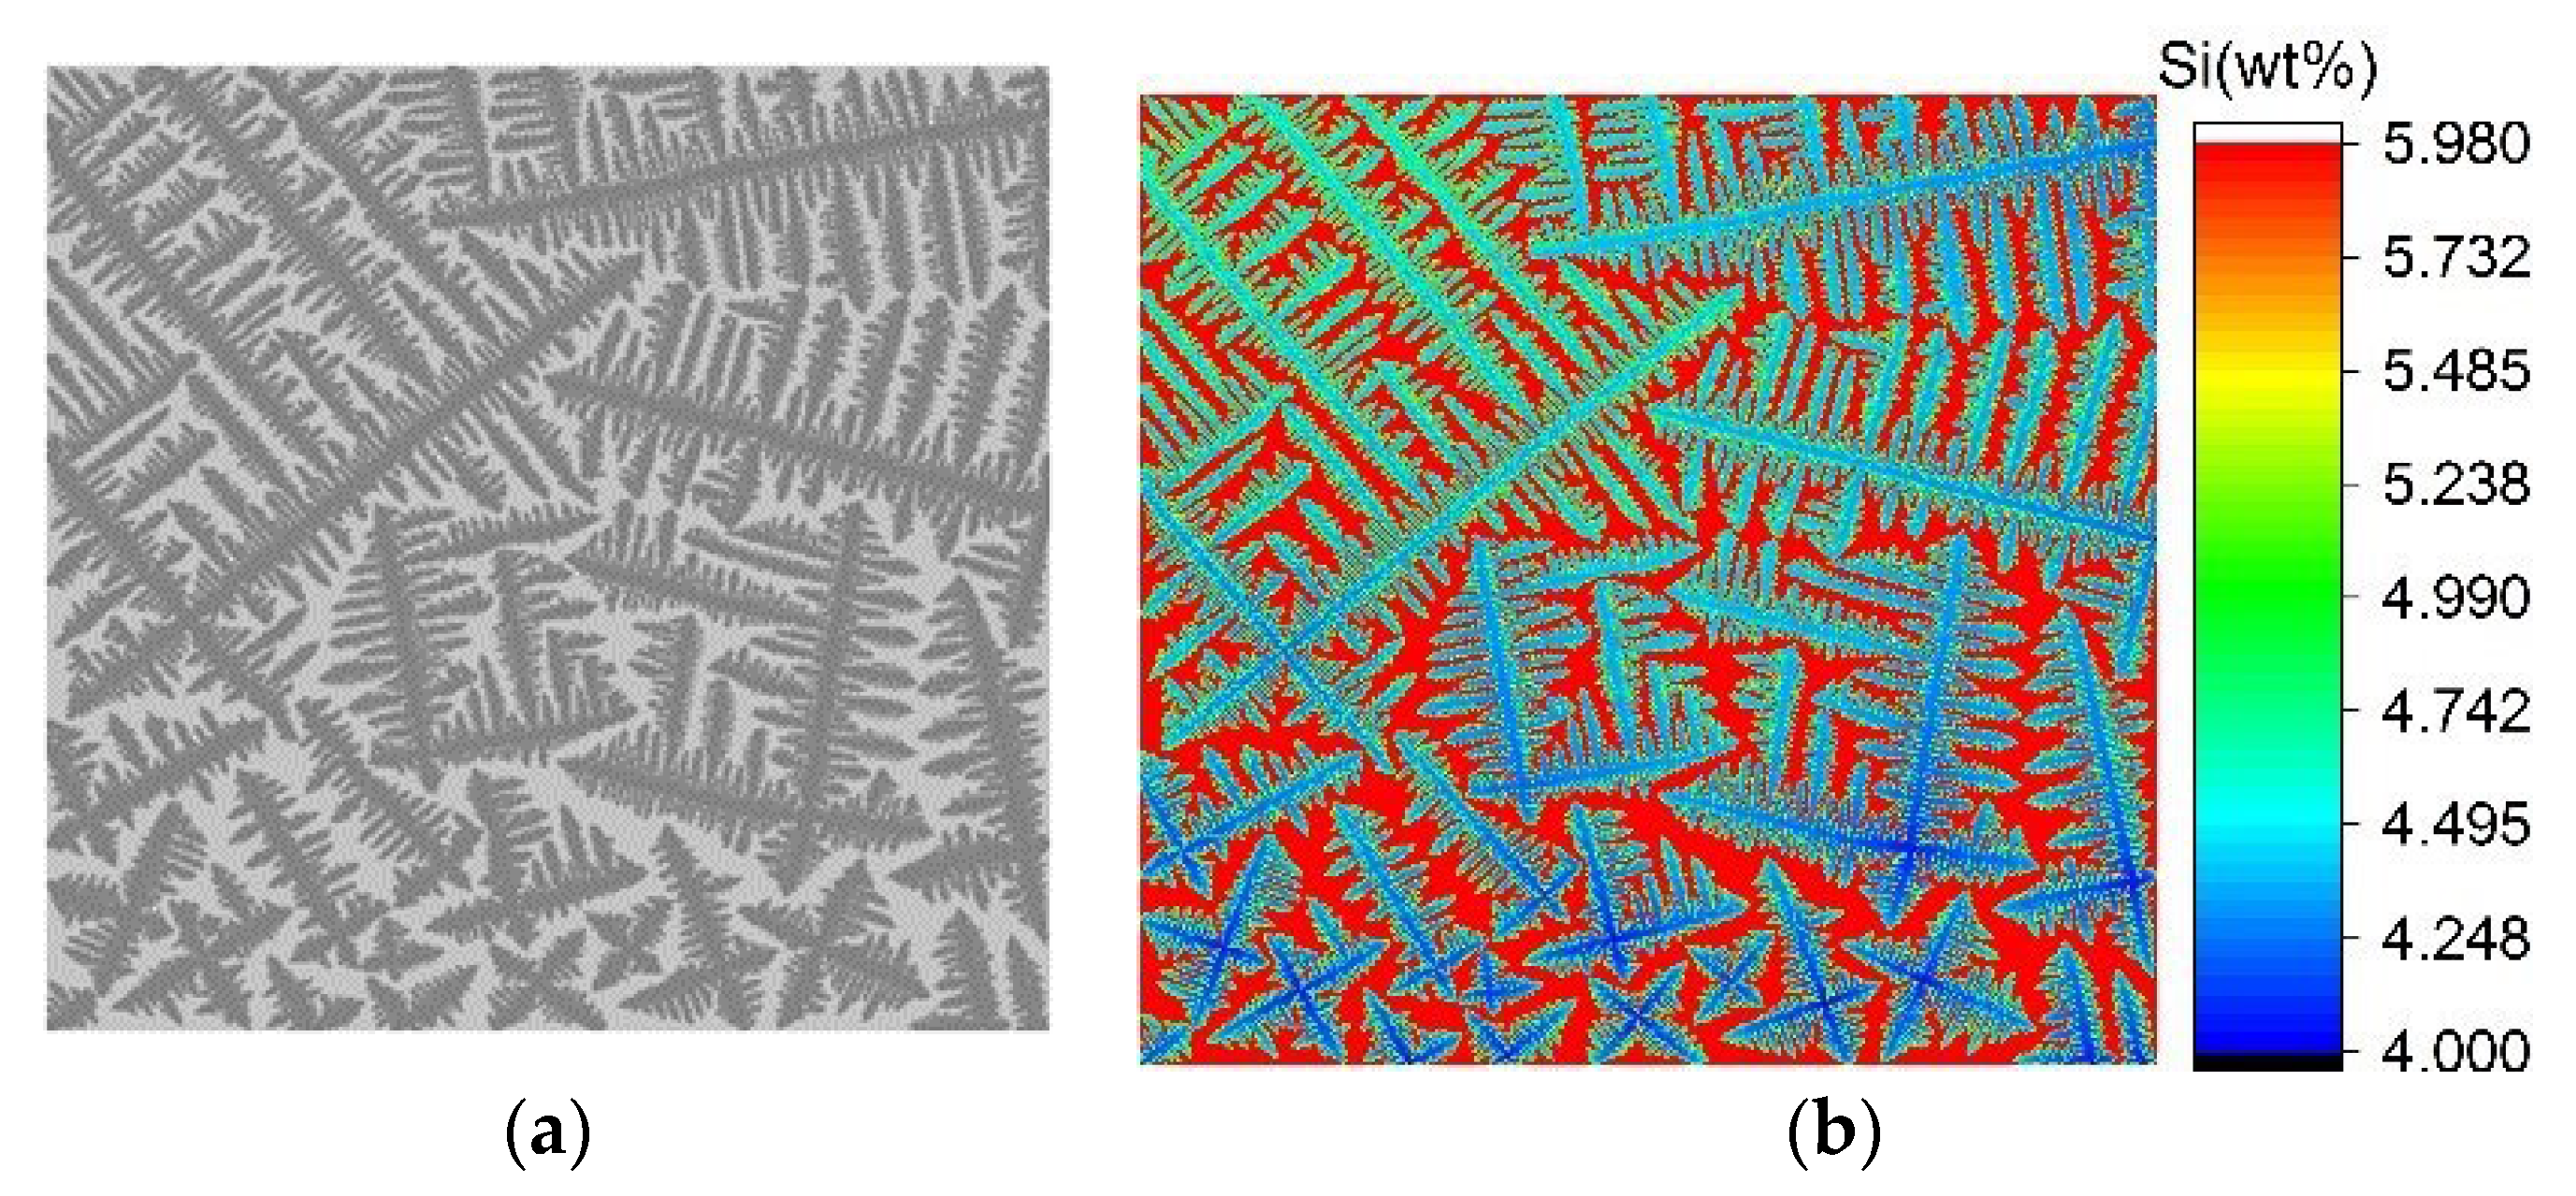
3.2.2. Multi-Dendrites of Fe–5.3Si Alloy

The development of synchrotron X-ray technology has enabled the observation of solidification in metallic alloys, which provides a powerful tool to verify the model. Yasuda et al. [41] performed in situ observation of Fe–5.3Si wt.% alloy, which shows a clear morphology of dendrite, including secondary dendrite arms. To validate this model, this paper simulated multi-orient dendrites’ growth of Fe–5.3Si alloy under the same experimental condition as the in situ observation, which set the nuclei positions and orientations corresponding to the in situ experimental observation before the simulation began. Figure 8a,b depict the simulated dendrite morphology and solute profile, respectively.
Simulation results show that the bottom dendrite is less developed than the upper because there are more dendrites at the bottom than at the upper, which agrees well with the in situ observation by synchrotron X-ray imaging [41]. For one thing, the growth of many dendrites will make the surrounding solute enriched, which will restrict the development of dendrites. For another, the more dendrites, the less space for each of them. In addition, Figure 8b shows the segregation between dendrites and within a dendrite, which satisfies well the non-equilibrium solidification theory [42]. Therefore, this model can simulate the growth of the dendrite in the actual casting process and reveal the phenomenon of segregation.

3.2.3. Acceleration Performance

The block size configured when launching a kernel function means a lot to performance because of its impact on latency hiding, memory efficiency, and occupancy, etc. A group of numerical experiments were carried out to find the optimal execution configuration according to the grid and block size guidelines [43]. Further, parts of the representative numerical simulation results are shown in Table 3, which shows that the configuration of (32,4) can obtain optimal performance. Accordingly, the following numerical experiments are performed under this configuration.
Speedup, the ratio between the CPU and GPU computational time, is used to evaluate the performance of the present GPU-CA model. The same numerical simulations were performed both on the Intel(R) Xeon(R) CPU E5-2680 v4 @ 2.40 GHz and Pascal GP 100 GPU. All simulations are carried out on the assumption that solidification has been started with 0.6 s, which equals 600,000 steps in the case of Δ t = 0.0001   s . Figure 9 shows the computation time on the CPU and GPU as well as the speedup, which shows that this model can achieve great acceleration. In addition, the speedup increases with the number of grids, which is up to 158×, but the tendency to increase becomes low from a certain point. This can be explained by limited hardware resources, and before it is fully utilized, performance will be significantly improved when the grid number is increased. Once occupancy reaches its maximum, performance may be limited by additional scheduling overhead when increasing the grid number again.

4. Conclusions

This paper aims to develop a high-performance CA model incorporating the decentered square capture rule to simulate dendrite growth with different orientations more efficiently. The calculation efficiency of the CA model based on GPU has been improved by the proposed parallel algorithms adapted to the many-core architecture of GPU and the task scheduling scheme using multi-stream, and it is validated by comparing the calculated value with the analytical value by the LGK model. By applying this model to simulate the single dendrite of the Fe–0.6C alloy in different orientations and the multi-orient dendrite growth of the Fe–5.3Si alloy, the following conclusions can be drawn:
(1)
The steady dendrite tip velocity calculated by this CA model agrees well with the analytical LGK model.
(2)
The present model can simulate dendrite morphologies with a random orientation of the Fe–0.6C alloy and can maintain velocity symmetry under different orientations.
(3)
The simulation result of Fe–5.3Si not only matches well with the in situ experiment but can also reveal the segregation existing between and within dendrite. This model can be used to simulate multi-dendrite growth in actual casting.
(4)
Compared to traditional CPU calculation, this work can achieve noticeable acceleration, and the speedup increases with the number of grids, which is up to 158×.
This GPU-based model can greatly accelerate the calculation, which will be a promising tool in the field of studying dendrite growth during large-scale solidification.

Author Contributions

Methodology, writing—original draft preparation, J.W.; formal analysis, H.M. and J.Y.; funding acquisition and supervision, Z.X. and H.M. All authors have read and agreed to the published version of the manuscript.

Funding

This work was funded by National Natural Science Foundation of China, grant number No.51634002 and No.61703084 and Fundamental Research Funds for the Central Universities, grant number N224001-8.

Data Availability Statement

The data applied in this research are available from the authors upon request.

Conflicts of Interest

The authors declare no conflict of interest.

References

  1. Domitner, J.; Kharicha, A.; Grasser, M.; Ludwig, A. Reconstruction of Three-Dimensional Dendritic Structures based on the Investigation of Microsegregation Patterns. Steel Res. Int. 2010, 81, 644–651. [Google Scholar] [CrossRef]
  2. Guo, E.Y.; Shuai, S.; Kazantsev, D.; Karagadde, S.; Phillion, A.B.; Jing, T.; Li, W.Z.; Lee, P.D. The influence of nanoparticles on dendritic grain growth in Mg alloys. Acta. Mater. 2018, 152, 127–137. [Google Scholar] [CrossRef]
  3. Liss, K.D.; Garbe, U.; Li, H.J.; Schambron, T.; Almer, J.D.; Yan, K. In Situ Observation of Dynamic Recrystallization in the Bulk of Zirconium Alloy. Adv. Eng. Mater 2009, 11, 637–640. [Google Scholar] [CrossRef]
  4. Osher, S.; Fedkiw, R.P. Level set methods: An overview and some recent results. J. Comput. Phys. 2001, 169, 463–502. [Google Scholar] [CrossRef] [Green Version]
  5. Rodgers, T.M.; Madison, J.D.; Tikare, V. Simulation of metal additive manufacturing microstructures using kinetic Monte Carlo. Comput. Mater. Sci. 2017, 135, 78–89. [Google Scholar] [CrossRef]
  6. Wei, L.; Lin, X.; Wang, M.; Huang, W.D. Cellular automaton simulation of the molten pool of laser solid forming process. Acta. Phys. Sin.-Chi. Ed. 2015, 64, 018103. [Google Scholar] [CrossRef]
  7. Bai, Y.; Wang, Y.; Zhang, S.; Wang, Q.; Li, R. Numerical Model Study of Multiple Dendrite Motion Behavior in Melt Based on LBM-CA Method. Crystals 2020, 10, 70. [Google Scholar] [CrossRef] [Green Version]
  8. Wang, Q.; Wang, Y.; Zhang, S.; Guo, B.; Li, C.; Li, R. Numerical Simulation of Three-Dimensional Dendrite Movement Based on the CA–LBM Method. Crystals 2021, 11, 1056. [Google Scholar] [CrossRef]
  9. Zhang, X.F.; Zhao, J.Z. Effect of forced flow on three dimensional dendritic growth of al-cu alloys. Acta. Met. Sin. 2012, 48, 615–620. [Google Scholar] [CrossRef]
  10. Wang, W.; Wang, Z.; Yin, S.; Luo, S.; Zhu, M. Numerical simulation of solute undercooling influenced columnar to equiaxed transition of Fe-C alloy with cellular automaton. Comput. Mater. Sci. 2019, 167, 52–64. [Google Scholar] [CrossRef]
  11. Ma, W.; Li, R.; Chen, H. Three-Dimensional CA-LBM Model of Silicon Facet Formation during Directional Solidification. Crystals 2020, 10, 669. [Google Scholar] [CrossRef]
  12. SenGupta, A.; Santillana, B.; Sridhar, S.; Auinger, M. Dendrite growth direction measurements: Understanding the solute advancement in continuous casting of steel. IOP Conf. Ser. Mater. Sci. Eng. 2019, 529, 012065. [Google Scholar] [CrossRef]
  13. Beltran-Sanchez, L.; Stefanescu, D.M. Growth of solutal dendrites: A cellular automaton model and its quantitative capabilities. Met. Mater. Trans. A 2003, 34, 367–382. [Google Scholar] [CrossRef]
  14. Wei, L.; Lin, X.; Wang, M.; Huang, W. A cellular automaton model for the solidification of a pure substance. Appl. Phys. A Mater. 2010, 103, 123–133. [Google Scholar] [CrossRef]
  15. Rappaz, M.; Gandin, C.A. Probabilistic modelling of microstructure formation in solidification proc. Acta Mater. 1993, 41, 345–360. [Google Scholar] [CrossRef]
  16. Wang, W.; Lee, P.D.; McLean, M. A model of solidification microstructures in nickel-based superalloys: Predicting primary dendrite spacing selection. Acta Mater. 2003, 51, 2971–2987. [Google Scholar] [CrossRef]
  17. Yuan, L.; Lee, P.D. Dendritic solidification under natural and forced convection in binary alloys: 2D versus 3D simulation. Model. Simul. Mater. Sci. 2010, 18, 055008. [Google Scholar] [CrossRef]
  18. Zhao, Y.; Chen, D.F.; Long, M.J.; Arif, T.T.; Qin, R.S. A Three-Dimensional Cellular Automata Model for Dendrite Growth with Various Crystallographic Orientations During Solidification. Met. Mater. Trans. B 2014, 45, 719–725. [Google Scholar] [CrossRef]
  19. Chen, R.; Xu, Q.; Liu, B. A Modified Cellular Automaton Model for the Quantitative Prediction of Equiaxed and Columnar Dendritic Growth. J. Mater. Sci. Technol. 2014, 30, 1311–1320. [Google Scholar] [CrossRef]
  20. Luo, S.; Zhu, M.Y. A two-dimensional model for the quantitative simulation of the dendritic growth with cellular automaton method. Comput. Mater. Sci. 2013, 71, 10–18. [Google Scholar] [CrossRef]
  21. Wang, W.L.; Luo, S.; Zhu, M.Y. Development of a CA-FVM Model with Weakened Mesh Anisotropy and Application to Fe–C Alloy. Crystals 2016, 6, 147. [Google Scholar] [CrossRef] [Green Version]
  22. Wei, L.; Lin, X.; Wang, M.; Huang, W.D. Orientation selection of equiaxed dendritic growth by three-dimensional cellular automaton model. Phys. B 2012, 407, 2471–2475. [Google Scholar] [CrossRef] [Green Version]
  23. Provatas, N.; Greenwood, M.; Athreya, B.; Goldenfeld, N.; Dantzig, J. Multiscale modeling of solidification: Phase-field methods to adaptive mesh refinement. Int. J. Mod. Phys. B 2005, 19, 4525–4565. [Google Scholar] [CrossRef] [Green Version]
  24. Jelinek, B.; Eshraghi, M.; Felicelli, S.; Peters, J.F. Large-scale parallel lattice Boltzmann-cellular automaton model of two-dimensional dendritic growth. Comput. Phys. Commun. 2014, 185, 939–947. [Google Scholar] [CrossRef]
  25. Feng, W.M.; Xu, Q.Y.; Liu, B.C. Microstructure simulation of aluminum alloy using parallel computing technique. ISIJ Int. 2002, 42, 702–707. [Google Scholar] [CrossRef]
  26. Campos, R.S.; Lobosco, M.; dos Santos, R.W. A GPU-based heart simulator with mass-spring systems and cellular automaton. J. Supercomput. 2014, 69, 1–8. [Google Scholar] [CrossRef]
  27. Yam-Uicab, R.; Lopez-Martinez, J.; Trejo-Sanchez, J.; Hidalgo-Silva, H.; Gonzalez-Segura, S. A fast Hough Transform algorithm for straight lines detection in an image using GPU parallel computing with CUDA-C. J. Supercomput. 2017, 73, 4823–4842. [Google Scholar] [CrossRef]
  28. Aoki, T.; Ogawa, S.; Yamanaka, A. Multiple-GPU Scalability of Phase-Field Simulation for Dendritic Solidification Progress in nuclear science and technology. Prog. Nucl. Sci. Technol. 2011, 2, 639–642. [Google Scholar]
  29. Takaki, T.; Rojas, R.; Ohno, M.; Shimokawabe, T.; Aoki, T. GPU phase-field lattice Boltzmann simulations of growth and motion of a binary alloy dendrite. IOP Conf. Ser. Mater. Sci. Eng. 2015, 84, 012066. [Google Scholar] [CrossRef] [Green Version]
  30. Yang, C.; Xu, Q.; Liu, B. GPU-accelerated three-dimensional phase-field simulation of dendrite growth in a nickel-based superalloy. Comput. Mater. Sci. 2017, 136, 133–143. [Google Scholar] [CrossRef]
  31. Sakane, S.; Takaki, T.; Rojas, R.; Ohno, M.; Shibuta, Y.; Shimokawabe, T.; Aoki, T. Multi-GPUs parallel computation of dendrite growth in forced convection using the phase-field-lattice Boltzmann model. J. Cryst. Growth 2017, 474, 154–159. [Google Scholar] [CrossRef]
  32. Yang, C.; Xu, Q.Y.; Liu, B.C. Primary dendrite spacing selection during directional solidification of multicomponent nickel-based superalloy: Multiphase-field study. J. Mater. Sci. 2018, 53, 9755–9770. [Google Scholar] [CrossRef]
  33. Sakane, S.; Takaki, T.; Ohno, M.; Shimokawabe, T.; Aoki, T. GPU-accelerated 3D phase-field simulations of dendrite competitive growth during directional solidification of binary alloy. IOP Conf. Ser. Mater. Sci. Eng. 2015, 84, 012063. [Google Scholar] [CrossRef] [Green Version]
  34. Kao, A.; Krastins, I.; Alexandrakis, M.; Shevchenko, N.; Eckert, S.; Pericleous, K. A Parallel Cellular Automata Lattice Boltzmann Method for Convection-Driven Solidification. JOM 2019, 71, 48–58. [Google Scholar] [CrossRef] [Green Version]
  35. Wang, T.M.; Wei, J.J.; Wang, X.D.; Yao, M. Progress and Application of Microstructure Simulation of Alloy Solidification. Acta Met. Sin. 2018, 54, 193–203. [Google Scholar]
  36. Shin, Y.H.; Hong, C.P. Modeling of dendritic growth with convection using a modified cellular automaton model with a diffuse interface. ISIJ Int. 2002, 42, 359–367. [Google Scholar] [CrossRef]
  37. Wang, J.J.; Meng, H.J.; Yang, J.; Xie, Z. A fast method based on GPU for solidification structure simulation of continuous casting billets. J. Comput. Sci. 2021, 48, 101265. [Google Scholar] [CrossRef]
  38. Beltran, S.L.; Stefanescu, D.M. A quantitative dendrite growth model and analysis of stability concepts. Met. Mater. Trans. A 2004, 35a, 2471–2485. [Google Scholar] [CrossRef]
  39. Wang, W.L.; Ji, C.; Luo, S.; Zhu, M.Y. Modeling of Dendritic Evolution of Continuously Cast Steel Billet with Cellular Automaton. Met. Mater. Trans. B 2018, 49, 200–212. [Google Scholar] [CrossRef]
  40. Nastac, L. Numerical modeling of solidification morphologies and segregation patterns in cast dendritic alloys. Acta Mater. 1999, 47, 4253–4262. [Google Scholar] [CrossRef]
  41. Yasuda, H.; Yamamoto, Y.; Nakatsuka, N.; Yoshiya, M.; Nagira, T.; Sugiyama, A.; Ohnaka, I.; Uesugi, K.; Umetani, K. In situ observation of solidification phenomena in Al-Cu and Fe-Si-Al alloys. Int. J. Cast Met. Res. 2009, 22, 15–21. [Google Scholar] [CrossRef]
  42. Kurz, W.; Fisher, D.J. Fundamentals of Solidification, 3rd ed.; Trans Tech Publication: Aedermannsdorf, Switzerland, 1992; pp. 71–92. [Google Scholar]
  43. Cheng, J.; Crossman, M.; Mckercher, T. Professional CUDA C Programming; John Wiley & Sons, Inc.: Indianapolis, Indiana, 2014; p. 96. [Google Scholar]
Figure 1. The diagram of the decentered algorithm ( θ is the angle between diagonal and x axis).
Crystals 13 00105 g001
Figure 2. GPU-CA architecture.
Crystals 13 00105 g002
Figure 3. The flow-chart of the program model.
Crystals 13 00105 g003
Figure 4. Avoiding data race ((a) store (b) read->change).
Crystals 13 00105 g004
Figure 5. Comparison of the steady tip velocity at a constant undercooling Δ T = 8 K .
Crystals 13 00105 g005
Figure 6. Solute profile and morphology of the equiaxed dendrite at the melt undercooling of 8K as the orientation is (a) 0°, (b) 5°, (c) 20°, (d) 40°, (e) 60°, and (f) 80°.
Crystals 13 00105 g006
Figure 7. Velocity symmetry in different orientations.
Crystals 13 00105 g007
Figure 8. Muti-dendrite morphology of Fe–5.3Si alloy simulated by present model (a) morphology, and (b) solute profile.
Crystals 13 00105 g008
Figure 9. Computational performance.
Crystals 13 00105 g009
Table 1. Task assignment in GPU-CA model.
Kernel FunctionsComputation Task
capture capturing neighbors
calD solute diffusion coefficient
solute _ Dif solute diffusion
schange solute redistribution in interface
get _ T temperature distribution
calB equilibrium solute
growth velocity and the arm length
backup storing data for the next slice
Table 2. Physical properties [39,40].
Property and SymbolFe–0.6CFe–5.3Si
Initial composition, C 0   ( wt . % ) 0.65.3
Liquidus temperature T l   ( K ) 1763.371732.87
Liquidus slope, m l   ( K % 1 ) −80−7.6
Solute partition coefficient, k 0 0.340.77
Solute diffusion coefficient in liquid D l   ( m 2 · s 1 ) 2 × 10−98.0 × 10−4exp (−29,943.23/T)
Solute diffusion coefficient in solid D s   ( m 2 · s 1 ) 5 × 10−108.0 × 10⁻⁸exp (−29,943.23/T)
Gibbs-Thomson coefficient, ( m · K ) 1.9 × 10−71.9 × 10−7
Table 3. Time elapsed with different kernel configuration.
Kernel ConfigurationTime Elapsed (s)
(128,1)37.94
(128,2)37.64
(128,4)38.85
(64,4)37.59
(64,2)37.53
(62,1)38.13
(32,8)37.70
(32,4)37.23
(32,2)37.85
Disclaimer/Publisher’s Note: The statements, opinions and data contained in all publications are solely those of the individual author(s) and contributor(s) and not of MDPI and/or the editor(s). MDPI and/or the editor(s) disclaim responsibility for any injury to people or property resulting from any ideas, methods, instructions or products referred to in the content.

