Article

Probing Optoelectronic and Thermoelectric Properties of Lead-Free Perovskite SnTiO3: HSE06 and Boltzmann Transport Calculations

by
Souraya Goumri-Said
College of Science, Physics Department, Alfaisal University, P.O. Box 50927, Riyadh 11533, Saudi Arabia
Crystals 2022, 12(9), 1317; https://doi.org/10.3390/cryst12091317
Submission received: 1 July 2022 / Revised: 31 August 2022 / Accepted: 14 September 2022 / Published: 18 September 2022
(This article belongs to the Special Issue Nanostructured Thermoelectric Materials)

Abstract

:
In order to develop a useful material for the optoelectronic sector with a variety of uses in thermoelectric and optical properties at a reasonable price, we researched SnTiO3, a Pb-free and Sn-based perovskite. We used the most recent density functional theory (DFT) methods, such as the gradient approximation (GGA) approach and the screened hybrid functional (HSE06). The calculated electronic structure yields to an indirect band gap of 2.204 eV along with two different K-points such as (X-Γ) using HSE06. The accomplished optical properties have been examined by dispersion, absorption, reflection, optical conductivity, and loss function against photon energy. The thermoelectric properties and electronic fitness function (EFF) were predicted DFT along with the Boltzmann transport theory. The Seebeck coefficient (S) and related thermoelectric properties such as electronic/thermal conductivity and the Hall coefficient were calculated as a function of chemical potential and carrier density (electrons and holes concentration) for room temperature. It was established that the temperature increases the Seebeck coefficient (S) at every hole carrier concentration. SnTiO3 has good EFF at 300, 500, and 800 K as well. The discovered EFF suggests that this material’s thermoelectric performance rises with temperature and can also be improved through doping. These findings demonstrated the potential of SnTiO3 as an n-type or p-type thermoelectric material depending on the doping.

1. Introduction

Over the past ten years, scientists have been inspired to investigate new renewable energy sources due to the rising global energy demand. Perovskite oxide solids are thought to have potential relevance for optoelectronic and thermoelectric applications in this regard. These materials can also be employed in thermoelectric coolers, thermoelectric generators, and thermocouples due to their extremely high thermal efficiency. Perovskite ferroelectric materials are currently employed extensively in applications for electronics, IR sensors, non-volatile storage, and dielectric characteristics, as well as for optical waveguides, integrated optics use, and substrates for the creation of high-TC superconductors [1]. Perovskites also have excellent qualities such as a straight band gap, minimal optical loss, low excitation binding energy, and highly visible absorption. Perovskite materials are seen as possible candidates for application in optoelectronic devices such as solar cells, light-emitting diodes, and photodetectors because of these unique features. To address the main issues with Pb-based perovskites, such as their toxicity and poor chemical stability, numerous other perovskite materials have recently been researched. These findings support lead-free perovskites as a viable alternative to Sn-based perovskites [1,2,3,4,5,6,7]. With uses in thermoelectrics, batteries, ferroelectrics, photocatalysis, and thermoelectric, among other things [8,9,10,11,12], titanates have established themselves as one of the most versatile groups of materials. According to the Goldschmidt tolerance factor, oxidized titanates with the formula ABX3, in which A is a metal in the +II oxidation state and B is Ti4+ (d0), can be further divided into hexagonal ilmenite-type or cubic perovskite-type structures [13]. The impact of lone pairs may have intriguing implications for A’s structure and characteristics if it is a post-transition metal with ns2 electron configuration [14,15]. Such lone pair materials have drawn more interest in recent years, particularly in light of the fact that hybrid perovskites [11] and associated structures [12] have shown to be effective solar materials and exhibit intriguing optoelectronic features. Due to a phase transition, SnTiO3 exhibits ferroelectric properties in its cubic phase with space group Pm3m above 763 K and transitions to a paraelectric phase in its tetragonal phase with space group P4mm at ambient temperature to become a ferroelectric material [16,17]. Using a plane-wave pseudo-potential (PWPP) technique, Konishi et al. [18] examined the electrical structure of the perovskite SnTiO3. In experimental measurements, SnTiO3’s paraelectric phase exhibits a band gap of 3–3.5 eV, while in theory, it exhibits the best value of 1.7 eV [19]. SnTiO3 belongs to materials that are highly sought after in new photovoltaic technologies because of a variety of mechanisms that make wide-band-gap photovoltages and higher efficiency possible. Additionally, the class of materials known as titanates has lately been used in a range of applications, including ferroelectrics, photocatalysts, thermoelectrics, and batteries. All of these materials’ uses provide a setting for SnTiO3 research mainly, the band-gap calculations.
The cubic structure of SnTiO3 is explored in the present work for its electronic band-gap nature and value as well as the deduced optical properties. Since SnTiO3 is known to be ferroelectric, we employed the transport theory of Boltzmann to calculate the thermoelectric properties.

2. Computational Details

Computational methods can be used to anticipate chalcogenide semiconductors’ band gap and absorption band edge. In various studies [20,21], density functional theory (DFT) simulations were used to calculate the band gap (Eg) of new materials. The lowest energy difference between the valence and conduction band maxima can be determined quickly and effectively using DFT, but speed comes with a price of accuracy. In rare cases, this calculation may lead to an underestimating of band gaps unless the parameters are empirically modified. For the band-gap calculation of chalcogenide semiconductors, more computationally expensive methods like HSE06, many body perturbation theories (GW), and GW with the Beth–Salpeter equation (GW-BSE) are used on a case-by-case basis [21,22,23,24,25]. In this density functional theory (DFT) study, the Kohn–Sham equations are resolved using a plane wave (PW) basis set. DFT calculations were carried out using the Quantum Wise Atomistix Toolkit (ATK) application [26,27]. A hybrid functional was used to address the exchange-correlation term, because it accurately accounts for Fock exchange [28,29,30,31].
E xc PBE 0 = 1 4 E x HF + 3 4 E x PBE + E c PBE
The exact-exchange energy E x HF for the Kohn–Sham orbitals is written as:
E x HF = e 2 2 kn k n w k f kn w k f k n ψ kn * ( r ) ψ k n ( r ) ψ k n * ( r ) ψ kn ( r ) | r r | drd r ,
E x HF   is computationally very expensive to estimate.
For periodic systems like the understudied compounds in the current work, the exact-exchange energy may never converge with distance. Heyd et al. [30,31] suggested dividing the exchange into short- and long-range sections, which may be represented using a screening length parameter, μ, in order to solve this issue. The short-range aspect of exact exchange can be described as the mixed component.
E xc HSE = 1 4 E x HF , sr , μ + 3 4 E x PBE , sr , μ + E x PBE , lr , μ + E c PBE
Two parameters, the screening length μ and the mixing fraction α, which in the PBE0 functional was 1/4, might be used to generalize the functional:
E xc HSE ( μ , α ) = α E x HF , sr , μ + ( 1 α ) E x PBE , sr , μ + E x PBE , lr , μ + E c PBE
E x HF , sr , μ is the short-range Hartree–Fock exact exchange functional,
E x PBE , sr , μ E x PBE,SR (ω) {\displaystyle E_{\text{x}}^{\text{PBE,SR}}(\omega)} and E x PBE , lr , μ E x PBE,LR (ω) {\displaystyle E_{\text{x}}^{\text{PBE,LR}}(\omega)} are the short- and long-range components of the PBE exchange functional.
E c PBE is the PBE [11] correlation functional.
The mesh cutoff energy for sampling the K-point was 95 Hartree, and the sample size was 15 × 15 × 15. With a maximum stress tolerance value of 0.01 eV/Å3, we used the minimal Broyden Fletcher Goldfarb Shanno (LBFGS) approach [31,32] to optimize the geometries. The structure is not completely loosened until each atom experiences a force smaller than 0.01 eV/Å. The rigid band approach and semi-classical Boltzmann theory [33,34] form the foundation of the calculated method for the transport characteristics of crystalline solids. We perform transport calculations from electronic structures using the BoltzTraP algorithm, which is based on the semi-classical Boltzmann theory [35]. Doping is handled using the rigid band approximation, and the relaxation time τ is added as a constant [35].
It is well known that σ depends on electronic relaxation time τ, and obtaining precise τ is challenging. Typically, the σ can be computed by fitting the estimated σ/τ to the experimental if there is an experimental value of σ. The deformation potential theory can be used to estimate for the theoretical prediction. The Boltzmann transport theory, as implemented in the BoltzTraP algorithm, was used to calculate the transport coefficients in the relaxation time approximation [35]. The Seebeck coefficient and electrical conductivity can be stated as follows within this relaxation time approximation:
S ( T , E F ) = 1 e T V σ α β ( E ) ( E E F ) f ( T ,   E E F ) d E σ α β ( E ) f ( T ,   E E F ) d E  
and
σ ( T ,   E F ) = 1 V σ α β ( E ) f ( T ,   E E F ) dE
where V is the unit cell volume, f’ is the energy derivative of the Fermi function at temperature T, and σ α β ( E ) is the energy-dependent transport function defined as:
σ α β ( E ) = e 2 υ α ( k ) υ β ( k ) τ ( k ) δ (   E E ( k ) ) d 3 k
where E(k) is the band energy and υ = k E / is the group velocity of carriers that can be directly derived from band structures.
It can be exceedingly challenging to estimate the energy-dependent relaxation time τ. However, cancels in the expression for τ in the constant scattering time approximation (CSTA), which assumes that the energy dependence of the scattering rate is small compared to the energy dependence of the electronic structure. For a variety of TE materials, the CSTA has been used to calculate Seebeck coefficients with success [35,36,37,38,39,40,41]. The PF and various procedures have been used for this, but τ is still required. Utilizing a universal τ with a constant value, such as 10 to 14 s, is the most typical [32,42,43]. This ignores the doping dependency [42] and the enhanced scattering brought on by phonons at high temperature. Additionally, this is a rather optimistic scenario because, typically, one would anticipate that dispersion would rise as temperature and carrier concentration rose. The electronic fitness function (EFF), t = ( σ / τ ) S 2 / N 2 / 3 ), which assesses the measure to which a general complex band structure decouples σ and S, is used to describe the transport function. In this case, the scattering rate is inverse.
Band structure can be used to directly derive σ/τ, but σ and τ independently require in-depth understanding of the scattering. In isotropic parabolic band systems, the EFF is small. Under the constant relaxation time approximation, this EFF can be explicitly estimated using first-principles electronic structures and the Boltzmann transport theory [44,45]. In comparison to other measurements for oxides, it exhibits promise [44]. The Fermi energy is represented by N, a parabolic band, in the EFF, where EF is positioned in relation to the band edge, and N ~ ( m dos * ) 3 / 2 E F 1 / 2 is the volumetric density of states, which is proportional to the density-of-states effective mass.

3. Results and Discussion

3.1. Electronic Structure Calculations

Figure 1 depicts the cubic SnTiO3 crystal structure. It crystallizes in the cubic Pm3m symmetry group. This structure was obtained from the database Materials project (https://materialsproject.org/, accessed on 13 September 2022). Sn atoms are found in the cell’s corners, oxygen atoms are found in the middle of each edge, and the only Ti atom is found in the cell’s center.
The electronic properties of studied perovskite SnTiO3 were determined by its energy band structure, total and partial density of states (TDOS and PDOS). In this study, the HSE06 approach was applied in order to enhance the band gap accuracy in semiconductors. In Figure 2, we show the band structures as calculated by HSE06 and GGA. With HSE06, we obtained an indirect gap (X-Γ) of 2.204 eV, whereas GGA is leading to an indirect gap of 1.035 eV. Compared to recent theoretical works performed using GGA-PBE and GGA-PBESol where the band gaps were found to be 1.164 eV and 2.445 eV, respectively [46,47], our band gap is approaching the experimental value as reported in [47,48]. In addition, band structure simulations using the hybrid functional HSE06 classify both projected high-pressure polymorphs as indirect gap semiconductors with marginally smaller band gaps than tetragonal PbTiO3 (PBE: 2.08 eV, exp. 3 eV, as indicated in references [47,48]). The calculated values for the two theoretically anticipated polymorphs of SnTiO3 at 1.87 eV for [BaTiO3]-type and 1.95 eV for [CaTaO2N]-type are relatively close because of a similar bonding condition.
The density of states depicts how different states are broken up. The crystalline field and electrostatic interactions between O-2p orbitals influence this, as shown in Figure 3. The Fermi level’s topmost valence band is chosen as zero, and the energy scale is measured in electron volts (eV). The compound exhibits an indirect bandgap of 2.204 eV between the upper part of the valence band at point X and the lower part of the conduction band at the point (Γ-X), as can be observed. In SnTiO3, the O-2p and Ti-3d orbitals belong to the valence and conduction bands, respectively. Between Sn and O, there is a lot of covalent bonding. The good behavior of ferroelectric material in the SnTiO3 compound is confirmed by this covalent bonding [49]. Furthermore, the upper valence band is dominated by O-2p electrons for all compositions of compounds, and the lower valence band originates from Ti-3d, Sn-5p.

3.2. Optical Properties

SnTiO3 is a possible efficient material for solar cells because of its band gap value. The electromagnetic spectrum has a high optical response of this. The imaginary component of the dielectric function is an example of a frequency-dependent linear optical property. In Figure 4, we have reported the imaginary parts of dielectric constant, optical conductivity and index refraction with extinction coefficient.
The peaks in the optical spectra are caused by electrons leaving occupied bands and entering empty bands at high symmetry locations in the Brillouin zone [50]. Figure 4a illustrates how the dielectric function’s real ε1 (ω) and imaginary parts ε2 (ω) change as a function of photon energy for the compound SnTiO3. From its zero-frequency limit, the real component of the dielectric constant ε1 (ω) increases to a peak value of 4.20 eV. The slight rise in frequency from resonance drops to the negative value at 7.47 eV. The negative dielectric constant suggests the metallic behavior of SnTiO3. Estimated static dielectric constant and optical gap are correlated by ε1 (0) ≈ 1 + D (Ep/Eg), where Ep, Eg are plasma energy and the average gap in the first Brillouin zone respectively and D is a constant whose magnitude is unity [51]. ε1 (0) ≈ 6.70 as computed outcome is consistent with this method, reflecting reliability of SnTiO3. Peaks originated in imaginary part ε2 (ω) due to the transition of electrons VB to the density-of-states analysis of SnTiO3 as provided in Figure 4, peaks are due to transition electrons to different states such as O-2p into Sn-5p CB, O-2p into Ti-3d CB, as well as O-2p into Sn-5p and Ti-3p CB.
Because photons transport energy to break the binding, optical conductivity increases as light absorption rises. The optical conductivity variation with photon energy for SnTiO3 is presented in Figure 4b, where peak is found at 6.32 eV. The entire analysis demonstrates that the investigated material has a band gap in the visible range, maximal absorption in the visible-to-ultraviolet region, and minimal reflection and optical loss, making it a good choice for optoelectronic applications.
The transparency could be investigated by the refractive index n (ω) of compounds when light is incident on their surface. n   ( ω ) is zero for totally transparent materials, whereas positive values indicate light absorption. Due to the fact that visible light is absorbed in the higher atomic layers of the material, the best optical materials have refractive indices in between 2.64 and 3.5 [52]. We plotted in Figure 4c the extinction coefficient, where we can find that the variation of the refractive index plot is comparable to ε1 (ω) from relationship n2 − k2 = ε1 (ω). Most importantly, at the zero frequency, refractive index n (0) is the static refractive index, and the real part static dielectric constant follows the relationship n2 (0) = ε1 (0) = 6.7. The variation of extinction coefficient k (ω) is considered as the replica of ε2 (ω) [53]. It also suggests that the absorption is maximum in the ultraviolet region. Its magnitude is minimum in the region where ε1 (ω) approaches a negative value as well as n (ω) fractional.
In Figure 5, we have plotted the optical spectrum: absorption, reflection and transmission. In the beginning, at 0 eV, the material is in transmission mode with 80% of the transmission coefficient and 20% of reflection. The absorption is zero and starts increasing from energies around 1 eV. At 2.2 eV, the absorption is 34%, whereas T falls to 40% and R is stable to 22%. The maximum absorption is reached around energy of 3 eV with 73% corresponding to zero transmission and 27% of reflection, suggesting that absorption is maximum in the ultraviolet region.

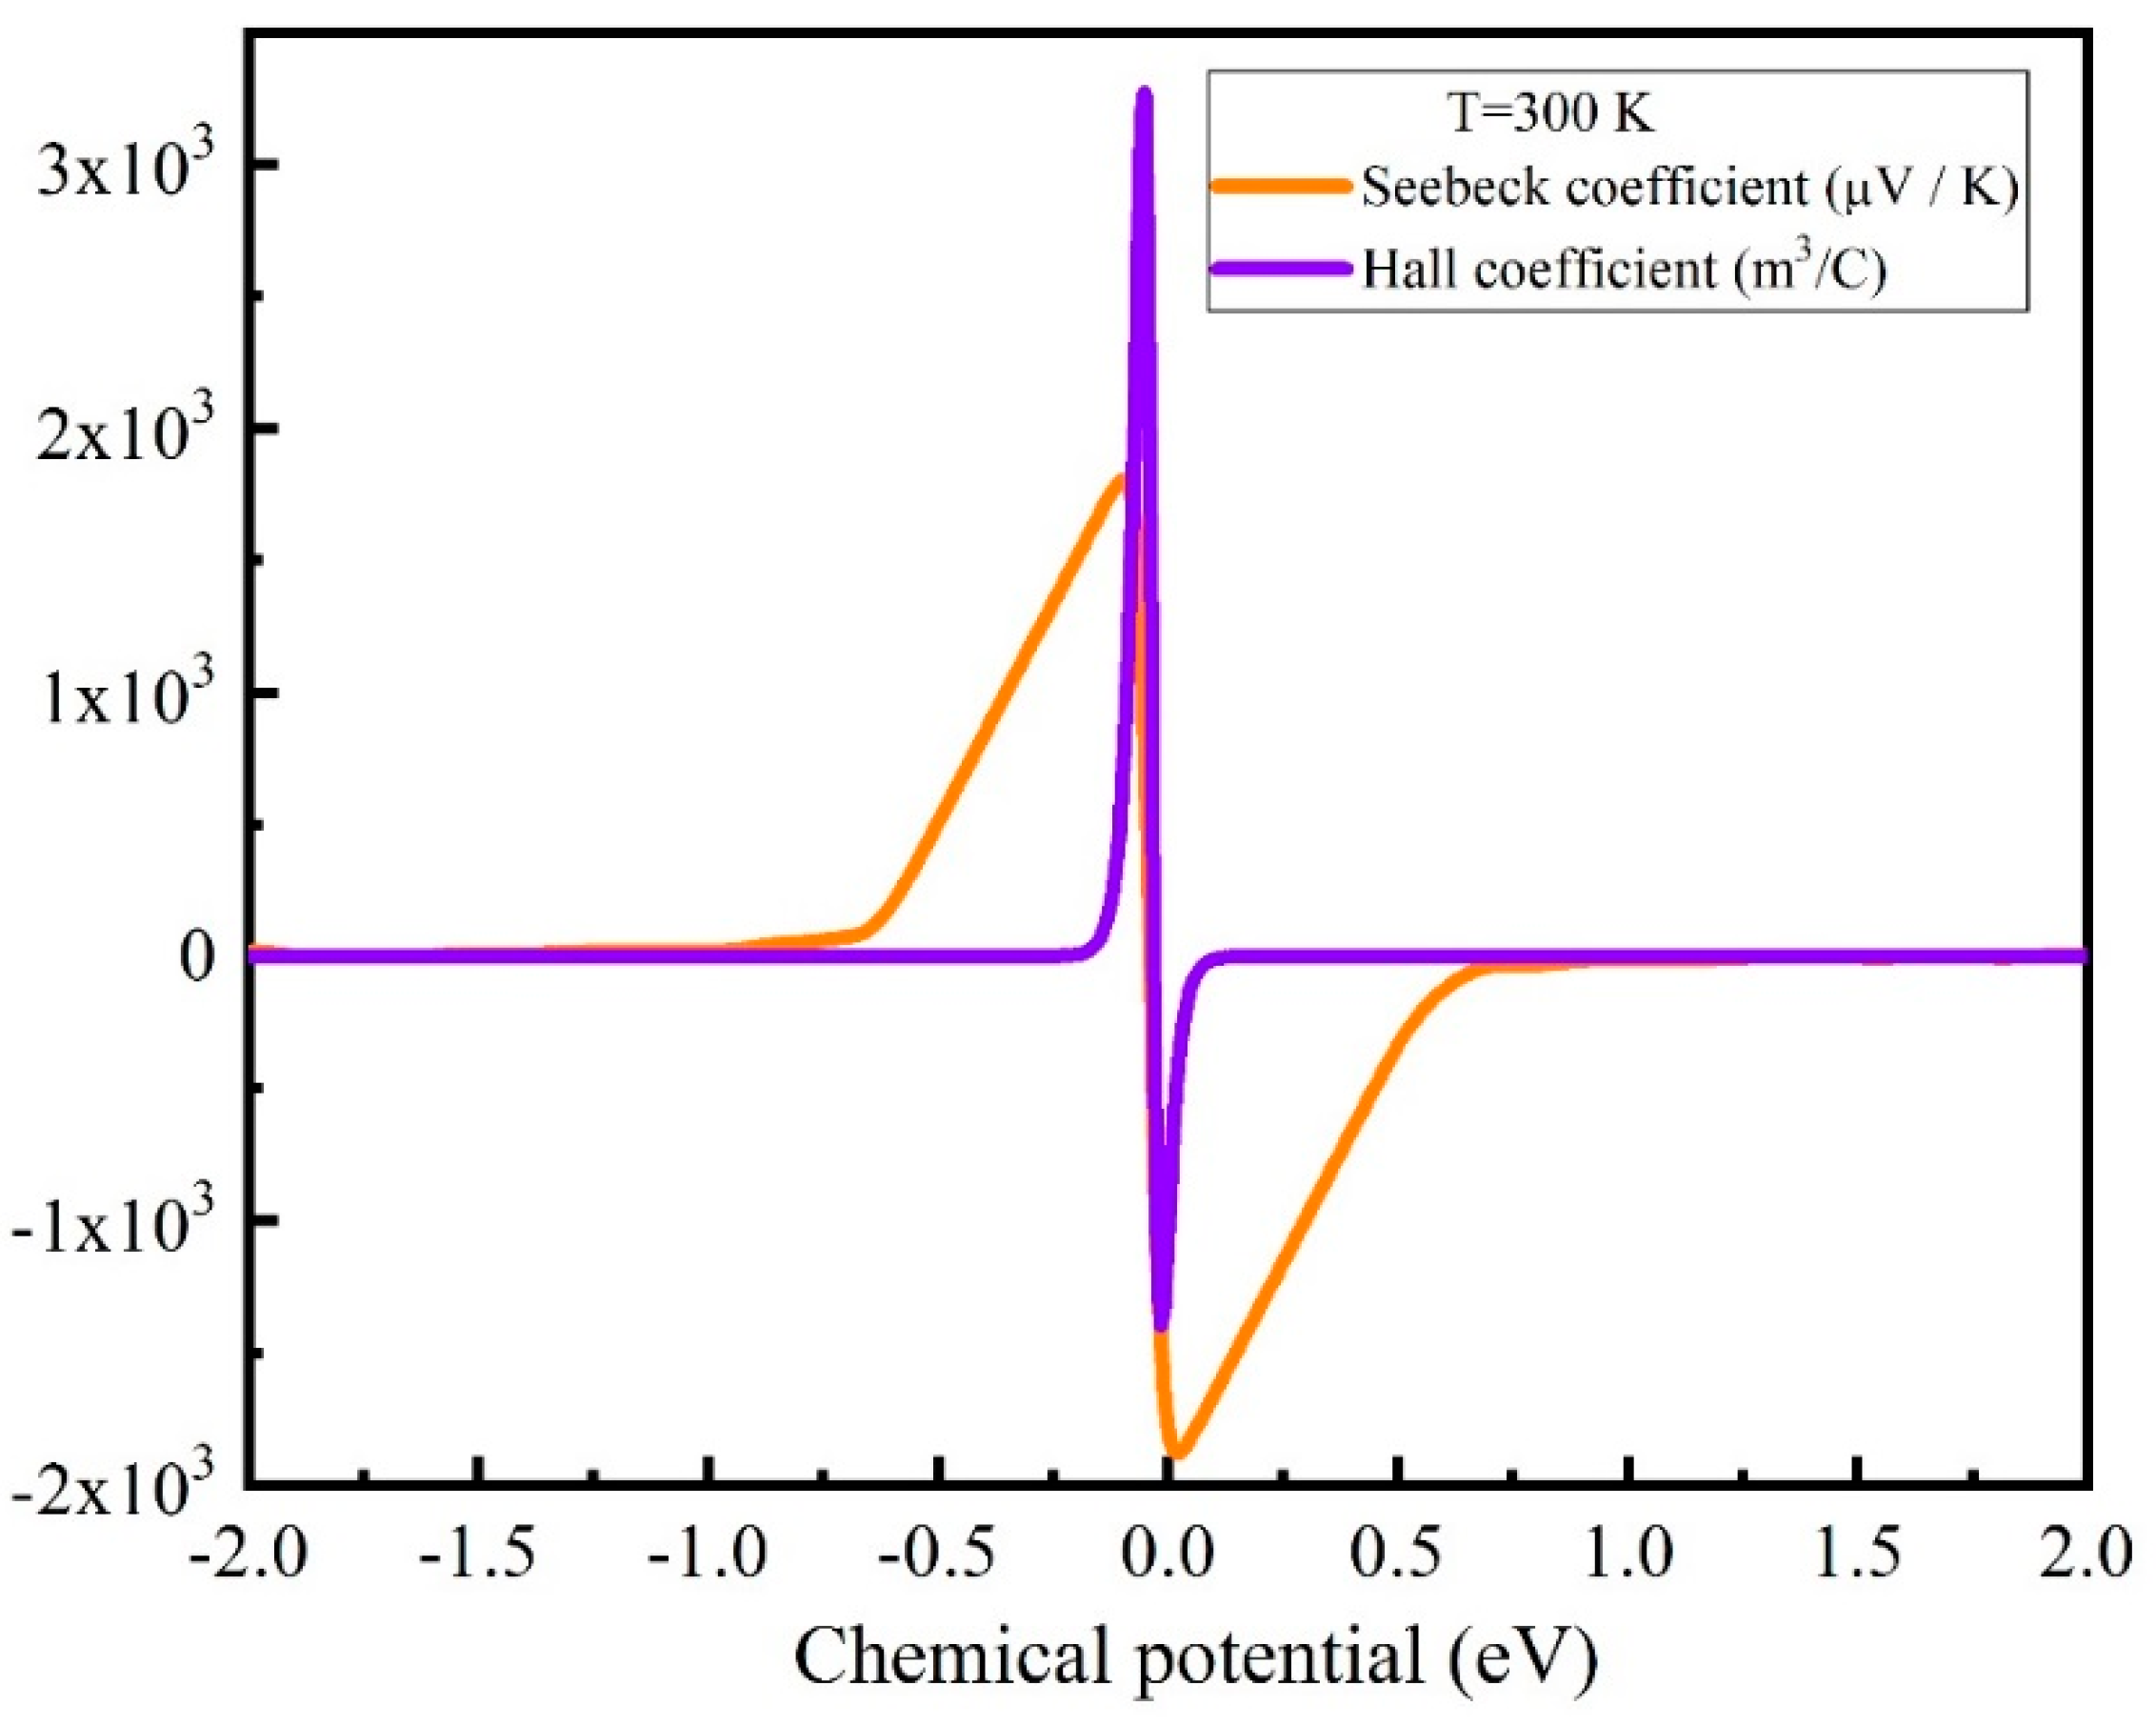
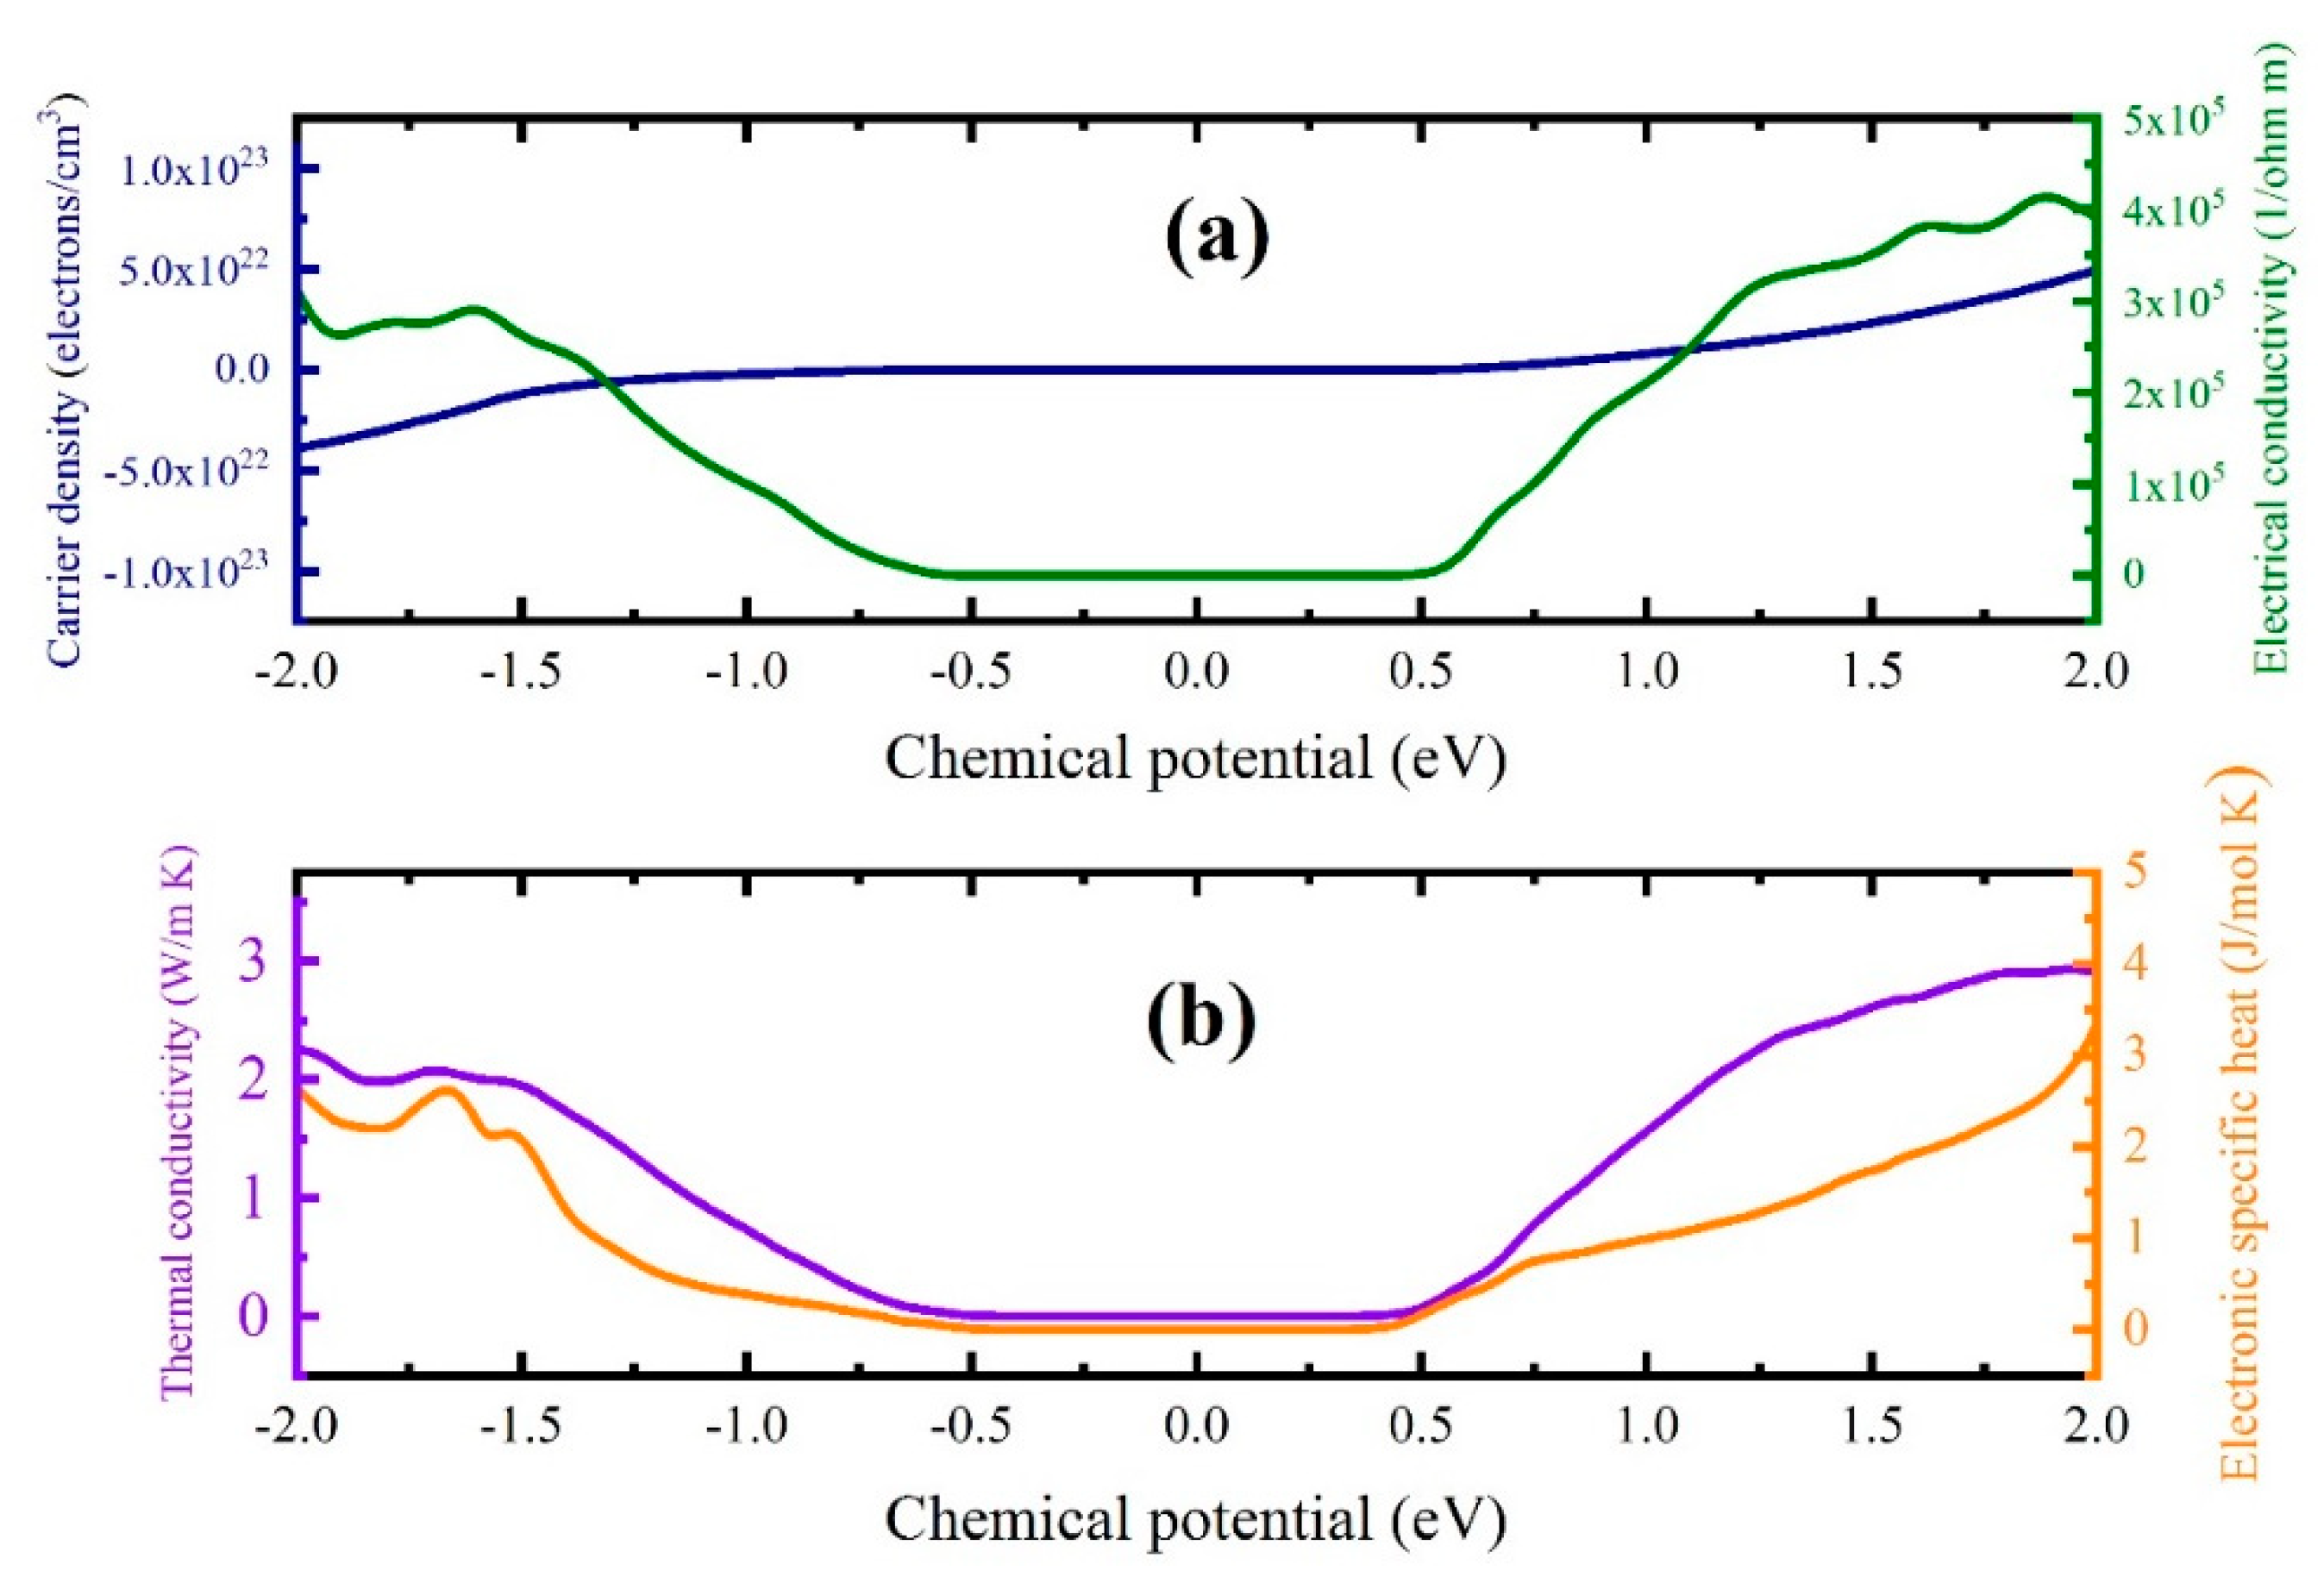
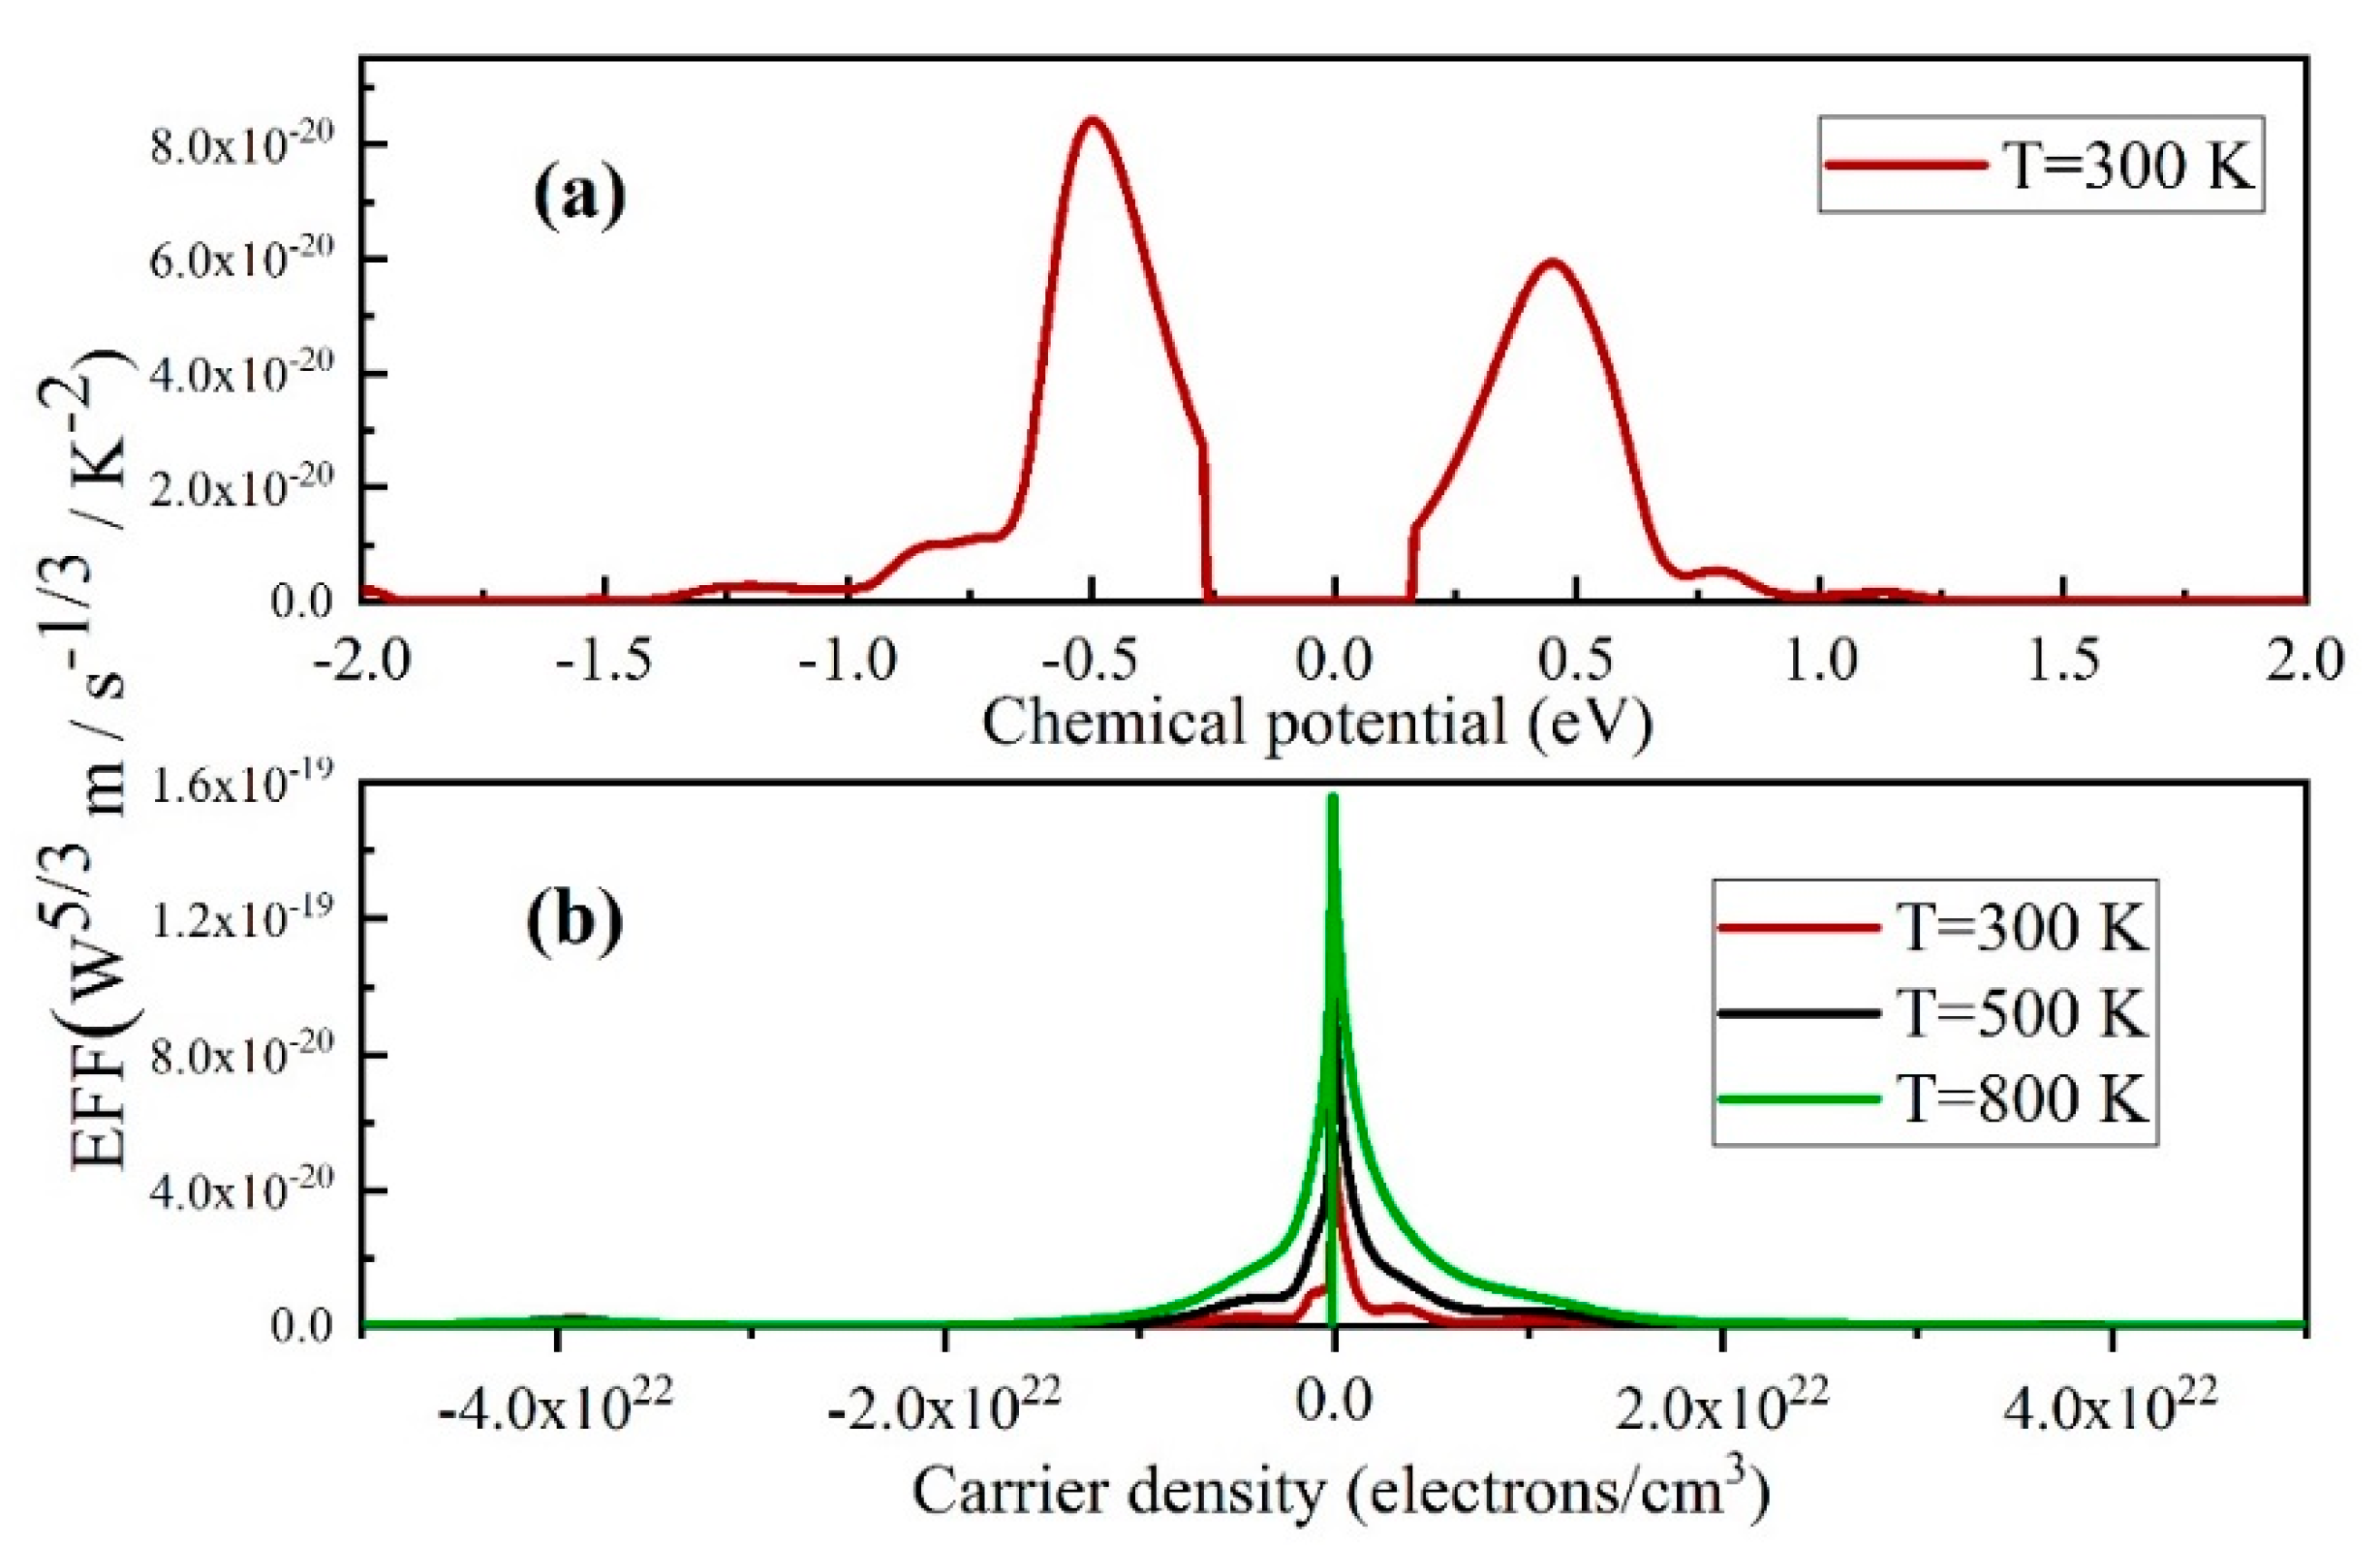
3.3. Boltzmann Transport Calculations and Thermoelectric Properties

The ratio for electric field to temperature gradient in a conducting material is measured by the Seebeck coefficient. As the temperature rises, the material’s carrier density is maintained by the electron carrier concentration, making it the minority carrier. The hole carrier concentrations, on the other hand, produced a temperature-dependent Seebeck coefficient that responded positively to a rise in temperature. As long as electrons are the minority carriers, this result indicates that the material will be a p-type thermoelectric material. We should remark, nevertheless, that for reasonable doping levels, the chemical potentials are well below these crucial levels, necessitating the use of Seebeck coefficients with much smaller values.
The chemical potential shifts up toward the conduction band in the case of n-type doping and down toward the valence band in the case of p-type doping. The Seebeck coefficient is independent of σ in the constant relaxation time approximation; therefore, the temperature dependence of this coefficient should not affect the S-dependency on temperature. As a result, the intrinsic velocities and density of the states close to the band gap, as well as the carrier population, are what cause S to be temperature-dependent [54]. The p-type doping corresponds to the positive Seebeck, and the n-type doping relates to the negative Seebeck.
In Figure 6, we displayed the Seebeck coefficient and the Hall coefficient versus the chemical potential, μ. The Seebeck coefficient likewise shows two peaks, one for the n-type and one for the p-type. The peaks are substantially closer to the VBM and CBM than in the conductivity case, and should be reachable at moderate doping concentrations. At 300 K, the peak value’s magnitude is greater in the n-type region. While |S| increases with decreasing T for chemical potential values closer to the gap (smaller doping concentrations), it increases with T for chemical potential values farther from the gap (higher doping concentrations). This is due to the chemical potential being fixed, which, when T changes, causes changes in doping concentration. These highest values of |S|—1406 μV/K for the p-type and 3292 μV/K for the n-type—are both quite high. The Hall coefficient is showing the same behavior as the Seebeck coefficient, with more intensity in the negative zone (n-type) with no apparent shift in Fermi level.
The Hall coefficient is given in the low-field limit by the Boltzmann approximation for the selected experimental geometry [55]
R H = i σ x y z ( i ) ( i σ x x ( i ) ) 2
where the conductivity tensor elements
σ xx ( i ) = e 2 1 Ω k τ ( i ) v x 2 ( i , k ) ( f E ( i , k ) )
The electrical conductivity is displayed in Figure 7a as a function of chemical potential as well as the carrier density. At all temperatures, the conductivity rises as the concentration of holes in the air does. The electrical conductivity increased rapidly when the carrier concentration rose slightly above 4.85 × 1022 cm−3, according to the data. The conductivity attained its peak at 4.15 × 1022 cm−3 for 300 K of temperature. The hole carrier concentrations have higher conductivity than electron carrier concentrations for this material. The valence band’s top point is selected to be the energy zero. Figure 7a shows that for SnTiO3, the chemical potential values at which the electrical conductivity reaches its maximum value in the p- and n-type regions are ±2.0 eV.
According to the temperature difference and mass, a material’s thermal conductivity explains its capability to conduct heat, and its specific heat capacity indicates how much heat energy is received or released [50]. Two components (k = ke + kl) make up thermal conductivity: ke, the electronic component (heat is transported by electrons and holes), and kl, the phonon component (phonon traveling through the lattice). At a temperature of 300 K, we compute ke as a function of using the same constant relaxation time approximation as before. The result is shown in Figure 7b. The chemical potential ranges between −0.75 and +0.5 eV, which are present in the regions where the examined materials can perform at their highest efficiency, show minimum values of ke. We discover that SnTiO3 exhibits the highest, which is around 3.85 × 10²² (Ωm)−1 at −2.0 eV for p-type. σ, however, reaches its maximum in the n-type area at 2.0 eV, or 7.58 × 10²² (Ωm)−1. A similar trend is shown for the thermal conductivity, where the p-type zone’s conductivity at −2 eV is 2.27 W/mK and the n-type zone’s is 2.90 W/mK. With some reduction, the electronic specific heat exhibits the same characteristic. Let us now discuss heat conductivity. Materials with limited thermal conductivity are used to create effective and reliable thermoelectrics [56].
The transport function EFF, often known as t, indicates how much a complicated band structure decouples σ and S. Finding and screening materials that defeat σ and S’s reciprocal behavior in order to obtain good thermoelectric behavior is suggested. We estimated the EFF, or the recently introduced t-function, in order to compare the performance of the current selenide with the promising TE materials [57].
The EFF vs. chemical potential at room temperature and carrier density for three different temperatures—300, 500, and 800 K—are displayed in Figure 8a,b. Between the p-type and n-type, the EFF versus chemical potential exhibits an asymmetric tendency.
The value is about 8.5 × 10⁻²⁰ (W5/3 m/s−1/3/K−2) at −0.5 eV, and at +0.5 eV, the EFF reaches its maximum value of 6.0 × 10⁻²⁰ (W5/3 m/s−1/3/K−2). Given the large S in low σ, low power factor typically equates to low doping, where the lattice thermal conductivity dominates and causes low performance, and finding a high Seebeck yet with reasonable doping is crucial. On the other hand, small S, which is undesirable even with high σ, can be found at high doping levels. There must be equilibrium.
The thermoelectric efficiency has been calculated from the figure of merit (ZT). At temperatures of 100 K to 1200 K, the figure of merit increases from 0 to 0.34, which is reasonably significant for thermoelectric materials. It is also informative to examine the utility of the electronic fitness function in relation to the Seebeck coefficient. Our material is showing higher value in the n and p regions, although good bulk TE materials typically have S~200–300 μV/K.
In reality, the electronic contribution of thermal conductivity can be expressed as κ e = LσT based on the Wiedemann–Franz connection. The common Lorenz number is L = 2.45 × 10⁻⁸ WΩK−2. Then, ZT can be rewritten as ZT = rS2/L, where r = κ e / ( κ e + κ l ) and κ e and κ l are the electronic and lattice thermal conductivity, respectively. S needs to be greater than 156 μV/K to attain ZT = 1, which is the case for the present material, even if the extreme case with r = 1 is assumed, which entails κ l = 0 . For chemical potential dependence, EFF shows two peaks in Figure 8a at the n and p regions at ±0.5 eV, which correspond to the values where the thermal conductivity is zero (Figure 7b).
To ascertain the decoupling between conductivity and the Seebeck coefficient, the concentrations of electrons (left) and holes (right) depending on EFF have been determined (Figure 8b). Different temperatures (300, 500, and 800 K) were used to determine the EFF, and the results indicate that the EFF rises as the temperature rises. SnTiO3 exhibits a strong decoupling of electrical conductivity and the Seebeck coefficient at concentrations closer to 0 cm−1 (for both electrons and holes) [58,59]. This suggests that doping could be used to improve the material’s thermoelectric performance [60,61].

4. Conclusions

To learn more about the band-gap nature and associated optical and thermoelectric properties of SnTiO3, a Pb-free and Sn-based perovskite, we looked into it, based on the hybrid functional and density functional theories. According to band gaps calculated from HSE06 calculations, the energy gap for SnTiO3 is approximately 2.02 eV. The partial and total density-of-state data clearly show that SnTiO3 is a semiconductor since VBM and CBM are not spectrally overlapping, illustrating the contribution of different components (Sn, Ti, and O) of the crystalline structure. The current chalcogenides could be employed as transparent conducting materials, according to the estimated optical properties, especially the absorption/reflectivity spectra. The optical spectrum has helped to understand the range of applications by exploring the absorption, transmission and reflection coefficients versus energy. In the visible spectrum (2–2.75 eV), SnTiO3 is showing a growing absorption and less transmission.
We might be able to decrease their band gaps in the future for solar applications by taking flaws and appropriate doping into account. Furthermore, utilizing a DFT technique along with the Boltzmann theory, we looked at the thermoelectric characteristics of SnTiO3. The material’s Seebeck coefficient rises with temperature for every hole carrier concentration while showing temperature independence for electron carrier concentrations. Its conductivity drops steadily for the electrons and then increases as the carrier concentration rises; however, an unceasing increase for holes was seen as the carrier concentration rose at all temperatures.
The high EFF value indicates that SnTiO3 is a desirable thermoelectric material since it responds favorably to temperature rise and can have its performance improved in both n- and p-types through doping. The dopant that needs to be added will either make it more conductive or have a higher Seebeck coefficient. By substituting a portion of the composition of Sn or Ti in SnTiO3, one can inject an optimal hole into this semiconductor. At room temperature, the obtained ZT value is 0.34, and it rises as the temperature does. SnTiO3 will therefore work well in low- and medium-temperature thermoelectric applications.

Funding

S. Goumri-Said thanks the office of research at Alfaisal University in Saudi Arabia for supporting this research work through internal project (IRG) number 22413.

Data Availability Statement

Data sharing is not applicable to this article.

Conflicts of Interest

The author declares no conflict of interest.

References

  1. Im, J.-H.; Lee, C.-R.; Lee, J.-W.; Park, S.-W.; Park, N.-G. 6.5% efficient perovskite quantum-dot-sensitized solar cell. Nanoscale 2011, 3, 4088–4093. [Google Scholar] [CrossRef] [PubMed]
  2. Moon, S.-J.; Itzhaik, Y.; Yum, J.-H.; Zakeeruddin, S.M.; Hodes, G.; Grätzel, M.J. Sb2S3-Based Mesoscopic Solar Cell using an Organic Hole Conductor. Phys. Chem. Lett. 2010, 1, 1524–1527. [Google Scholar] [CrossRef]
  3. Kanoun, M.B.; Goumri-Said, S. Insights into the impact of Mn-doped inorganic CsPbBr3 perovskite on electronic structures and magnetism for photovoltaic application. Mater. Today Energy 2021, 21, 100796, ISSN 2468-6069. [Google Scholar] [CrossRef]
  4. Ali, N.; Shehzad, N.; Uddin, S.; Ahmed, R.; Jabeen, M.; Kalam, A.; Al-Sehemi, A.G.; Alrobei, H.; Kanoun, M.B.; Khesro, A.; et al. A review on perovskite materials with solar cell prospective. Int. J. Energy Res. 2021, 45, 19729–19745. [Google Scholar] [CrossRef]
  5. Fadla, M.A.; Bentria, B.; Benghia, A.; Dahame, T.; Goumri-Said, S. Insights on the opto-electronic structure of the inorganic mixed halide perovskites γ-CsPb(I1−xBrx)3 with low symmetry black phase. J. Alloys Compd. 2020, 832, 154847, ISSN 0925-8388. [Google Scholar] [CrossRef]
  6. Akkerman, Q.A.; Gandini, M.; di Stasio, F.; Rastogi, P.; Palazon, F.; Bertoni, G.; Ball, J.M.; Prato, M.; Petrozza, A.; Manna, L. Strongly emissive perovskite nanocrystal inks for high-voltage solar cells. Nat. Energy 2016, 2, 16194. [Google Scholar] [CrossRef]
  7. Eperon, G.E.; Paternò, G.M.; Sutton, R.J.; Zampetti, A.; Haghighirad, A.A.; Cacialli, F.; Snaith, H.J. Inorganic caesium lead iodide perovskite solar cells. J. Mater. Chem. A 2015, 3, 19688–19695. [Google Scholar] [CrossRef]
  8. Zhang, P.; Ochi, T.; Fujitsuka, M.; Kobori, Y.; Majima, T.; Tachikawa, T. Topotactic Epitaxy of SrTiO3 Mesocrystal Superstructures with Anisotropic Construction for Efficient Overall Water Splitting. Angew. Chem. Int. Ed. 2017, 56, 5299–5303. [Google Scholar] [CrossRef]
  9. Dynys, F.W.; Berger, M.-H.; Sehirlioglu, A. Thermoelectric Properties of Undoped and Doped (Ti0.75Sn0.25)O2. J. Am. Ceram. Soc. 2012, 95, 619–626. [Google Scholar] [CrossRef]
  10. Moore, L.A.; Smith, C.M. Reduced Strontium Titanate Thermoelectric Materials. In Ceramics for Environmental and Energy Applications II; John Wiley & Sons, Inc.: Hoboken, NJ, USA, 2014; pp. 43–55. [Google Scholar]
  11. Xie, F.; Zhang, L.; Su, D.; Jaroniec, M.; Qiao, S.-Z. Na2Ti3O7@N-Doped Carbon Hollow Spheres for Sodium-Ion Batteries with Excellent Rate Performance. Adv. Mater. 2017, 29, 1700989. [Google Scholar] [CrossRef]
  12. Dos santos-Garcia, A.J.; Solana-Madruga, E.; Ritter, C.; Avila-Brande, D.; Fabelo, O.; Saez-Puche, R. Synthesis, structures and magnetic properties of the dimorphic Mn2CrSbO6 oxide. Dalton Trans. 2015, 44, 10665–10672. [Google Scholar] [CrossRef] [PubMed]
  13. Wahila, M.J.; Butler, K.T.; Lebens-Higgins, Z.W.; Hendon, C.H.; Nandur, A.S.; Treharne, R.E.; Quackenbush, N.F.; Sallis, S.; Mason, K.; Paik, H.; et al. Lone-Pair Stabilization in Transparent Amorphous Tin Oxides: A Potential Route to p-Type Conduction Pathways. Chem. Mater. 2016, 28, 4706–4713. [Google Scholar] [CrossRef]
  14. Walsh, A.; Payne, D.J.; Egdell, R.G.; Watson, G.W. Stereochemistry of post-transition metal oxides: Revision of the classical lone pair model. Chem. Soc. Rev. 2011, 40, 4455–4463. [Google Scholar] [CrossRef]
  15. Lotsch, B.V. Ein Klassiker im neuen Gewand: Perowskit-Solarzellen. Angew. Chem. 2014, 126, 647–649. [Google Scholar] [CrossRef]
  16. Lermer, C.; Birkhold, S.T.; Moudrakovski, I.L.; Mayer, P.; Schoop, L.M.; Schmidt-Mende, L.; Lotsch, B.V. Toward Fluorinated Spacers for MAPI-Derived Hybrid Perovskites: Synthesis, Characterization, and Phase Transitions of (FC2H4NH3)2PbCl4. Chem. Mater. 2016, 28, 6560–6566. [Google Scholar] [CrossRef]
  17. de Lazaro, S.; Longo, E.; Sambrano, J.R.; Beltrán, A. Structural and electronic properties of PbTiO3 slabs: A DFT periodic study. Surf. Sci. 2004, 552, 149–159. [Google Scholar] [CrossRef]
  18. Konishi, Y.; Ohsawa, M.; Yonezawa, Y.; Tanimura, Y.; Chikyow, T.; Wakisaka, T.; Koinuma, H.; Miyamoto, A.; Kubo, M.; Sasata, K. Possible Ferroelectricity in SnTiO3 by First-Principles Calculations. MRS Online Proceedings Library (OPL). 2002, Volume 748. Available online: https://www.cambridge.org/core/journals/mrs-online-proceedings-library-archive/article/abs/possible-ferroelectricity-in-sntio3-by-firstprinciples-calculations/DFE24DBF7BF2418A257BBB98519599A7 (accessed on 10 June 2022).
  19. Piskunov, S.; Heifets, E.; Eglitis, R.I.; Borstel, G. Bulk properties and electronic structure of SrTiO3, BaTiO3, PbTiO3 perovskites: An ab initio HF/DFT study. Comput. Mater. Sci. 2004, 29, 165–178. [Google Scholar] [CrossRef]
  20. Jain, A.; Ong, S.; Hautier, G.; Chen, W.; Richards, W.; Dacek, S.; Cholia, S.; Gunter, D.; Skinner, D.; Ceder, G.; et al. Commentary: The Materials Project: A materials genome approach to accelerating materials innovation. APL Mater. 2013, 1, 011002. [Google Scholar] [CrossRef]
  21. Woods-Robinson, R.; Han, Y.; Zhang, H.; Ablekim, T.; Khan, I.; Persson, K.; Zakutayev, A. Wide Band Gap Chalcogenide Semiconductors. Chem. Rev. 2020, 120, 4007–4055. [Google Scholar] [CrossRef]
  22. Zhou, J.; Sumpter, B.; Kent, P.; Huang, J. A Novel and Functional Single-Layer Sheet of ZnSe. ACS Appl. Mater. Interfaces 2015, 7, 1458–1464. [Google Scholar] [CrossRef]
  23. Li, W.; Walther, C.; Kuc, A.; Heine, T. Density Functional Theory and Beyond for Band-Gap Screening: Performance for Transition-Metal Oxides and Dichalcogenides. J. Chem. Theory Comput. 2013, 9, 2950–2958. [Google Scholar] [CrossRef] [PubMed]
  24. Zhang, Y.; Xi, L.; Wang, Y.; Zhang, J.; Zhang, P.; Zhang, W. Electronic properties of energy harvesting Cu-chalcogenides: P–d hybridization and d-electron localization. Comput. Mater. Sci. 2015, 108, 239–249. [Google Scholar] [CrossRef]
  25. Brandbyge, M.; Mozos, J.L.; Ordejon, P.; Taylor, J.; Stokbro, K. Density-functional method for nonequilibrium electron transport. Phys. Rev. B 2002, 65, 165401. [Google Scholar] [CrossRef]
  26. Soler, J.M.; Artacho, E.; Gale, J.D.; García, A.; Junquera, J.; Ordejón, P.; Sánchez-Portal, D. The SIESTA method for ab initio order-N materials simulation. J. Phys. Condens. Matter 2002, 14, 2745. [Google Scholar] [CrossRef]
  27. Becke, A.D. A new mixing of hartree–fock and local density-functional theories. J. Chem. Phys. 1993, 98, 1372–1377. [Google Scholar] [CrossRef]
  28. Heyd, J.; Scuseria, G.E.; Ernzerhof, M. Hybrid functionals based on a screened coulomb potential. J. Chem. Phys. 2003, 118, 8207–8215. [Google Scholar] [CrossRef]
  29. Heyd, J.; Scuseria, G.E.; Ernzerhof, M. Erratum: “Hybrid functionals based on a screened Coulomb potential” [J. Chem. Phys. 118, 8207 (2003). J. Chem. Phys. 2006, 124, 219906. [Google Scholar] [CrossRef]
  30. Liu, D.C.; Nocedal, J. On the limited memory BFGS method for large scale optimization. Math. Program. 1989, 45, 503–528. [Google Scholar] [CrossRef]
  31. Raghupathy, R.K.M.; Wiebeler, H.; Kuhne, T.D.; Felser, C.; Mirhosseini, H. Database Screening of Ternary Chalcogenides for P-type Transparent Conductors. Chem. Mater. 2018, 30, 6794–6800. [Google Scholar] [CrossRef]
  32. Gonze, X.; Lee, C. Dynamical matrices, born effective charges, dielectric permittivity tensors, and interatomic force constants from density-functional perturbation theory. Phys. Rev. B 1997, 55, 10355. [Google Scholar] [CrossRef]
  33. Scheidemantel, T.J.; Ambrosch-Draxl, C.; Thonhauser, T.; Badding, J.V.; Sofo, J.O. Transport coefficients from first-principles calculations. Phys. Rev. B 2003, 68, 125210. [Google Scholar] [CrossRef]
  34. Park, M.S.; Song, J.-H.; Medvedeva, J.E.; Kim, M.; Kim, I.G.; Freeman, A.J. Electronic structure and volume effect on thermoelectric transport in p-type Bi and Sb tellurides. Phys. Rev. B 2010, 81, 155211. [Google Scholar] [CrossRef]
  35. Madsen, G.K.H.; Singh, D.J. BoltzTraP. A code for calculating band-structure dependent quantities. Comput. Phys. Commun. 2006, 175, 67–71. [Google Scholar] [CrossRef]
  36. Yang, J.; Li, H.; Wu, T.; Zhang, W.; Chen, L.; Yang, J. Evaluation of Half-Heusler Compounds as Thermoelectric Materials Based on the Calculated Electrical Transport Properties. Adv. Funct. Mater. 2008, 18, 2880–2888. [Google Scholar] [CrossRef]
  37. Fei, R.; Faghaninia, A.; Soklaski, R.; Yan, J.-A.; Lo, C.; Yang, L. Enhanced Thermoelectric Efficiency via Orthogonal Electrical and Thermal Conductances in Phosphorene. Nano Lett. 2014, 14, 6393–6399. [Google Scholar] [CrossRef] [PubMed]
  38. Bjerg, L.; Madsen, G.K.H.; Iversen, B.B. Ab initio Calculations of Intrinsic Point Defects in ZnSb. Chem. Mater. 2011, 23, 3907. [Google Scholar] [CrossRef]
  39. Sun, J.; Singh, D.J. Thermoelectric properties of n-type SrTiO3. APL Mater. 2016, 4, 104803. [Google Scholar] [CrossRef]
  40. Madsen, G.K.H. Automated Search for New Thermoelectric Materials: The Case of LiZnSb. J. Am. Chem. Soc. 2006, 128, 12140–12146. [Google Scholar] [CrossRef]
  41. Pulikkotil, J.J.; Singh, D.J.; Auluck, S.; Saravanan, M.; Misra, D.K.; Dhar, A.; Budhani, R.C. Doping and temperature dependence of thermoelectric properties in Mg2(Si,Sn). Phys. Rev. B 2012, 86, 155204. [Google Scholar] [CrossRef]
  42. Bhattacharya, S.; Madsen, G.K.H. A novel p-type half-Heusler from high-throughput transport and defect calculations. J. Mater. Chem. C 2016, 4, 11261–11268. [Google Scholar] [CrossRef]
  43. Chen, W.; Pöhls, J.-H.; Hautier, G.; Broberg, D.; Bajaj, S.; Aydemir, U.; Gibbs, Z.M.; Zhu, H.; Asta, M.; Snyder, G.J.; et al. Understanding thermoelectric properties from high-throughput calculations: Trends, insights, and comparisons with experiment. J. Mater. Chem. C 2016, 4, 4414–4426. [Google Scholar] [CrossRef]
  44. Xing, G.; Sun, J.; Ong, K.P.; Fan, X.; Zheng, W.; Singh, D.J. Perspective: N-type oxide thermoelectrics via visual search strategies. APL Mater. 2016, 4, 053201. [Google Scholar] [CrossRef]
  45. Sun, J.; Singh, D.J. Thermoelectric properties of AMg2X2, AZn2Sb2 (A = Ca, Sr, Ba; X = Sb, Bi), and Ba2ZnX2 (X = Sb, Bi) Zintl compounds. J. Mater. Chem. A 2017, 5, 8499–8509. [Google Scholar] [CrossRef]
  46. Taib, M.F.M.; Yaakob, M.K.; Hassan, O.H.; Yahya, M.Z.A. Structural, Electronic, and Lattice Dynamics of PbTiO3, SnTiO3, and SnZrO3: A Comparative First-Principles Study. Integr. Ferroelectr. 2013, 142, 119–127. [Google Scholar] [CrossRef]
  47. Cardon, F.; Gomes, W.P. On the determination of the flat-band potential of a semiconductor in contact with a metal or an electrolyte from the Mott-Schottky plot. J. Phys. D Appl. Phys. 1978, 11, L63–L67. [Google Scholar] [CrossRef]
  48. Kalyanasundaram, K.; Grätzel, M. Applications of functionalized transition metal complexes in photonic and optoelectronic devices. Coord. Chem. Rev. 1998, 177, 347–414. [Google Scholar] [CrossRef]
  49. Alam, N.N.; Malik, N.A.; Hussin, N.H.; Ali, A.M.M.; Hassan, O.H.; Yahya, M.Z.A.; Taib, M.F.M. First-Principles Study on Electronic Properties, Phase Stability and Strain Properties of Cubic (Pm3m) and Tetragonal (P4mm) ATiO3 (A = Pb, Sn). Int. J. Nanoelectron. Mater. 2020, 13, 281–288. [Google Scholar]
  50. Kittel, C. Introduction to Solid State Physics; Wiley: New York, NY, USA, 1996; ISBN 978-0-471-14286-7. [Google Scholar]
  51. Li, X.; Xia, C.; Wang, M.; Wu, Y.; Chen, D. First-Principles Investigation of Structural, Electronic and Elastic Properties of HfX (X = Os, Ir and Pt) Compounds. Metals 2017, 7, 317. [Google Scholar] [CrossRef]
  52. Karki, B.B.; Wentzcovitch, R.M.; de Gironcoli, S.; Baroni, S. High-pressure lattice dynamics and thermoelasticity of MgO. Phys. Rev. B 2000, 61, 8793. [Google Scholar] [CrossRef]
  53. Amin, B.; Ahmad, I.; Maqbool, M.; Goumri-Said, S.; Ahmad, R. Ab initio study of the bandgap engineering of Al1−xGaxN for optoelectronic applications. J. Appl. Phys. 2011, 109, 023109. [Google Scholar] [CrossRef]
  54. Singh, D.J.; Mazin, I. Calculated thermoelectric properties of La-filled skutterudites. Phys. Rev. B 1997, 56, R1650. [Google Scholar] [CrossRef] [Green Version]
  55. Hurd, C.M. The Hall Effect in Metals and Alloys; Plenum Press: New York, NY, USA, 1972. [Google Scholar]
  56. Onoue, M.; Ishii, F.; Oguchi, T. Electronic and Thermoelectric Properties of the Intermetallic Compounds MNiSn (M = Ti, Zr, and Hf). J. Phys. Soc. Jpn. 2008, 77, 054706. [Google Scholar] [CrossRef]
  57. Xing, G.; Sun, J.; Li, Y.; Fan, X.; Zheng, W.; Singh, D.J. Electronic fitness function for screening semiconductors as thermoelectric materials. Phys. Rev. Mater. 2017, 1, 65405. [Google Scholar] [CrossRef]
  58. Feng, Z.; Fu, Y.; Putatunda, A.; Hang, Y.; Singh, D.J. Electronic structure as a guide in screening for potential thermoelectrics: Demonstration for half-Heusler compounds. Phys. Rev. B 2019, 100, 085202. [Google Scholar] [CrossRef]
  59. Azam, S.; Goumri-Said, S.; Khan, S.A.; Kanoun, M.B. Electronic, optical and thermoelectric properties of new metal-rich homological selenides with palladium–indium: Density functional theory and Boltzmann transport model. J. Phys. Chem. Solids 2020, 138, 109229. [Google Scholar] [CrossRef]
  60. Azam, S.; Khan, S.A.; Goumri-Said, S. Optoelectronic and Thermoelectric Properties of Bi2OX2 (X = S, Se, Te) for Solar Cells and Thermoelectric Devices. J. Electron. Mater. 2018, 47, 2513–2518. [Google Scholar] [CrossRef]
  61. Goumri-Said, S.; Alrebdi, T.A.; Deligoz, E.; Ozisik, H.; Kanoun, M.B. Revisiting the Electronic Structures and Phonon Properties of Thermoelectric Antimonide-Tellurides: Spin–Orbit Coupling Induced Gap Opening in ZrSbTe and HfSbTe. Crystals 2021, 11, 917. [Google Scholar] [CrossRef]
Figure 1. Crystal structure of cubic SnTiO3.
Crystals 12 01317 g001
Figure 2. Electronic band structures of perovskite SnTiO3 as calculated with the GGA and HSE06 approaches.
Crystals 12 01317 g002
Figure 3. Total and partial density of states as obtained with HSE06.
Crystals 12 01317 g003
Figure 4. (a) Dielectric constant, imaginary and real parts. (b) Real and imaginary parts of optical conductivity spectra. (c) Refractive index n and extinction coefficient. All properties were calculated using HSE06.
Crystals 12 01317 g004
Figure 5. Optical spectrum showing the transmission, reflection and absorption spectrum as calculated with HSE06.
Crystals 12 01317 g005
Figure 6. The Seebeck coefficient and the Hall coefficient versus the chemical potential at room temperature.
Crystals 12 01317 g006
Figure 7. (a) Electrical and carrier density as a function of chemical potential. (b) Thermal conductivity due to electrons transporting and electronic specific heat versus chemical potential at 300 K.
Crystals 12 01317 g007
Figure 8. EFF (t) at the constant temperature versus (a) chemical potential. (b) The electrons (left) and holes (right) concentrations.
Crystals 12 01317 g008
Publisher’s Note: MDPI stays neutral with regard to jurisdictional claims in published maps and institutional affiliations.

