
In Vitro Degradation Behavior, Mechanical Properties, and Cytocompatibility of Biodegradable Mg-1Zn-xSn Alloys


Abstract
:1. Introduction
2. Materials and Methods
2.1. Materials Preparation
2.2. Microstructure Characterization
2.3. Mechanical Properties
2.4. Degradation Properties
2.4.1. In Vitro Degradation by Electrochemical Measurements
2.4.2. In Vitro Degradation by Immersion Tests
2.5. Cytocompatibility
2.5.1. Cytotoxicity Assays and Cell Spreading
2.5.2. Cell Attachment
3. Results and Discussion
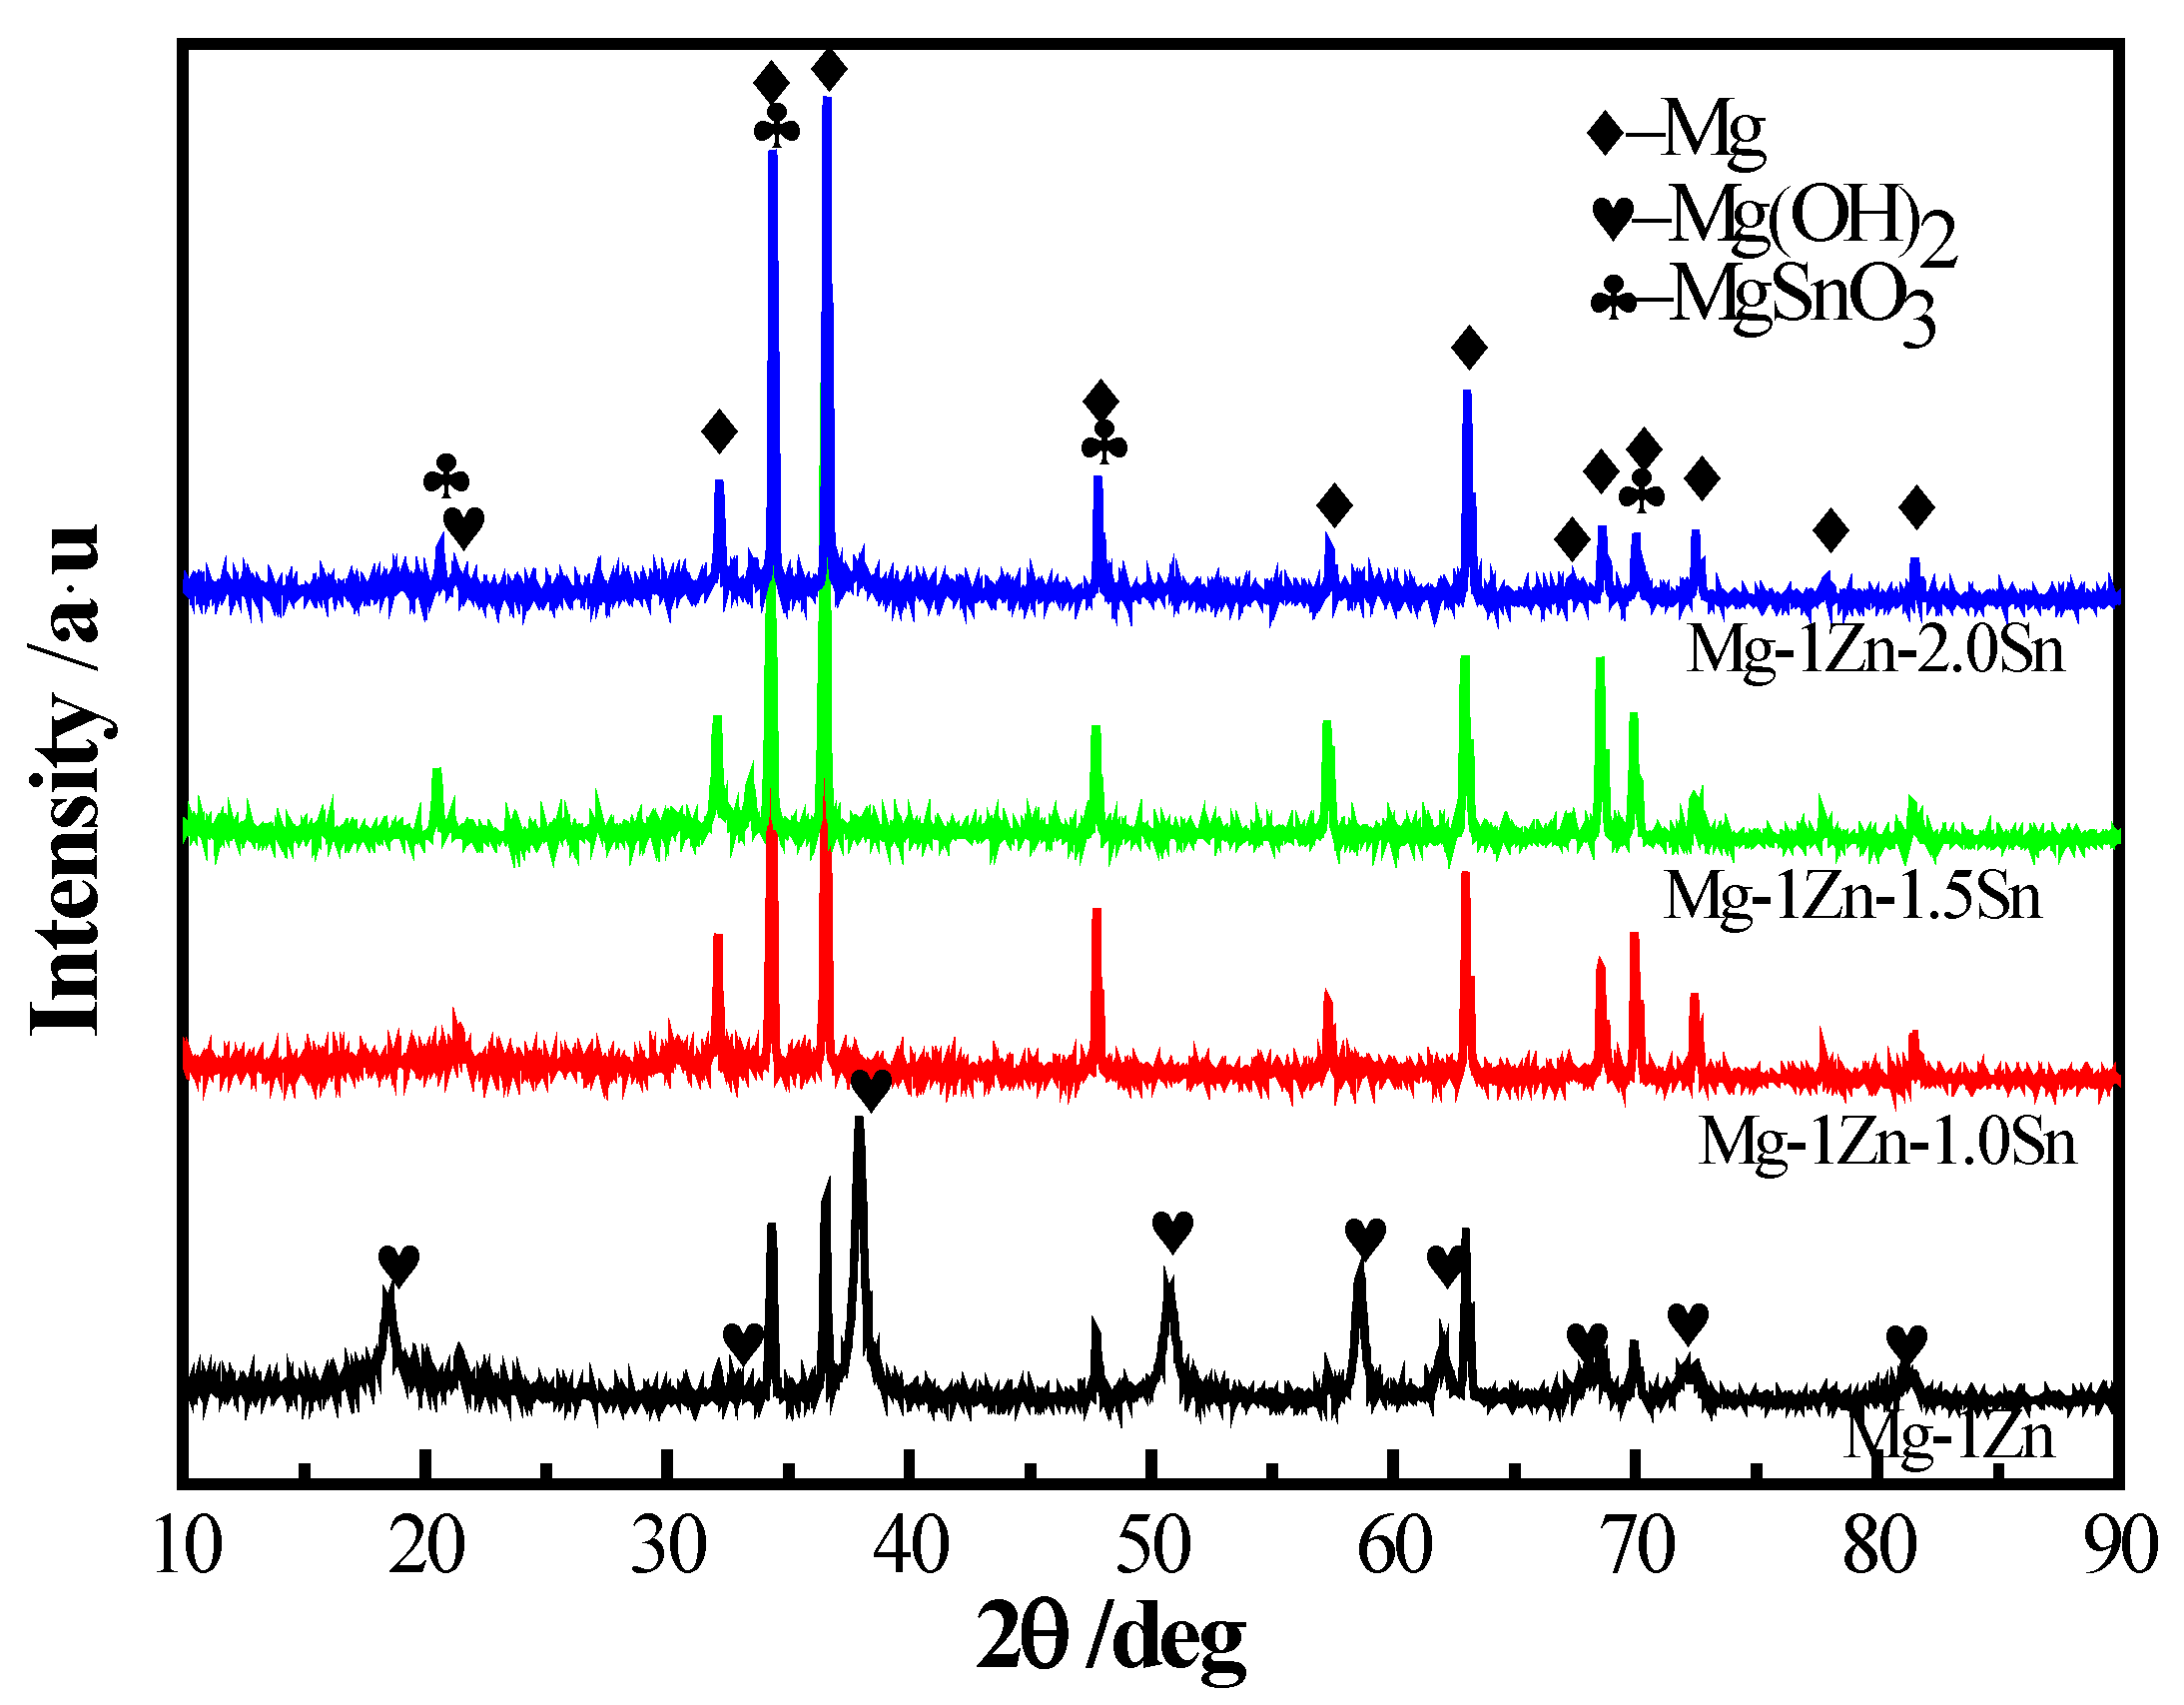
3.1. Microstructure Analysis
3.2. Mechanical Properties
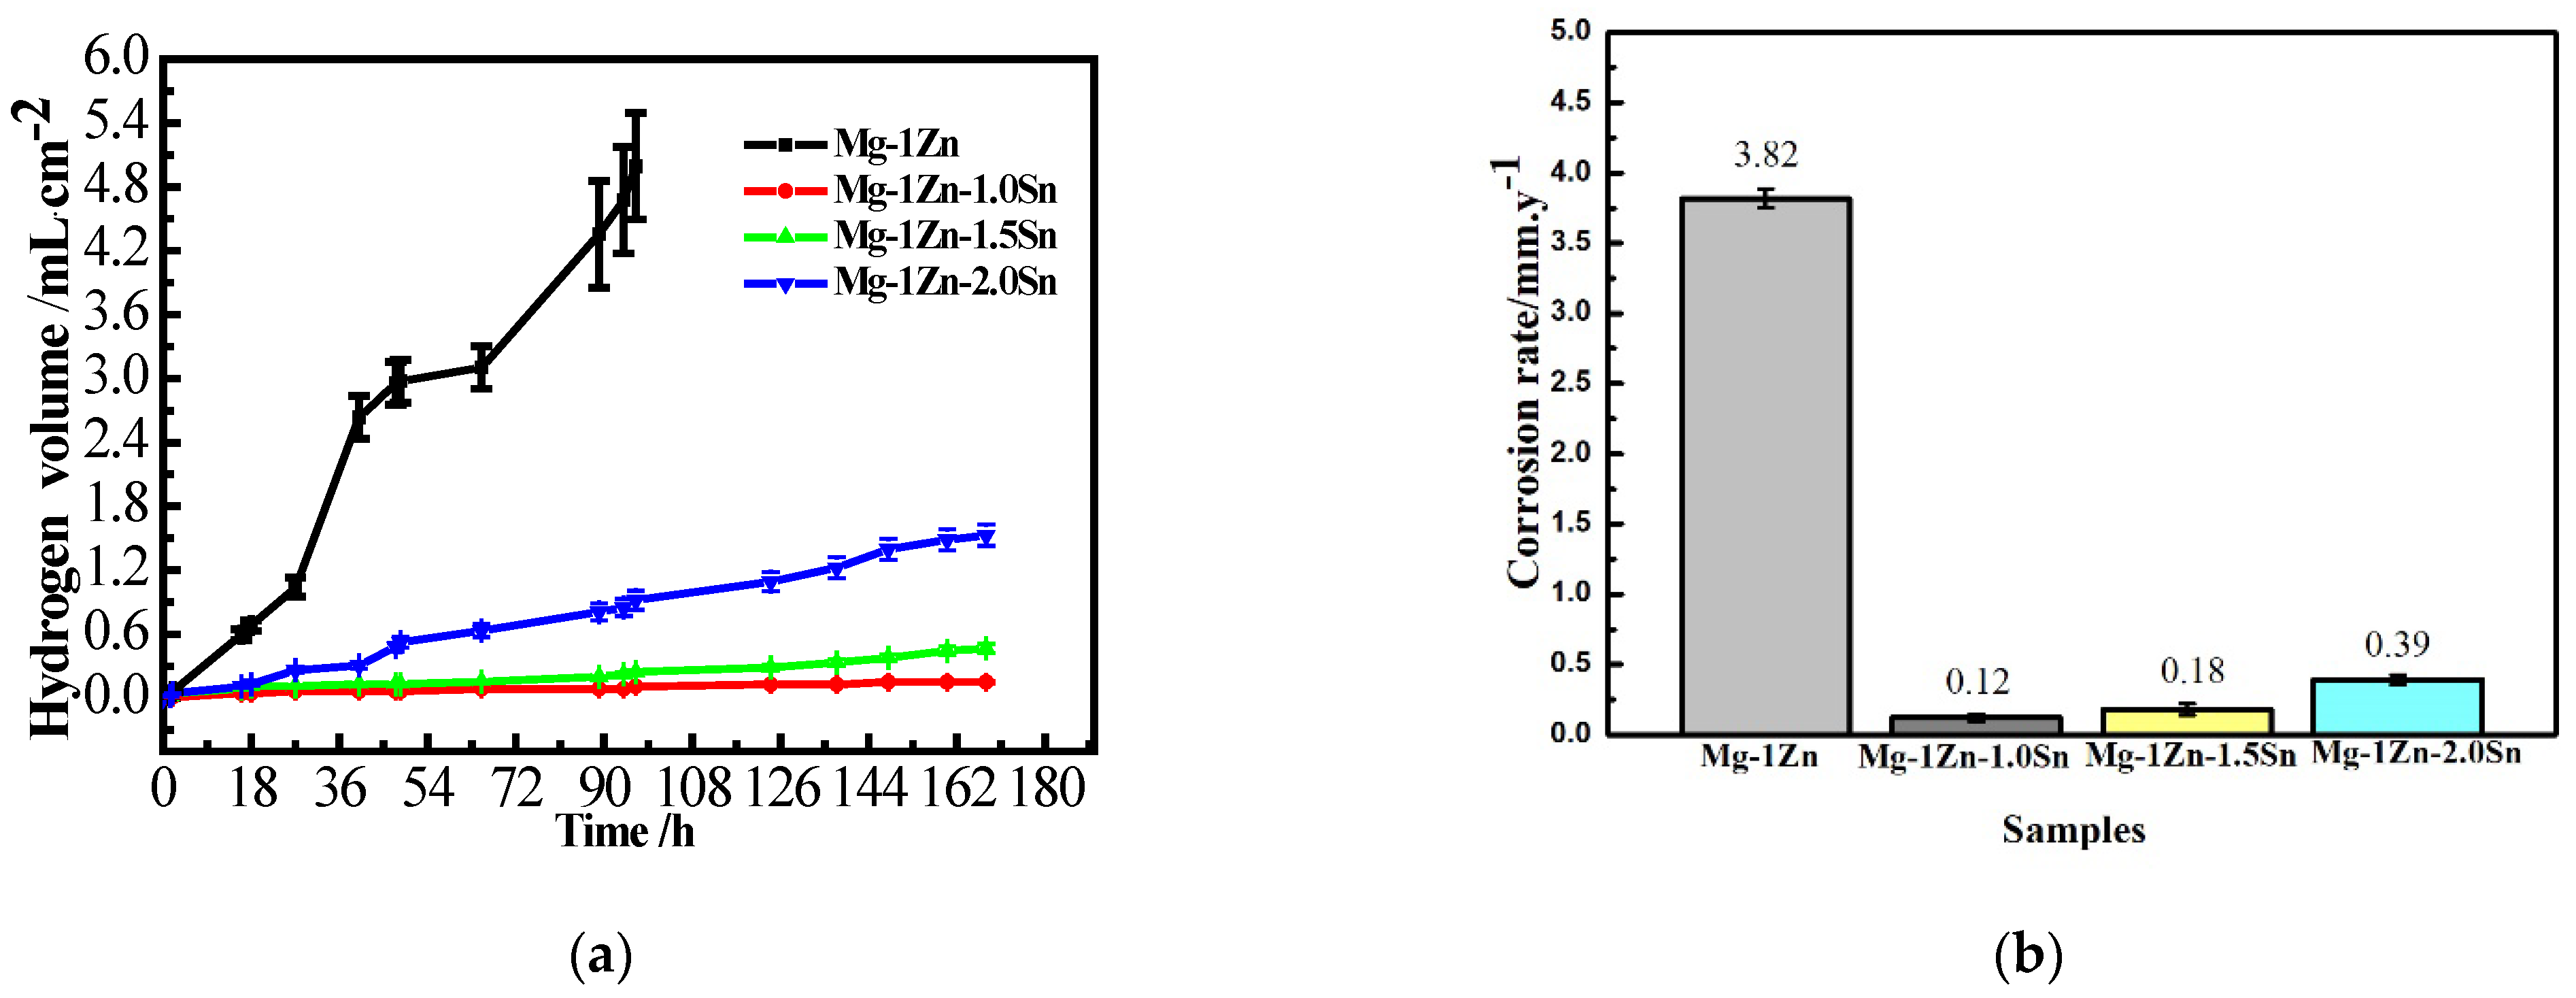
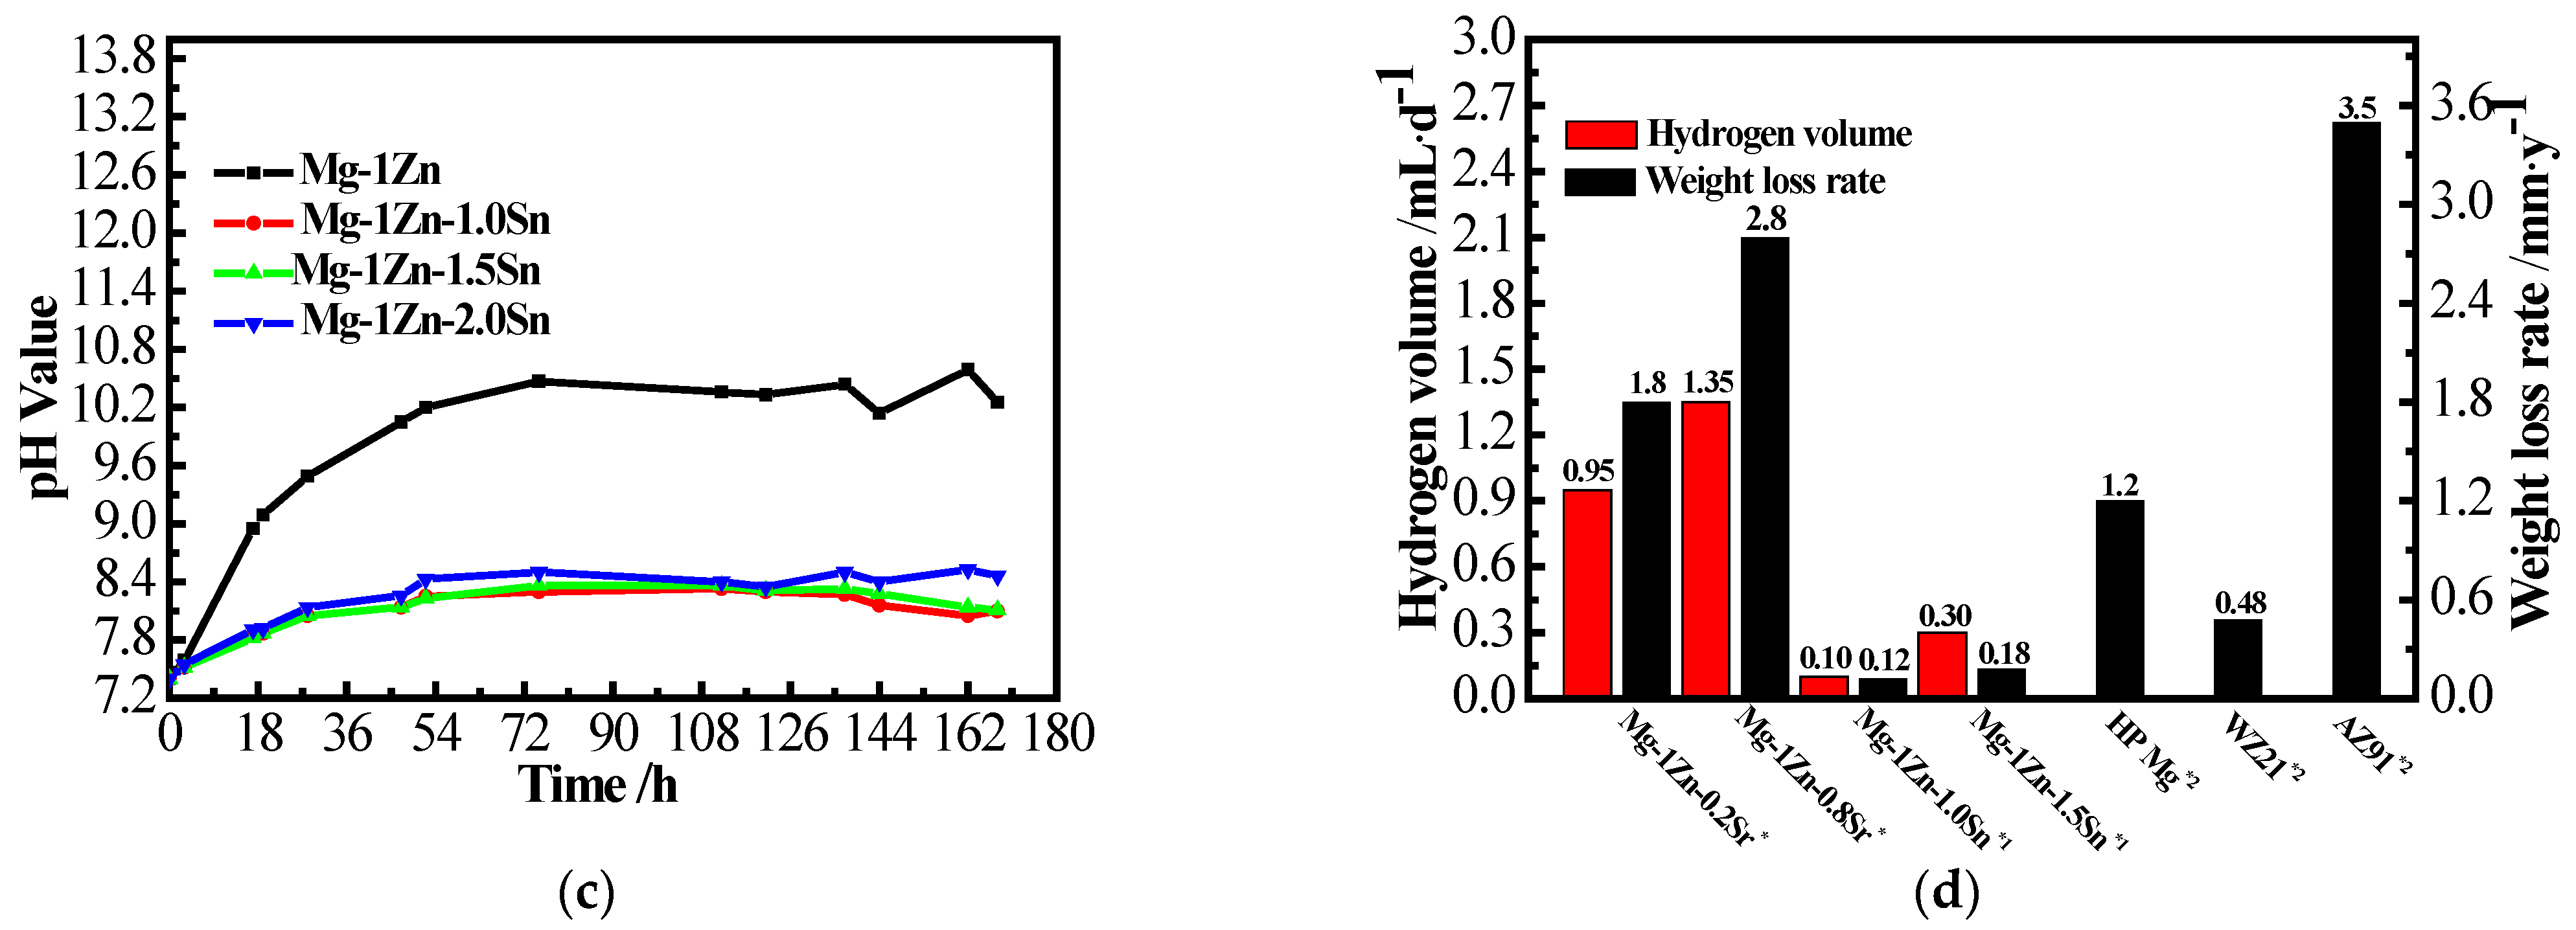
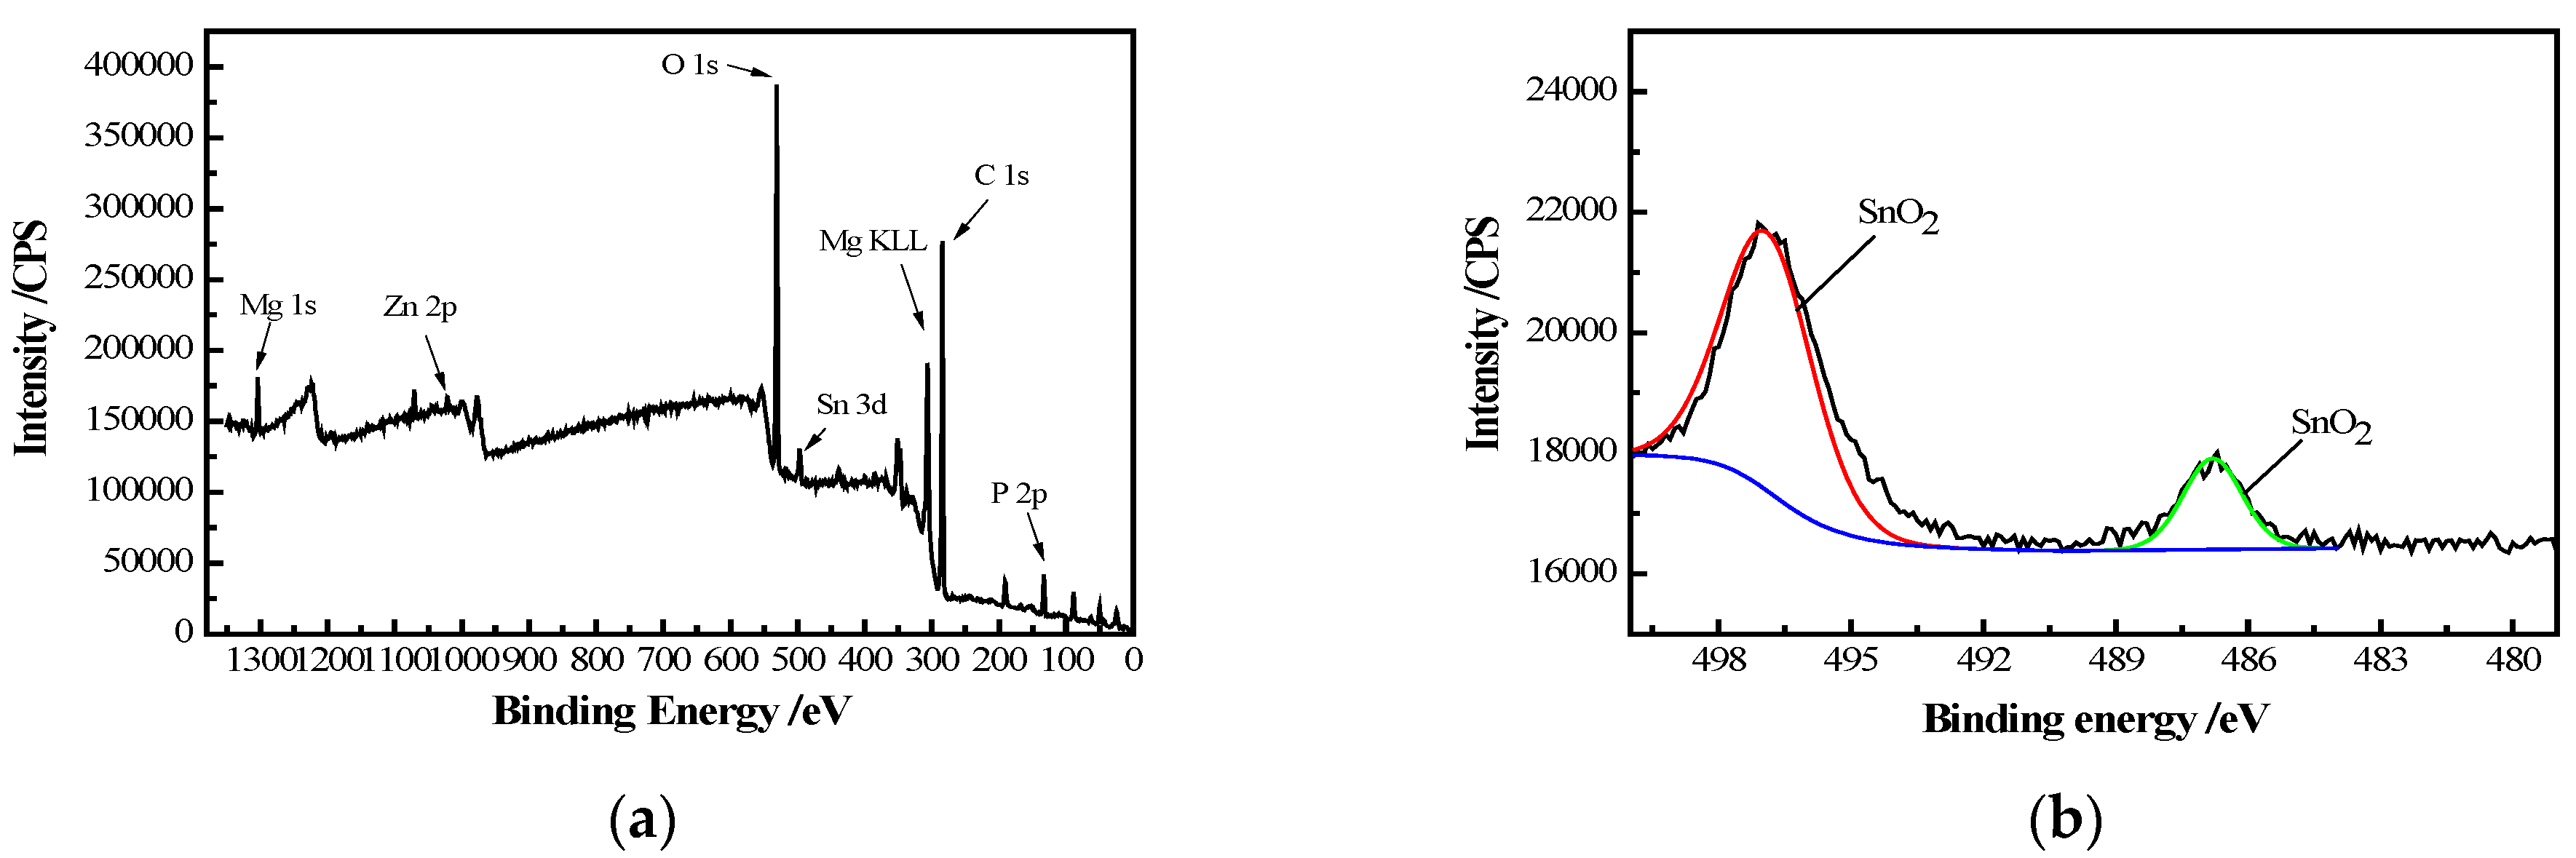
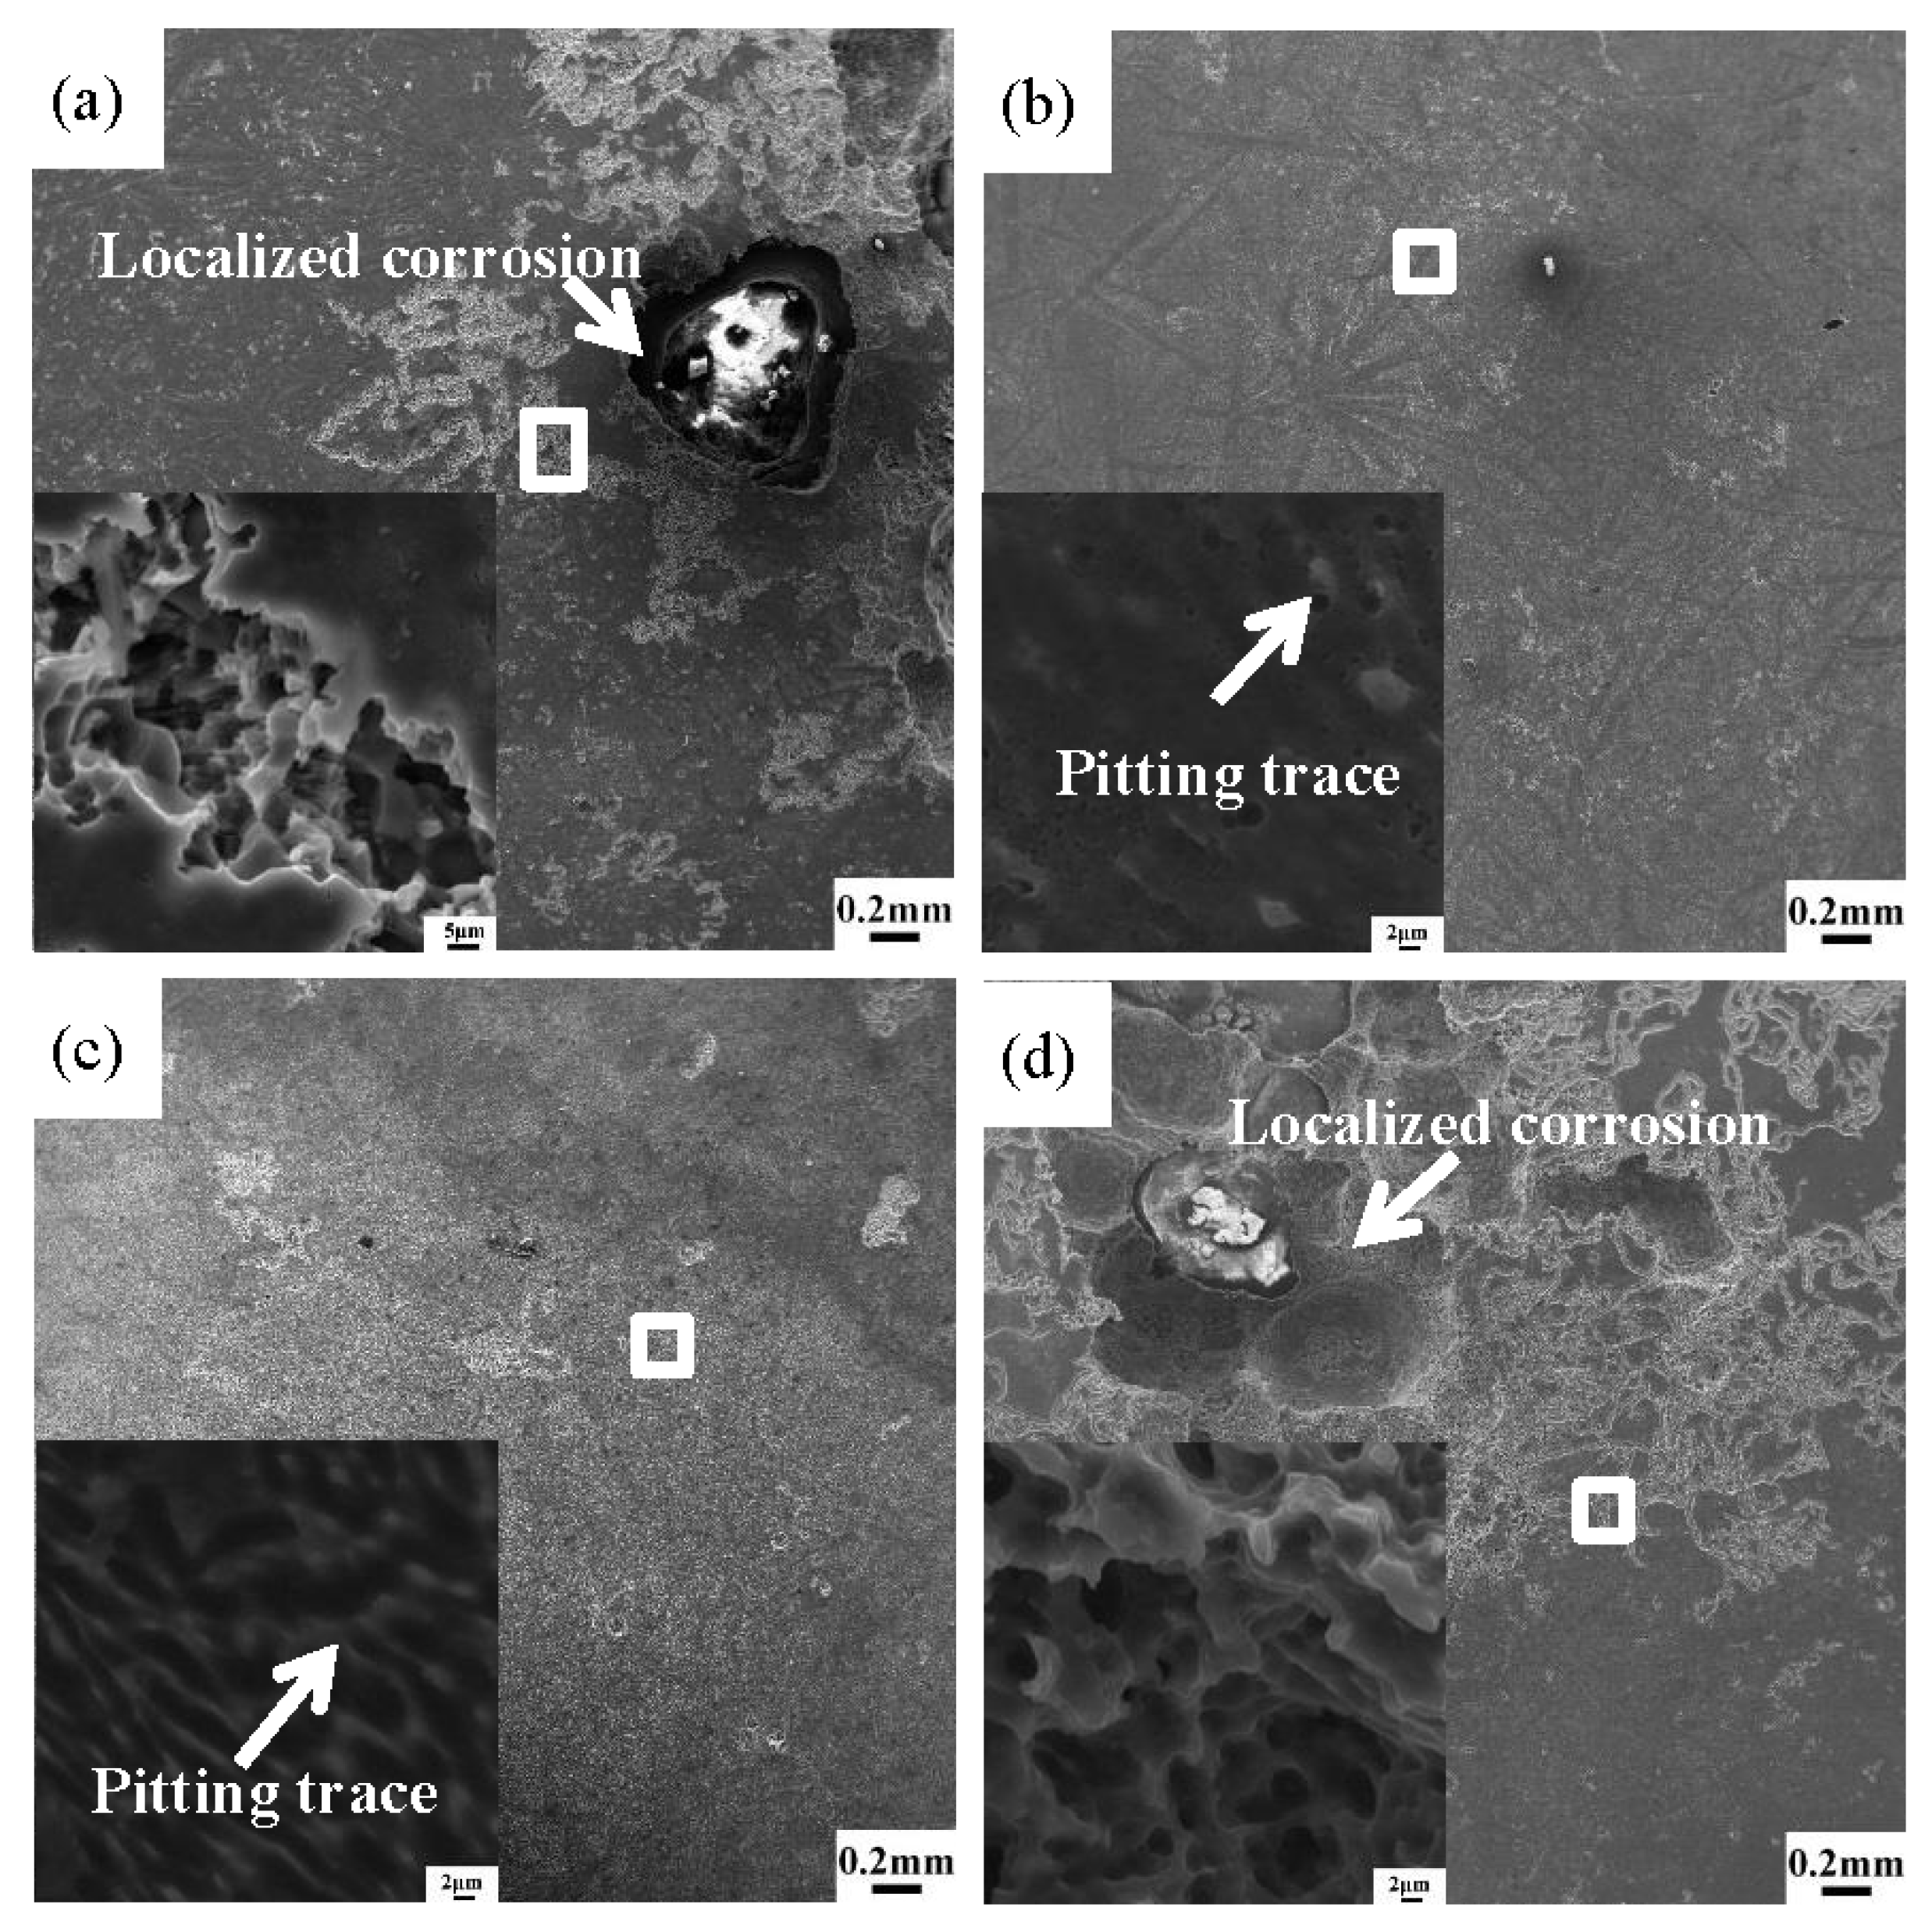
3.3. In Vitro Degradation Properties
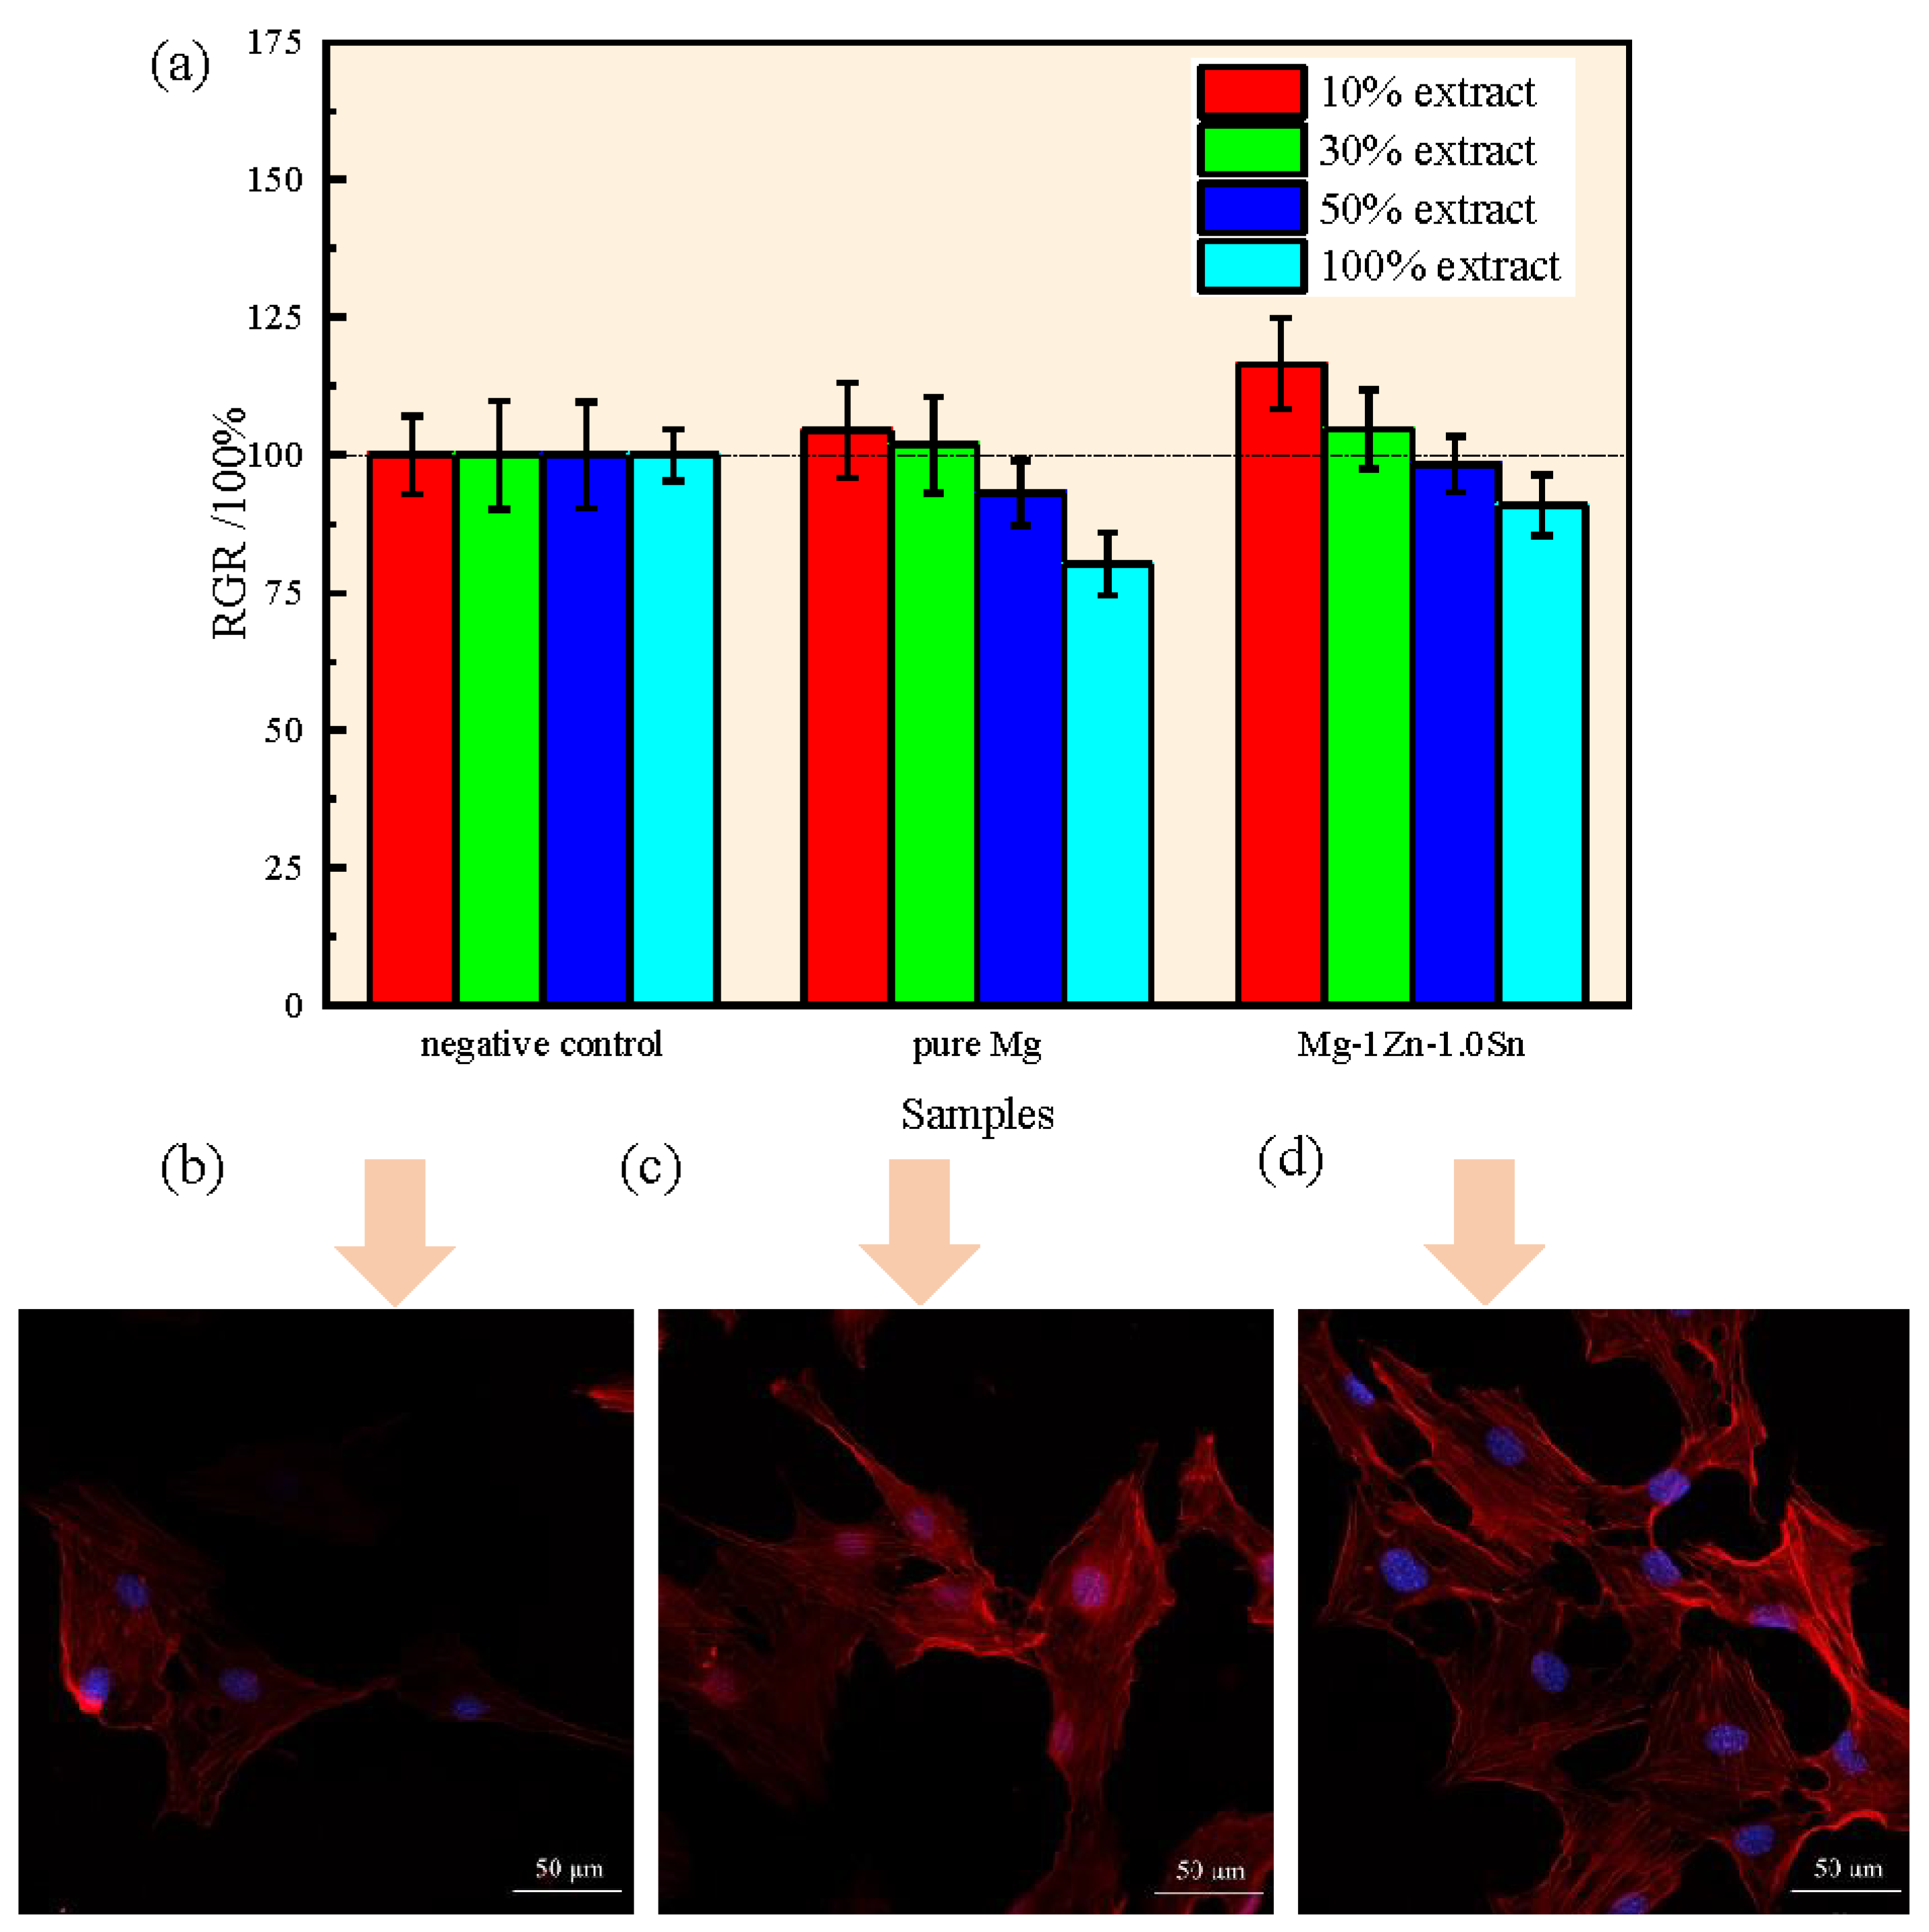
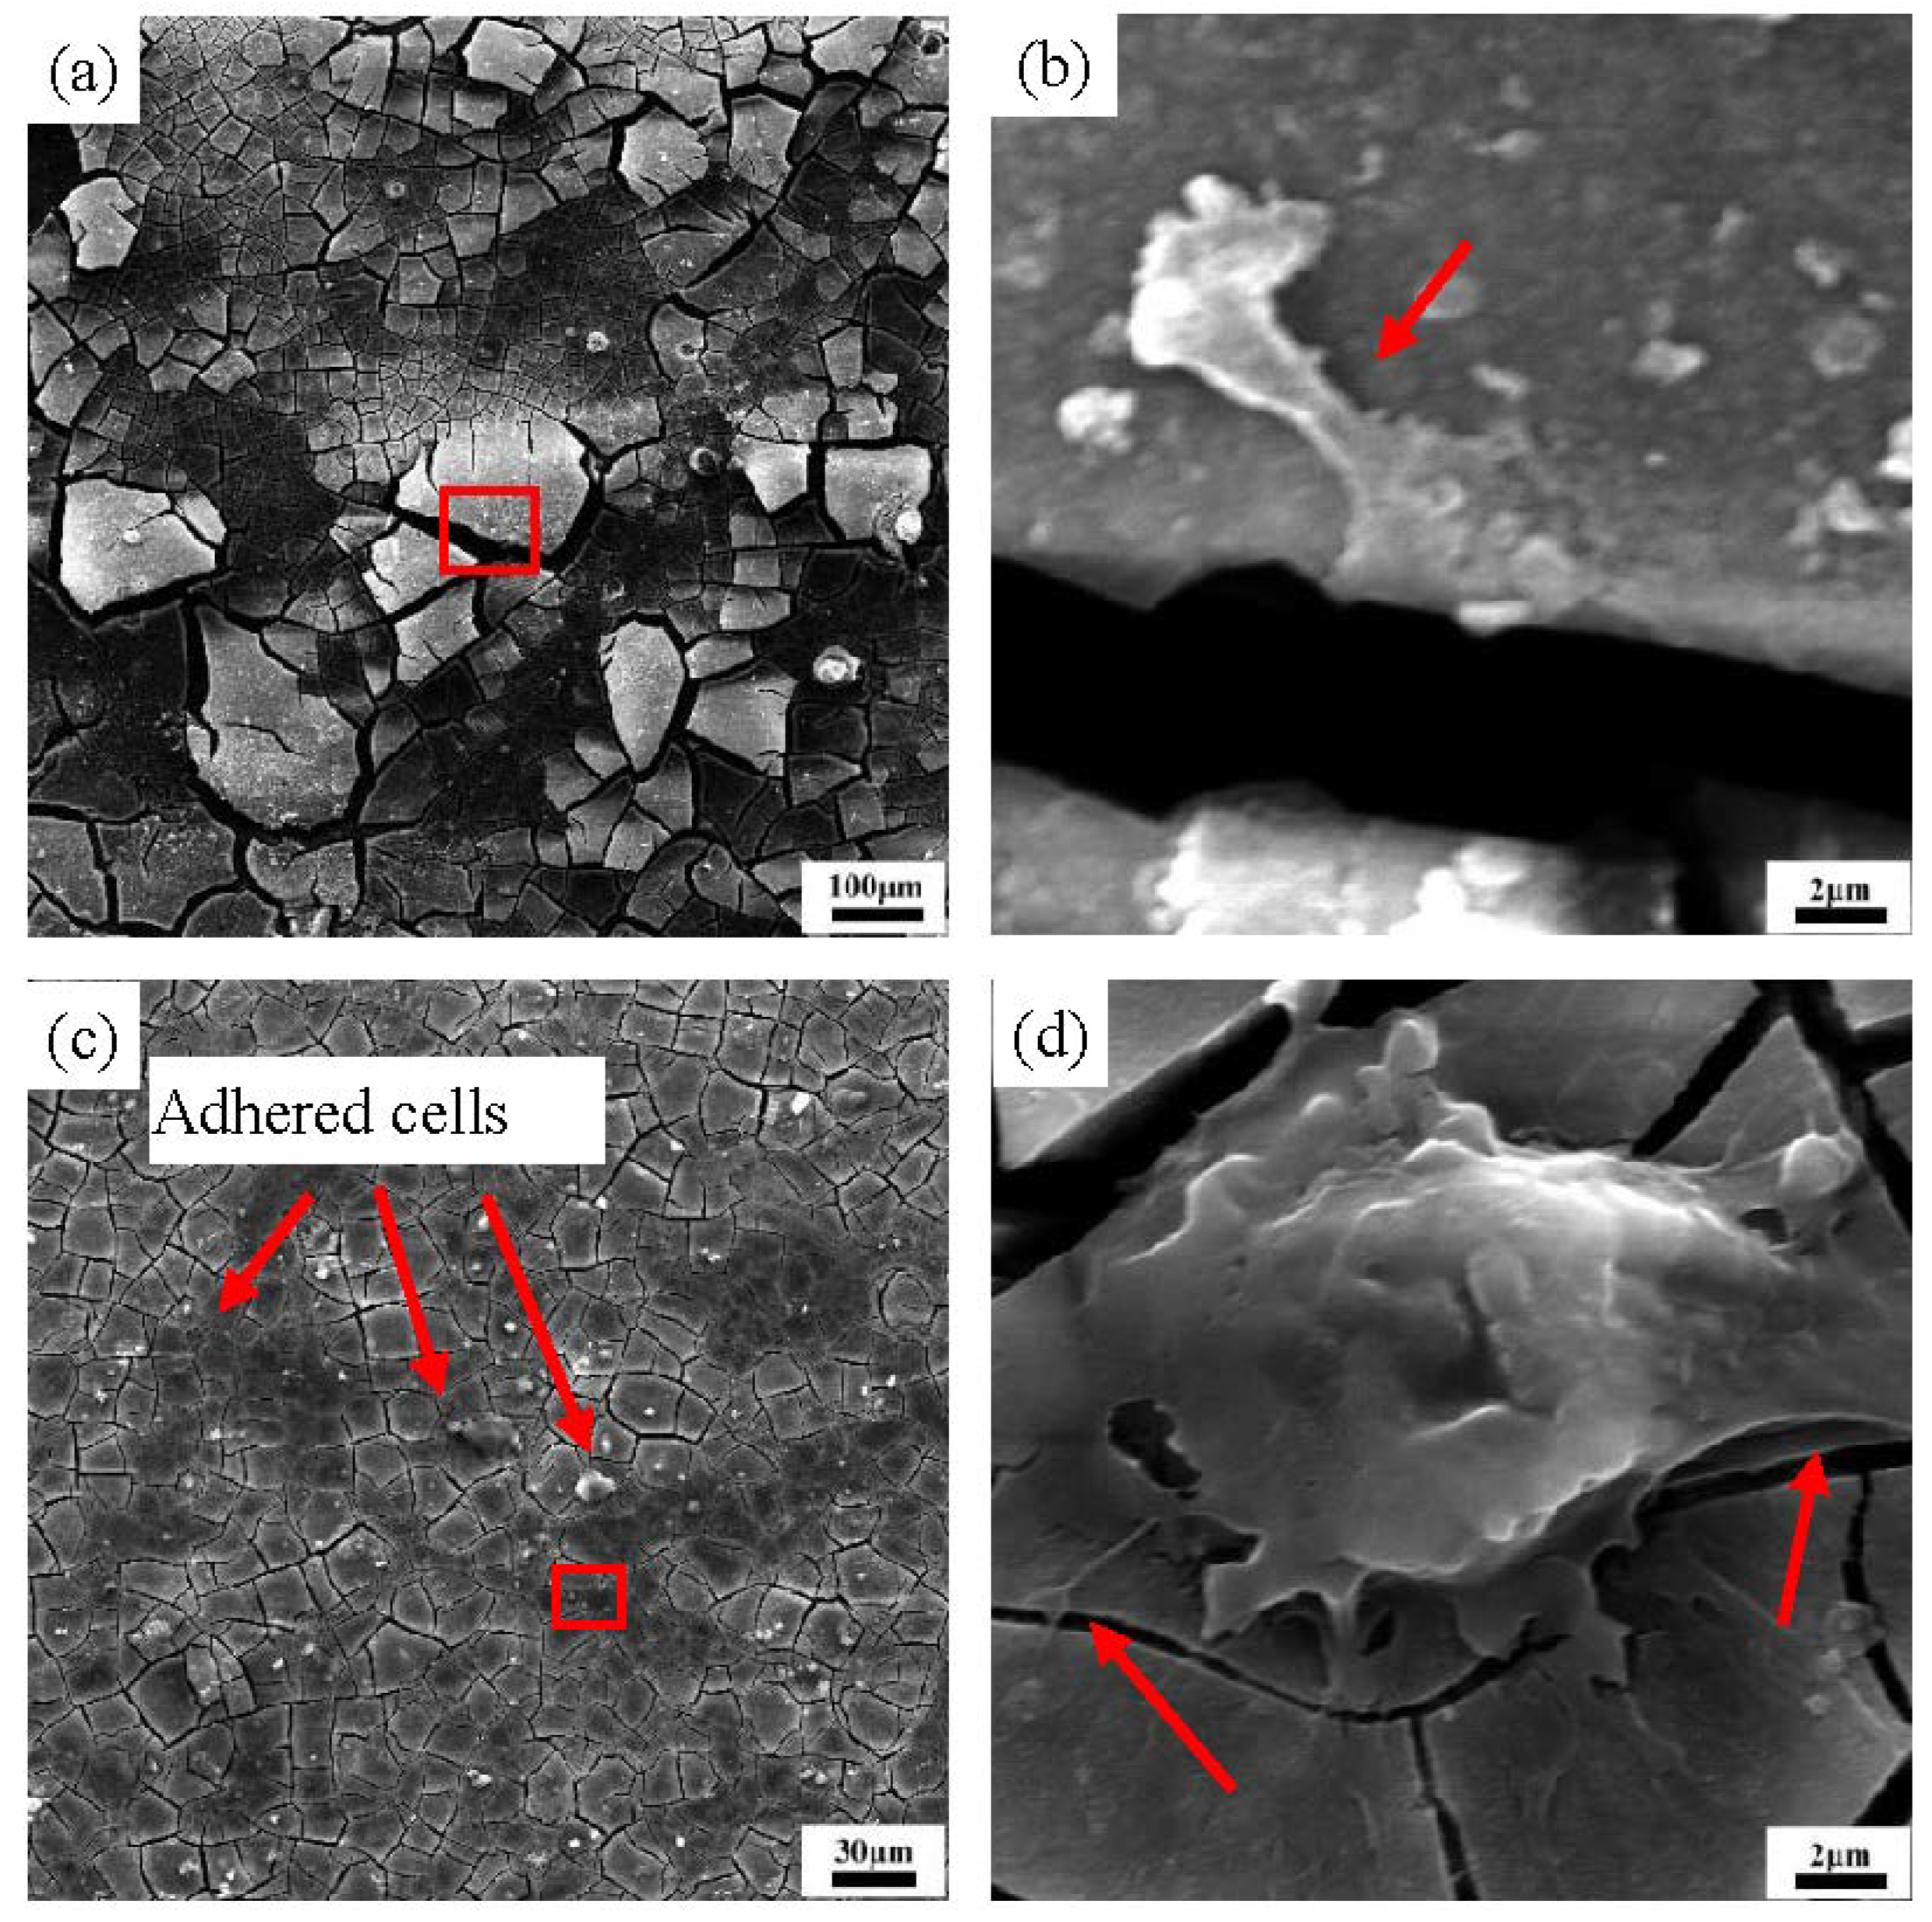
3.4. Cytocompatibility
4. Conclusions
Author Contributions
Funding
Institutional Review Board Statement
Informed Consent Statement
Data Availability Statement
Conflicts of Interest
References
- Agarwal, S.; Curtin, J.; Duffy, B.; Jaiswal, S. Biodegradable magnesium alloys for orthopaedic applications: A review on corrosion, biocompatibility and surface modifications. Mater. Sci. Eng. C 2016, 68, 948–963. [Google Scholar] [CrossRef] [PubMed]
- Esmaily, M.; Svensson, J.E.; Fajardo, S.; Birbilis, N.; Frankel, G.S.; Virtanen, S.; Arrabal, R.; Thomas, S.; Johansson, L.G. Fundamentals and advances in magnesium alloy corrosion. Prog. Mater. Sci. 2017, 89, 92–193. [Google Scholar] [CrossRef]
- Li, X.; Liu, X.; Wu, S.; Yeung, K.; Zheng, Y.; Chu, P.K. Design of magnesium alloys with controllable degradation for biomedical implants: From bulk to surface. Acta Biomater. 2016, 45, 2–30. [Google Scholar] [CrossRef] [PubMed]
- Zhang, X.; Li, X.-W.; Li, J.-G.; Sun, X.-D. Preparation and Characterizations of Bioglass Ceramic Cement/Ca–P Coating on Pure Magnesium for Biomedical Applications. ACS Appl. Mater. Interfaces 2013, 6, 513–525. [Google Scholar] [CrossRef]
- Wu, G.; Zeng, X.; Yuan, G. Growth and corrosion of aluminum PVD-coating on AZ31 magnesium alloy. Mater. Lett. 2008, 62, 4325–4327. [Google Scholar] [CrossRef]
- Gu, X.; Zhou, W.; Zheng, Y.; Liu, Y.; Li, Y. Degradation and cytotoxicity of lotus-type porous pure magnesium as potential tissue engineering scaffold material. Mater. Lett. 2010, 64, 1871–1874. [Google Scholar] [CrossRef]
- Bobe, K.; Willbold, E.; Morgenthal, I.; Andersen, O.; Studnitzky, T.; Nellesen, J.; Tillmann, W.; Vogt, C.; Vano, K.; Witte, F. In vitro and in vivo evaluation of biodegradable, open-porous scaffolds made of sintered magnesium W4 short fibres. Acta Biomater. 2013, 9, 8611–8623. [Google Scholar] [CrossRef]
- Xu, W.; Birbilis, N.; Sha, G.; Wang, Y.; Daniels, J.; Xiao, Y.; Ferry, M. A high-specific-strength and corrosion-resistant magnesium alloy. Nat. Mater. 2015, 14, 1229–1235. [Google Scholar] [CrossRef]
- Witte, F.; Kaese, V.; Haferkamp, H.; Switzer, E.; Meyer-Lindenberg, A.; Wirth, C.J.; Windhagen, H. In vivo corrosion of four magnesium alloys and the associated bone response. Biomaterials 2005, 26, 3557–3563. [Google Scholar] [CrossRef]
- Liu, Q.; Ma, Q.-X.; Chen, G.-Q.; Cao, X.; Zhang, S.; Pan, J.-L.; Zhang, G.; Shi, Q.-Y. Enhanced corrosion resistance of AZ91 magnesium alloy through refinement and homogenization of surface microstructure by friction stir processing. Corros. Sci. 2018, 138, 284–296. [Google Scholar] [CrossRef]
- Song, Y.; Shan, D.; Chen, R.; Zhang, F.; Han, E.-H. Biodegradable behaviors of AZ31 magnesium alloy in simulated body fluid. Mater. Sci. Eng. C 2009, 29, 1039–1045. [Google Scholar] [CrossRef]
- Hort, N.; Huang, Y.; Fechner, D.; Störmer, M.; Blawert, C.; Witte, F.; Vogt, C.; Drücker, H.; Willumeit, R.; Kainer, K.U.; et al. Magnesium alloys as implant materials—Principles of property design for Mg-–RE alloys. Acta Biomater. 2010, 6, 1714–1725. [Google Scholar] [CrossRef]
- Yang, L.; Hort, N.; Laipple, D.; Höche, D.; Huang, Y.; Kainer, K.U.; Willumeit, R.; Feyerabend, F. Element distribution in the corrosion layer and cytotoxicity of alloy Mg–10Dy during in vitro biodegradation. Acta Biomater. 2012, 9, 8475–8487. [Google Scholar] [CrossRef]
- Niu, J.; Xiong, M.; Guan, X.; Zhang, J.; Huang, H.; Pei, J.; Yuan, G. The in vivo degradation and bone-implant interface of Mg-Nd-Zn-Zr alloy screws: 18 months post-operation results. Corros. Sci. 2016, 113, 183–187. [Google Scholar] [CrossRef]
- Kubásek, J.; Vojtěch, D.; Lipov, J.; Ruml, T. Structure, mechanical properties, corrosion behavior and cytotoxicity of biodegradable Mg–X (X=Sn, Ga, In) alloys. Mater. Sci. Eng. C 2013, 33, 2421–2432. [Google Scholar] [CrossRef]
- Zhang, S.; Zhang, X.; Zhao, C.; Li, J.; Song, Y.; Xie, C.; Tao, H.; Zhang, Y.; He, Y.; Jiang, Y.; et al. Research on an Mg–Zn alloy as a degradable biomaterial. Acta Biomater. 2010, 6, 626–640. [Google Scholar] [CrossRef]
- Zhang, E.; Yang, L. Microstructure, mechanical properties and bio-corrosion properties of Mg–Zn–Mn–Ca alloy for biomedical application. Mater. Sci. Eng. A 2008, 497, 111–118. [Google Scholar] [CrossRef]
- Li, H.; Liu, D.; Zhao, Y.; Jin, F.; Chen, M. The Influence of Zn Content on the Corrosion and Wear Performance of Mg-Zn-Ca Alloy in Simulated Body Fluid. J. Mater. Eng. Perform. 2016, 25, 3890–3895. [Google Scholar] [CrossRef]
- Kubásek, J.; Vojtěch, D. Structural characteristics and corrosion behavior of biodegradable Mg–Zn, Mg–Zn–Gd alloys. J. Mater. Sci. Mater. Med. 2013, 24, 1615–1626. [Google Scholar] [CrossRef]
- Lu, Y.; Bradshaw, A.; Chiu, Y.; Jones, I. Effects of secondary phase and grain size on the corrosion of biodegradable Mg–Zn–Ca alloys. Mater. Sci. Eng. C 2015, 48, 480–486. [Google Scholar] [CrossRef]
- Gu, X.; Zheng, Y.; Cheng, Y.; Zhong, S.; Xi, T. In vitro corrosion and biocompatibility of binary magnesium alloys. Biomaterials 2009, 30, 484–498. [Google Scholar] [CrossRef] [PubMed]
- Ghayad, I.M.; Maamoun, M.A.; Metwally, W.A.; El-Baradie, Z.M.; Abdel-Azim, A.N. Corrosion Behavior and Surface Modification of Mg-Zn Implant Alloys. J. Mater. Eng. Perform. 2016, 25, 4171–4180. [Google Scholar] [CrossRef]
- Zhang, E.; He, W.; Du, H.; Yang, K. Microstructure, mechanical properties and corrosion properties of Mg–Zn–Y alloys with low Zn content. Mater. Sci. Eng. A 2008, 488, 102–111. [Google Scholar] [CrossRef]
- Huan, Z.G.; Leeflang, M.A.; Zhou, J.; Fratila-Apachitei, L.E.; Duszczyk, J. In vitro degradation behavior and cytocompatibility of Mg-Zn-Zr alloys. J. Mater. Sci. Mater. Med. 2010, 21, 2623–2635. [Google Scholar] [CrossRef]
- Song, Y.; Han, E.-H.; Shan, D.; Yim, C.D.; You, B.S. The effect of Zn concentration on the corrosion behavior of Mg–xZn alloys. Corros. Sci. 2012, 65, 322–330. [Google Scholar] [CrossRef]
- Turen, Y. Effect of Sn addition on microstructure, mechanical and casting properties of AZ91 alloy. Mater. Des. 2013, 49, 1009–1015. [Google Scholar] [CrossRef]
- Zhao, C.; Pan, F.; Zhao, S.; Pan, H.; Song, K.; Tang, A. Preparation and characterization of as-extruded Mg–Sn alloys for orthopedic applications. Mater. Des. 2015, 70, 60–67. [Google Scholar] [CrossRef]
- ASTM-G102-89; Standard Practice for Calculation for Corrosion Rates and Related Information from Electrochemical Measure-Ments, Annual Book of ASTM Standards. American Society for Testing and Materials: Philadelphia, PA, USA, 1999.
- ASTM-G31-72; Standard Practice for Laboratory Immersion Corrosion Testing of Metals, Annual Book of ASTM Standards. American Society for Testing and Materials: Philadelphia, PA, USA, 2004.
- Wei, S.; Zhu, T.; Hodgson, M.; Gao, W. Effects of Sn addition on the microstructure and mechanical properties of as-cast, rolled and annealed Mg–4Zn alloys. Mater. Sci. Eng. A 2013, 585, 139–148. [Google Scholar] [CrossRef]
- Xiao, W.; Jia, S.; Wang, L.; Wu, Y.; Wang, L. Effects of Sn content on the microstructure and mechanical properties of Mg–7Zn–5Al based alloys. Mater. Sci. Eng. A 2010, 527, 7002–7007. [Google Scholar] [CrossRef]
- Wang, B.; Pan, F.; Chen, X.; Guo, W.; Mao, J. Microstructure and mechanical properties of as-extruded and as-aged Mg–Zn–Al–Sn alloys. Mater. Sci. Eng. A 2016, 656, 165–173. [Google Scholar] [CrossRef]
- Liu, C.; Chen, H.; Nie, J.-F. Interphase boundary segregation of Zn in Mg-Sn-Zn alloys. Scr. Mater. 2016, 123, 5–8. [Google Scholar] [CrossRef]
- Hong, D.; Saha, P.; Chou, D.-T.; Lee, B.; Collins, B.E.; Tan, Z.; Dong, Z.; Kumta, P.N. In vitro degradation and cytotoxicity response of Mg–4% Zn–0.5% Zr (ZK40) alloy as a potential biodegradable material. Acta Biomater. 2013, 9, 8534–8547. [Google Scholar] [CrossRef] [PubMed]
- Zhang, X.; Yuan, G.; Mao, L.; Niu, J.; Ding, W. Biocorrosion properties of as-extruded Mg–Nd–Zn–Zr alloy compared with commercial AZ31 and WE43 alloys. Mater. Lett. 2012, 66, 209–211. [Google Scholar] [CrossRef]
- Song, G.-L. Effect of tin modification on corrosion of AM70 magnesium alloy. Corros. Sci. 2009, 51, 2063–2070. [Google Scholar] [CrossRef]
- Li, H.; Peng, Q.; Li, X.; Li, K.; Han, Z.; Fang, D. Microstructures, mechanical and cytocompatibility of degradable Mg–Zn based orthopedic biomaterials. Mater. Des. 2014, 58, 43–51. [Google Scholar] [CrossRef]
- Abidin, N.I.Z.; Rolfe, B.; Owen, H.; Malisano, J.; Martin, D.; Hofstetter, J.; Uggowitzer, P.; Atrens, A. The in vivo and in vitro corrosion of high-purity magnesium and magnesium alloys WZ21 and AZ91. Corros. Sci. 2013, 75, 354–366. [Google Scholar] [CrossRef]
- Liu, X.; Shan, D.; Song, Y.; Chen, R.; Han, E. Influences of the quantity of Mg2Sn phase on the corrosion behavior of Mg–7Sn magnesium alloy. Electrochim. Acta 2011, 56, 2582–2590. [Google Scholar] [CrossRef]
- Cao, C.N. Principles of Corrosion Electrochemistry; Chemical Industry Press: Beijing, China, 2004. [Google Scholar]
- Wang, J.; Li, Y.; Huang, S.; Zhou, X. Study of the corrosion behavior and the corrosion films formed on the surfaces of Mg–xSn alloys in 3.5 wt.% NaCl solution. Appl. Surf. Sci. 2014, 317, 1143–1150. [Google Scholar] [CrossRef]
- Moon, S.; Nam, Y. Anodic oxidation of Mg–Sn alloys in alkaline solutions. Corros. Sci. 2012, 65, 494–501. [Google Scholar] [CrossRef]
- Du, W.; Liu, K.; Ma, K.; Wang, Z.; Li, S. Effects of trace Ca/Sn addition on corrosion behaviors of biodegradable Mg–4Zn–0.2Mn alloy. J. Magnes. Alloy. 2018, 6, 1–14. [Google Scholar] [CrossRef]
- Erinc, M.; Sillekens, H.; Mannens, R.; Werkhoven, R.J. Applicability of existing magnesium alloys as biomedical implant mate-rials. Magnes. Technol. 2009, 209–214. [Google Scholar]
- Cheng, J.; Liu, B.; Wu, Y.; Zheng, Y. Comparative in vitro Study on Pure Metals (Fe, Mn, Mg, Zn and W) as Biodegradable Metals. J. Mater. Sci. Technol. 2013, 29, 619–627. [Google Scholar] [CrossRef]
- He, R.; Liu, R.; Chen, Q.; Zhang, H.; Wang, J.; Guo, S. In vitro degradation behavior and cytocompatibility of Mg-6Zn-Mn alloy. Mater. Lett. 2018, 228, 77–80. [Google Scholar] [CrossRef]
- Zhang, S.; Zheng, Y.; Zhang, L.; Bi, Y.; Li, J.; Liu, J.; Yu, Y.; Guo, H.; Li, Y. In vitro and in vivo corrosion and histocompatibility of pure Mg and a Mg-6Zn alloy as urinary implants in rat model. Mater. Sci. Eng. C 2016, 68, 414–422. [Google Scholar] [CrossRef]
- Li, Y.; Li, H.; Zhang, J.; Zhao, W.; Shen, J.; Jiang, D. In vitro evaluation of an yttria-stabilized zirconia reinforced nano-hydroxyapatite/polyamide 66 ternary biomaterial: Biomechanics, biocompatibility and bioactivity. RSC Adv. 2016, 6, 114086–114095. [Google Scholar] [CrossRef]
- Gurel, S.; Nazarahari, A.; Canadinc, D.; Cabuk, H.; Bal, B. Assessment of biocompatibility of novel TiTaHf-based high entropy alloys for utility in orthopedic implants. Mater. Chem. Phys. 2021, 266, 124573. [Google Scholar] [CrossRef]
- Jiang, W.; Yu, W. Corrosion Behavior and Osteogenic Activity of a Biodegradable Orthopedic Implant Mg–Si Alloy with a Gradient Structure. Metals 2021, 11, 781. [Google Scholar] [CrossRef]
- Tan, J.K.; Balan, P.; Birbilis, N. Advances in LDH coatings on Mg alloys for biomedical applications: A corrosion perspective. Appl. Clay Sci. 2020, 202, 105948. [Google Scholar] [CrossRef]
- Rahman, M.; Li, Y.; Wen, C. HA coating on Mg alloys for biomedical applications: A review. J. Magnes. Alloy. 2020, 8, 929–943. [Google Scholar] [CrossRef]


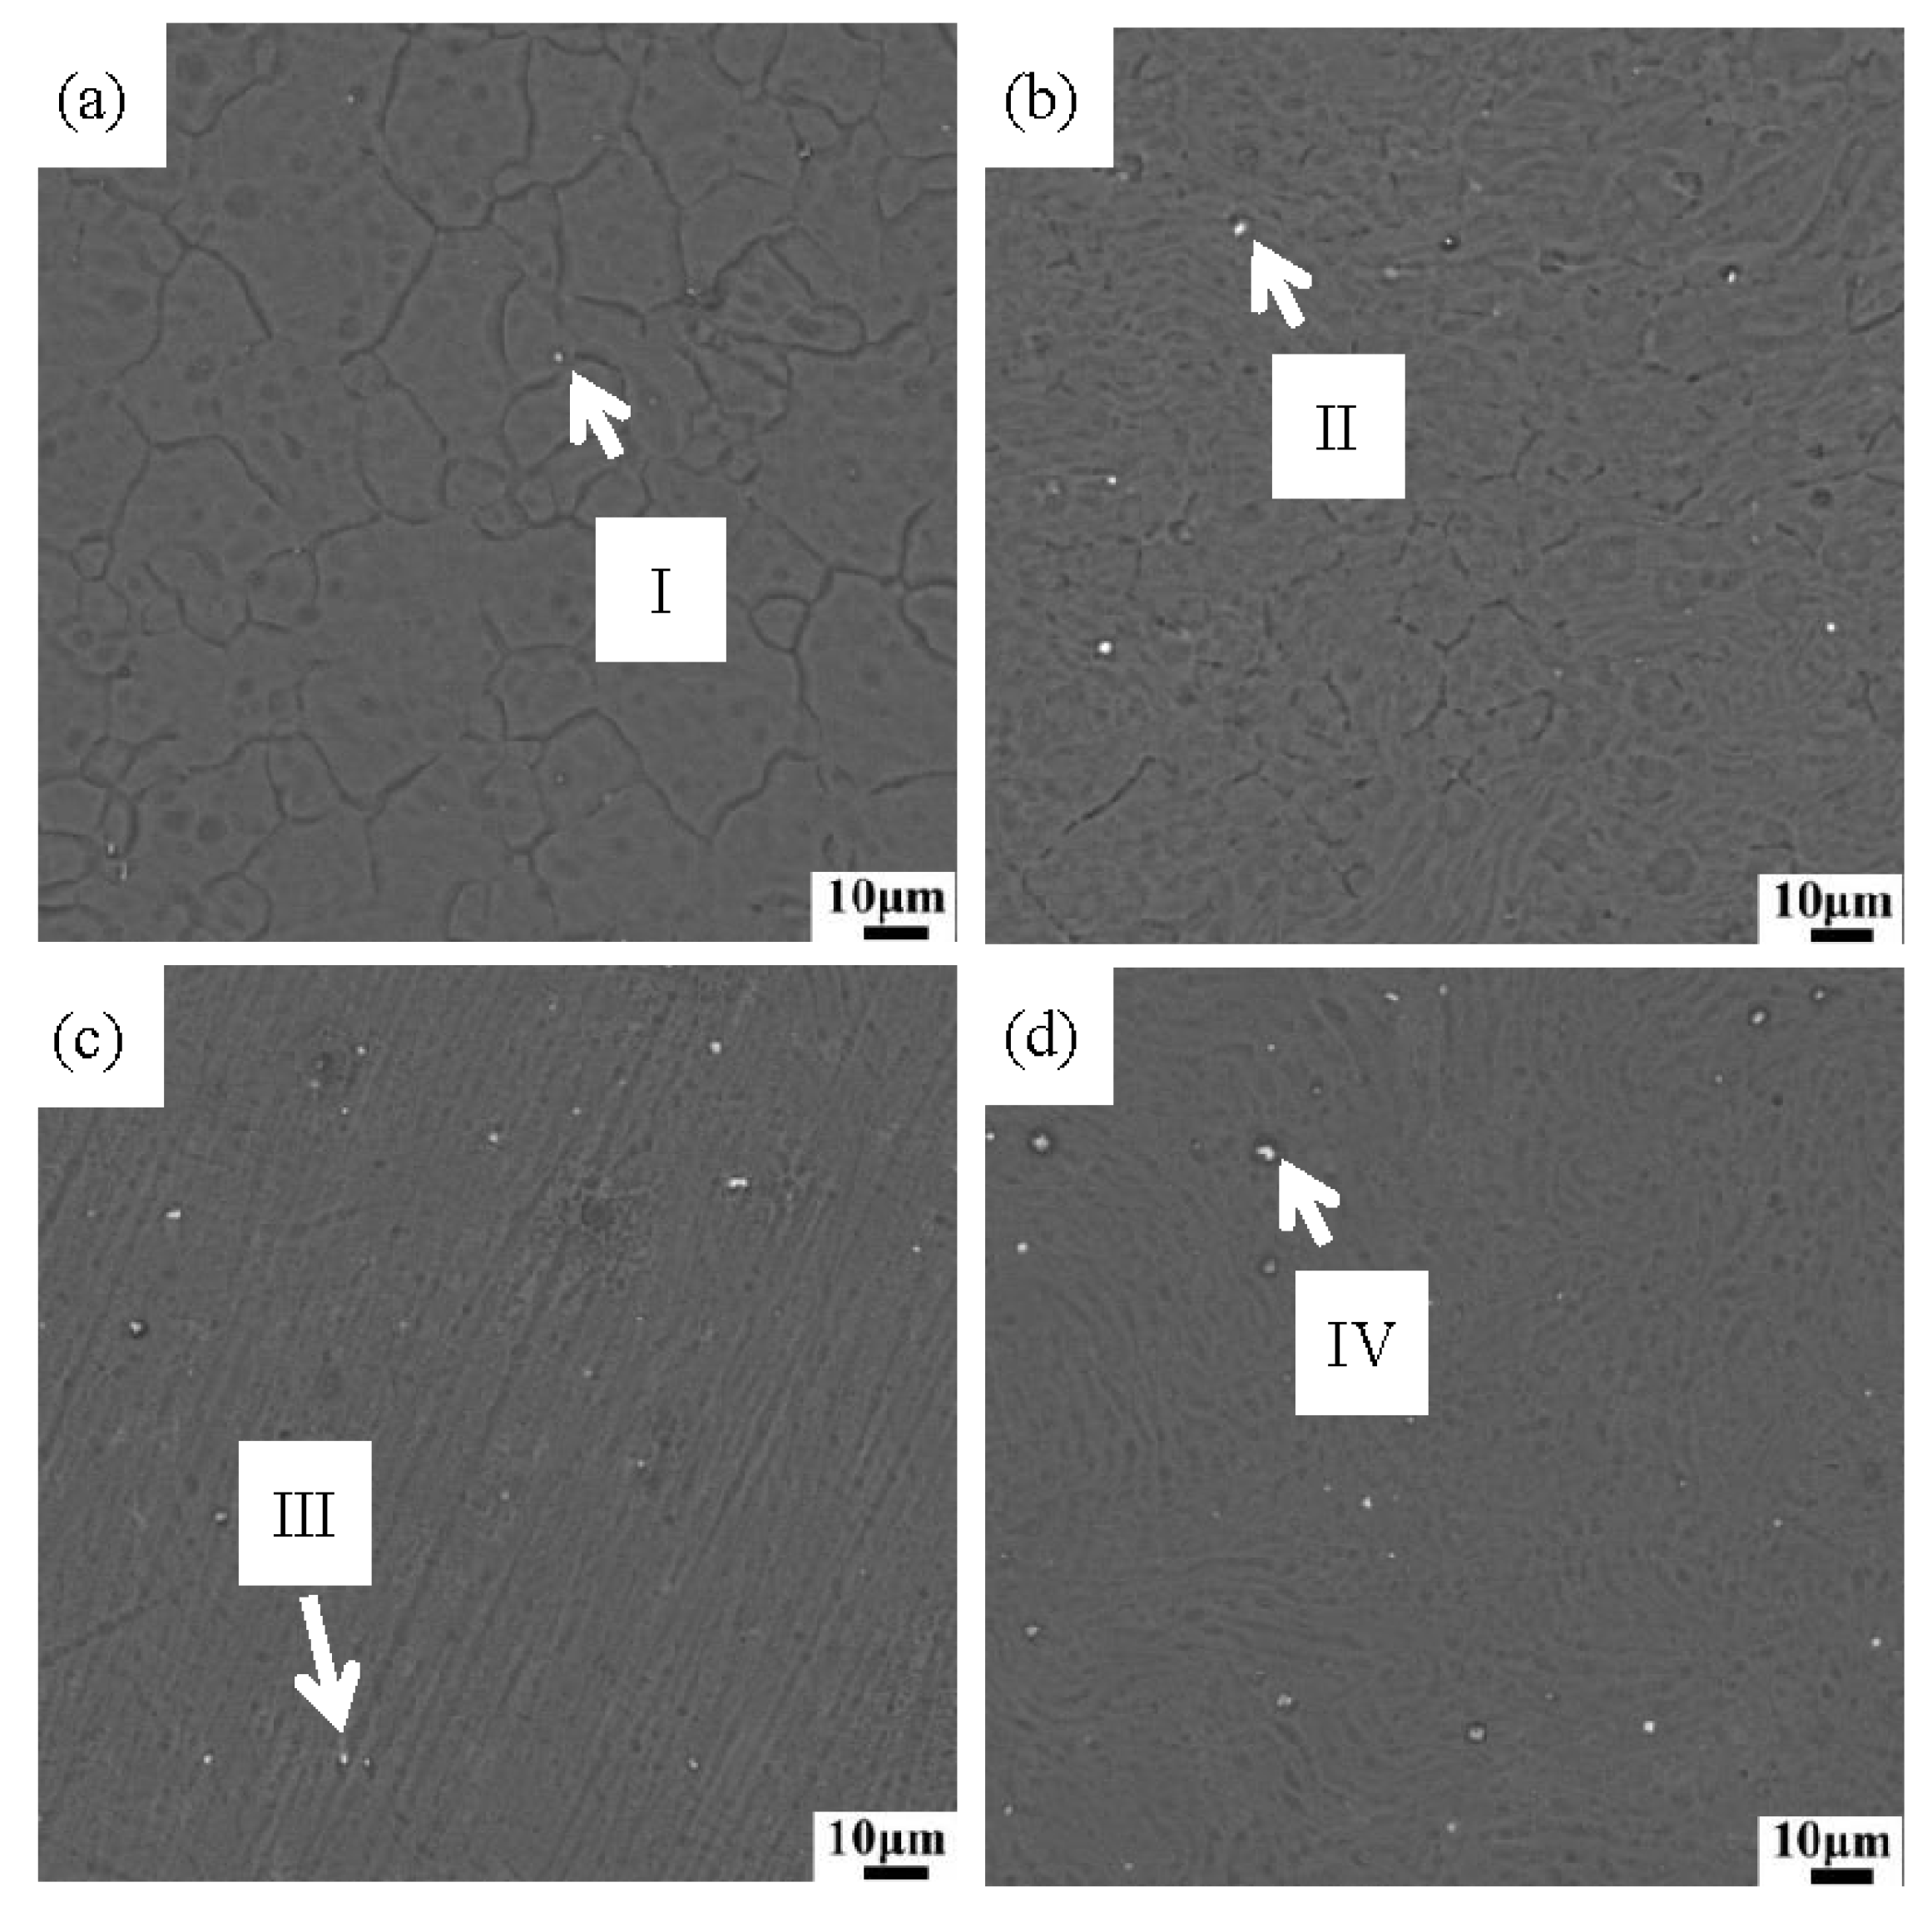
| Alloy | Points | Element (wt.%) | |||||
|---|---|---|---|---|---|---|---|
| Mg | O | Sn | Si | Fe | Total | ||
| Mg-1Zn | I | 11.97 | 3.96 | 2.77 | 81.30 | 100 | |
| Mg-1Zn-1.0Sn | II | 71.54 | 15.56 | 4.34 | 2.17 | 6.39 | 100 |
| Mg-1Zn-1.5Sn | III | 56.10 | 22.94 | 9.78 | 1.25 | 7.14 | 100 |
| Mg-1Zn-2.0Sn | IV | 49.49 | 25.65 | 21.79 | 3.07 | - | 100 |
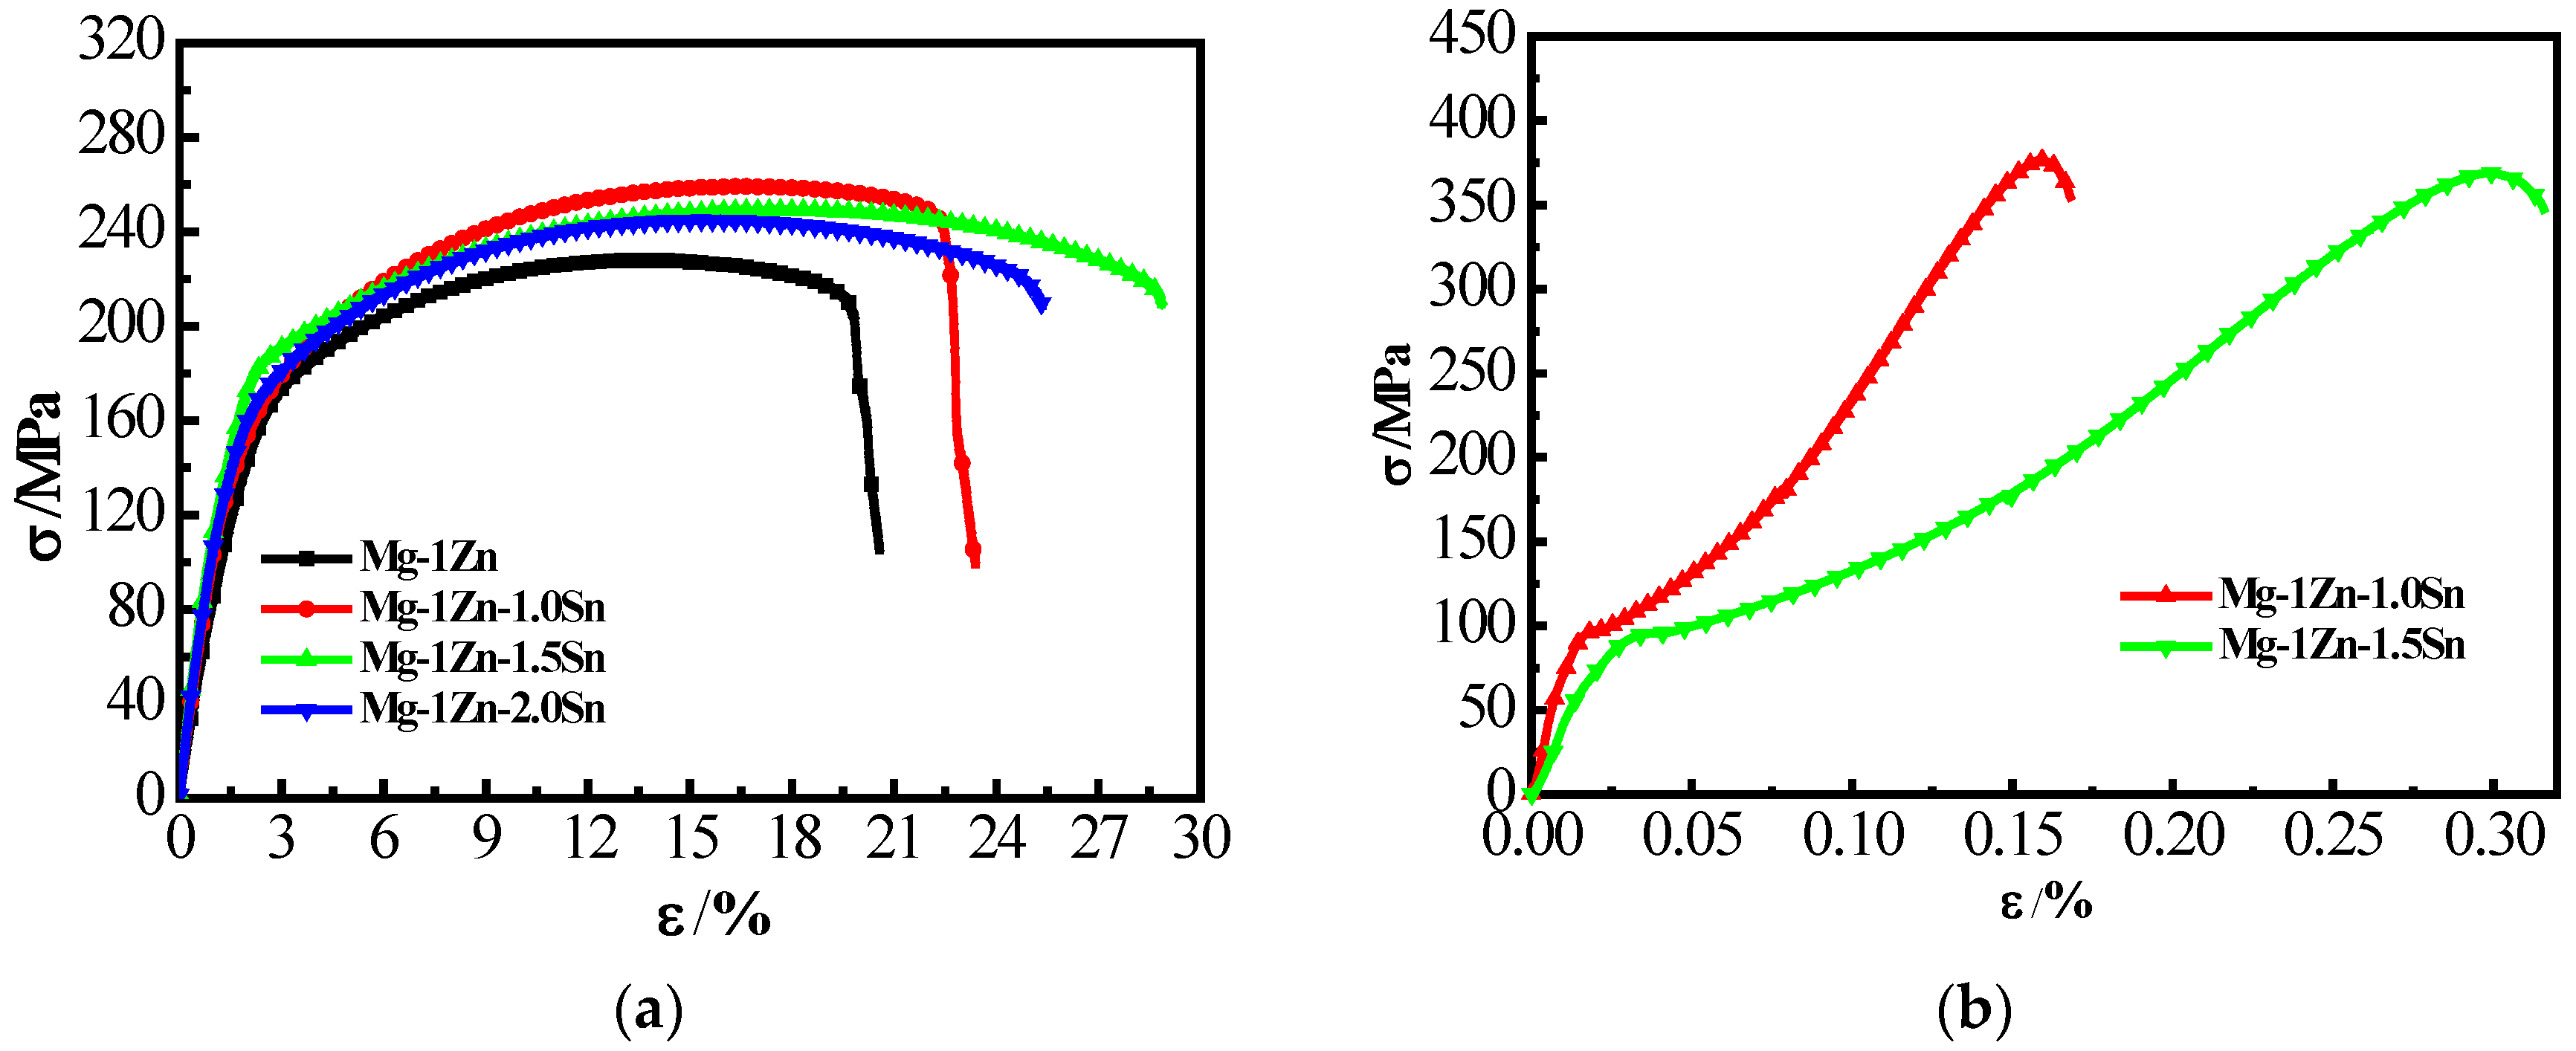
| Alloys | Tensile Properties | Ref | Compression Properties | ||||
|---|---|---|---|---|---|---|---|
| TYS (MPa) | UTS (MPa) | ε (%) | CYS (MPa) | UCS (MPa) | Ε (%) | ||
| Cortical bone | 35–283 | 1.07–2.10 | [34] | 164–240 | |||
| AZ31 extruded | 185 | 264 | 10.5 | [35] | |||
| Mg-1Zn | 100 ± 3 | 229 ± 10 | 17.4 ± 1.2 | Present | --- | --- | --- |
| Mg-1Zn-1.0Sn | 118 ± 5 | 259 ± 14 | 20.2 ± 1.8 | Present | 96 ± 5 | 376 ± 16 | 16.7 ± 1.4 |
| Mg-1Zn-1.5Sn | 115 ± 4 | 249 ± 11 | 27.0 ± 2.1 | Present | 95 ± 4 | 367 ± 17 | 31.4 ± 1.6 |
| Mg-1Zn-2.0Sn | 112 ± 6 | 245 ± 12 | 23.1 ± 1.9 | Present | --- | --- | --- |
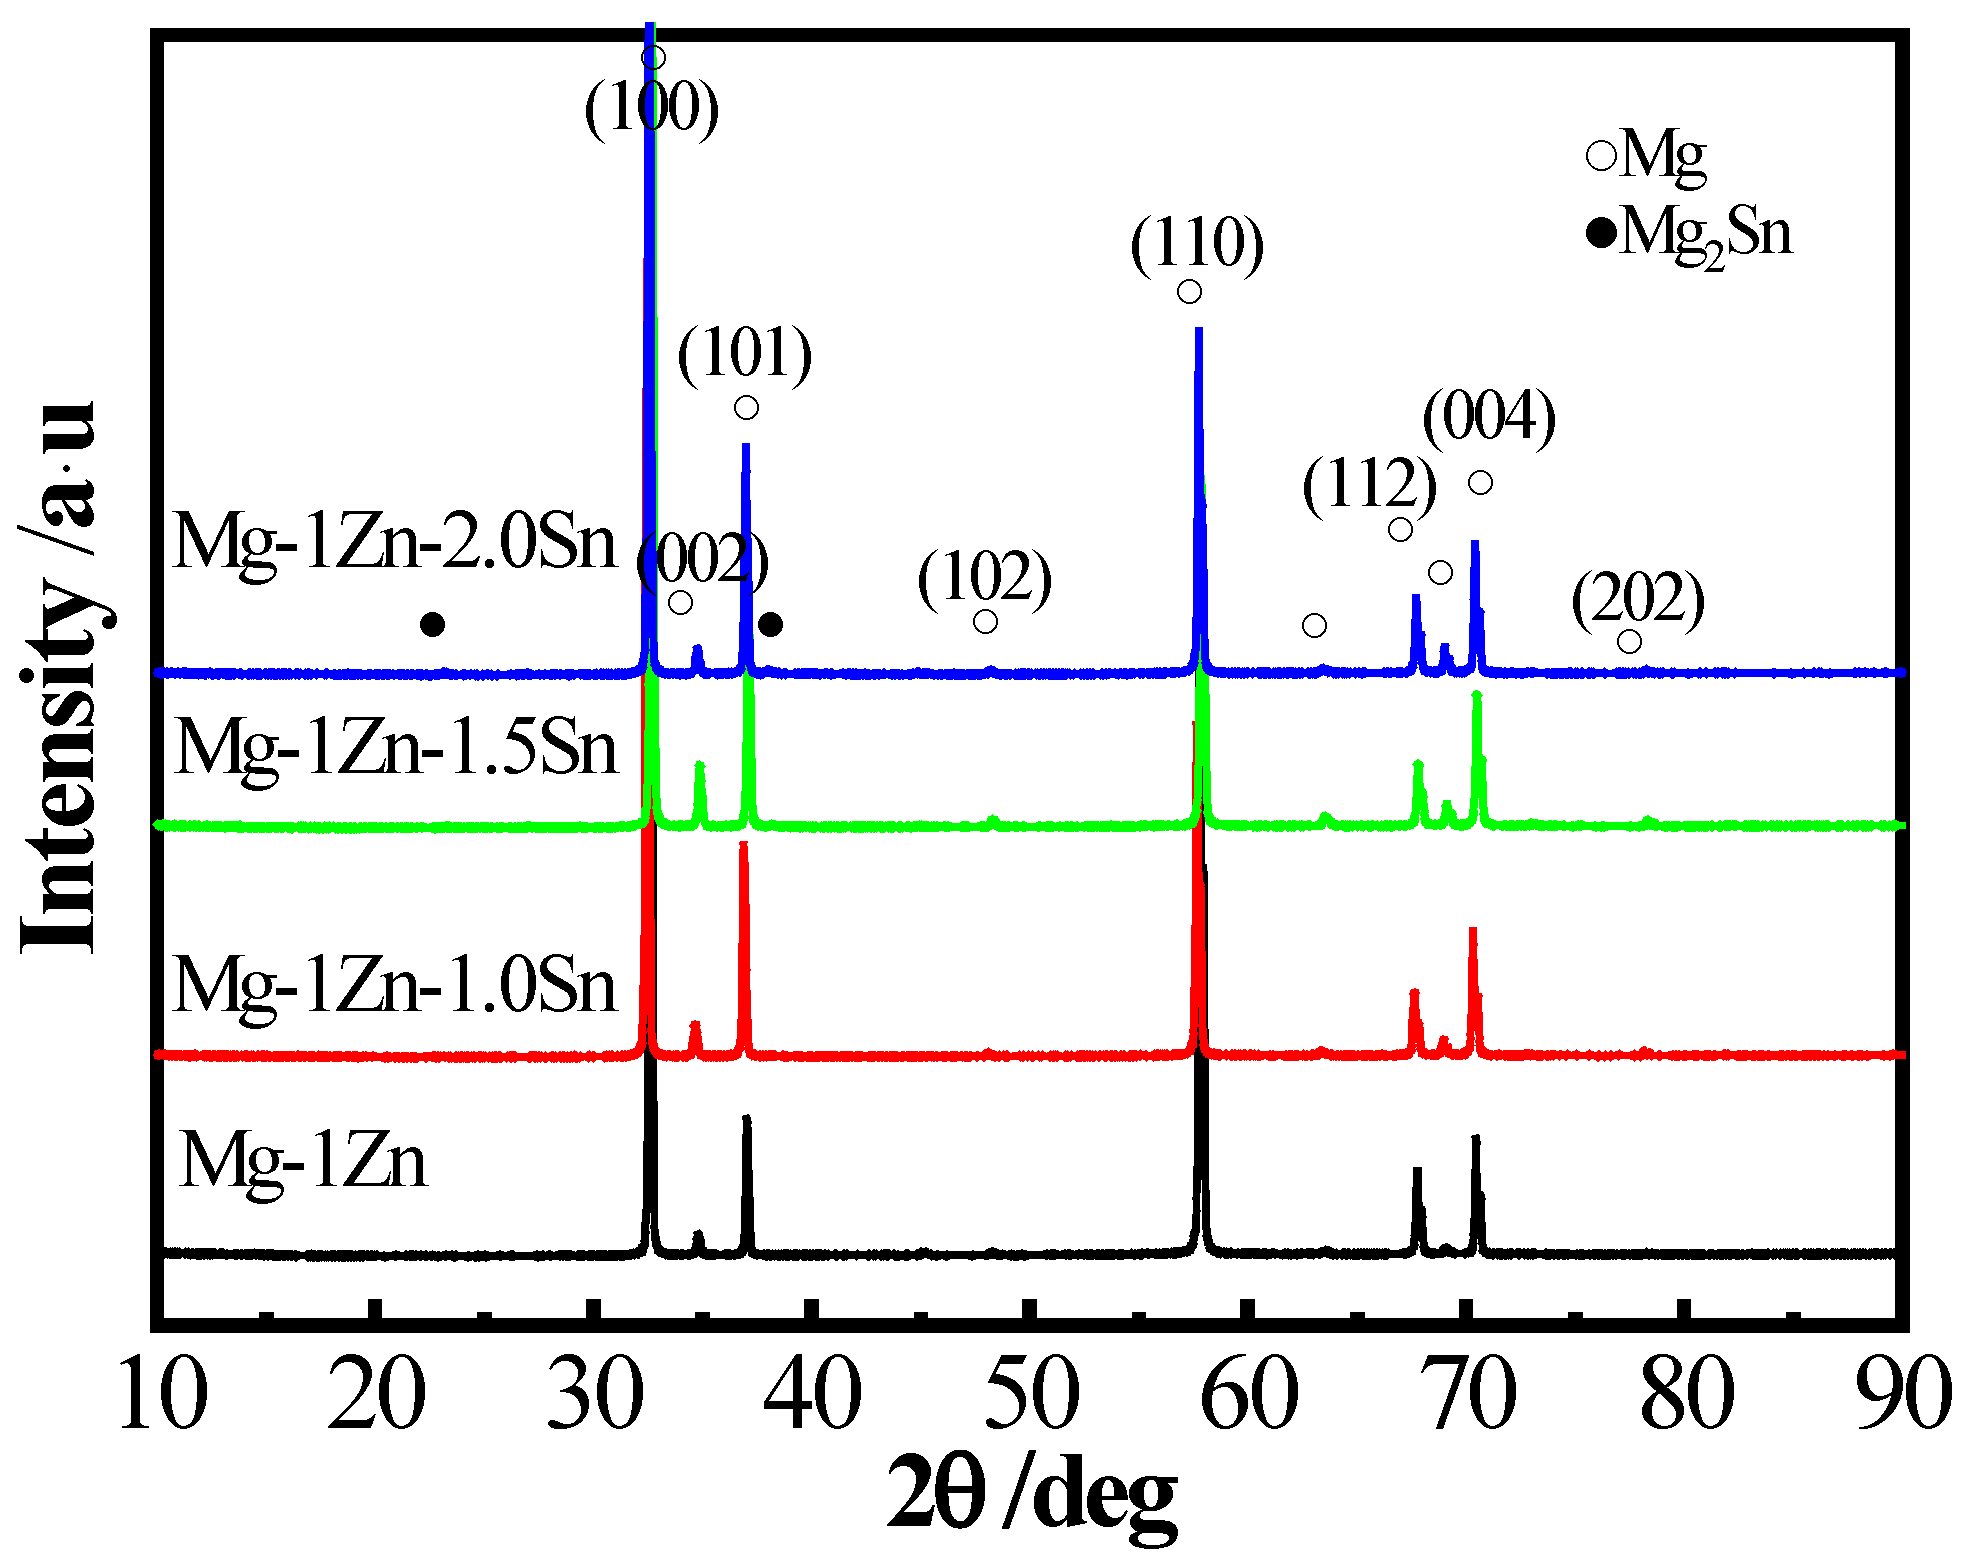
| Specimens | a (Å) | b (Å) | c (Å) | D (nm) |
|---|---|---|---|---|
| Mg (PDF35-0821) | 3.21 | 3.21 | 5.21 | --- |
| Mg-1Zn | 3.17 | 3.17 | 4.78 | 79.6 |
| Mg-1Zn-1.0Sn | 3.19 | 3.19 | 4.99 | 61.7 |
| Mg-1Zn-1.5Sn | 4.10 | 4.10 | 5.32 | 65.1 |
| Mg-1Zn-2.0Sn | 4.20 | 4.20 | 5.37 | 69.5 |
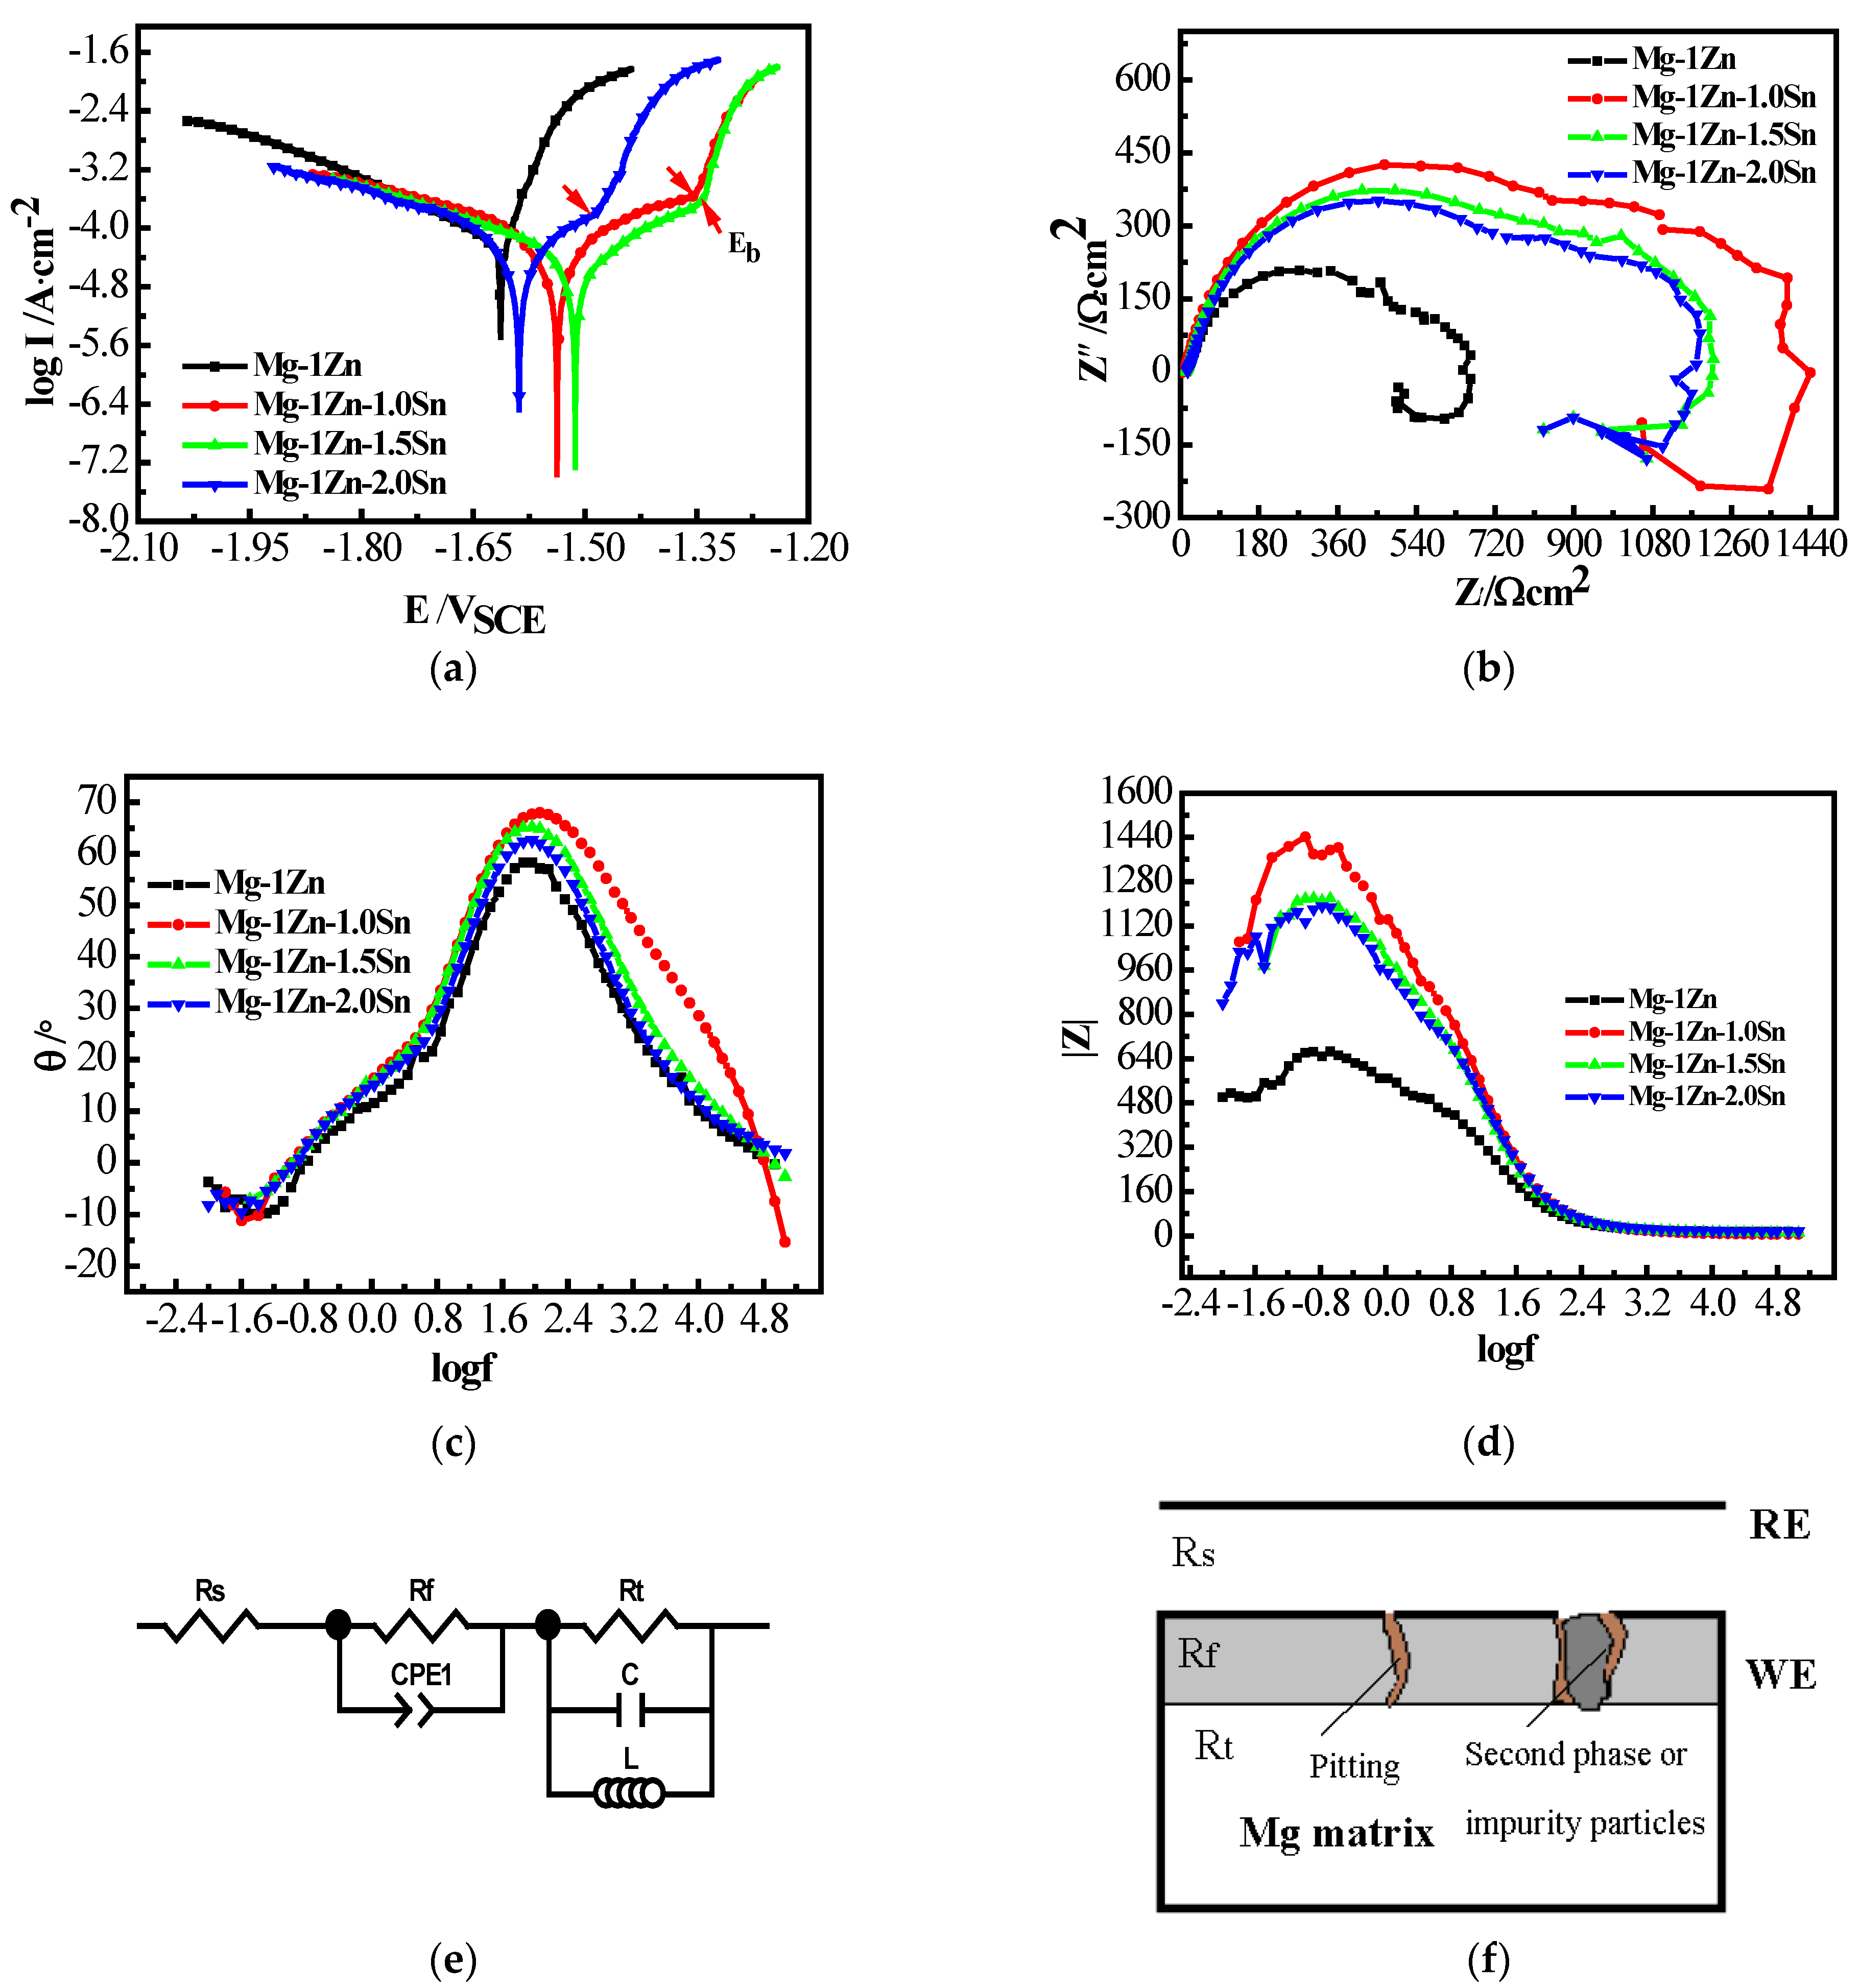
| Alloys | βa | βc | Icorr (A/cm2) | Ecorr (V) |
|---|---|---|---|---|
| Mg-1Zn | 70.67 | 88.07 | 1.50 × 10⁻⁴ | −1.54 |
| Mg-1Zn-1.0Sn | 93.73 | 119.03 | 2.24 × 10⁻⁵ | −1.50 |
| Mg-1Zn-1.5Sn | 97.30 | 107.64 | 2.79 × 10⁻⁵ | −1.51 |
| Mg-1Zn-2.0Sn | 70.10 | 65.27 | 3.12 × 10⁻⁵ | −1.52 |
| Samples | Mg-1Zn | Mg-1Zn-1.0Sn | Mg-1Zn-1.5Sn | Mg-1Zn-2.0Sn |
|---|---|---|---|---|
| Rs (Ωcm2) | 15.4 | 5.339 | 12.44 | 17.89 |
| Rt (Ω/cm2) | 158.4 | 584 | 577.3 | 308.3 |
| C (F/cm2) | 0.0013412 | 2.3287 × 10⁻⁵ | 4.6788 × 10⁻⁷ | 0.00087195 |
| Rf (Ω/cm2) | 494.5 | 1021 | 906.3 | 864.6 |
| CPE1-T (F/cm2) | 5.0867 × 10⁻⁵ | 0.00026117 | 0.00026391 | 3.5368 × 10⁻⁵ |
| CPE1-P (F/cm2) | 0.82682 | 0.6338 | 0.6253 | 0.83465 |
| L (H/cm2) | 427.4 | 3084 | 3419 | 1669 |
Publisher’s Note: MDPI stays neutral with regard to jurisdictional claims in published maps and institutional affiliations. |
© 2022 by the authors. Licensee MDPI, Basel, Switzerland. This article is an open access article distributed under the terms and conditions of the Creative Commons Attribution (CC BY) license (https://creativecommons.org/licenses/by/4.0/).
Share and Cite
Jiang, W.; Yu, W. In Vitro Degradation Behavior, Mechanical Properties, and Cytocompatibility of Biodegradable Mg-1Zn-xSn Alloys. Crystals 2022, 12, 1219. https://doi.org/10.3390/cryst12091219
Jiang W, Yu W. In Vitro Degradation Behavior, Mechanical Properties, and Cytocompatibility of Biodegradable Mg-1Zn-xSn Alloys. Crystals. 2022; 12(9):1219. https://doi.org/10.3390/cryst12091219
Chicago/Turabian StyleJiang, Weiyan, and Wenzhou Yu. 2022. "In Vitro Degradation Behavior, Mechanical Properties, and Cytocompatibility of Biodegradable Mg-1Zn-xSn Alloys" Crystals 12, no. 9: 1219. https://doi.org/10.3390/cryst12091219